Embed Size (px)
Citation preview
OFFICE OF REDESIGN: QUALITY TEACHING FOR ENGLISH LEARNERS (QTEL),
2008–2009
Austin Independent School District Department of Program Evaluation
November 2009 Publication Number 08.80
08.80 QTEL:Year Two Evaluation, 2008-2009
i
ABOUT THE DEPARTMENT OF PROGRAM EVALUATION
The Department of Program Evaluation (DPE) was established in 1972 to support program decision and strategic planning in Austin Independent School District (AISD). The department is housed in the Office of Accountability and is charged with evaluating federal, state, and locally funded programs in AISD. DPE staff integrate best and innovative evaluation practices with educational and institutional knowledge. DPE staff work with program staff throughout the district to design and conduct formative and summative program evaluations. DPE’s methods for evaluating programs vary depending on the research question, program design, and reporting requirements. The evaluations report objectively about program implementation and outcomes, and serve to inform program staff, decision makers, and planners in the district. DPE reports may be accessed online at http://www.austinisd.org/inside/accountability/evaluation/reports.phtml.
ABOUT THE AUTHOR
Ginger Gossman completed a Ph.D. in demography at the University of Texas at Austin in 2006. Her academic interests include maternal and child health, secondary education, infectious disease, and obesity research. She has presented her research findings at regional and national professional conferences and has been a member of the American Evaluation Association since 2007. Ginger joined the Program Evaluation team in September 2008.

08.80 QTEL:Year Two Evaluation, 2008-2009
ii
EXECUTIVE SUMMARY Over a 3-year period (2007–2010), the Austin Independent School District (AISD)
partnered with WestEd, based in San Francisco, California. This partnership used a program
called Quality Teaching for English Learners (QTEL) to apprentice participants in teaching
techniques reliant on scaffolding and student engagement. The objective of this partnership
was to improve teacher practice and improve student outcomes at two demonstration sites:
Lanier and International High Schools. Although the program targeted English language
learner (ELL) students, the teaching techniques benefited all students. A unique element of the
work with WestEd is the development of a sustained capacity to continue the implementation
of QTEL after the collaboration with WestEd has ended.
During the first 2 years of this collaboration, teachers and administrators at Lanier and
International participated in research-based, quality professional learning to develop a common
vision, language and skills to enact quality teaching for all students. Using a nested model of
professional development a subset of teachers participated in additional professional
development and coaching to support program implementation. A further subset comprised of
administrators and teachers, participated in sustained professional development focused on
developing a community of learners who can model practice for other educators.
The evaluation of program efforts during year 2 (2008–2009) focused on formative and
summative evaluation methods. The formative assessment focused on teacher professional
development attendance, teacher assessment of professional development sessions, and student
reflections about their experiences as ELLs. The summative assessment focused on teacher and
student outcomes. Teacher outcomes were summarized using self-report data. Teachers
reported how often they used program strategies in their classrooms. Student outcomes were
summarized using Texas Assessment of Knowledge and Skills (TAKS) and Texas English
Language Proficiency Assessment System (TELPAS) data. Student outcomes were examined
with trend data from the baseline year (2007) through year 2 (2009). Several key findings
emerged from this evaluation and are summarized here according to the structure of the report. FORMATIVE EVALUATION Program Participation
• Teachers from Lanier and International, across disciplines, attended professional development sessions. A greater percentage of teachers from English language arts (ELA) attended the professional development.

08.80 QTEL:Year Two Evaluation, 2008-2009
iii
• Not all teachers at the demonstration sites participated in the professional development, as was expected.
Program Satisfaction • Most teachers reported overall satisfaction with the program and would recommend the
program to another school district. • Most teachers reported a personal commitment to the program. However, most teachers
were not convinced the district was committed to the program. • Many teachers could not clearly identify their role in the program or their responsibility
to the program. • Most teachers reported implementation of teaching strategies taught in professional
development sessions and positive changes in student engagement since implementation.
• Teacher experiences with ELL students were similar at program and control sites, suggesting program effects were authentic and not an artifact of unique student or teacher populations at program sites.
• Students at program sites reported greater confidence in college preparedness and greater satisfaction with their educational experiences than did students at control sites.
SUMMATIVE EVALUATION Teacher Outcomes
• Teachers reported using program strategies and tasks, and believed the program was improving their practice and student engagement.
Student Outcomes • Lanier ELL students made greater gains than did non-ELLs with respect to the
percentage passing TAKS on several data points across time (from baseline to year 2): (a) 10th-grade ELA, (b) 10th-grade math, (c) social studies (all grades), and (d) 10th-grade science. In addition, gains in the average score for ELLs exceeded that of non-ELLs in several TAKS subjects: (a) 10th- and 11th-grade ELA, (b) 9th- and 10th-grade math, and (c) 10th-grade science.
• In ELA and math TAKS, Lanier ELL students exceeded the passing rates for the district in (a) 10th-grade ELA, (b) 10th-grade math, (c) 10th-grade social studies, and (d) 10th-grade science. The gains in average TAKS score for Lanier, compared with average TAKS scores for the district, varied by grade level, but not by subject. Lanier students made gains between baseline and year 1, but not from year 1 to year 2. The district continued to make gains across time.
08.80 QTEL:Year Two Evaluation, 2008-2009
iv
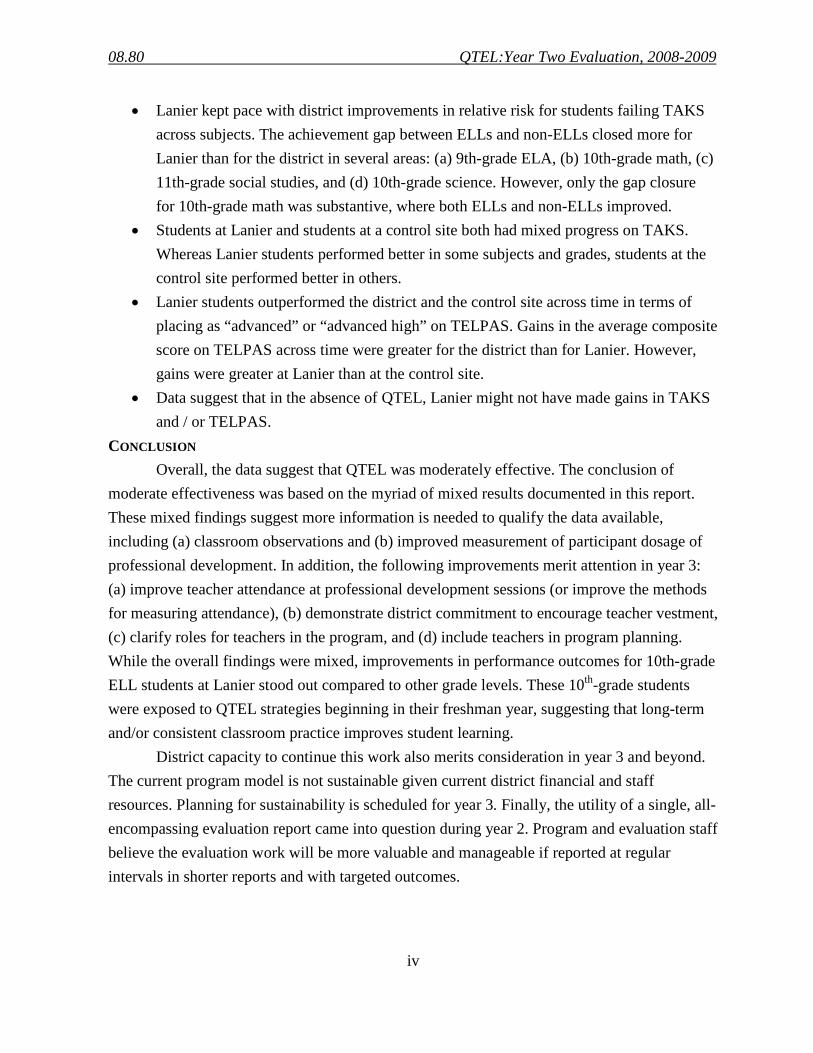
• Lanier kept pace with district improvements in relative risk for students failing TAKS across subjects. The achievement gap between ELLs and non-ELLs closed more for Lanier than for the district in several areas: (a) 9th-grade ELA, (b) 10th-grade math, (c) 11th-grade social studies, and (d) 10th-grade science. However, only the gap closure for 10th-grade math was substantive, where both ELLs and non-ELLs improved.
• Students at Lanier and students at a control site both had mixed progress on TAKS. Whereas Lanier students performed better in some subjects and grades, students at the control site performed better in others.
• Lanier students outperformed the district and the control site across time in terms of placing as “advanced” or “advanced high” on TELPAS. Gains in the average composite score on TELPAS across time were greater for the district than for Lanier. However, gains were greater at Lanier than at the control site.
• Data suggest that in the absence of QTEL, Lanier might not have made gains in TAKS and / or TELPAS.
CONCLUSION Overall, the data suggest that QTEL was moderately effective. The conclusion of
moderate effectiveness was based on the myriad of mixed results documented in this report. These mixed findings suggest more information is needed to qualify the data available, including (a) classroom observations and (b) improved measurement of participant dosage of professional development. In addition, the following improvements merit attention in year 3: (a) improve teacher attendance at professional development sessions (or improve the methods for measuring attendance), (b) demonstrate district commitment to encourage teacher vestment, (c) clarify roles for teachers in the program, and (d) include teachers in program planning. While the overall findings were mixed, improvements in performance outcomes for 10th-grade ELL students at Lanier stood out compared to other grade levels. These 10th-grade students were exposed to QTEL strategies beginning in their freshman year, suggesting that long-term and/or consistent classroom practice improves student learning.
District capacity to continue this work also merits consideration in year 3 and beyond. The current program model is not sustainable given current district financial and staff resources. Planning for sustainability is scheduled for year 3. Finally, the utility of a single, all-encompassing evaluation report came into question during year 2. Program and evaluation staff believe the evaluation work will be more valuable and manageable if reported at regular intervals in shorter reports and with targeted outcomes.
08.80 QTEL:Year Two Evaluation, 2008-2009
v
TABLE OF CONTENTS Executive Summary ..................................................................................................................... ii List of Figures .............................................................................................................................. v List of Tables .............................................................................................................................. vi Introduction. ................................................................................................................................. 1 Description of QTEL Program .................................................................................................... 2
Model for Professional Development ................................................................................................. 2 Leadership Development and Capacity Building ............................................................................... 4 Funding Sources .................................................................................................................................. 6 Methodology .............................................................................................................................................. 7 Evaluation Objective ........................................................................................................................... 7 Scope and Method ............................................................................................................................... 7 Data Collection ................................................................................................................................... 8 Data Analyses ..................................................................................................................................... 8 Structure of the Report ........................................................................................................................ 9 Summary of Results .................................................................................................................................. 9 Section I: Formative Evaluation.......................................................................................................... 9 Section II: Summative Evaluation .................................................................................................... 21 Conclusions and Recommendations ........................................................................................................ 32 Recommendations ............................................................................................................................. 33 Future Evaluation Work .................................................................................................................... 34 Appendices .............................................................................................................................................. 36 References ............................................................................................................................................... 52
LIST OF FIGURES Figure 1: Quality Teaching for English Learners Model for Whole School Improvement ....................... 3 Figure 2: Quality Teaching for English Learners’ (QTEL’s) Theory of Action ....................................... 4 Figure 3: Model of Professional Development used by the Quality Teaching for English Learners
(QTEL) Program. ................................................................................................................................ 5 Figure 4: Evaluation Methods and Accompanying Data Sources for QTEL ............................................ 8 Figure 5: Staff Participation in QTEL ..................................................................................................... 10 Figure 6: Self-reported Role in QTEL Program ...................................................................................... 10 Figure 7: Response to Item, "How Well Do You Understand…" ........................................................... 11 Figure 8: Comparison of "Rate" and "Recommendation" Items ............................................................. 12
08.80 QTEL:Year Two Evaluation, 2008-2009
vi
Figure 9: Change in Student Engagement Since Beginning QTEL Professional Development ............. 14 Figure 10: Composite Score for Overall Participant Satisfaction with QTEL Program.......................... 15 Figure 11: Times per Week Participants Designed a Scaffolded Lesson for a Typical Class (In the
Month of the Survey) ........................................................................................................................ 22 Figure 12: QTEL Tasks Implemented in Classes During Year 2 ............................................................ 23 Figure 13: Comparison of Proportion Passing TAKS by Subject, Grade-level, Year, Campus and LEP
Status ................................................................................................................................................. 25 Figure 14: Comparison of TAKS Means by Subject, Grade-level, Year, Campus and LEP Status ........ 29 Figure 15: Distribution of TELPAS Results, 2007-2009 ........................................................................ 30 Figure 16: Distribution of TELPAS Composite Score Means, 2007-2009 ............................................. 31 Appendix B: Limited English Proficient Decision Chart ........................................................................ 39 Figure 17: Process for Limiting TAKS Data to Appropriate Levels ....................................................... 43 Figure 18: Visual Representation of Relative Risk ................................................................................. 43 Figure 19: Process for Limiting TELPAS Data to Appropriate Levels ................................................... 46
LIST OF TABLES Table 1: Student Language Characteristics for the District, High Schools and Program Demonstration
Sites .............................................................................................................................................. 1 Table 2: Budget and Expenditures for WestEd, 2008-2009. ..................................................................... 6 Table 3: Participant Report of Commitment to QTEL ............................................................................ 12 Table 4: Participant Self-report of Additional QTEL PD Needed from WestEd .................................... 13 Table 5: TAKS Achievement Gap between LEP and non-LEP, by Subject, Grade-level, Year and
Campus: Baseline (2007) Compared to Year 2 (2009) ..................................................................... 26 Table 6: Student Demographic Characteristics, October 2008: QTEL Demonstration Sites and Control
Group ................................................................................................................................................ 37 Table 7: Category Assignment for Primary Job Title Codes ................................................................... 40 Table 8: Participant Selection of Components Where Additional Support was Needed: Sustaining
Academic Rigor ................................................................................................................................ 47 Table 9: Participant Selection of Components Where Additional Support was Needed: Holding High
Expectations ...................................................................................................................................... 47 Table 10: Participant Selection of Components Where Additional Support was Needed: Engaging in
Quality Interactions ........................................................................................................................... 48 Table 11: Participant Selection of Components Where Additional Support was Needed: Sustaining a
Language Focus ................................................................................................................................ 48

08.80 QTEL:Year Two Evaluation, 2008-2009
vii
Table 12: Relative Risk of Failing TAKS, LEP vs. Non-LEP, by Subject, Grade-level, Year and Campus: Baseline (2007) Compared to Year 2 (2009) ..................................................................... 49
Table 13: Significant Levels for Test of Proportion for Passing TAKS, Lanier Compared to Travis: By Subject, Grade-level and Year .......................................................................................................... 50
Table 14: Test of Means Results by Subject, Grade-level, Year, Campus and LEP Status .................... 51


08.80 QTEL: Year Two Evaluation, 2008-2009
1
INTRODUCTION Austin Independent School District (AISD) is committed to system-wide reform to
ensure continuous improvement for students, while closing performance gaps between subgroups. The AISD English Language Learner (ELL) student population has been steadily increasing over the past 20 years. On the last Friday in October 2008, 83,483 students were enrolled in AISD (grades EE through 12). Of those students, 24,257 (29%) were identified as ELLs. A large majority of district ELLs were Hispanic and spoke Spanish at home. A complete summary of demographic characteristics for this district is included in Appendix A.
The difference in academic outcomes between ELLs and their native-English-speaking peers is striking, particularly with respect to standardized test scores and graduation rates. In a concerted effort to close these gaps, AISD entered into a partnership with renowned ELL
scholar Dr. Aída Walqui and her team of experts at WestEd to increase high-quality instruction for ELLs at Lanier and International High Schools. These schools serve a high percentage of limited English proficient (LEP) students (Table 1).1
1 For the purposes of this report, the terms ELL and LEP are used interchangeably. ELL is preferred over LEP because LEP is a deficient designation. LEP is an academic designation defined by the Texas Education Agency (TEA) that refers to a student’s ability to speak and read English. For more information about how students are assigned a LEP status, please see Appendix B.
This partnership began in 2007, and work over the past 2 years has included (a) professional development for all teachers, (b) instructional support for core departments, (c) focused instructional support in mathematics, and (d) the development of a leadership group of teachers
and administrators trained to carry on this work as professional developers through an apprenticeship process. A unique element of the work with WestEd is the development of a
Table 1. Student Language Characteristics for the District,
High Schools, and Demonstration Sites, 2008–2009
District High
schools Lanier Inter-national
Limited English Proficient (LEP) status
Not LEP 69.5% 85.7% 61.6% 6.0%
Current LEP 29.1% 13.5% 33.7% 94.0%
1st year exited 1.3% 0.6% 4.1% …
2nd year exited 0.2% 0.2% 0.6% …
ESL services indicator
No services 90.3% 87.4% 67.1% 6.0%
Receiving services 9.3% 12.6% 32.9% 94.0%
Home language
Spanish 35.7% 28.5% 65.5% 79.3%
English 61.0% 68.2% 31.8% …
Other 3.3% 3.3% 2.7% 20.7%
Source. Public Education Information Management System data tables 110 and 101
08.80 QTEL: Year Two Evaluation, 2008-2009
2
sustained capacity to continue the implementation of Quality Teaching for English Learners (QTEL) after the collaboration with WestEd has ended.
This report is an evaluation of year 2 of the ELL program, QTEL, provided by WestEd. QTEL is a teacher professional development program based on an apprenticeship model of learning and teaching. This evaluation includes a description of the program, teacher reflection on the program (including survey and focus group results), and results from analyses of student outcomes.
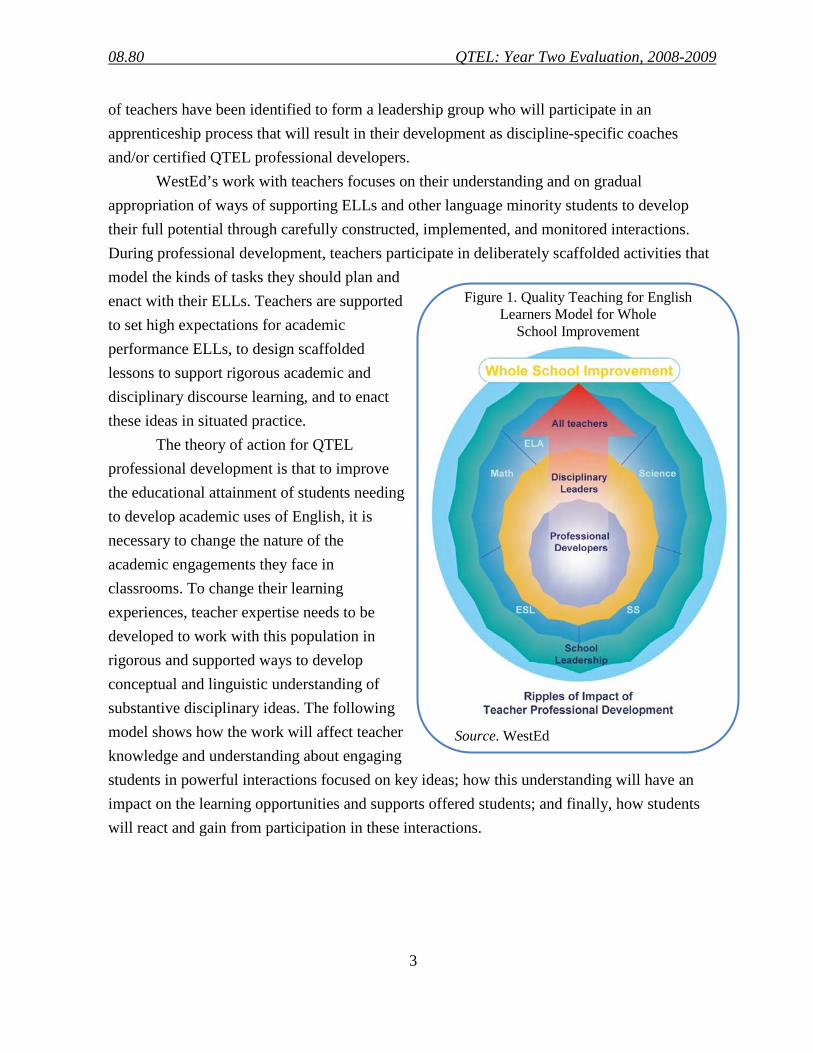
DESCRIPTION OF THE QTEL PROGRAM Successful school reform has been an elusive goal for many schools and school
districts. Substantive, sustainable educational change requires new conceptualizations of the work, skills, behaviors, and beliefs needed to carry that change to fruition among all stakeholders within an educational community—teachers, site and district administrators, and community members (Fullan, 2007). For these reasons, in 2007, the WestEd QTEL professional development program, developed by Dr. Aída Walqui, was selected by AISD after an extensive examination of programs across the nation. WestEd was selected to work with two pilot high schools for 3 years. This provider was selected because QTEL focuses on the retooling of schools and district teachers, teacher leaders, and administrators, and features a model with an integral capacity for building and sustainability. This program has been implemented successfully in other school districts, including New York City, San Diego, and San Jose. MODEL FOR PROFESSIONAL DEVELOPMENT QTEL is designed to provide system-wide professional development and coaching to develop a common vision, language, and skills, and to help teachers enact quality teaching in every discipline and to offer high-caliber instruction for secondary students who are learning English as a second language (ESL). Building systemic support for ELLs requires multilevel professional development. Over the past 2 years of the QTEL/AISD collaboration, continuous professional development was offered to all educators at Lanier and International. In this “nested” model, teachers, teacher leaders, and administrators have different levels of engagement, varying from 8 to 20 days a year of professional development. At times, the professional development is discipline specific, and at other times inter-disciplinary groups work on common vision and skills to develop coherence in the instructional program. A subset
WestEd follows the philosophy that substantive, sustainable educational change requires new conceptual-izations of the work, skills, behaviors, and beliefs needed to carry that change to fruition among all stakeholders within an educational community – teachers, site and district administrators, and community members.
08.80 QTEL: Year Two Evaluation, 2008-2009
3
Figure 1. Quality Teaching for English Learners Model for Whole
School Improvement
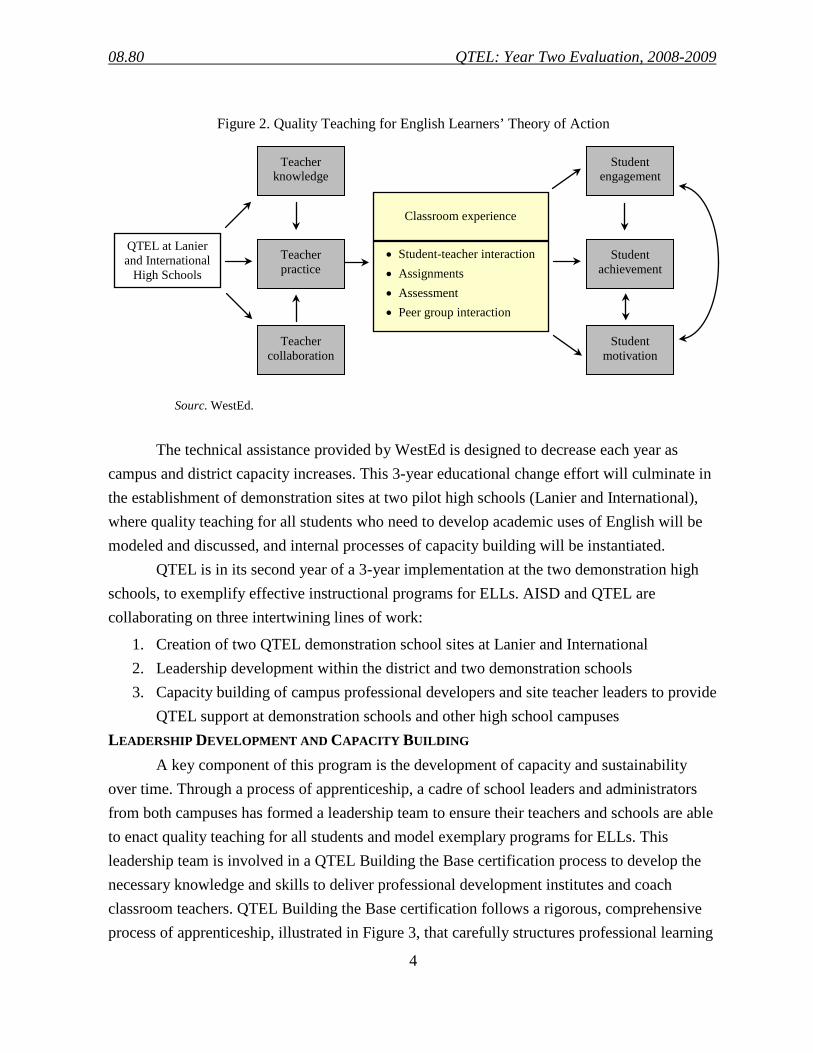
of teachers have been identified to form a leadership group who will participate in an apprenticeship process that will result in their development as discipline-specific coaches and/or certified QTEL professional developers. WestEd’s work with teachers focuses on their understanding and on gradual appropriation of ways of supporting ELLs and other language minority students to develop their full potential through carefully constructed, implemented, and monitored interactions. During professional development, teachers participate in deliberately scaffolded activities that model the kinds of tasks they should plan and enact with their ELLs. Teachers are supported to set high expectations for academic performance ELLs, to design scaffolded lessons to support rigorous academic and disciplinary discourse learning, and to enact these ideas in situated practice. The theory of action for QTEL professional development is that to improve the educational attainment of students needing to develop academic uses of English, it is necessary to change the nature of the academic engagements they face in classrooms. To change their learning experiences, teacher expertise needs to be developed to work with this population in rigorous and supported ways to develop conceptual and linguistic understanding of substantive disciplinary ideas. The following model shows how the work will affect teacher knowledge and understanding about engaging students in powerful interactions focused on key ideas; how this understanding will have an impact on the learning opportunities and supports offered students; and finally, how students will react and gain from participation in these interactions.
Source. WestEd
08.80 QTEL: Year Two Evaluation, 2008-2009
4
The technical assistance provided by WestEd is designed to decrease each year as campus and district capacity increases. This 3-year educational change effort will culminate in the establishment of demonstration sites at two pilot high schools (Lanier and International), where quality teaching for all students who need to develop academic uses of English will be modeled and discussed, and internal processes of capacity building will be instantiated.
QTEL is in its second year of a 3-year implementation at the two demonstration high schools, to exemplify effective instructional programs for ELLs. AISD and QTEL are collaborating on three intertwining lines of work:
1. Creation of two QTEL demonstration school sites at Lanier and International 2. Leadership development within the district and two demonstration schools 3. Capacity building of campus professional developers and site teacher leaders to provide
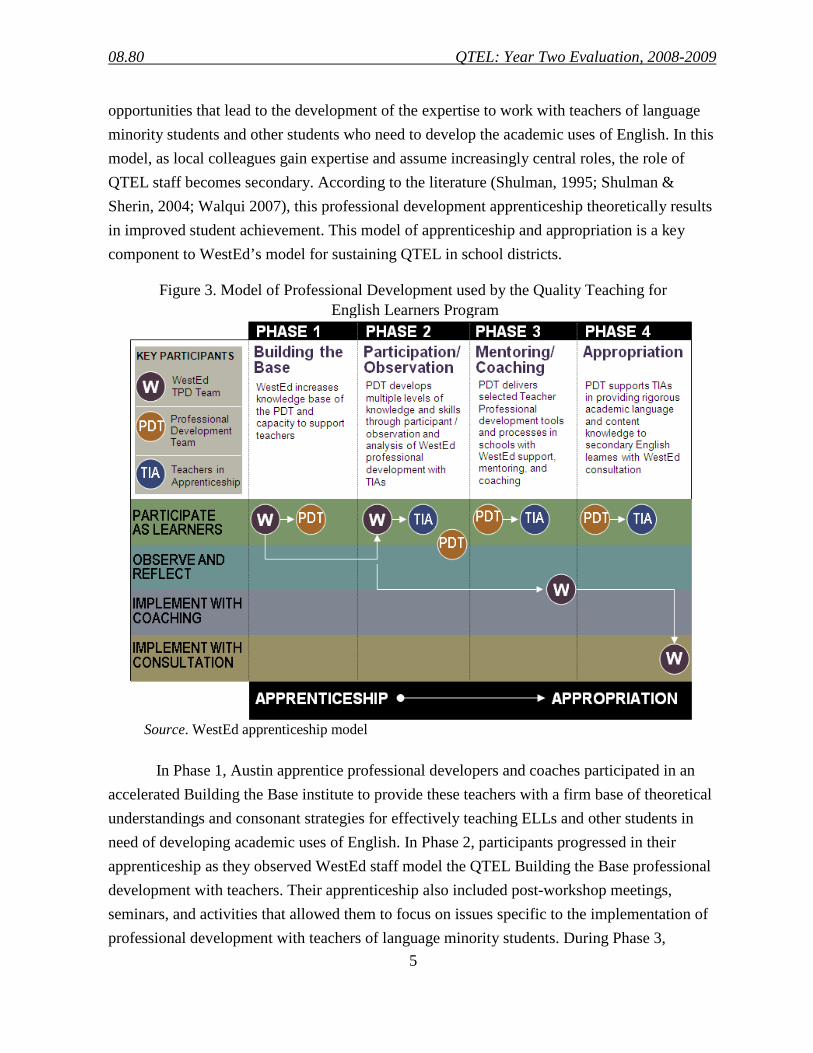
QTEL support at demonstration schools and other high school campuses LEADERSHIP DEVELOPMENT AND CAPACITY BUILDING A key component of this program is the development of capacity and sustainability over time. Through a process of apprenticeship, a cadre of school leaders and administrators from both campuses has formed a leadership team to ensure their teachers and schools are able to enact quality teaching for all students and model exemplary programs for ELLs. This leadership team is involved in a QTEL Building the Base certification process to develop the necessary knowledge and skills to deliver professional development institutes and coach classroom teachers. QTEL Building the Base certification follows a rigorous, comprehensive process of apprenticeship, illustrated in Figure 3, that carefully structures professional learning
QTEL at Lanier and International
High Schools
Classroom experience
• Student-teacher interaction • Assignments • Assessment • Peer group interaction
Teacher knowledge
Teacher practice
Teacher collaboration
Student engagement
Student achievement
Student motivation
Sourc. WestEd.
Figure 2. Quality Teaching for English Learners’ Theory of Action
08.80 QTEL: Year Two Evaluation, 2008-2009
5
opportunities that lead to the development of the expertise to work with teachers of language minority students and other students who need to develop the academic uses of English. In this model, as local colleagues gain expertise and assume increasingly central roles, the role of QTEL staff becomes secondary. According to the literature (Shulman, 1995; Shulman & Sherin, 2004; Walqui 2007), this professional development apprenticeship theoretically results in improved student achievement. This model of apprenticeship and appropriation is a key component to WestEd’s model for sustaining QTEL in school districts.
Figure 3. Model of Professional Development used by the Quality Teaching for English Learners Program
Source. WestEd apprenticeship model
In Phase 1, Austin apprentice professional developers and coaches participated in an accelerated Building the Base institute to provide these teachers with a firm base of theoretical understandings and consonant strategies for effectively teaching ELLs and other students in need of developing academic uses of English. In Phase 2, participants progressed in their apprenticeship as they observed WestEd staff model the QTEL Building the Base professional development with teachers. Their apprenticeship also included post-workshop meetings, seminars, and activities that allowed them to focus on issues specific to the implementation of professional development with teachers of language minority students. During Phase 3,
08.80 QTEL: Year Two Evaluation, 2008-2009
6
WestEd will coach candidates while they deliver a 5-day QTEL Building the Base institute for Austin teachers; candidates will be those who have shown evidence through passing a written
exercise (similar to the National Board certification process) that they have synthesized learnings about QTEL tools and processes and are ready to provide professional development to teachers. During Phase 4, the successful candidates will design and provide original professional learning opportunities for teachers. As the AISD professional developers progress through their apprenticeship, appropriating knowledge and skills, the role of WestEd will steadily diminish, until they serve as consultants rather than as primary professional development providers.
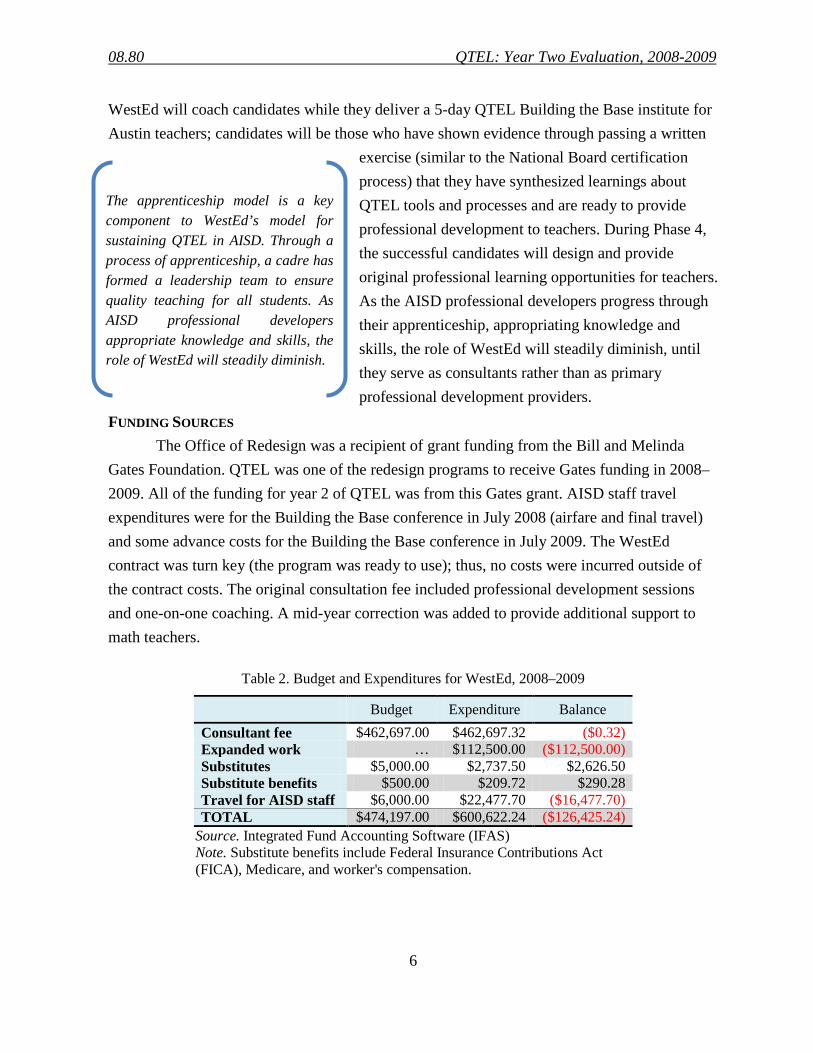
FUNDING SOURCES The Office of Redesign was a recipient of grant funding from the Bill and Melinda
Gates Foundation. QTEL was one of the redesign programs to receive Gates funding in 2008–2009. All of the funding for year 2 of QTEL was from this Gates grant. AISD staff travel expenditures were for the Building the Base conference in July 2008 (airfare and final travel) and some advance costs for the Building the Base conference in July 2009. The WestEd contract was turn key (the program was ready to use); thus, no costs were incurred outside of the contract costs. The original consultation fee included professional development sessions and one-on-one coaching. A mid-year correction was added to provide additional support to math teachers.
Table 2. Budget and Expenditures for WestEd, 2008–2009
Budget Expenditure Balance Consultant fee $462,697.00 $462,697.32 ($0.32) Expanded work … $112,500.00 ($112,500.00) Substitutes $5,000.00 $2,737.50 $2,626.50 Substitute benefits $500.00 $209.72 $290.28 Travel for AISD staff $6,000.00 $22,477.70 ($16,477.70) TOTAL $474,197.00 $600,622.24 ($126,425.24)
Source. Integrated Fund Accounting Software (IFAS) Note. Substitute benefits include Federal Insurance Contributions Act (FICA), Medicare, and worker's compensation.
The apprenticeship model is a key component to WestEd’s model for sustaining QTEL in AISD. Through a process of apprenticeship, a cadre has formed a leadership team to ensure quality teaching for all students. As AISD professional developers appropriate knowledge and skills, the role of WestEd will steadily diminish.

08.80 QTEL: Year Two Evaluation, 2008-2009
7
METHODOLOGY
EVALUATION OBJECTIVE During year 2, the Department of Program Evaluation (DPE) staff provided information
for decision makers about program participation and outcomes to facilitate decisions about program implementation and improvement. Formative assessment was conducted to improve program and implementation. Summative evaluation provided information about program efficacy across time, using a comparison of baseline to current data.
SCOPE AND METHOD The formative evaluation of QTEL included data from the participant survey and data
compiled from focus groups (teachers and students). The summative evaluation included student outcome data (Figure 4). The following questions guided the evaluation of the district’s QTEL training in year 2:
Formative Questions
Program Participation • Did the intended target group (all teachers at the demonstration sites, Lanier and
International high schools) participate in QTEL professional development?
Program Satisfaction • Were teachers vested in QTEL professional development? • What were teacher perceptions of their professional development?
o Were teacher experiences with ELL students different at demonstration sites compared to control sites (Travis and Crockett high schools)?
• Did ELL students’ experiences reflect program objectives? o Were ELL student experiences different at demonstration sites compared to
trends at a control sites (Travis and Crockett high schools)? Summative Questions
Teacher Outcomes • Did teachers practice what they learned in professional development?
• Have student outcomes on Texas Assessment of Knowledge and Skills (TAKS) improved since the implementation of QTEL at Lanier high school?
Student Outcomes
o Did LEP outcomes change compared to non-LEPs? o How did LEP outcome changes compare to district trends?
08.80 QTEL: Year Two Evaluation, 2008-2009
8
o How did LEP outcomes changes compare to a comparable control site (Travis)?
• Have student outcomes on the Texas English Language Proficiency Assessment System (TELPAS) improved since the implementation of QTEL at the demonstration schools? o How did outcome changes compare to district trends? o How did outcome changes compare to a comparable control site (Travis)?
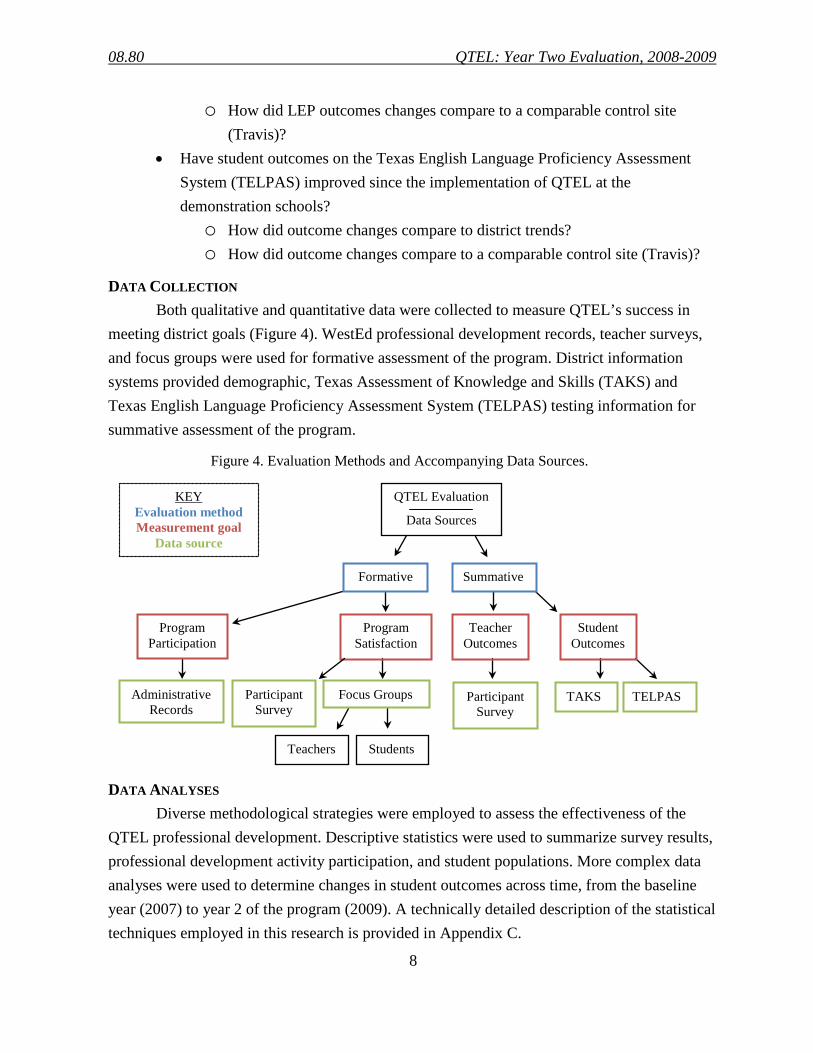
DATA COLLECTION Both qualitative and quantitative data were collected to measure QTEL’s success in
meeting district goals (Figure 4). WestEd professional development records, teacher surveys, and focus groups were used for formative assessment of the program. District information systems provided demographic, Texas Assessment of Knowledge and Skills (TAKS) and Texas English Language Proficiency Assessment System (TELPAS) testing information for summative assessment of the program.
DATA ANALYSES Diverse methodological strategies were employed to assess the effectiveness of the
QTEL professional development. Descriptive statistics were used to summarize survey results, professional development activity participation, and student populations. More complex data analyses were used to determine changes in student outcomes across time, from the baseline year (2007) to year 2 of the program (2009). A technically detailed description of the statistical techniques employed in this research is provided in Appendix C.
Figure 4. Evaluation Methods and Accompanying Data Sources.
QTEL Evaluation
Data Sources
Summative Formative
Teacher Outcomes
Student Outcomes
Program Satisfaction
Program Participation
TAKS TELPAS
Students Teachers
Participant Survey
Administrative Records
Focus Groups
KEY Evaluation method Measurement goal
Data source
Participant Survey
08.80 QTEL: Year Two Evaluation, 2008-2009
9
STRUCTURE OF THE REPORT The report is organized into two major sections summarizing results by evaluation
questions, followed by discussion and recommendations. Findings from the formative assessment of QTEL are in the first section, including program participation and program satisfaction. This section includes teacher professional development attendance, teacher assessment of the professional development sessions and student reflections on their experiences as ELLs. Summative assessment is reported in the second section, including teacher use of program strategies and student performance indicators. The following discussion section highlights the evaluation findings and implications for the district. Each section is summarized in a grey call-out box with a blue border. These boxes appear at the end of each section. Conclusions are identified throughout the report and are briefly summarized in the final section, along with recommendations.
SUMMARY OF RESULTS SECTION 1: FORMATIVE EVALUATION
This section contains results from the formative assessment of QTEL. It includes teacher professional development attendance, teacher assessment of the professional development sessions and student reflections on their experiences as ELLs.
Program Participation
Did the intended target group (teachers at Lanier and International high schools) participate in QTEL professional development?
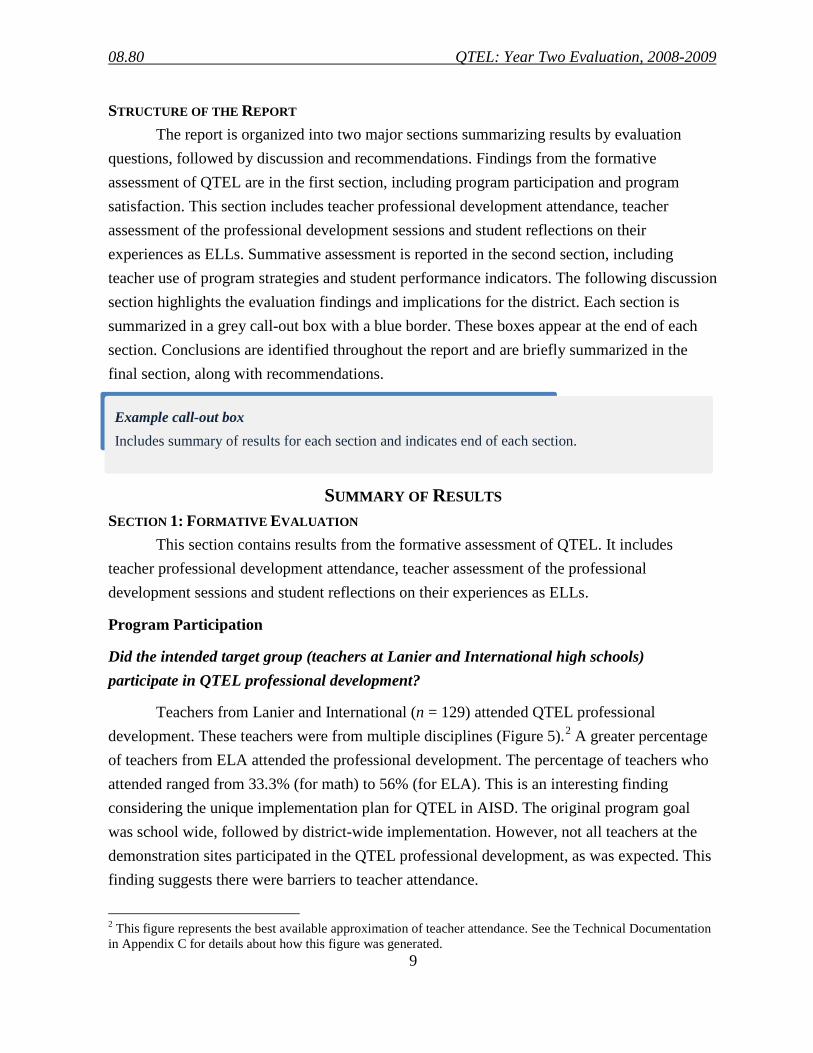
Teachers from Lanier and International (n = 129) attended QTEL professional development. These teachers were from multiple disciplines (Figure 5).2
2 This figure represents the best available approximation of teacher attendance. See the Technical Documentation in Appendix C for details about how this figure was generated.
A greater percentage of teachers from ELA attended the professional development. The percentage of teachers who attended ranged from 33.3% (for math) to 56% (for ELA). This is an interesting finding considering the unique implementation plan for QTEL in AISD. The original program goal was school wide, followed by district-wide implementation. However, not all teachers at the demonstration sites participated in the QTEL professional development, as was expected. This finding suggests there were barriers to teacher attendance.
Example call-out box Includes summary of results for each section and indicates end of each section.
08.80 QTEL: Year Two Evaluation, 2008-2009
10
Professional developer,
7.4%Disciplinary leader, 3.2%
Classroom teacher, 43.6%
I don’t know, 33.0%
Other, 12.8%
Source: WestEd administrative attendance records, 2007-2009 and AISD human resources records.
Source. QTEL Participant Survey, 2009
Program Satisfaction
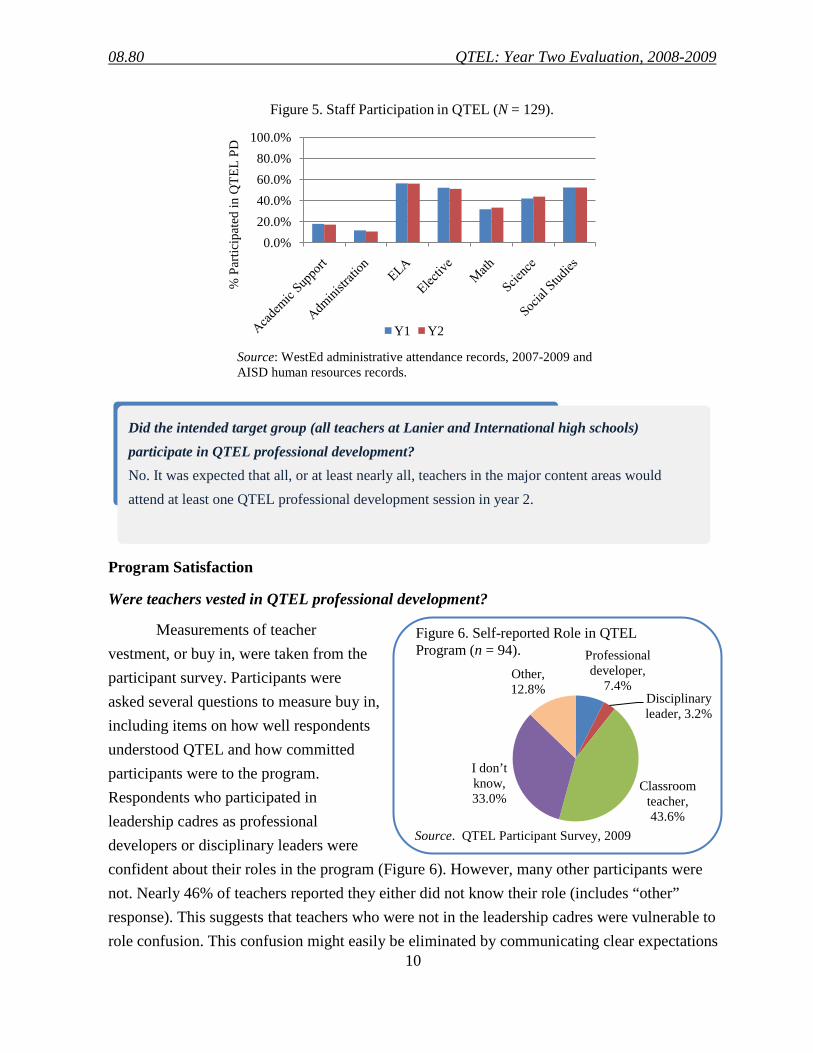
Were teachers vested in QTEL professional development?
Measurements of teacher vestment, or buy in, were taken from the participant survey. Participants were asked several questions to measure buy in, including items on how well respondents understood QTEL and how committed participants were to the program. Respondents who participated in leadership cadres as professional developers or disciplinary leaders were confident about their roles in the program (Figure 6). However, many other participants were not. Nearly 46% of teachers reported they either did not know their role (includes “other” response). This suggests that teachers who were not in the leadership cadres were vulnerable to role confusion. This confusion might easily be eliminated by communicating clear expectations
0.0%20.0%40.0%60.0%80.0%
100.0%
% P
artic
ipat
ed in
QTE
L PD
Figure 5. Staff Participation in QTEL (N = 129).
Y1 Y2
Did the intended target group (all teachers at Lanier and International high schools) participate in QTEL professional development? No. It was expected that all, or at least nearly all, teachers in the major content areas would attend at least one QTEL professional development session in year 2.
Figure 6. Self-reported Role in QTEL Program (n = 94).

08.80 QTEL: Year Two Evaluation, 2008-2009
11
Source. QTEL Participant Survey, 2009 Note. The darker colors represent greater understanding.
and role responsibilities to all participants. It was expected that by year 2 all participants would understand their role in QTEL. However, this result is an improvement from year 1, when more than 82% of participants reported ambiguity about their roles. This question emerged from focus group discussions in year 1 and year 2.
Participants also were asked about their understanding of specific components of the program (Figure 7). Respondents seemed equally unsure about the roles of professional developers and disciplinary leaders in the program. Respondents may have been unsure how to define these categories, and thus unsure about the roles persons in these categories would play. These results echo findings from the 2007–2008 participant survey. No improvements in participant understanding about QTEL overall occurred in year 2, compared with participant understanding in year 1. This lack of understanding may impede teacher buy in.
Indeed, a statistically significant correlation was found between personal commitment to the program and understanding about program implementation for year 3. The less a respondent understood the program, the higher the probability he or she would report a lack of commitment to QTEL (p < .05). Conversely, the better a respondent understood the program, the higher the probability he or she would report commitment to QTEL. Table 3 presents the level of commitment respondents reported for QTEL. The majority of participants reported campus and personal commitment. However, a large percentage of respondents did not believe the district was committed to QTEL.
0%20%40%60%80%
100%
(n=94) (n=93) (n=95)
plans for QTEL next year? the role of professional developers next year?
the role of disciplinary leaders next year?
Perc
enta
ge o
f Res
pond
ents
Figure 7. Responses to Item "How Well Do You Understand…"
I do not understand / I am not sure
I understand the "big picture," but not the details
I think I understand "big picture" and details / I understand
08.80 QTEL: Year Two Evaluation, 2008-2009
12
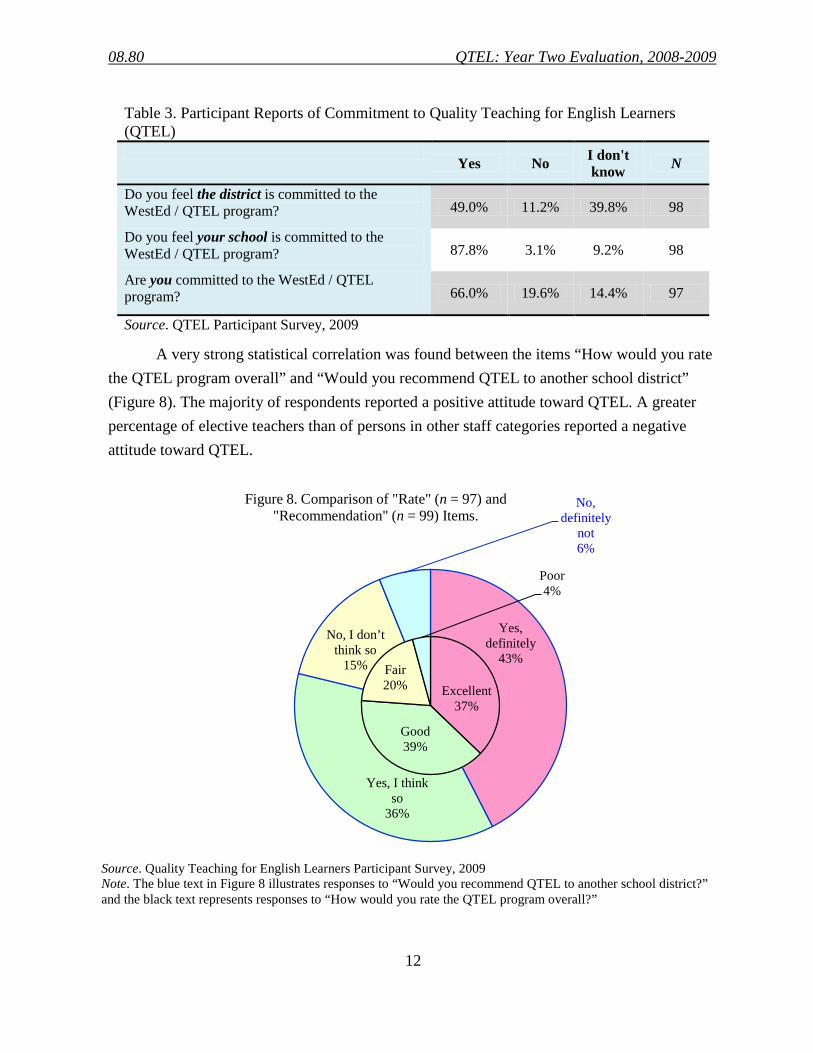
A very strong statistical correlation was found between the items “How would you rate the QTEL program overall” and “Would you recommend QTEL to another school district” (Figure 8). The majority of respondents reported a positive attitude toward QTEL. A greater percentage of elective teachers than of persons in other staff categories reported a negative attitude toward QTEL.
Table 3. Participant Reports of Commitment to Quality Teaching for English Learners (QTEL)
Yes No I don't
know N
Do you feel the district is committed to the WestEd / QTEL program? 49.0% 11.2% 39.8% 98
Do you feel your school is committed to the WestEd / QTEL program? 87.8% 3.1% 9.2% 98
Are you committed to the WestEd / QTEL program? 66.0% 19.6% 14.4% 97
Source. QTEL Participant Survey, 2009
Yes, definitely
43%
Yes, I think so
36%
No, I don’t think so
15%
No, definitely
not6%
Excellent37%
Good39%
Fair20%
Poor4%
Figure 8. Comparison of "Rate" (n = 97) and "Recommendation" (n = 99) Items.
Source. Quality Teaching for English Learners Participant Survey, 2009 Note. The blue text in Figure 8 illustrates responses to “Would you recommend QTEL to another school district?” and the black text represents responses to “How would you rate the QTEL program overall?”
08.80 QTEL: Year Two Evaluation, 2008-2009
13
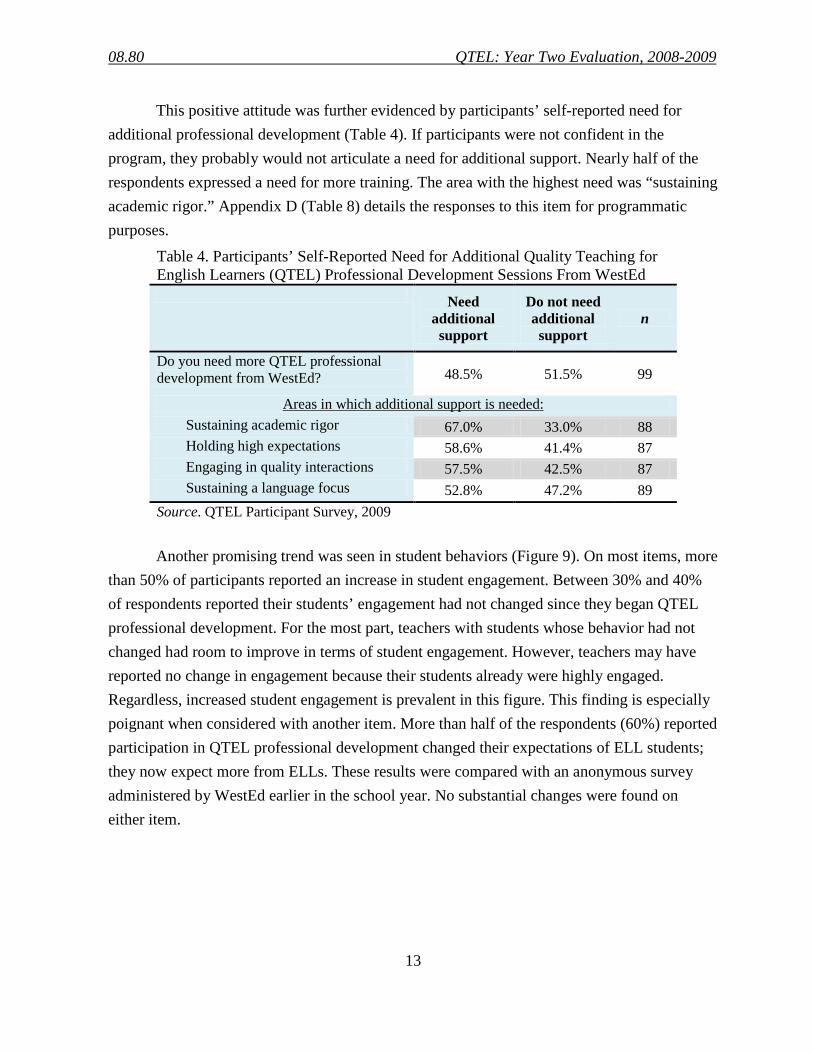
This positive attitude was further evidenced by participants’ self-reported need for additional professional development (Table 4). If participants were not confident in the program, they probably would not articulate a need for additional support. Nearly half of the respondents expressed a need for more training. The area with the highest need was “sustaining academic rigor.” Appendix D (Table 8) details the responses to this item for programmatic purposes.
Table 4. Participants’ Self-Reported Need for Additional Quality Teaching for English Learners (QTEL) Professional Development Sessions From WestEd
Need additional support
Do not need additional support
n
Do you need more QTEL professional development from WestEd? 48.5% 51.5% 99
Areas in which additional support is needed: Sustaining academic rigor 67.0% 33.0% 88 Holding high expectations 58.6% 41.4% 87 Engaging in quality interactions 57.5% 42.5% 87 Sustaining a language focus 52.8% 47.2% 89
Source. QTEL Participant Survey, 2009
Another promising trend was seen in student behaviors (Figure 9). On most items, more than 50% of participants reported an increase in student engagement. Between 30% and 40% of respondents reported their students’ engagement had not changed since they began QTEL professional development. For the most part, teachers with students whose behavior had not changed had room to improve in terms of student engagement. However, teachers may have reported no change in engagement because their students already were highly engaged. Regardless, increased student engagement is prevalent in this figure. This finding is especially poignant when considered with another item. More than half of the respondents (60%) reported participation in QTEL professional development changed their expectations of ELL students; they now expect more from ELLs. These results were compared with an anonymous survey administered by WestEd earlier in the school year. No substantial changes were found on either item.

08.80 QTEL: Year Two Evaluation, 2008-2009
14
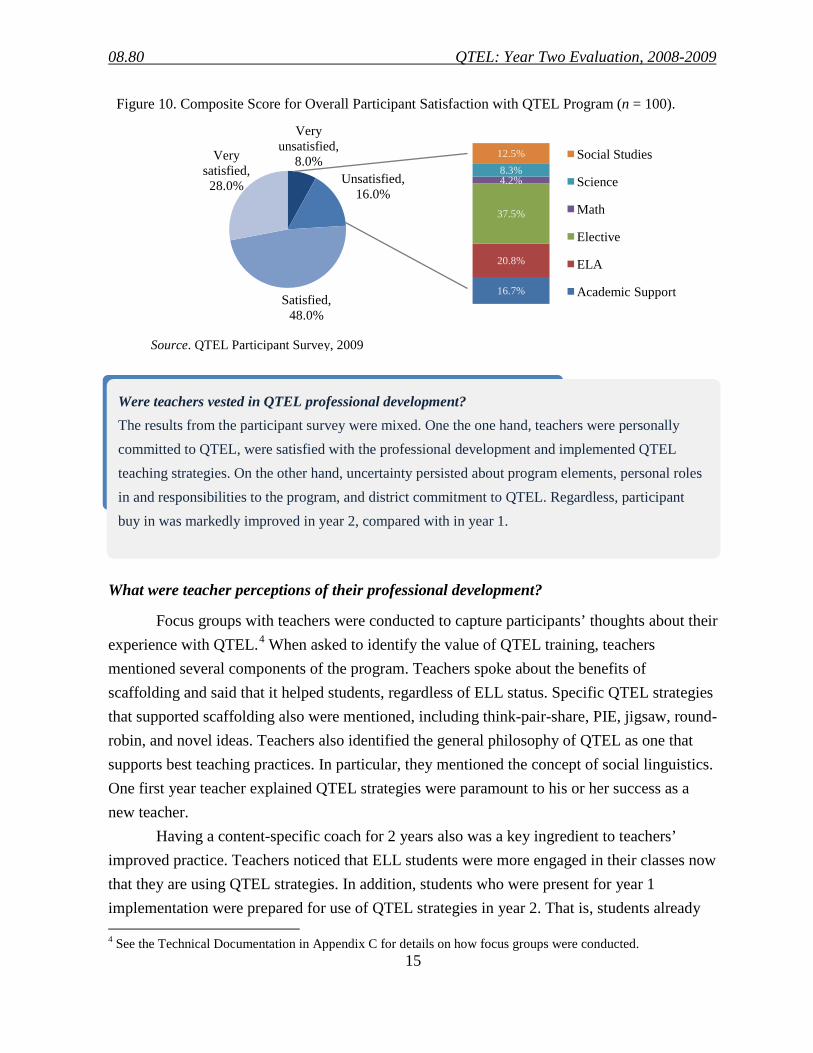
A composite score was generated to measure overall program satisfaction. The majority of participants (76%) were satisfied with the program. In addition, 84% of respondents reported participation in QTEL improved their teaching practice. Also, 43% reported QTEL improved their course content knowledge. A greater percentage of elective teachers than of teachers in any other content area were dissatisfied with the program (Figure 10).3
Overall, these findings demonstrate marked improvement in participant buy in, compared with buy in during year 1. Participants in year 1 evaluation activities argued vestment was tenuous because of the district’s history of frequently adopting and discarding new programs and external consultants (Gossman, 2008). That QTEL and WestEd maintained their partnership with AISD into a second year probably bolstered participant buy in. Another likely component to improved satisfaction was having a full-time program manager (housed in the Office of Redesign) to coordinate activities and manage communication, a resource that was lacking in year 1.
However, some teachers in the major content areas were dissatisfied with the program, too.
3 See the Technical Documentation in Appendix C for details on how this composite score was generated.
0%
20%
40%
60%
80%
100%St
uden
t will
ingn
ess
to
resp
ond
in c
lass
Stud
ents
wor
k in
divi
dual
ly
on a
task
Stud
ents
giv
e on
e w
ord
resp
onse
s
Stud
ents
con
stru
ct
expl
anat
ions
and
ar
gum
ents
, sup
porte
d …St
uden
ts m
ake
expl
icit
conn
ectio
ns b
etw
een
conc
epts
.
Stud
ents
ask
ing
high
er
orde
r que
stio
ns
Stud
ents
com
bine
fact
s an
d id
eas t
o sy
nthe
size
, ev
alua
te, g
ener
aliz
e
Stud
ents
wor
k in
pai
rs o
r gr
oups
of f
our
Stud
ents
use
dis
cipl
inar
y la
ngua
ge
Perc
enta
ge o
f Res
pond
ents
Figure 9. Change in Student Engagement since beginning QTEL Professional Development (n = 91).
Increased
Stayed the same
Decreased
Source. QTEL Participant Survey, 2009 Note. Desired outcomes for most items are indicated in green. On the items “Students work individually on a task” and Students give one word responses,” the ideal outcome is indicated in blue.
08.80 QTEL: Year Two Evaluation, 2008-2009
15
What were teacher perceptions of their professional development?
Focus groups with teachers were conducted to capture participants’ thoughts about their experience with QTEL.4
Having a content-specific coach for 2 years also was a key ingredient to teachers’ improved practice. Teachers noticed that ELL students were more engaged in their classes now that they are using QTEL strategies. In addition, students who were present for year 1 implementation were prepared for use of QTEL strategies in year 2. That is, students already
When asked to identify the value of QTEL training, teachers mentioned several components of the program. Teachers spoke about the benefits of scaffolding and said that it helped students, regardless of ELL status. Specific QTEL strategies that supported scaffolding also were mentioned, including think-pair-share, PIE, jigsaw, round-robin, and novel ideas. Teachers also identified the general philosophy of QTEL as one that supports best teaching practices. In particular, they mentioned the concept of social linguistics. One first year teacher explained QTEL strategies were paramount to his or her success as a new teacher.
4 See the Technical Documentation in Appendix C for details on how focus groups were conducted.
16.7%
20.8%
37.5%
4.2%8.3%
12.5% Social Studies
Science
Math
Elective
ELA
Academic Support
Very unsatisfied,
8.0%Unsatisfied,
16.0%
Satisfied, 48.0%
Very satisfied, 28.0%
Were teachers vested in QTEL professional development? The results from the participant survey were mixed. One the one hand, teachers were personally committed to QTEL, were satisfied with the professional development and implemented QTEL teaching strategies. On the other hand, uncertainty persisted about program elements, personal roles in and responsibilities to the program, and district commitment to QTEL. Regardless, participant buy in was markedly improved in year 2, compared with in year 1.
Figure 10. Composite Score for Overall Participant Satisfaction with QTEL Program (n = 100).
Source. QTEL Participant Survey, 2009

08.80 QTEL: Year Two Evaluation, 2008-2009
16
knew the “routines” for different strategies or exercises and knew how to execute a think-pair-share, for example, without having to be told.
Teachers also discussed a distinct positive shift in participant attitude toward QTEL in year 2. Teachers observed a clear investment in the professional development and demonstrated buy in from their colleagues to the program during year 2. Teachers explained this shift was due largely to a change in QTEL practice. The program and professional development became more flexible and adapted to school and teacher needs, better compared with how they were in year 1.
Participants also were asked to discuss gaps in resources or unmet need. Several teachers concurred that preparation to use QTEL strategies was very time consuming. One recommendation was to include QTEL strategies in common planning time. Participants also agreed that QTEL strategies were suited for those students already learning English. These strategies were not suited for students who were just beginning to learn English and had no English acquisition. Unfortunately, many ELL students fell into the latter category. Teachers also needed support to help students who not only did not have English language acquisition but had no education, as well.
Teachers reported difficulty with executing group work. They expressed a need for a rubric on how to grade group work and for additional strategies for keeping students on task while in groups. Several expressed a need for help with classroom management. Teachers felt that some of the QTEL trainers lacked classroom experience and could not provide effective strategies for classroom management. Some teachers were concerned buy-in was limited by classroom management issues. Teachers felt they had no recourse for managing students because school leadership did not hold students accountable for unacceptable behavior. Teachers with large classes found implementing QTEL strategies difficult. QTEL tasks were reported as better suited for smaller class sizes. Teachers of electives reported minimal use of QTEL strategies because they did not fit their content.
Teachers at both sites reported they did not understand what was expected of them in regard to QTEL. They expressed uncertainty about their role and the roles of colleagues in school- and district-wide implementation of QTEL. Some of this uncertainty stemmed from mixed messages from QTEL, their school leadership, and the district. Teachers reported
“Dr. Walquí has been very explicit on [students] having a particular literacy in home language and the success of [QTEL] strategies. When [students] haven’t had an education prior to getting to this country…there are going to be problems. But these strategies still work well with these kids…because they do help progress a student cognitively in addition to linguistically.”
08.80 QTEL: Year Two Evaluation, 2008-2009
17
receiving different messages about expectations from these three sources. Confusion about the role of “professional developers” was noted in particular. Participants felt new teachers were not brought up to speed on QTEL strategies during year-2 implementation. Teachers felt their time was not fully valued in that they were not always given advance notice of QTEL trainings. In some cases, teachers were pulled from their classes on the day of training. Teachers wanted to be
included in decisions about the timing of professional development and given as much advance notice as possible.
Focus groups also informed whether teacher experience with ELL students differed between QTEL and non-QTEL campuses. No discernable differences were found between QTEL schools and control schools on the items asked at both schools. Teachers were asked several questions to prompt a description of their ELL student population. Participants reported ELL students as varied in English acquisition, educational level, content mastery, and residency (years in the U.S.). Recent immigrants who had an educational background or who mastered their native language were described as advanced, high-performing, and motivated students. Students who entered with content knowledge and mastery of their native language need a bridge between content in their native language and content in English to reinforce their knowledge in their native language and to teach them the same concept in English. Students who did not have an age-appropriate mastery of their native language in reading or writing were described as low performing.5
Several themes arose when teachers were asked to describe unmet needs of ELL students. ELA teachers reported a frustration with their content as it related to ELLs. They explained that most people (e.g., students and parents) assumed a student would learn English in an ELA class. However, these courses were not designed for language acquisition.
Students who had neither content knowledge nor a mastery of their native language were falling through the cracks because teachers reported not knowing how to reach them. Some teachers reported having high-need students who had been in the U.S. for many years or for their entire educational experience and who had not yet mastered English and were low performing. Teachers were unsure how to help these students succeed or how to measure student residency in the U.S.
6
5 A lack of age-appropriate mastery of native language was described as a global problem, not limited to ELLs.
Another barrier to reaching ELL students was student shyness. Teachers reported ELLs as reserved and
6 Science and social studies teachers said ELL students were not that different from non-ELLs, in their experience, because they often introduced vocabulary that was new to all students.
“I have learned a lot of…specific tasks that we do school wide, that students can take with them from class to class. It’s very helpful when [students] have the same exact task, but in a different content.”

08.80 QTEL: Year Two Evaluation, 2008-2009
18
well mannered to a fault. That is, many ELL students did not advocate for themselves or ask questions when they needed help. Some teachers believed ELL students did not ask for help because they did not want to speak aloud for fear of ridicule from other students (or by teachers) regarding their ability to speak English. Many teachers reported concern over the home environment. They believed students whose parents or guardians did not emphasize academics at home were not motivated to succeed. This circumstance could be compounded by, if not related to, parents’ lack of English proficiency. In addition, some teachers compared ELLs with special education students and noticed a wide gap between the academic achievements of these two groups. They believed special education students had many more supports and thus more paths to success than did ELLs.
Teachers also indentified gaps in resources to help them reach ELL students. For example, teachers were concerned their assessment of ELL students’ language or content skills was not accurate. They did not feel they had easy access to information about student residency, educational background, or even ELL status (especially for comparing exited and current LEP students). They reported a tendency to assume students with poor English acquisition were new to the U.S., even though this may not be true. Some teachers also reported not knowing how students were evaluated to qualify for TAKS-LAT, so could not help students prepare for or recommend students for this assessment. Several teachers reported ignorance about programs available to ELL students. Teachers felt they needed a reference guide to programs that either they could use to help ELL students or that their students could use on their own. Participants mentioned a number of supports needed to better serve ELLs: • Instructional support (e.g., bilingual teacher’s aide, instructional specialists on ELLs,
bilingual text books) • Instructional professional development (e.g., training for sheltered instruction, professional
development scaffolding, training for teaching non-Spanish-speaking ELLs)
”We think they’re recent immigrants, but...a lot of them aren't... That hurts them. If we don't actually know [a student] has been here 7 years. [We won’t know] they should be much further along than they are. I err on the side of 'Oh they must be here 2 years, 3 years,' when actually, if I go and look, they’ve been here 6 and 7 years. And there's still not the content knowledge that I believe should be there or the language skills.”
08.80 QTEL: Year Two Evaluation, 2008-2009
19
• Technological support (e.g., access to YouTube to inform “multiple entry points” for content, computers in the classroom, perhaps Computers on Wheels)
Did ELL students’ experiences reflect program objectives?
Students were asked the same questions across schools.7
The responses for which no differences were found between students from QTEL and non-QTEL sites were to questions about postsecondary plans, favorite classes, and suggestions for campus leadership. In terms of postsecondary plans, an approximate 60 to 40 split was found, whereby 60% of students planned to attend college and 40% planned to work. Those students who talked about going to college mentioned University of Texas at Austin, Texas Tech University, Texas A&M University, and Austin Community College (ACC). Students who planned to go directly to work mentioned construction, the military, and the police academy. A few students (i.e., mostly 9th graders) were unsure about their postsecondary plans.
Overall, students from the QTEL schools were far more expressive and engaged in the focus groups than were students from the control schools. The students from control schools demonstrated the shyness teachers described to a much greater degree than did students at the QTEL sites. For several items, no discernable difference was observed between QTEL and non-QTEL sites. The International students distinguished themselves on several other questions. Differences were found between QTEL and control sites on the remaining questions.
7See the Technical Documentation in Appendix C for details on how focus groups were conducted.
Student 1: “I think I could have done better…studied more or looked at my options...I [just] found out about ACC classes [at my school]. Student 2: “You don't hear about [things like this] until you know somebody who’s already taking it, and then it’s too late. Student 1: “Like the nursing class. They're wearing their nurse outfits. I could've have done that. That's what I wanted.”
What were teacher perceptions of their professional development? Discussions with QTEL teachers echoed results from the participant survey: (a) teachers reported increased buy-in during year 2 (except elective teachers) and confusion about the expectations leadership had and the roles teachers were to play in year 3 of QTEL implementation. Focus groups with QTEL and non-QTEL teachers demonstrated that ELL student populations were similar across campuses, as were teachers’ needs to serve these students.

08.80 QTEL: Year Two Evaluation, 2008-2009
20
In regard to favorite classes, most students reported having a favorite class. The subjects included math, ELA, social studies, science, art and physical education. The reasons students gave for identifying a class as “favorite” included liking the subject matter, liking the teacher, liking the course activities, and liking the class environment. Students reported their favorite classes met their educational needs.
Messages for campus leadership varied widely in content and length. A number of students complained about unruly peers. They felt empathy for their teachers having to deal with poorly behaved students who were disruptive, disrespectful, or apathetic. These students wanted their school or the district to provide more support for teachers dealing with unruly students. Several students complained their lunch hour was too short, stating they did not have enough time to get through the lunch line and eat their meal.
International students distinguished themselves from students at other campuses by providing positive responses to questions about adult/peer influences, least favorite classes, and group work. The question about influences focused on postsecondary plans. Students demonstrated a 70-to-30 split with regard to who helped them decide their postsecondary plans. About 70% said their families (e.g., parent and siblings) were encouraging or influential. About 30% said they decided on their own. Students also mentioned talking with friends about this topic. Students from International mentioned teachers as “influencers” and “talkers” more often than did students from other schools. Many students did not have a “worst class.” Even those who did identify a worst class said they were learning what they needed in those classes. Many students at Lanier and Travis described their worst class as boring or difficult, while none of the students from International identified a worst class.
Group projects received mixed reviews. Some students liked them and others did not. Most students reported having been in at least one group where group mates did not contribute to the project. Many students expressed frustration because non-contributors were not held
accountable for their lack of work. Those students who liked group work reported enjoying shared ideas and a shared workload. Students from International had a more positive attitude toward group work than did students from the other three schools.
Variation was evident across schools on questions about college readiness and experience as a
bilingual student. Upper-grade students felt more prepared for college than did lower-grade student. Those who planned to go straight to work felt their schools did not provide support toward that goal. Among those students who stated they were not prepared for their
“My parents didn't go to college. I talked to my mom. She told me that it'd be great if I'd be the first one to go to college.”

08.80 QTEL: Year Two Evaluation, 2008-2009
21
postsecondary activities, several from control schools added comments expressing dissatisfaction with their schools’ curriculum, extracurricular activities, or both. Some students felt their schools fell short in preparing them. Most of the students from International stated they were not ready for their postsecondary plans because they had not mastered English. Students from Lanier reported feeling more prepared for postsecondary activities than did students from the other three schools.
Students reported English as their primary “academic” language. They spoke English in class and with their teachers. They also spoke Spanish academically in class, but usually only to translate for another student. Many also admitted using language as an exclusionary device. Students reported using Spanish in their classes to carry on non-academic conversations with friends when they did not want the teacher to understand. Most students at the QTEL schools reported speaking their native language at home and speaking Spanish with their friends. Many also reported watching Spanish television at home. Many students at the control schools reported using both languages at home.
SECTION 2: SUMMATIVE EVALUATION
This section contains results from the summative assessment of QTEL, and includes a description of teacher and student outcomes. Teacher outcomes were taken from the participant survey. Student outcomes were taken from TAKS and TELPAS data files and compared across time, from the baseline year (2007) through year 2 of the program (2009). A detailed description of how these results were generated is located in Appendix C.
Teacher Outcomes
Did teachers practice what they learned in professional development?
Figure 11 presents a promising trend with regard to scaffolded lessons encouraged by WestEd. Ideally, 100% of respondents would have indicated they used scaffolded lessons two or more times a week. More than 50% of respondents reported using these scaffolded lessons at least twice a week. The one exception was preparing lessons via collaboration with
Did ELL students’ experiences reflect program objectives? Yes. Focus groups conducted with students revealed that International students experienced greater satisfaction with their classroom experiences, compared with students at other schools. In addition, students from QTEL schools (Lanier and International) described themselves as prepared for college with greater confidence than did students from non-QTEL schools (Crockett and Travis).
08.80 QTEL: Year Two Evaluation, 2008-2009
22
Source. QTEL Participant Survey, 2009
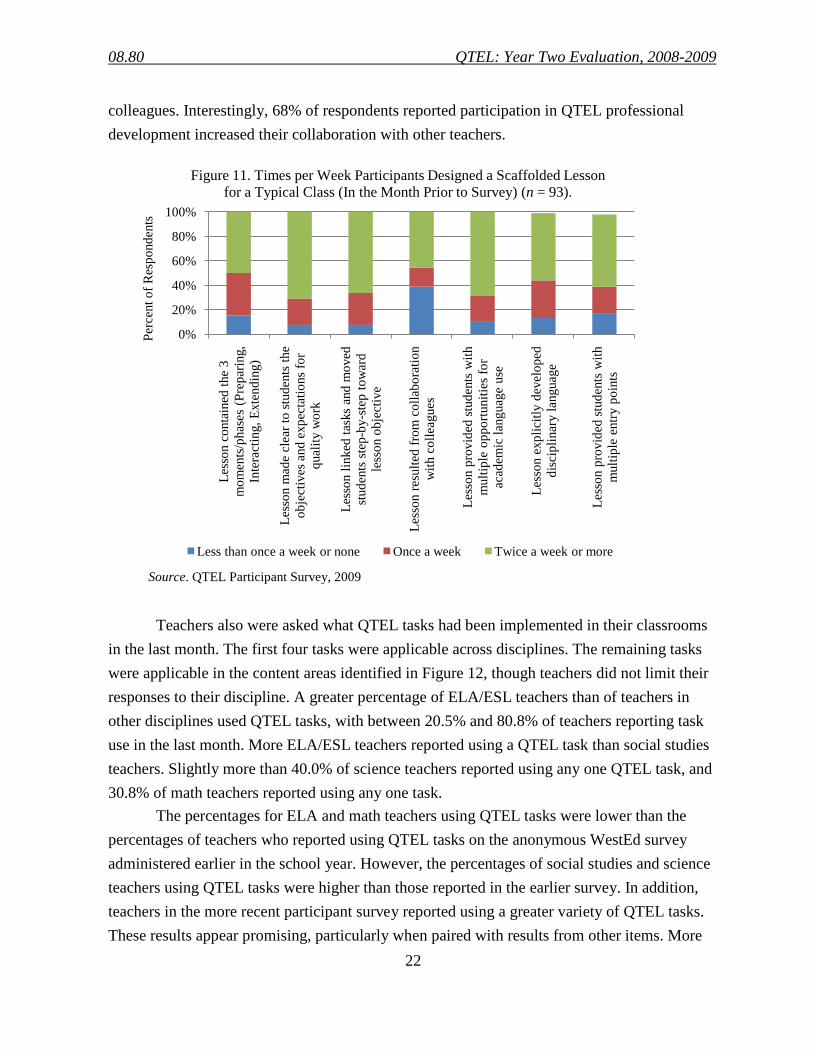
colleagues. Interestingly, 68% of respondents reported participation in QTEL professional development increased their collaboration with other teachers.
Teachers also were asked what QTEL tasks had been implemented in their classrooms in the last month. The first four tasks were applicable across disciplines. The remaining tasks were applicable in the content areas identified in Figure 12, though teachers did not limit their responses to their discipline. A greater percentage of ELA/ESL teachers than of teachers in other disciplines used QTEL tasks, with between 20.5% and 80.8% of teachers reporting task use in the last month. More ELA/ESL teachers reported using a QTEL task than social studies teachers. Slightly more than 40.0% of science teachers reported using any one QTEL task, and 30.8% of math teachers reported using any one task.
The percentages for ELA and math teachers using QTEL tasks were lower than the percentages of teachers who reported using QTEL tasks on the anonymous WestEd survey administered earlier in the school year. However, the percentages of social studies and science teachers using QTEL tasks were higher than those reported in the earlier survey. In addition, teachers in the more recent participant survey reported using a greater variety of QTEL tasks. These results appear promising, particularly when paired with results from other items. More
0%
20%
40%
60%
80%
100%Le
sson
con
tain
ed th
e 3
mom
ents
/pha
ses
(Pre
parin
g,
Inte
ract
ing,
Ext
endi
ng)
Less
on m
ade
clea
r to
stud
ents
the
obje
ctiv
es a
nd e
xpec
tatio
ns fo
r qu
ality
wor
k
Less
on li
nked
task
s an
d m
oved
st
uden
ts st
ep-b
y-st
ep to
war
d le
sson
obj
ectiv
e
Less
on re
sulte
d fr
om c
olla
bora
tion
with
col
leag
ues
Less
on p
rovi
ded
stud
ents
with
m
ultip
le o
ppor
tuni
ties f
or
acad
emic
lang
uage
use
Less
on e
xplic
itly
deve
lope
d di
scip
linar
y la
ngua
ge
Less
on p
rovi
ded
stud
ents
with
m
ultip
le e
ntry
poi
nts
Perc
ent o
f Res
pond
ents
Figure 11. Times per Week Participants Designed a Scaffolded Lesson for a Typical Class (In the Month Prior to Survey) (n = 93).
Less than once a week or none Once a week Twice a week or more

08.80 QTEL: Year Two Evaluation, 2008-2009
23
Source: QTEL Participant Survey, 2009.
Source. QTEL Participant Survey, 2009.
than 80% of respondents reported they intended to use QTEL strategies in their practice next year (2009–2010).
Did teachers practice what they learned in professional development? Yes. Teachers reported using QTEL strategies and tasks and believed the program was meeting its objectives (i.e., improving teacher practice and affecting student engagement).
0%
20%
40%
60%
80%
100%V
ocab
ular
y R
evie
w J
igsa
w
Com
pare
/Con
trast
Mat
rix
Ant
icip
ator
y G
uide
Nov
el Id
eas O
nly
Sem
antic
Map
Min
d M
irror
with
Rub
ric
Cla
rifyi
ng B
ookm
ark
Col
labo
rativ
e Pr
oble
m
Col
labo
rativ
e W
ritin
g
Sort
and
Labe
l
Cau
se/E
ffect
Circ
le
Fish
bone
Map
Cla
rifyi
ng B
ookm
ark
Inte
rpre
ting
a G
raph
ic
Des
crip
tion
of a
Pro
cess
Con
cept
Map
Con
stru
ctio
n
Perc
enta
ge o
f Res
pond
ents
Figure 12. QTEL Tasks Implemented in Classes During Year 2 (n = 69).
Language Arts/ESL Mathematics Social Studies Science
Teacher DisciplinesALL Disciplines ELA MATH SS SCI
08.80 QTEL: Year Two Evaluation, 2008-2009
24
Student Outcomes
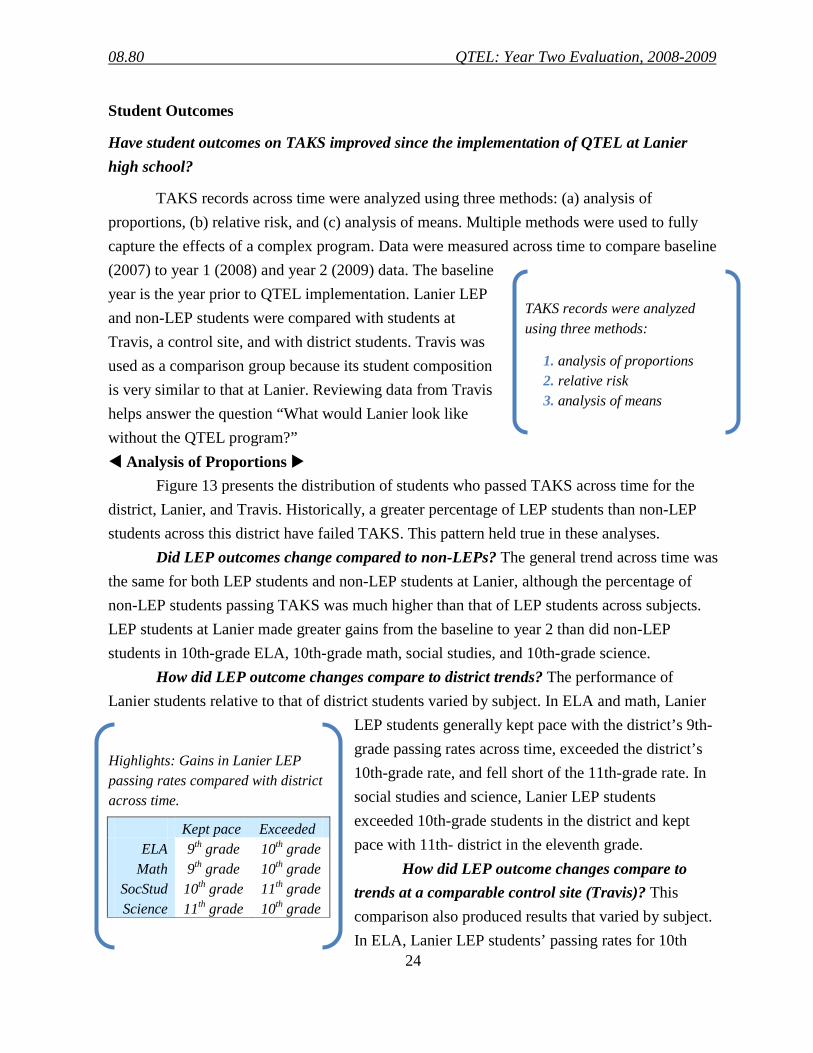
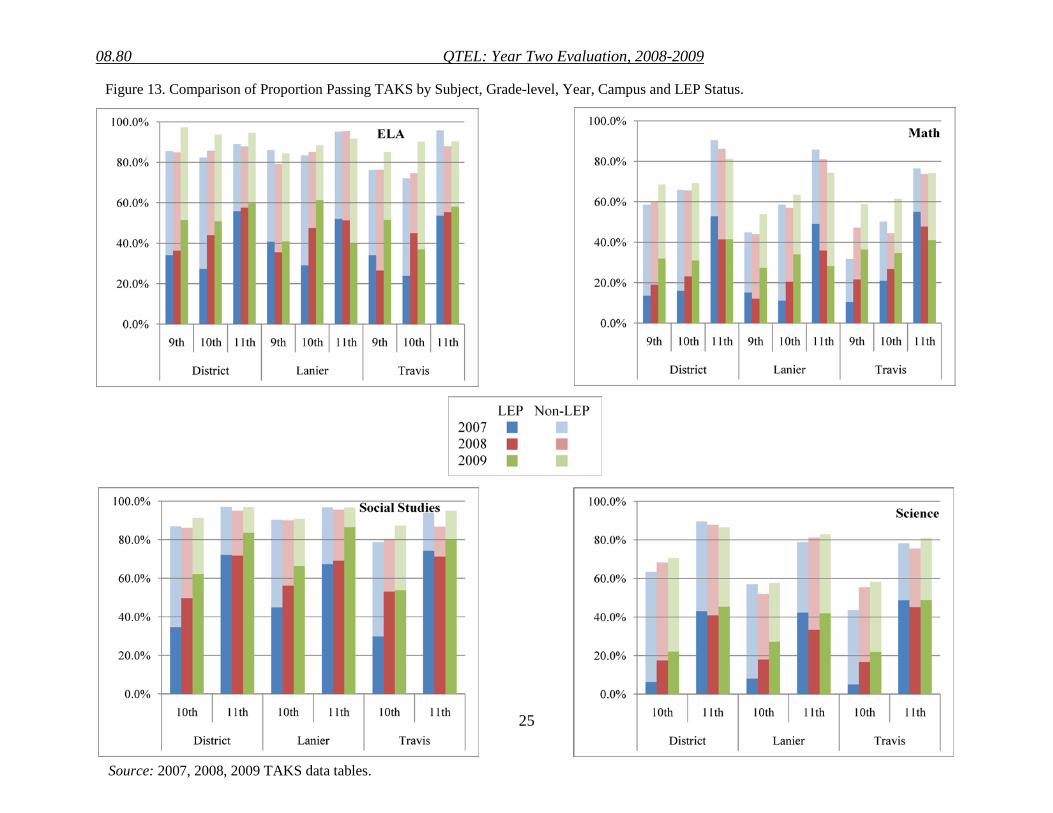
Have student outcomes on TAKS improved since the implementation of QTEL at Lanier high school?
TAKS records across time were analyzed using three methods: (a) analysis of proportions, (b) relative risk, and (c) analysis of means. Multiple methods were used to fully capture the effects of a complex program. Data were measured across time to compare baseline (2007) to year 1 (2008) and year 2 (2009) data. The baseline year is the year prior to QTEL implementation. Lanier LEP and non-LEP students were compared with students at Travis, a control site, and with district students. Travis was used as a comparison group because its student composition is very similar to that at Lanier. Reviewing data from Travis helps answer the question “What would Lanier look like without the QTEL program?” Analysis of Proportions
Figure 13 presents the distribution of students who passed TAKS across time for the district, Lanier, and Travis. Historically, a greater percentage of LEP students than non-LEP students across this district have failed TAKS. This pattern held true in these analyses.
Did LEP outcomes change compared to non-LEPs? The general trend across time was the same for both LEP students and non-LEP students at Lanier, although the percentage of non-LEP students passing TAKS was much higher than that of LEP students across subjects. LEP students at Lanier made greater gains from the baseline to year 2 than did non-LEP students in 10th-grade ELA, 10th-grade math, social studies, and 10th-grade science.
How did LEP outcome changes compare to district trends? The performance of Lanier students relative to that of district students varied by subject. In ELA and math, Lanier
LEP students generally kept pace with the district’s 9th-grade passing rates across time, exceeded the district’s 10th-grade rate, and fell short of the 11th-grade rate. In social studies and science, Lanier LEP students exceeded 10th-grade students in the district and kept pace with 11th- district in the eleventh grade.
How did LEP outcome changes compare to trends at a comparable control site (Travis)? This comparison also produced results that varied by subject. In ELA, Lanier LEP students’ passing rates for 10th
TAKS records were analyzed using three methods:
1. analysis of proportions 2. relative risk 3. analysis of means
Highlights: Gains in Lanier LEP passing rates compared with district across time.
Kept pace Exceeded ELA 9th grade 10th grade
Math 9th grade 10th grade SocStud 10th grade 11th grade Science 11th grade 10th grade

08.80 QTEL: Year Two Evaluation, 2008-2009
25
grade were better than rates for students at Travis; however, the 9th- and 11th-grade students’ passing rates were not better than rates for students at Travis. In math, Lanier LEP students made greater gains than did Travis students in 10th-grade, but they suffered greater losses than did Travis students in the 11th-grade. In social studies, Lanier LEP students made greater gains in the 10th- and 11th-grades and had higher passing rates than did students at Travis. In science, Lanier LEP students in 10th-grade made greater gains and had higher passing rates than did students at Travis.
Statistically significant differences were found between LEP students at Lanier and Travis on three data points. The percentage of 10th-grade Lanier LEP students passing ELA in year 2 was significantly greater than the percentage of students at Travis who did so. The percentages of Lanier LEP students passing math in 9th-grade in year 1 and in 11th-grade in year 2 were significantly lower than the comparable rates for students at Travis (Appendix E contains the full table). This does not suggest that non-significant findings with regard to differences in percentages should be ignored.
What would Lanier look like without the QTEL program? The percentages of LEP students passing ELA, social studies, and science TAKS at Travis were similar to or below those for district students in these subjects. This suggests the absence of QTEL at Lanier might have yielded results at Lanier that would have been similar to those at Travis. Lanier students might not have made greater gains in these subjects that were greater than the gains made by district students, without the influence of QTEL. Relative Risk
Relative risk is aligned with the analysis of proportions because it is a ratio of proportions. Relative risk was used to measure the gap between LEP and non-LEP students’ TAKS passing rates, which ideally would be closed. Examining the relative risk over time helped determine if Lanier, one of the demonstration sites, had closed this gap. Table 5 displays the results of these anlayses. Bold values represent a decrease of at least 0.10 in the failure gap between LEP and non-LEP students from baseline to year 2.8
8 See Appendix C for details on how relative risk was calculated. See Appendix E, Table 12 for details on the
results of the relative risk analyses.
Highlights: Gains in Lanier LEP passing rates compared with Travis across time.
Kept pace Exceeded ELA … 10th grade
Math … 10th grade SocStud 10th grade 11th grade Science … 10th grade
08.80 QTEL: Year Two Evaluation, 2008-2009
25
Figure 13. Comparison of Proportion Passing TAKS by Subject, Grade-level, Year, Campus and LEP Status.
Source: 2007, 2008, 2009 TAKS data tables.

08.80 QTEL: Year Two Evaluation, 2008-2009
26
Table 5. TAKS Achievement Gap Between Limited English Proficiency (LEP) and Non-LEP Students, by Subject, Grade Level, Year, and Campus: Baseline (2007) Compared with Year 2 (2009)
ELA District Lanier Travis
Grade Gap decreased?
Desired direction?
Gap decreased?
Desired direction?
Gap decreased?
Desired direction?
9th YYeess YYeess Yes No No Yes 10th YYeess YYeess YYeess YYeess No Yes 11th YYeess YYeess Yes No Yes No
MATH District Lanier Travis
Grade Gap decreased?
Desired direction?
Gap decreased?
Desired direction?
Gap decreased?
Desired direction?
9th No Yes No Yes No Yes 10th YYeess YYeess YYeess YYeess No Yes 11th Yes No Yes No No No
SOCIAL STUDIES District Lanier Travis
Grade Gap decreased?
Desired direction?
Gap decreased?
Desired direction?
Gap decreased?
Desired direction?
10th YYeess YYeess Yes No No Yes 11th Yes No Yes No YYeess YYeess
SCIENCE District Lanier Travis
Grade Gap decreased?
Desired direction?
Gap decreased?
Desired direction?
Gap decreased?
Desired direction?
10th No Yes Yes No No Yes 11th Yes No No No No No
Source. 2007, 2008, 2009 TAKS data table Notes. Bold "yes" for "gap decreased?" represents a change of at least 0.10 from baseline to year 2. Bold does not represent a statistical difference from baseline to year 2. Bold "yes" for "desired direction?" represents the ideal change, whereby the percentage of both LEP and non-LEP students passing TAKS increased from baseline to year 2 (see Figure 13).

08.80 QTEL: Year Two Evaluation, 2008-2009
27
How did LEP outcome changes compare to district trends? Lanier kept pace with district improvements in relative risk for students failing TAKS across subjects. Indeed, the gap between failing LEPs and non-LEPs closed more for Lanier than the district in several areas: ninth grade ELA, 10th-grade math, eleventh grade social studies and 10th-grade science. However, only the gap closure for 10th-grade math was substantive (i.e., “bottom up”), whereby both LEP and non-LEP students improved and LEP students were “catching up” with with their non-LEP counterparts. The remaining improvements were either “top down” or “top neutral;” the percentage of non-LEP students passing TAKS decreased or remained unchanged from baseline to year 2.
How did LEP outcomes changes compare to trends at a comparable control site (Travis)? Compared with the failure gap for students at Travis, the failure gap for LEP students improved in almost all subjects and grades. However, only two improvements were substantive: 10th-grade ELA and math. It is interesting to note that while the gap did not improve for most of Travis students, the changes in the percentage passing TAKS were ideal for most grades and subjects (i.e., the percentages of both LEP and non-LEP students passing increased).
What would Lanier look like without the QTEL program? In all subjects and most grades, the failure gap at Travis increased from baseline to year 2. Although the percentage of both LEP and non-LEP students passing increased at Travis, the failure gap between these two groups widened. In the absence of QTEL, Lanier might have experienced the same failure gap increase as Travis.
Analysis of Means Figure 14 presents the distribution of means for TAKS exams across time for the
district, Lanier, and Travis. Overall, students performed better in social studies than in any other subject. The average scores for science were lower than for any other subject.
Did LEP outcomes change compared to non-LEPs? The average TAKS scores for LEP students increased for all subjects across most grades at Lanier. Overall, the increases in the average TAKS score for LEP students were similar to the increases for non-LEP students. By year 2, gains in the average score for LEP students exceeded non-LEP students in the following areas: 10th- and 11th-grade ELA, 9th- and 10th-grade math, and 10th-grade science.
How did LEP outcome changes compare to district trends? The gains in average TAKS score for Lanier students, compared with gains for district students, varied by grade
The failure gap between LEP and non-LEP students closed at Lanier across all subjects and grade levels. However, only two data points experienced an “ideal” gap closure, whereby the percentage of LEP and non-LEP students passing TAKS increased, and LEP students were “catching up” with non-LEP students.

08.80 QTEL: Year Two Evaluation, 2008-2009
28
level, but not by subject. The average scores for 10th- graders at Lanier were higher than the district mean. However, the average scores for 9th- and 11th-graders remained lower than the district mean across time.
How did LEP outcome changes compare to trends at a comparable control site (Travis)? The gains in average TAKS scores for Lanier, compared with those for Travis, varied by grade level and by subject. By year 2, the average ELA, social studies, and science scores for 10th-graders improved for Lanier LEP
students more than for Travis LEP students. The average score for Lanier LEP students for other subjects and grades remained lower than that of Travis LEP students in year 2. Furthermore, in year 2, only one data point for Lanier (i.e., 10th-grade ELA) was significantly higher statistically than that for Travis (see Appendix F for full table).
What would Lanier look like without the QTEL program? For the most part, Travis appeared to have kept pace with the district in terms of gains in the average TAKS score over time. This suggest that in the absence of QTEL, Lanier would have kept pace with the district, as well. At the same time, Lanier might not have made some of the gains reported above, and the decreases and stagnations that occurred might have been exacerbated.
Highlights: Gains in Lanier LEP average TAKS scores, compared with district across time.
Kept pace Exceeded ELA … 10th grade
Math … 10th grade SocStud … 10th grade Science … 10th grade
Highlights: Gains in Lanier LEP average TAKS scores, compared with Travis scores, across time.
Kept pace Exceeded ELA … 10th grade
Math … … SocStud … 10th grade Science … 10th grade
Have student outcomes on TAKS improved since the implementation of QTEL at Lanier high school? The results were mixed. Lanier made greater gains than the district with regard to percentage passing TAKS, but these gains were not unilateral across subjects and grades. Performance improvements for 10th-grade ELL students at Lanier stand out. Lanier did not make greater gains compared to the district on average TAKS scores or in closing the achievement gap between LEPs and non-LEPs. From an accountability standpoint, the percentage passing TAKS seems paramount. Thus, the data suggest that Lanier has benefited from QTEL. In the absence of this program, Lanier might have performed like Travis, where no substantial gains occurred in the percentage of LEP students passing TAKS were evident, compared with gains in the district.
08.80 QTEL: Year Two Evaluation, 2008-2009
29
Figure 14. Comparison of TAKS Means by Subject, Grade-level, Year, Campus and LEP Status.
Source. 2007, 2008, 2009 TAKS data tables
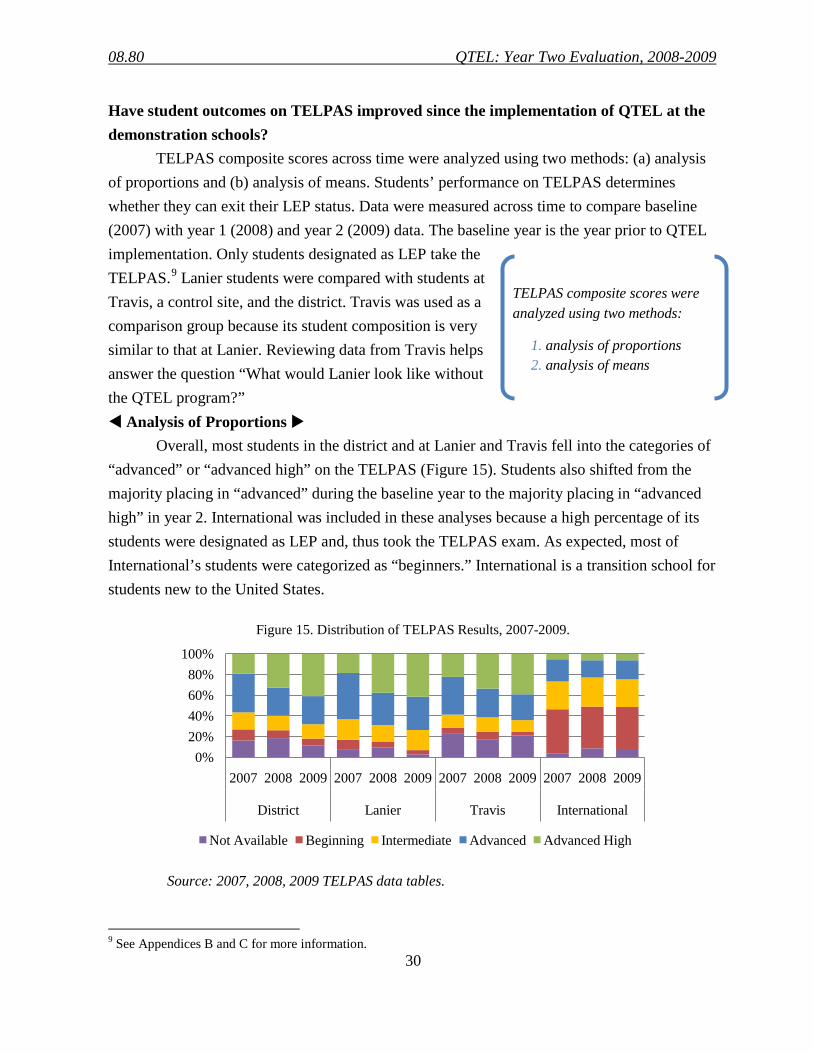
08.80 QTEL: Year Two Evaluation, 2008-2009
30
Have student outcomes on TELPAS improved since the implementation of QTEL at the demonstration schools?
TELPAS composite scores across time were analyzed using two methods: (a) analysis of proportions and (b) analysis of means. Students’ performance on TELPAS determines whether they can exit their LEP status. Data were measured across time to compare baseline (2007) with year 1 (2008) and year 2 (2009) data. The baseline year is the year prior to QTEL implementation. Only students designated as LEP take the TELPAS.9
Analysis of Proportions
Lanier students were compared with students at Travis, a control site, and the district. Travis was used as a comparison group because its student composition is very similar to that at Lanier. Reviewing data from Travis helps answer the question “What would Lanier look like without the QTEL program?”
Overall, most students in the district and at Lanier and Travis fell into the categories of “advanced” or “advanced high” on the TELPAS (Figure 15). Students also shifted from the majority placing in “advanced” during the baseline year to the majority placing in “advanced high” in year 2. International was included in these analyses because a high percentage of its students were designated as LEP and, thus took the TELPAS exam. As expected, most of International’s students were categorized as “beginners.” International is a transition school for students new to the United States.
9 See Appendices B and C for more information.
TELPAS composite scores were analyzed using two methods:
1. analysis of proportions 2. analysis of means
0%20%40%60%80%
100%
2007 2008 2009 2007 2008 2009 2007 2008 2009 2007 2008 2009
District Lanier Travis International
Figure 15. Distribution of TELPAS Results, 2007-2009.
Not Available Beginning Intermediate Advanced Advanced High
Source: 2007, 2008, 2009 TELPAS data tables.
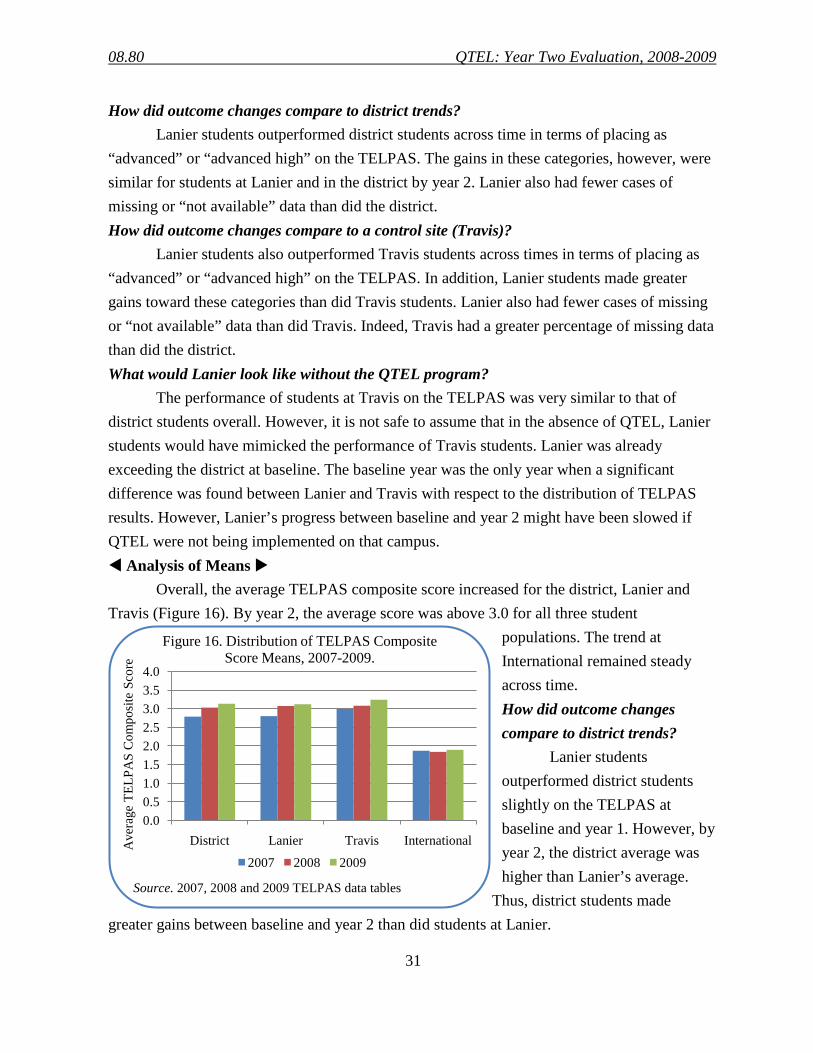
08.80 QTEL: Year Two Evaluation, 2008-2009
31
Source. 2007, 2008 and 2009 TELPAS data tables
How did outcome changes compare to district trends? Lanier students outperformed district students across time in terms of placing as
“advanced” or “advanced high” on the TELPAS. The gains in these categories, however, were similar for students at Lanier and in the district by year 2. Lanier also had fewer cases of missing or “not available” data than did the district. How did outcome changes compare to a control site (Travis)?
Lanier students also outperformed Travis students across times in terms of placing as “advanced” or “advanced high” on the TELPAS. In addition, Lanier students made greater gains toward these categories than did Travis students. Lanier also had fewer cases of missing or “not available” data than did Travis. Indeed, Travis had a greater percentage of missing data than did the district. What would Lanier look like without the QTEL program? The performance of students at Travis on the TELPAS was very similar to that of district students overall. However, it is not safe to assume that in the absence of QTEL, Lanier students would have mimicked the performance of Travis students. Lanier was already exceeding the district at baseline. The baseline year was the only year when a significant difference was found between Lanier and Travis with respect to the distribution of TELPAS results. However, Lanier’s progress between baseline and year 2 might have been slowed if QTEL were not being implemented on that campus. Analysis of Means
Overall, the average TELPAS composite score increased for the district, Lanier and Travis (Figure 16). By year 2, the average score was above 3.0 for all three student
populations. The trend at International remained steady across time. How did outcome changes compare to district trends?
Lanier students outperformed district students slightly on the TELPAS at baseline and year 1. However, by year 2, the district average was higher than Lanier’s average.
Thus, district students made greater gains between baseline and year 2 than did students at Lanier.
0.00.51.01.52.02.53.03.54.0
District Lanier Travis InternationalAve
rage
TEL
PAS
Com
posi
te S
core
Figure 16. Distribution of TELPAS Composite Score Means, 2007-2009.
2007 2008 2009
08.80 QTEL: Year Two Evaluation, 2008-2009
32
How did outcome changes compare to a control site (Travis)? Travis students outperformed Lanier students across time, with higher average
TELPAS composite scores. The means for baseline and year 2 were statistically lower for Lanier than for Travis. However, Lanier students made greater gains between baseline and year 2 than did Travis students. What would Lanier look like without the QTEL program? These results suggest that Lanier may have fallen short of current performance in the absence of QTEL. In addition, Lanier might not have made the same gains between baseline and year 2 in the absence of QTEL.
CONCLUSIONS AND RECOMMENDATIONS
Overall, the data suggest that QTEL was moderately effective in year 2. The conclusion of moderate effectiveness was based on the myriad of mixed results documented in this report. The formative evaluation suggested QTEL succeeded in delivering professional development both valued and utilized by participants. Beyond this, the formative evaluation yielded mixed results. While QTEL participants were satisfied with the program, many were unclear about their roles and responsibilities. While participants felt their school leadership was vested in QTEL, they were not confident the district concurred. Both of these findings were carry-overs from year 1. The onus of improving these outcomes lies more with AISD than with WestEd.
The summative assessment also yielded mixed results. Lanier made gains in terms of the proportion of LEPs passing TAKS. However, these gains were not unilateral and did not always exceed the district or the control site. Lanier made greater gains than the district in four of twelve areas (three grade-levels by four TAKS subjects). The control site made greater gains than the district in only two of the twelve areas. However, the district also made measureable gains in eleven of the twelve areas. The achievement gap between LEPs and non-LEPs at Lanier closed in a pattern similar to that of the district and across more grades and subjects
Have student outcomes on TELPAS improved since the implementation of QTEL at Lanier high school? The results were mixed. Overall, Lanier students made greater gains than district students in regard to the distribution of TELPAS composite scores, but did not make gains in average scores. From an accountability standpoint, the percentages categorized as “advanced” or “advanced high” seemed to carry more weight than did changes in the average score. Thus, the data suggested that Lanier has benefited from QTEL.
08.80 QTEL: Year Two Evaluation, 2008-2009
33
than at the control site. However, the gap closures at Lanier were not always ideal (where the proportion of both LEPs and non-LEPs passing increased). The proportions passing for both LEPs and non-LEPs improved across time and TAKS subjects for both the district and control sites. While the overall findings were mixed, improvements in performance outcomes for 10th-grade ELL students at Lanier stood out compared to other grade levels. These 10th-grade students were exposed to QTEL strategies beginning in their freshman year, suggesting that long-term and/or consistent classroom practice improves student learning.
Lanier made greater gains in proportion of LEPs scoring advanced or advanced high in TELPAS than both the district and the control site. However, Lanier was already outperforming these two populations at baseline, before QTEL implementation. It is important to note, however, that any gain made at Lanier is laudable. The data suggest that in the absence of QTEL, gains in TAKS and TELPAS may have been diminished and losses exacerbated.
It is worth noting that QTEL is not detrimental to teacher satisfaction or student performance. While the results presented here belie overwhelming success, they do not show any harmful effects. This is a consideration easily overlooked if one’s lens is focused only on identifying positive results. RECOMMENDATIONS
These mixed findings suggest more information is needed to qualify the data available. For example, classroom observations would contribute greatly to the assessment of program efficacy. Indeed, these observations are vital and future funding may even be contingent upon them. Funds from the American Recovery and Reinvestment Act of 2009 are being utilized in year 3. Continuation of these funds is depended upon program transparency and classroom observations are key to informing transparency. In addition to adding observations as a data point, the following improvements merit attention in year 3:
• Improve PD attendance data to measure participant dosage: o Add number of sessions attended and o Frequency of WestEd coach interactions to the data,
• Demonstrate district commitment to encourage teacher vestment, • Clearly communicate roles for non-leadership cadre teachers and • Continued improvement in PD scheduling, including timely notification to
participants. District capacity to continue this work also merits consideration in year 3 and beyond.
Discussions regarding district roll-out have occurred since the planning phase for year 1. However, no plan has been finalized. Program staff have articulated that Year 3 will build upon and expand the work accomplished in Years 1 and 2. Activities will focus on solidifying

08.80 QTEL: Year Two Evaluation, 2008-2009
34
organizational capacity and teacher expertise to enact and support rigorous instruction for all teachers and includes the following activities:
• Prepare Lanier and International to serve as demonstration sites for district inter-visitations and professional development;
• Define the role of professional developers at their individual campuses and within the district;
• Define the role of disciplinary teachers to coach peers at their home campuses or other campuses;
• Develop district / campus plans to sustain the changes in practice brought about by 3 years of intensive QTEL professional development after the contract with WestEd has ended;
• Make decisions about expanding the work to other high school campuses or vertical teams.
The QTEL program was designed to build capacity, but requires thoughtful planning. Evidence suggests capacity is being built at campuses in the absence of district support and in the absence of district capacity to sustain the program. AISD cannot maintain a long-term, financial relationship with WestEd. If efforts are not made to support this program system-wide, then investments in this 3-year program will not yield long-term returns.
Other issues that need to be addressed in terms of program sustainability include fidelity, employee retention and scope of work for local coaches. If WestEd does not remain a partner in some capacity, program fidelity may suffer. WestEd has tried to control this to some extent by requiring local coaches to certify in QTEL. This certification encompasses both classroom practice and delivering professional development to others. Even with this certification, local coaches will not be immersed in educational and/or best practices literature to the same extent as WestEd staff. Also, the district may not have the financial capacity to compensate these local coaches and retain them as employees. Local coaches have invested their time and commitment to earning a unique skill, certification in QTEL teaching methods. This skill needs to be recognized and valued by the district in order to retain these teachers. Finally, the number of local coaches is limited. Plans for roll-out must communicate how 20 or so local coaches will deliver a sophisticated professional development model to 7,300+ teachers across the district. FUTURE EVALUATION WORK
The utility of a single, all-encompassing evaluation report has come into question during year 2. Program and evaluation staff believe the evaluation work will be more valuable
08.80 QTEL: Year Two Evaluation, 2008-2009
35
and manageable if reported at regular intervals as shorter reports and targeted outcomes. Evaluation briefs planned for the spring and summer 2010 include:
• A survival analysis of LEP students by grade over time to measure drop-out rates, • A report on International students that includes:
(1) transition from tenth to eleventh grade and (2) growth or improvement from ninth to tenth grade,
• A cohort analysis of TAKS outcomes and TELPAS progress (including analyses of different TAKS objectives and TELPAS subjects),
• A longitudinal report on the annual survey of QTEL teacher participants including: (1) trend analysis of teacher use of QTEL strategies and responses to participant survey and (2) a regression analysis of student outcomes linked to teacher responses on the annual QTEL survey,
• Regression analysis of student outcomes linked to teacher exposure to QTEL PD (need PD attendance).

08.80 QTEL: Year Two Evaluation, 2008-2009
36
APPENDICES

08.80 QTEL: Year Two Evaluation, 2008-2009
37
Appendix A. Student Demographics
Table 6. Student Demographic Characteristics, October 2008, Quality Teaching for English Learners Demonstration Sites and Control Group
District High
schools Lanier Inter-
national Travis Race / ethnicity
American Indian / Alaska Native .2% 0.3% 0.3% … 0.1% Asian / Pacific Islander 3.4% 3.2% 2.1% 15.2% 1.1%
Black, non-Hispanic 11.7% 13.3% 12.7% 5.1% 12.4% Hispanic 58.9% 51.2% 79.4% 79.3% 82.0%
White, non-Hispanic 25.7% 32.0% 5.5% 0.5% 4.4% Special education status
Not special education 90.6% 88.1% 87.0% 100.0% 84.3% special education 6.4% 11.9% 13.0% … 15.7%
Economic disadvantage status Not economically disadvantaged 37.5% 51.1% 16.1% 5.1% 16.6%
Free meals 54.6% 40.9% 73.8% 87.6% 72.5% Reduced meals 7.9% 8.0% 10.1% 7.4% 10.9%
Limited English language proficiency status Not LEP 69.5% 85.7% 61.6% 6.0% 72.0%
Current LEP 29.1% 13.5% 33.7% 94.0% 26.6% 1st year exited 1.3% 0.6% 4.1% … 0.6%
2nd year exited 0.2% 0.2% 0.6% … 0.9% English as a second language services indicator
No services 90.3% 87.4% 67.1% 6.0% 75.0% Receiving services 9.7% 12.6% 32.9% 94.0% 25.0%
Home language Spanish 35.7% 28.5% 65.5% 79.3% 53.7% English 61.0% 68.2% 31.8% … 45.2%
Other 3.3% 3.3% 2.7% 20.7% 1.1% Source. PEIMS data tables 110 and 101

08.80 QTEL: Year Two Evaluation, 2008-2009
38
Note. These demographic categories are explained in detail on the PEIMS Data Standards website, http://ritter.tea.state.tx.us/peims/. Students receiving ESL services in grades 9 through 12 received intensive instruction in English from teachers trained in recognizing and dealing with language differences. The content-based ESL program provided a full-time ESL-certified teacher who offered supplementary instruction for all content areas. It integrated ESL instruction with subject matter instruction, and focused not only on learning a second language, but on using that language as a medium to learn mathematics, science, social studies, or other academic subjects. The pull-out ESL program provided the same service, in a pull-out or inclusionary delivery model, but only for language arts. In the pull-out program, students remained in a mainstream instructional arrangement for the other content areas.

08.80 QTEL: Year Two Evaluation, 2008-2009
39
YES YES NO NO
Regular Classroom
Regular Classroom
Regular Classroom Regular Classroom
Regular Classroom Regular Classroom
Bilingual Classroom ESL Classroom
Home Language Survey
STUDENT
Language spoken at home: English and any other language
Language spoken at home: Other language (not English)
Language spoken at home: English
Non-LEP TEST: Pre-K – K: Language Proficiency and Learning (Pre-LAS)
1st – 12th: Language Proficiency and Learning (LAS Links) + Iowa Test of Basic Skills (2nd – 12th)
LEP / Bilingual LEP / ESL Non-LEP
Language Proficiency Assessment Committee (LPAC) Meeting Non-LEP
PLACEMENT: Required Bilingual Program §89.1205(a)
PLACEMENT: Required ESL Program §89.1205(d)
Parent notification
Parental permission Parental permission
LEP denial
Parent conference
Meets Bilingual Exit Criteria:
See LEP exit criteria
Non-LEP
LEP: Required Bilingual Program
Meets Bilingual Exit Criteria:
See LEP exit criteria
LEP: Required ESL Program
Meets ESL Exit Criteria:
See LEP exit criteria
Non-LEP
LEP denial
Parent conference
Meets ESL Exit Criteria:
See LEP exit criteria
Adapted from TEA Bilingual Curriculum Site, http://ritter.tea.state.tx.us/curriculum/biling/
Appendix B. Limited English Proficient Decision Chart

08.80 QTEL: Year Two Evaluation, 2008-2009
40
Appendix C. Technical Documentation QTEL PARTICIPATION
The numerator for determining QTEL participation was provided by WestEd in an email from Echo Chen, dated April 2009 (n = 183). This list included those who had signed an attendance sheet for at least one professional development session between August 2007 and April 2009. The list was paired down to match April 2009 staff records: 32 of the names were not in the current AISD directory, 14 of the staff were not located at the demonstration sites, 8 records were duplicates, and 4 teachers were not sent the survey link.10
Table 7. Category Assignement for Primary Job Title Codes.
Academic Support Administration ELA Math BIL INST/CURR S ACADEMY DIRECTO T-HS ENGLISH T-HS ESL MATH T-HS AVID ACCTG TECH II T-HS ESL ENGLSH T-HS MATH T-HS CATE … ATTEND SPEC III T-HS READING T-HS/SE MATH T-HS DELTA CLERK III- SCH T-HS/SE ENGLISH
T-HS ESL CLERK IV- SCH T-HS/SE LAN ART Science T-HS/SE DATA PROC ASTII T-HS/SE R/I T-HS BIOLOGY T-HS/SE ADAPT P DROPOUT INT SPE
T-HS CHEMISTRY
T-HS/SE EM DIST HS ASST PRIN Elective T-HS ESL SCIENC T-HS/SE LIFE SK HS PRINCIPAL … ATHL TRAINER T-HS HEALTH T-HS/SE LLD MGT ASST TO PRI T-HS ART T-HS PHYS/CHEM COMP LAB ASST PARENT SUP SPEC T-HS ATHL T-HS PHYSICS COUNS- HS PROGRAM FACIL T-HS BAND T-HS SCI- GEN`L GUIDANCE SEC PROJECT FACIL T-HS CHOIR T-HS/SE BIOLOGY INSTR/CURR SPEC PROJECT SPEC II T-HS DANCE T-HS/SE SCIENCE ISS MONITOR REGISTRAR IV T-HS FRENCH T-HS/V HLTH SCI LIBRARIAN / LIBRARY SCH IMPROV FACI T-HS ORCHESTRA
MENTOR TCHR SEC III- SCH T-HS PE Social Studies SOCIAL WORKER TECH SUPP COORD T-HS SPANISH T-HS GEOGRAPHY TCHR ASST … TECH SUPP SPEC T-HS SPEECH T-HS HISTORY TEACHER SUB TECH ASSESSMEN T-HS THEAT/DRAM T-HS SOC SCI TEMP CLASSIFIED
T-HS/V AGRICUL
TEMP/HRLY PROF
T-HS/V BUSN COM
T-HS/V FAM/CONS
T-HS/V T&I PEL
T-HS/V TECH ED
The denominator for participation was pulled from SASI data tables for July 2008 and May 2009. Management Information Systems (MIS) created these data for DPE analysts.
10 SurveyMonkey® allows respondents to opt out of their system. After a respondent opts out, he or she will not receive any subsequent emails sent from the SurveyMonkey system.

08.80 QTEL: Year Two Evaluation, 2008-2009
41
These data files contained information about staff (e.g., primary job title), which was used to categorize campus staff into the general categories shown in Figures 5 and 10. A data table for May 2008 was not available in SASI, nor was it possible to create one (per MIS) retrospectively.
QTEL PARTICIPANT SURVEY In May and June, teacher participants were sent a survey via SurveyMonkey®, an
Internet survey provider (see Appendix D for the complete survey). Questions were informed from several sources: QTEL Theory of Action, the program theoretical map, WestEd surveys, and the year 1 survey and field observations. Surveys were emailed to all QTEL professional development participants (N = 125), with 106 participants from Lanier and 19 participants from International. Non-responders received multiple follow-up emails over a 4-week period prompting participation. Only unique (unduplicated) records were retained in the data. The overall response rate was 80% (n = 100)11
Composite Satisfaction Score
; 78.3% of Lanier participants and 89.5% of International participants responded. The small sample size from International prevented between-campus comparisons.
A composite score for overall program satisfaction was computed using the mean response from the following items:
• Has participation in the QTEL professional development / program improved your teaching practice?
• Has participation in the QTEL professional development / program improved your knowledge of your course content area?
• Has participation in the QTEL professional development / program increased your collaboration with other teachers?
• Based on your experience, how would you rate the WestEd / QTEL program overall? • Would you recommend QTEL to another school district?
These items were selected because they shared the same range of responses wherein the low value (1) respresented a positive response and the high value (4) represented a negative response. The disciplines shown in Figures 5 and 10 were taken from the staff file mentioned above.
11 The response rate may have been compromised by duplicate survey efforts. An administrator from CAC surveyed QTEL participants shortly before the DPE survey was sent. Several participants expressed frustration with being surveyed multiple times on the same content and made the following remarks in e mail, “’Please let me know that you have received this completed survey. This is the second time that I have completed it,’ and ‘I filled out one or maybe two surveys for QTEL already. Is this another new one or the same?’”
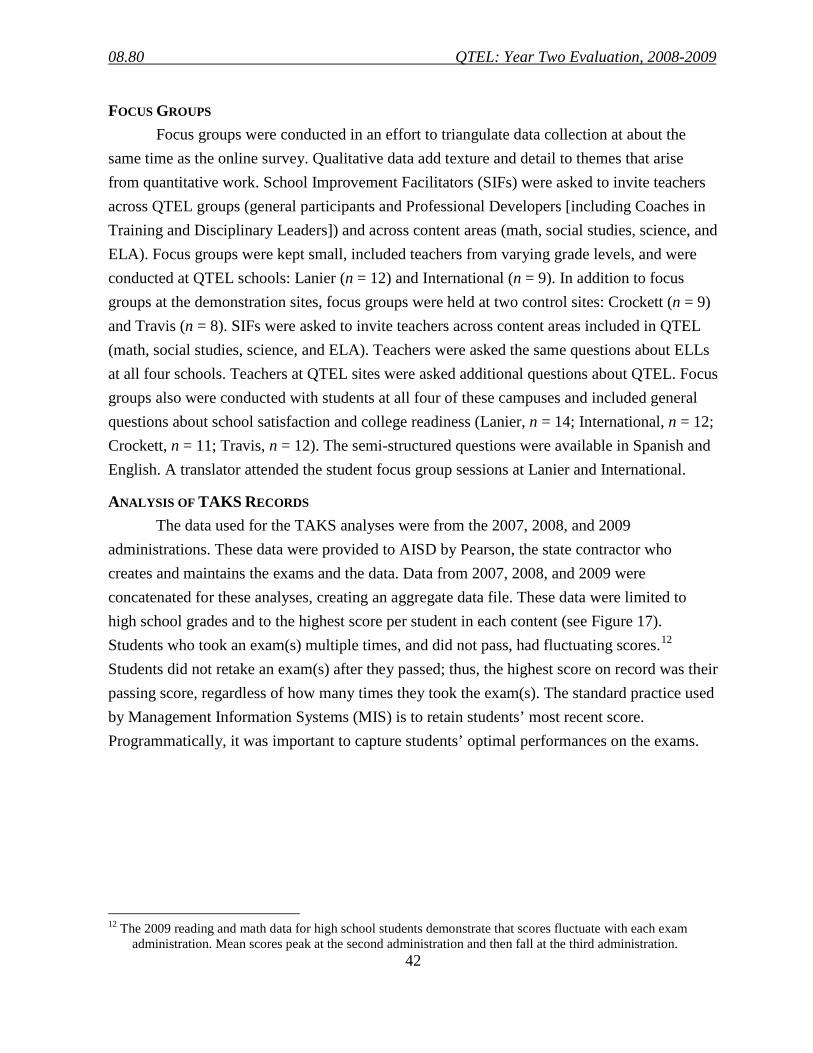
08.80 QTEL: Year Two Evaluation, 2008-2009
42
FOCUS GROUPS Focus groups were conducted in an effort to triangulate data collection at about the
same time as the online survey. Qualitative data add texture and detail to themes that arise from quantitative work. School Improvement Facilitators (SIFs) were asked to invite teachers across QTEL groups (general participants and Professional Developers [including Coaches in Training and Disciplinary Leaders]) and across content areas (math, social studies, science, and ELA). Focus groups were kept small, included teachers from varying grade levels, and were conducted at QTEL schools: Lanier (n = 12) and International (n = 9). In addition to focus groups at the demonstration sites, focus groups were held at two control sites: Crockett (n = 9) and Travis (n = 8). SIFs were asked to invite teachers across content areas included in QTEL (math, social studies, science, and ELA). Teachers were asked the same questions about ELLs at all four schools. Teachers at QTEL sites were asked additional questions about QTEL. Focus groups also were conducted with students at all four of these campuses and included general questions about school satisfaction and college readiness (Lanier, n = 14; International, n = 12; Crockett, n = 11; Travis, n = 12). The semi-structured questions were available in Spanish and English. A translator attended the student focus group sessions at Lanier and International.
ANALYSIS OF TAKS RECORDS The data used for the TAKS analyses were from the 2007, 2008, and 2009
administrations. These data were provided to AISD by Pearson, the state contractor who creates and maintains the exams and the data. Data from 2007, 2008, and 2009 were concatenated for these analyses, creating an aggregate data file. These data were limited to high school grades and to the highest score per student in each content (see Figure 17). Students who took an exam(s) multiple times, and did not pass, had fluctuating scores.12
Students did not retake an exam(s) after they passed; thus, the highest score on record was their passing score, regardless of how many times they took the exam(s). The standard practice used by Management Information Systems (MIS) is to retain students’ most recent score. Programmatically, it was important to capture students’ optimal performances on the exams.
12 The 2009 reading and math data for high school students demonstrate that scores fluctuate with each exam
administration. Mean scores peak at the second administration and then fall at the third administration.
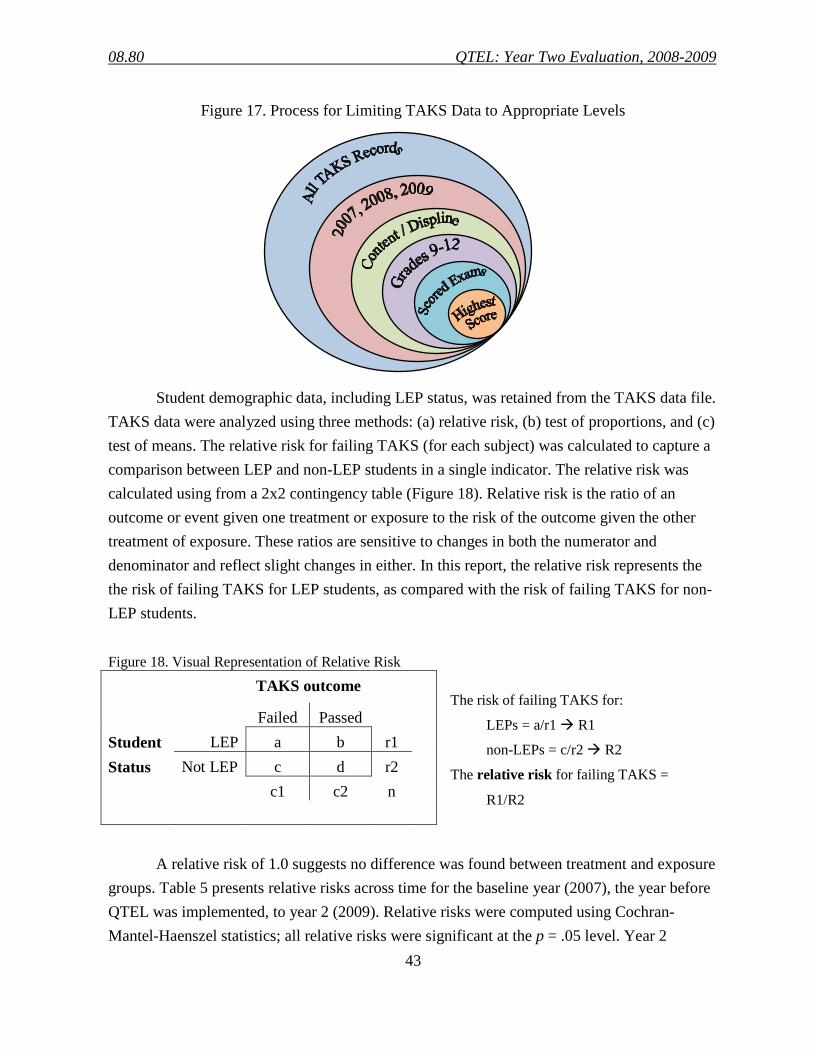
08.80 QTEL: Year Two Evaluation, 2008-2009
43
Figure 17. Process for Limiting TAKS Data to Appropriate Levels
Student demographic data, including LEP status, was retained from the TAKS data file.
TAKS data were analyzed using three methods: (a) relative risk, (b) test of proportions, and (c) test of means. The relative risk for failing TAKS (for each subject) was calculated to capture a comparison between LEP and non-LEP students in a single indicator. The relative risk was calculated using from a 2x2 contingency table (Figure 18). Relative risk is the ratio of an outcome or event given one treatment or exposure to the risk of the outcome given the other treatment of exposure. These ratios are sensitive to changes in both the numerator and denominator and reflect slight changes in either. In this report, the relative risk represents the the risk of failing TAKS for LEP students, as compared with the risk of failing TAKS for non-LEP students. Figure 18. Visual Representation of Relative Risk
TAKS outcome
Failed Passed Student LEP a b r1 Status Not LEP c d r2 c1 c2 n
A relative risk of 1.0 suggests no difference was found between treatment and exposure
groups. Table 5 presents relative risks across time for the baseline year (2007), the year before QTEL was implemented, to year 2 (2009). Relative risks were computed using Cochran-Mantel-Haenszel statistics; all relative risks were significant at the p = .05 level. Year 2
The risk of failing TAKS for:
LEPs = a/r1 R1
non-LEPs = c/r2 R2
The relative risk for failing TAKS =
R1/R2
08.80 QTEL: Year Two Evaluation, 2008-2009
44
numbers in bold indicate a decrease in the gap between LEP students who failed TAKS and non-LEP students who failed TAKS between these two time points. This is generally considered a positive outcome because the failure gap was closing. However, a narrowing gap does not always bode well for all students. These results must be placed in context of the distribution of passing students as well as the tests of proportions. The ideal change is a narrowing gap as a result of LEP students catching up with non-LEP students and both groups improving. [Note. Bold does not indicate a statistically significant change from baseline to year 2; it represents an arithmatic decrease. Differences below 0.10 were not considered change between baseline and year 2.]
The distribution of students passing TAKS is shown in Figure 13. A chi-square test of proportions was used to discern whether the percentages of students (LEP and non-LEP) passing TAKS were significantly different for Lanier and Travis. These results are in Table 8. Percentage passing does not inform about changes in actual test scores. Figure 14 presents average test scores for the district, Lanier, and Travis, by LEP status. A t-test was used to determine if any differences in these averages were statistically significant (data were normally distributed).
These analyses did not include data specific to International. International has a unique student population and most TAKS exams are not scored for accountability purposes. From 2007 to 2009, more than 70% of students took the TAKS-LAT version of the math and ELA exams and more than 50% took the LAT version of the social studies and science exams.
ANALYSIS OF TELPAS RECORDS The data used for the TELPAS analyses were from the 2007, 2008, and 2009
administrations. Data from these years were concatenated for these analyses, creating an aggregate data file. These data were limited to high school grades and to the highest score per student in each content (Figure 19).
Only ELL students designated as LEP take the TELPAS. Thus, comparisons could not be made with non-LEP students. TELPAS data were analyzed using two methods: (a) test of proportions and (b) test of means. The variable of interest in these analyses was the composite score.13
Relative risks were not calculated using TELPAS data because this would not be substantively appropriate. Students fell into four categories based on their TELPAS results.
13 Only students rated in all four language domains (listening, speaking, reading, and writing) receive a composite score. A missing data point on any four of these domains results in a composite score that is not available. For more information about TELPAS, visit http://www.tea.state.tx.us/index3.aspx?id=3300&menu_id=793.
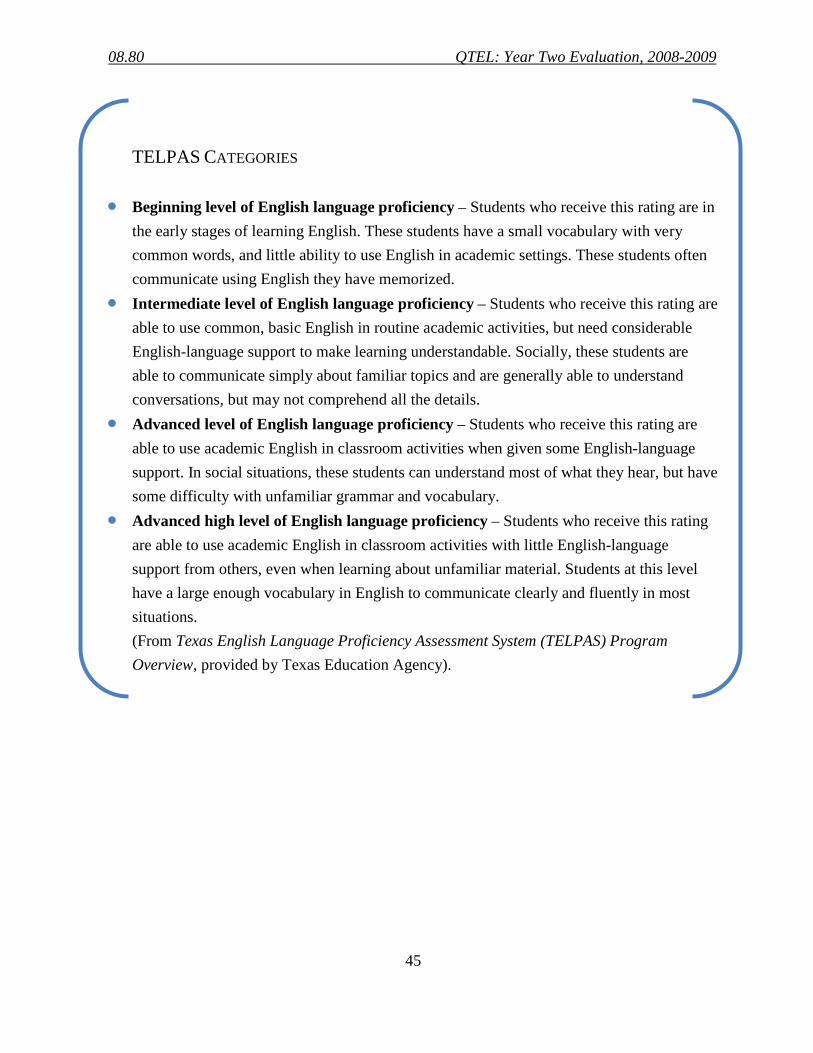
08.80 QTEL: Year Two Evaluation, 2008-2009
45
TELPAS CATEGORIES
• Beginning level of English language proficiency – Students who receive this rating are in the early stages of learning English. These students have a small vocabulary with very common words, and little ability to use English in academic settings. These students often communicate using English they have memorized.
• Intermediate level of English language proficiency – Students who receive this rating are able to use common, basic English in routine academic activities, but need considerable English-language support to make learning understandable. Socially, these students are able to communicate simply about familiar topics and are generally able to understand conversations, but may not comprehend all the details.
• Advanced level of English language proficiency – Students who receive this rating are able to use academic English in classroom activities when given some English-language support. In social situations, these students can understand most of what they hear, but have some difficulty with unfamiliar grammar and vocabulary.
• Advanced high level of English language proficiency – Students who receive this rating are able to use academic English in classroom activities with little English-language support from others, even when learning about unfamiliar material. Students at this level have a large enough vocabulary in English to communicate clearly and fluently in most situations. (From Texas English Language Proficiency Assessment System (TELPAS) Program Overview, provided by Texas Education Agency).
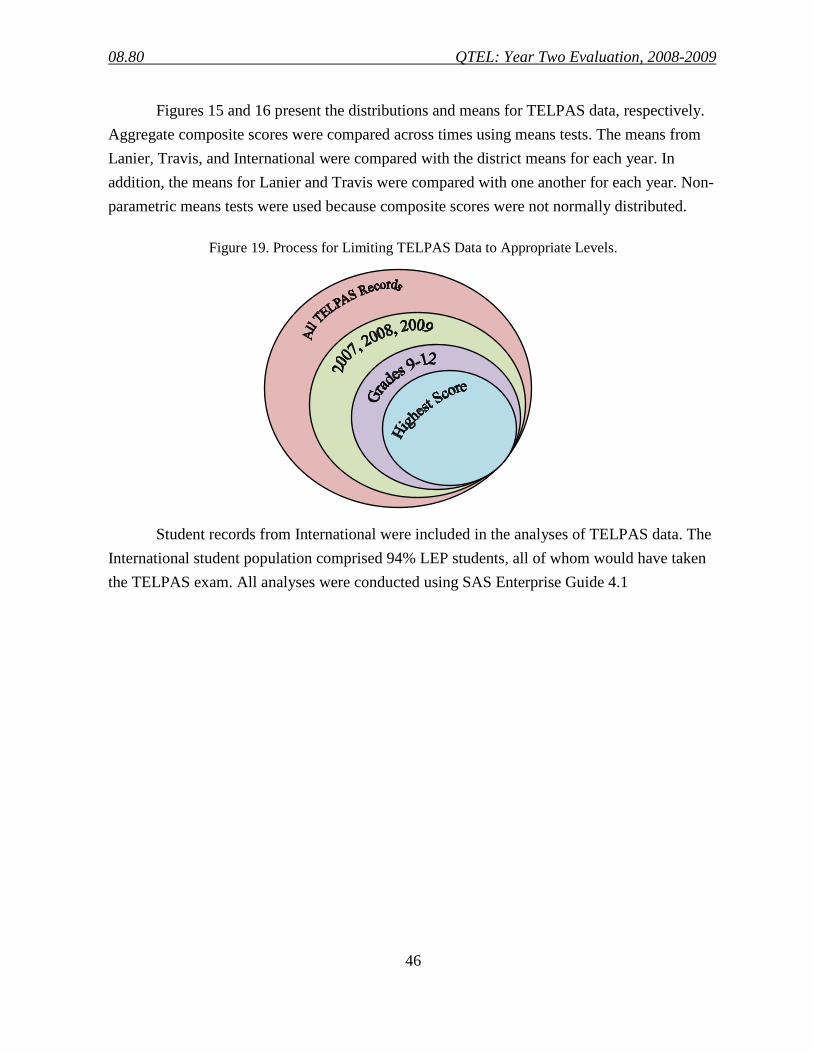
08.80 QTEL: Year Two Evaluation, 2008-2009
46
Figures 15 and 16 present the distributions and means for TELPAS data, respectively. Aggregate composite scores were compared across times using means tests. The means from Lanier, Travis, and International were compared with the district means for each year. In addition, the means for Lanier and Travis were compared with one another for each year. Non-parametric means tests were used because composite scores were not normally distributed.
Figure 19. Process for Limiting TELPAS Data to Appropriate Levels.
Student records from International were included in the analyses of TELPAS data. The International student population comprised 94% LEP students, all of whom would have taken the TELPAS exam. All analyses were conducted using SAS Enterprise Guide 4.1

08.80 QTEL: Year Two Evaluation, 2008-2009
47
Appendix D. Detailed Responses for Additional Professional Development Items Table 8. Participant Selection of Components in Which Additional Support Was Needed: Sustaining Academic Rigor (n = 88)
Components of sustaining academic rigor Percentage
Promoting deep disciplinary knowledge 17.0%
Developing central ideas of a discipline 14.8%
Establishing the complex relations that exist between central ideas 27.3%
Sustaining a focus on central ideas and depth of knowledge 26.1%
Requiring higher order thinking skills 31.8%
Leading students to combine facts and ideas to synthesize, evaluate, generalize 30.7%
Leading students to solve problems and construct new meanings and understandings 23.9%
Developing substantive, generative concepts and skills, and teaching students to support thinking with
evidence 26.1%
Leading students to construct explanations and arguments in the content area 33.0%
I am comfortable with these components and do not need additional support 33.0%
Table 9. Participant Selection of Components in Which Additional Support Was Needed: Holding High Expectations (n = 87)
Components of holding high expectations Percentage
Engaging students in tasks that are highly challenge and high support 21.8%
Using tasks that are academically challenging and engaging 19.5%
Providing scaffolds that facilitate student engagement in intellectual tasks 18.4%
Providing varied entry points for instructional tasks 29.9%
Promoting apprenticeship and increased participation over time 18.4%
Engaging students in the development of their own expertise 33.3%
Acting on the belief that all members of the class community can achieve 10.3%
Fostering a climate of mutual respect that contributes to the achievement of all 13.8%
Having a clear criteria for high expectations 20.7%
Being explicit about the criteria for what constitutes quality performance 18.4%
Being clear with students that it is necessary to take risks and work hard to master challenging academic work 23.0%
I am comfortable with these components and do not need additional support 41.4%
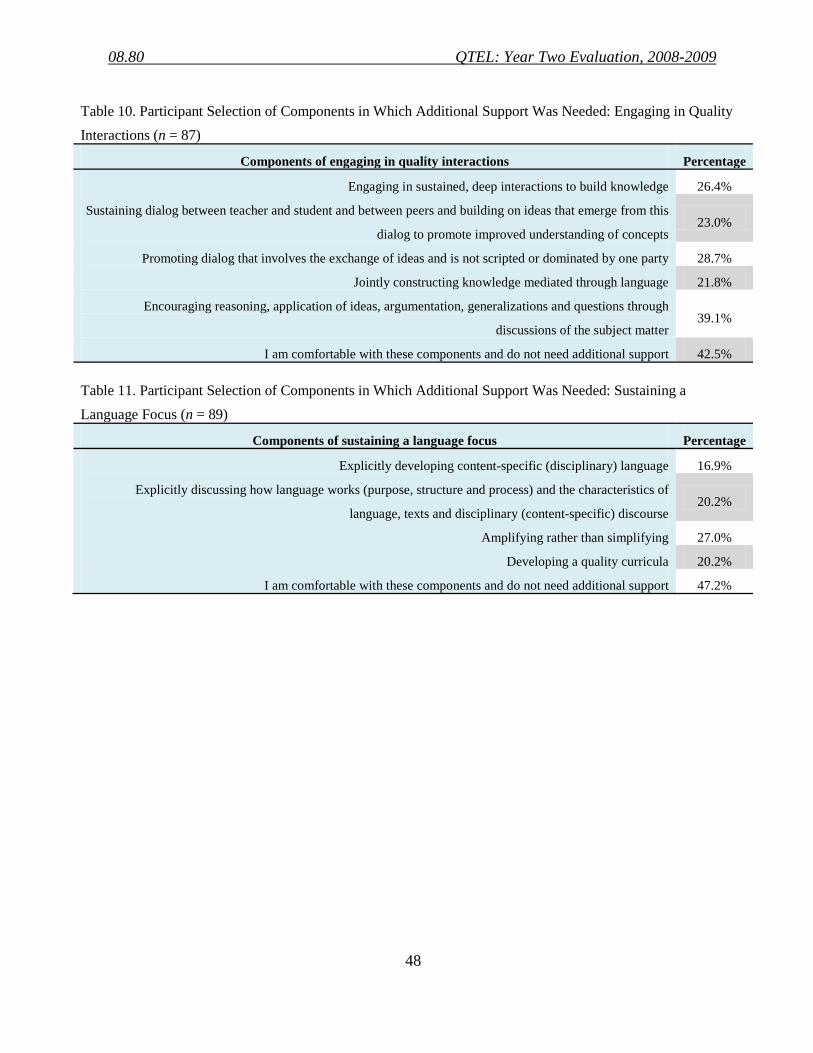
08.80 QTEL: Year Two Evaluation, 2008-2009
48
Table 10. Participant Selection of Components in Which Additional Support Was Needed: Engaging in Quality Interactions (n = 87)
Components of engaging in quality interactions Percentage
Engaging in sustained, deep interactions to build knowledge 26.4%
Sustaining dialog between teacher and student and between peers and building on ideas that emerge from this
dialog to promote improved understanding of concepts 23.0%
Promoting dialog that involves the exchange of ideas and is not scripted or dominated by one party 28.7%
Jointly constructing knowledge mediated through language 21.8%
Encouraging reasoning, application of ideas, argumentation, generalizations and questions through
discussions of the subject matter 39.1%
I am comfortable with these components and do not need additional support 42.5%
Table 11. Participant Selection of Components in Which Additional Support Was Needed: Sustaining a Language Focus (n = 89)
Components of sustaining a language focus Percentage
Explicitly developing content-specific (disciplinary) language 16.9%
Explicitly discussing how language works (purpose, structure and process) and the characteristics of
language, texts and disciplinary (content-specific) discourse 20.2%
Amplifying rather than simplifying 27.0%
Developing a quality curricula 20.2%
I am comfortable with these components and do not need additional support 47.2%
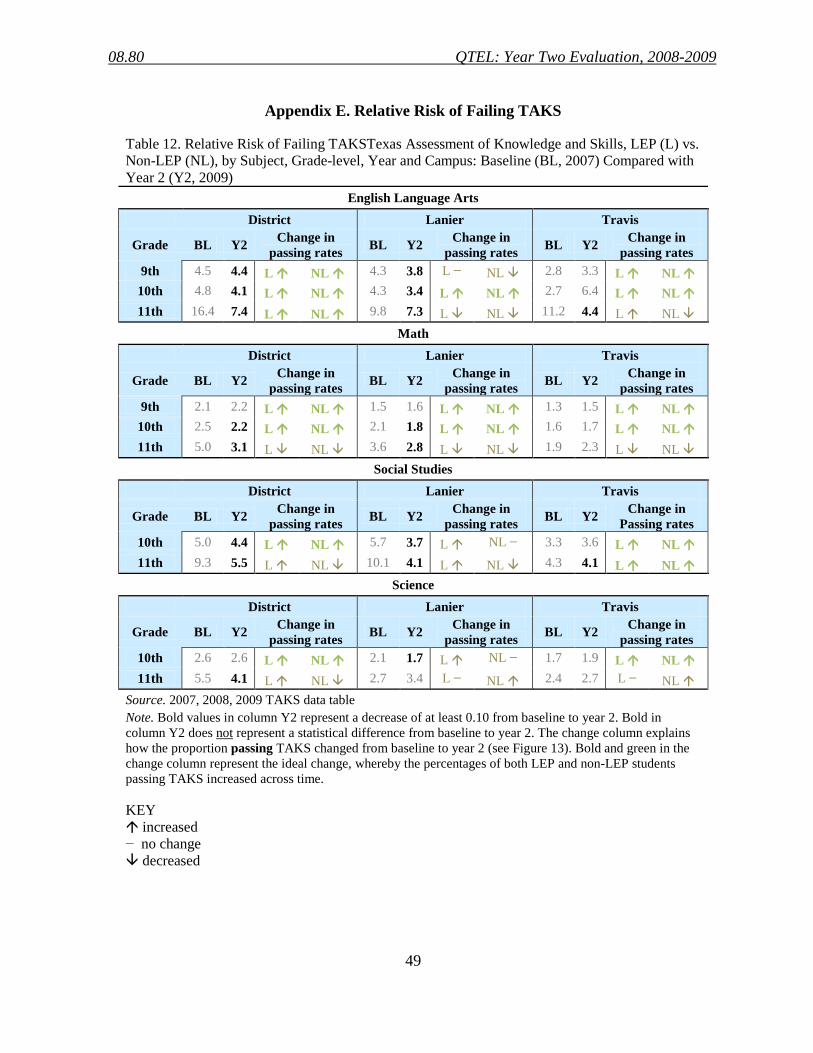
08.80 QTEL: Year Two Evaluation, 2008-2009
49
Appendix E. Relative Risk of Failing TAKS
Table 12. Relative Risk of Failing TAKSTexas Assessment of Knowledge and Skills, LEP (L) vs. Non-LEP (NL), by Subject, Grade-level, Year and Campus: Baseline (BL, 2007) Compared with Year 2 (Y2, 2009)
English Language Arts District Lanier Travis
Grade BL Y2 Change in passing rates BL Y2 Change in
passing rates BL Y2 Change in passing rates
9th 4.5 4.4 L NL 4.3 3.8 L − NL 2.8 3.3 L NL 10th 4.8 4.1 L NL 4.3 3.4 L NL 2.7 6.4 L NL 11th 16.4 7.4 L NL 9.8 7.3 L NL 11.2 4.4 L NL
Math District Lanier Travis
Grade BL Y2 Change in passing rates BL Y2 Change in
passing rates BL Y2 Change in passing rates
9th 2.1 2.2 L NL 1.5 1.6 L NL 1.3 1.5 L NL 10th 2.5 2.2 L NL 2.1 1.8 L NL 1.6 1.7 L NL 11th 5.0 3.1 L NL 3.6 2.8 L NL 1.9 2.3 L NL
Social Studies District Lanier Travis
Grade BL Y2 Change in passing rates BL Y2 Change in
passing rates BL Y2 Change in Passing rates
10th 5.0 4.4 L NL 5.7 3.7 L NL − 3.3 3.6 L NL 11th 9.3 5.5 L NL 10.1 4.1 L NL 4.3 4.1 L NL
Science District Lanier Travis
Grade BL Y2 Change in passing rates BL Y2 Change in
passing rates BL Y2 Change in passing rates
10th 2.6 2.6 L NL 2.1 1.7 L NL − 1.7 1.9 L NL 11th 5.5 4.1 L NL 2.7 3.4 L − NL 2.4 2.7 L − NL
Source. 2007, 2008, 2009 TAKS data table Note. Bold values in column Y2 represent a decrease of at least 0.10 from baseline to year 2. Bold in column Y2 does not represent a statistical difference from baseline to year 2. The change column explains how the proportion passing TAKS changed from baseline to year 2 (see Figure 13). Bold and green in the change column represent the ideal change, whereby the percentages of both LEP and non-LEP students passing TAKS increased across time. KEY increased − no change decreased
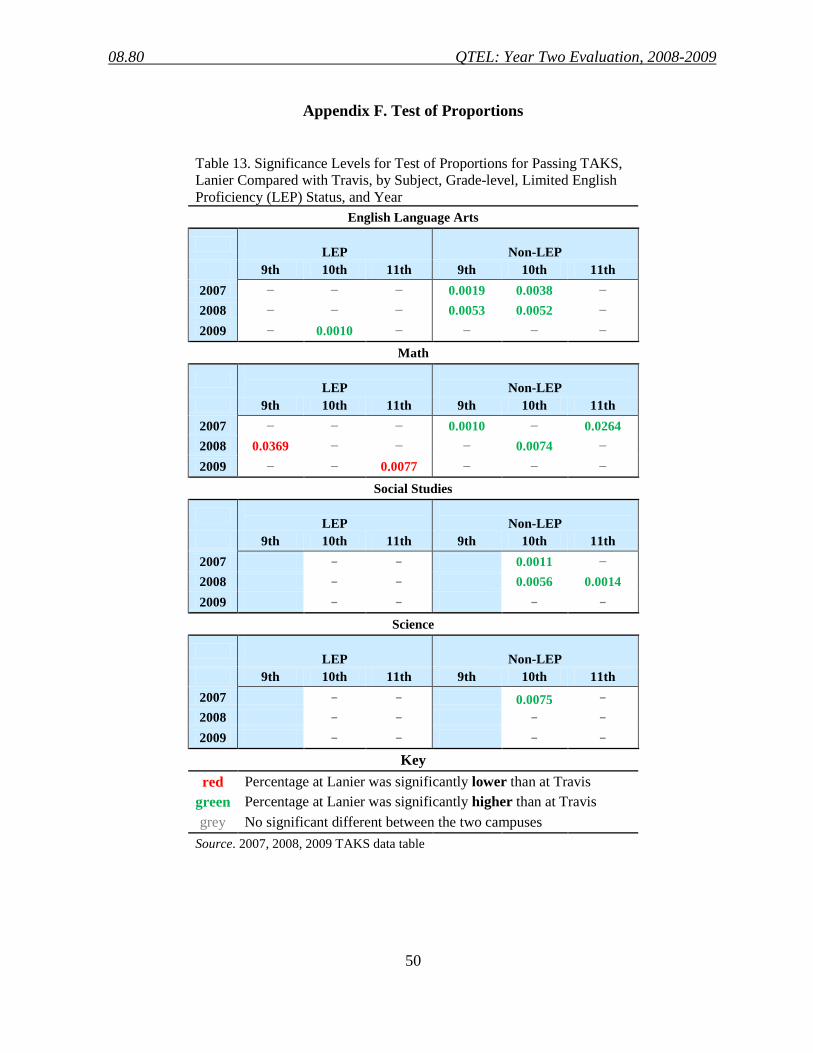
08.80 QTEL: Year Two Evaluation, 2008-2009
50
Appendix F. Test of Proportions
Table 13. Significance Levels for Test of Proportions for Passing TAKS, Lanier Compared with Travis, by Subject, Grade-level, Limited English Proficiency (LEP) Status, and Year
English Language Arts
LEP
Non-LEP
9th 10th 11th 9th 10th 11th 2007 − − − 0.0019 0.0038 − 2008 − − − 0.0053 0.0052 − 2009 − 0.0010 − − − −
Math
LEP
Non-LEP
9th 10th 11th 9th 10th 11th 2007 − − − 0.0010 − 0.0264 2008 0.0369 − − − 0.0074 − 2009 − − 0.0077 − − −
Social Studies
LEP
Non-LEP
9th 10th 11th 9th 10th 11th 2007 − − 0.0011 − 2008 − − 0.0056 0.0014 2009 − − − −
Science
LEP
Non-LEP
9th 10th 11th 9th 10th 11th 2007 − − 0.0075 −
2008 − − − −
2009 − − − −
Key red Percentage at Lanier was significantly lower than at Travis
green Percentage at Lanier was significantly higher than at Travis grey No significant different between the two campuses
Source. 2007, 2008, 2009 TAKS data table

08.80 QTEL: Year Two Evaluation, 2008-2009
51
Appendix G. Test of Means.
Table 14. Test of Means Results, by Subject, Grade Level, Year, Campus, and Limited English Proficiency (LEP) Status All students
Lanier District Travis District Lanier Travis 9th 10th 11th 9th 10th 11th 9th 10th 11th
2007 E M E M SS SCI E M SS SCI E M E M SS SCI E M SS SCI E M E M SS SCI E M SS SCI 2008 E M E M SS SCI E M SS SCI E M E M SS SCI E M SS SCI E M E M SS SCI E M SS SCI 2009 E M E M SS SCI E M SS SCI E M E M SS SCI E M SS SCI E M E M SS SCI E M SS SCI
LEP
Lanier District Travis District Lanier Travis 9th 10th 11th 9th 10th 11th 9th 10th 11th
2007 E M E M SS SCI E M SS SCI E M E M SS SCI E M SS SCI E M E M SS SCI E M SS SCI 2008 E M E M SS SCI E M SS SCI E M E M SS SCI E M SS SCI E M E M SS SCI E M SS SCI 2009 E M E M SS SCI E M SS SCI E M E M SS SCI E M SS SCI E M E M SS SCI E M SS SCI
Non-LEP
Lanier District Travis District Lanier Travis 9th 10th 11th 9th 10th 11th 9th 10th 11th
2007 E M E M SS SCI E M SS SCI E M E M SS SCI E M SS SCI E M E M SS SCI E M SS SCI 2008 E M E M SS SCI E M SS SCI E M E M SS SCI E M SS SCI E M E M SS SCI E M SS SCI 2009 E M E M SS SCI E M SS SCI E M E M SS SCI E M SS SCI E M E M SS SCI E M SS SCI
Key
red Mean was significantly lower than comparison group mean E English language arts SS Social studies
green Mean was significantly higher than comparison group mean M Math SCI Science
grey No significant different between the two group means

08.80 QTEL: Year Two Evaluation, 2008-2009
52
REFERENCES Fullan, M. (2007). The new meaning of educational change 4th edition. New York: Teachers
College Press.
Shulman, L. S. (1995). Fostering communities of teachers as learners. Report to the Andrew W. Mellon Foundation, Stanford, CA: Stanford University.
Shulman, L. S., & Sherin, M. G. (2004). Fostering communities of teachers as learners: disciplinary perspectives. Journal of Curriculum Studies, 36(2), 135–140.
Walqui, A. (2006). Scaffolding instruction for English language learners: A conceptual framework. International Journal of Bilingual Education and Bilingualism, 9(2), 159–180.
Walqui, A. (2007). The development of teacher expertise to work with adolescent English learners: A model and a few priorities. In L. S. Verplaetse & N. Migliacci (Eds.), Inclusive pedagogy for English language learners: A handbook of research-informed practices (pp. 103–126). New York: Routledge.
AUSTIN INDEPENDENT SCHOOL DISTRICT SUPERINTENDENT OF SCHOOLS
Meria J. Carstarphen, Ed.D.
OFFICE OF ACCOUNTABILITY William H. Caritj, M.Ed.
DEPARTMENT OF PROGRAM EVALUATION
Holly Williams, Ph.D. Karen Looby, Ph.D.
AUTHOR
Ginger L. Gossman, Ph.D.
CONTRIBUTOR Melissa Hutchins, M.A.
BOARD OF TRUSTEES Mark Williams, President
Vincent Torres, M.S., Vice President Lori Moya, Secretary
Cheryl Bradley Annette LoVoi, M.A.
Christine Brister Robert Schneider
Karen Dulaney Smith Sam Guzman
Publication Number 08.80 November 2009


![QuEST: Quality English and Science Teaching€¦ · Student Chart 7.4B Spanish English Cognate Letter(s) in Spanish, not in English Cognate sustancias substances químicas [chemicals]](https://img.pdfslide.us/doc/110x75/6146837f7599b83a5f00454c/quest-quality-english-and-science-teaching-student-chart-74b-spanish-english-cognate.jpg)