Embed Size (px)
Citation preview

18
PROGRAM Performance
STATE PERFORMANCE

19
ALABAMA
Figure 3. Collecting Regular On-Time Payments
Performance Measures 2008 2009 2010 2011 2012
Current Support Collections (%) 52.77 50.96 50.20 50.97 51.29
Arrearage Collections (%) 57.03 58.61 55.42 56.09 57.02
Table 5. Other Incentive Performance Measures
Performance Measures 2008 2009 2010 2011 2012
Statewide Paternity Establishment (%) NA NA NA NA NA
IV-D Paternity Establishment (%) 86.40 94.29 94.76 94.63 91.79
Support Order Establishment (%) 82.76 82.76 82.36 82.56 82.86
Cost-Effectiveness ($) 4.92 4.27 4.28 4.46 4.83
Table 6. Total Number of Children in the Child Support Program
2008 2009 2010 2011 2012
Number of Children in Child Support Cases 207,881 217,806 219,269 218,933 217,650

2020
ALABAMA (cont.)
Figure 4. Total Distributed Collections and Total Administrative Expenditures ($ Millions)
2008 2009 2010 2011 2012
Total Distributed Collections ($) 280.24 265.98 268.44 280.43 290.57
Total Distributed to Families ($) 263.00 251.65 255.45 265.70 276.35
Total Administrative Expenditures ($) 62.38 68.36 68.95 69.26 66.34
Table 7. Percentage of Cases with Support Orders that had Collections by Assistance Type
2008 2009 2010 2011 2012
Current Assistance (%) 55.43 53.50 50.29 49.94 49.55
Former Assistance (%) 67.51 67.24 62.61 63.35 63.21
Never Assistance (%) 76.22 77.83 75.55 76.16 76.22
Table 8. Average Collections per Case with Support Orders by Assistance Type
2008 2009 2010 2011 2012
Current Assistance ($) 1,088 980 1,044 1,168 1,261
Former Assistance ($) 1,900 1,622 1,735 1,765 1,789
Never Assistance ($) 2,398 2,483 2,564 2,618 2,675
21
ALASKA
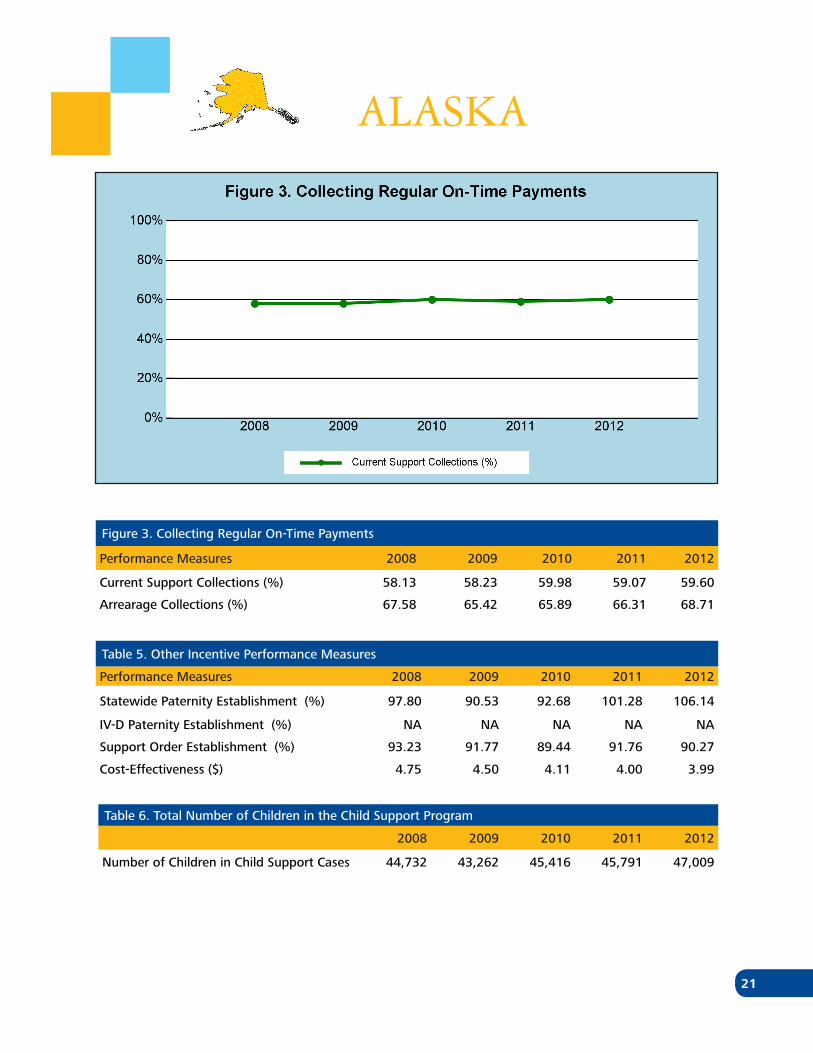
Figure 3. Collecting Regular On-Time Payments
Performance Measures 2008 2009 2010 2011 2012
Current Support Collections (%) 58.13 58.23 59.98 59.07 59.60
Arrearage Collections (%) 67.58 65.42 65.89 66.31 68.71
Table 5. Other Incentive Performance Measures
Performance Measures 2008 2009 2010 2011 2012
Statewide Paternity Establishment (%) 97.80 90.53 92.68 101.28 106.14
IV-D Paternity Establishment (%) NA NA NA NA NA
Support Order Establishment (%) 93.23 91.77 89.44 91.76 90.27
Cost-Effectiveness ($) 4.75 4.50 4.11 4.00 3.99
Table 6. Total Number of Children in the Child Support Program
2008 2009 2010 2011 2012
Number of Children in Child Support Cases 44,732 43,262 45,416 45,791 47,009

2222
ALASKA (cont.)
Figure 4. Total Distributed Collections and Total Administrative Expenditures ($ Millions)
2008 2009 2010 2011 2012
Total Distributed Collections ($) 100.31 96.52 93.41 97.48 99.58
Total Distributed to Families ($) 84.80 83.03 83.00 86.07 88.28
Total Administrative Expenditures ($) 24.01 24.37 25.60 27.56 28.14
Table 7. Percentage of Cases with Support Orders that had Collections by Assistance Type
2008 2009 2010 2011 2012
Current Assistance (%) 65.39 61.07 58.87 61.52 65.83
Former Assistance (%) 74.70 75.49 72.99 73.52 75.26
Never Assistance (%) 83.86 83.22 82.61 81.83 82.28
Table 8. Average Collections per Case with Support Orders by Assistance Type
2008 2009 2010 2011 2012
Current Assistance ($) 1,943 1,486 1,357 1,545 1,591
Former Assistance ($) 2,679 2,694 2,529 2,497 2,412
Never Assistance ($) 3,927 3,917 3,886 3,827 3,911

23
ARIZONA
Figure 3. Collecting Regular On-Time Payments
Performance Measures 2008 2009 2010 2011 2012
Current Support Collections (%) 50.91 49.99 50.82 51.45 52.28
Arrearage Collections (%) 58.28 56.14 54.14 54.69 54.46
Table 5. Other Incentive Performance Measures
Performance Measures 2008 2009 2010 2011 2012
Statewide Paternity Establishment (%) NA NA NA NA NA
IV-D Paternity Establishment (%) 110.86 116.68 118.29 126.33 130.30
Support Order Establishment (%) 79.40 81.12 83.79 85.09 84.92
Cost-Effectiveness ($) 4.39 4.97 5.84 6.03 5.90
Table 6. Total Number of Children in the Child Support Program
2008 2009 2010 2011 2012
Number of Children in Child Support Cases 230,790 226,952 214,442 205,157 200,014
2424
ARIZONA (cont.)
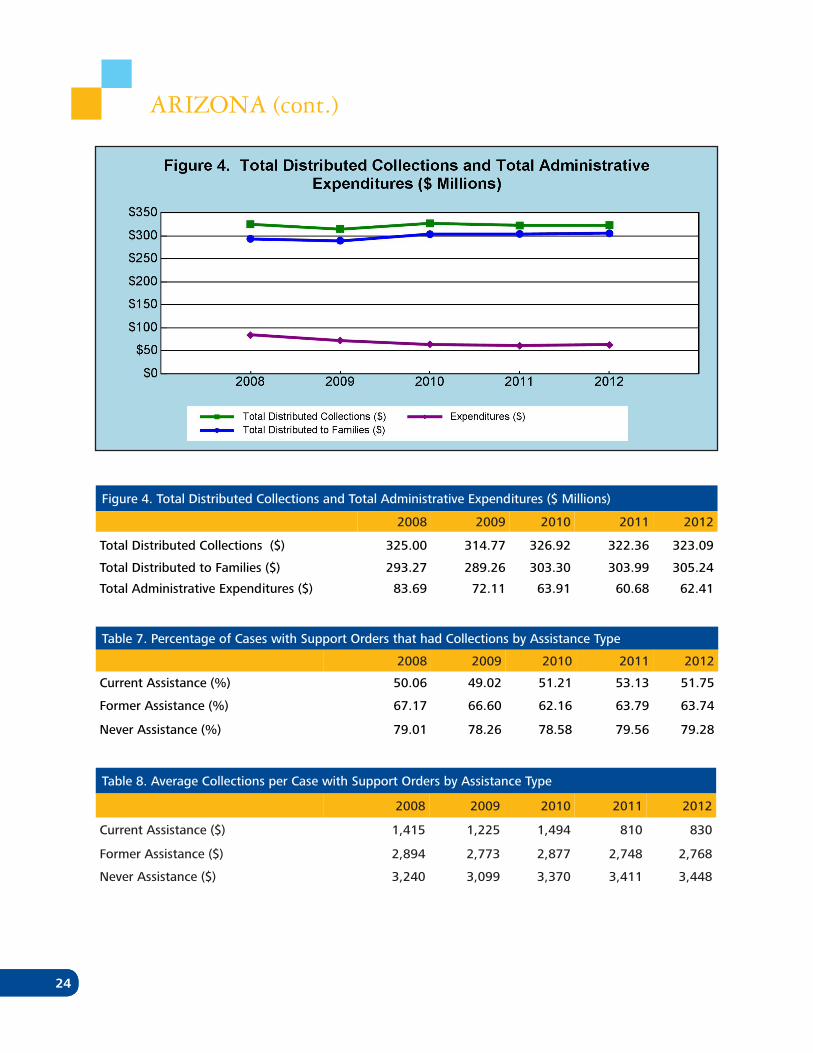
Figure 4. Total Distributed Collections and Total Administrative Expenditures ($ Millions)
2008 2009 2010 2011 2012
Total Distributed Collections ($) 325.00 314.77 326.92 322.36 323.09
Total Distributed to Families ($) 293.27 289.26 303.30 303.99 305.24
Total Administrative Expenditures ($) 83.69 72.11 63.91 60.68 62.41
Table 7. Percentage of Cases with Support Orders that had Collections by Assistance Type
2008 2009 2010 2011 2012
Current Assistance (%) 50.06 49.02 51.21 53.13 51.75
Former Assistance (%) 67.17 66.60 62.16 63.79 63.74
Never Assistance (%) 79.01 78.26 78.58 79.56 79.28
Table 8. Average Collections per Case with Support Orders by Assistance Type
2008 2009 2010 2011 2012
Current Assistance ($) 1,415 1,225 1,494 810 830
Former Assistance ($) 2,894 2,773 2,877 2,748 2,768
Never Assistance ($) 3,240 3,099 3,370 3,411 3,448

25
ARKANSAS
Figure 3. Collecting Regular On-Time Payments
Performance Measures 2008 2009 2010 2011 2012
Current Support Collections (%) 61.93 62.21 62.31 61.58 62.80
Arrearage Collections (%) 66.82 66.83 66.43 66.14 66.66
Table 5. Other Incentive Performance Measures
Performance Measures 2008 2009 2010 2011 2012
Statewide Paternity Establishment (%) NA NA NA NA NA
IV-D Paternity Establishment (%) 95.32 98.14 97.22 98.11 99.74
Support Order Establishment (%) 83.88 83.73 84.73 85.30 86.22
Cost-Effectiveness ($) 4.56 4.60 3.68 4.28 4.72
Table 6. Total Number of Children in the Child Support Program
2008 2009 2010 2011 2012
Number of Children in Child Support Cases 133,394 133,387 131,651 131,382 131,297

2626
ARKANSAS (cont.)
Figure 4. Total Distributed Collections and Total Administrative Expenditures ($ Millions)
2008 2009 2010 2011 2012
Total Distributed Collections ($) 197.54 202.02 206.64 211.06 219.65
Total Distributed to Families ($) 188.40 194.47 199.85 204.16 213.17
Total Administrative Expenditures ($) 46.99 48.55 61.95 54.35 51.26
Table 7. Percentage of Cases with Support Orders that had Collections by Assistance Type
2008 2009 2010 2011 2012
Current Assistance (%) 63.58 63.44 62.15 61.32 60.38
Former Assistance (%) 72.89 74.62 72.69 72.34 72.15
Never Assistance (%) 90.18 90.99 89.99 89.72 90.31
Table 8. Average Collections per Case with Support Orders by Assistance Type
2008 2009 2010 2011 2012
Current Assistance ($) 878 849 880 940 975
Former Assistance ($) 2,190 2,167 2,223 2,215 2,222
Never Assistance ($) 2,671 2,730 2,831 2,885 2,963

27
CALIFORNIA
Figure 3. Collecting Regular On-Time Payments
Performance Measures 2008 2009 2010 2011 2012
Current Support Collections (%) 52.84 53.43 55.96 58.56 61.37
Arrearage Collections (%) 59.14 59.44 60.29 61.58 63.52
Table 5. Other Incentive Performance Measures
Performance Measures 2008 2009 2010 2011 2012
Statewide Paternity Establishment (%) 101.41 103.42 102.57 106.95 101.62
IV-D Paternity Establishment (%) NA NA NA NA NA
Support Order Establishment (%) 80.17 78.82 82.55 85.81 87.88
Cost-Effectiveness ($) 1.96 2.10 2.38 2.29 2.47
Table 6. Total Number of Children in the Child Support Program
2008 2009 2010 2011 2012
Number of Children in Child Support Cases 1,811,316 1,877,346 1,690,200 1,523,438 1,427,617

2828
CALIFORNIA (cont.)
Figure 4. Total Distributed Collections and Total Administrative Expenditures ($ Millions)
2008 2009 2010 2011 2012
Total Distributed Collections ($) 2,252.67 2,145.38 2,151.50 2,161.57 2,208.75
Total Distributed to Families ($) 1,748.12 1,735.03 1,725.42 1,732.82 1,786.86
Total Administrative Expenditures ($) 1,198.16 1,067.83 943.32 985.33 932.70
Table 7. Percentage of Cases with Support Orders that had Collections by Assistance Type
2008 2009 2010 2011 2012
Current Assistance (%) 43.76 41.26 41.61 42.67 43.32
Former Assistance (%) 60.27 59.56 60.93 62.21 64.04
Never Assistance (%) 62.49 64.07 67.88 72.32 76.58
Table 8. Average Collections per Case with Support Orders by Assistance Type
2008 2009 2010 2011 2012
Current Assistance ($) 2,212 2,369 2,361 2,569 2,475
Former Assistance ($) 2,807 2,586 2,616 2,527 2,588
Never Assistance ($) 3,747 3,939 3,973 4,041 4,148

29
COLORADO
Figure 3. Collecting Regular On-Time Payments
Performance Measures 2008 2009 2010 2011 2012
Current Support Collections (%) 61.93 61.96 62.70 63.32 62.74
Arrearage Collections (%) 70.60 70.66 69.65 69.88 69.68
Table 5. Other Incentive Performance Measures
Performance Measures 2008 2009 2010 2011 2012
Statewide Paternity Establishment (%) 94.93 92.85 97.37 103.02 106.71
IV-D Paternity Establishment (%) NA NA NA NA NA
Support Order Establishment (%) 87.51 87.72 88.09 86.46 86.82
Cost-Effectiveness ($) 4.25 4.56 4.19 4.49 4.20
Table 6. Total Number of Children in the Child Support Program
2008 2009 2010 2011 2012
Number of Children in Child Support Cases 146,987 147,618 147,748 153,253 157,521

3030
COLORADO (cont.)
Figure 4. Total Distributed Collections and Total Administrative Expenditures ($ Millions)
2008 2009 2010 2011 2012
Total Distributed Collections ($) 284.24 281.29 282.63 289.11 293.25
Total Distributed to Families ($) 262.47 263.38 265.27 272.02 276.54
Total Administrative Expenditures ($) 74.68 68.86 75.40 72.02 77.83
Table 7. Percentage of Cases with Support Orders that had Collections by Assistance Type
2008 2009 2010 2011 2012
Current Assistance (%) 262.17 223.36 204.44 187.99 173.52
Former Assistance (%) 70.73 71.55 71.45 70.93 70.35
Never Assistance (%) 90.88 92.18 91.64 91.47 90.56
Table 8. Average Collections per Case with Support Orders by Assistance Type
2008 2009 2010 2011 2012
Current Assistance ($) 805 698 677 687 676
Former Assistance ($) 2,296 2,234 2,233 2,181 2,140
Never Assistance ($) 3,766 3,652 3,616 3,671 3,600

31
CONNECTICUT
Figure 3. Collecting Regular On-Time Payments
Performance Measures 2008 2009 2010 2011 2012
Current Support Collections (%) 57.76 58.31 58.48 58.16 57.80
Arrearage Collections (%) 61.79 62.36 59.26 59.16 59.49
Table 5. Other Incentive Performance Measures
Performance Measures 2008 2009 2010 2011 2012
Statewide Paternity Establishment (%) NA NA NA NA NA
IV-D Paternity Establishment (%) 92.51 92.76 93.91 94.47 95.43
Support Order Establishment (%) 72.00 72.15 73.22 73.70 75.19
Cost-Effectiveness ($) 3.83 3.62 3.71 3.65 3.77
Table 6. Total Number of Children in the Child Support Program
2008 2009 2010 2011 2012
Number of Children in Child Support Cases 183,028 181,829 181,459 182,231 186,810

3232
CONNECTICUT (cont.)
Figure 4. Total Distributed Collections and Total Administrative Expenditures ($ Millions)
2008 2009 2010 2011 2012
Total Distributed Collections ($) 262.95 253.25 250.38 248.73 245.37
Total Distributed to Families ($) 218.17 218.14 218.14 216.37 213.42
Total Administrative Expenditures ($) 73.69 75.02 72.48 72.97 69.64
Table 7. Percentage of Cases with Support Orders that had Collections by Assistance Type
2008 2009 2010 2011 2012
Current Assistance (%) 53.71 53.36 49.93 49.95 47.57
Former Assistance (%) 70.01 70.60 65.54 65.11 61.39
Never Assistance (%) 69.85 68.05 64.30 62.11 58.88
Table 8. Average Collections per Case with Support Orders by Assistance Type
2008 2009 2010 2011 2012
Current Assistance ($) 3,441 3,081 3,312 3,316 3,546
Former Assistance ($) 2,523 2,400 2,501 2,485 2,651
Never Assistance ($) 3,085 3,053 3,145 3,106 2,701

33
DELAWARE
Figure 3. Collecting Regular On-Time Payments
Performance Measures 2008 2009 2010 2011 2012
Current Support Collections (%) 60.00 58.98 59.96 59.79 59.68
Arrearage Collections (%) 62.50 62.37 58.01 57.42 55.84
Table 5. Other Incentive Performance Measures
Performance Measures 2008 2009 2010 2011 2012
Statewide Paternity Establishment (%) NA NA NA NA NA
IV-D Paternity Establishment (%) 89.02 81.75 81.26 77.98 76.92
Support Order Establishment (%) 67.43 66.82 67.09 66.41 66.63
Cost-Effectiveness ($) 3.09 2.78 3.22 2.23 1.73
Table 6. Total Number of Children in the Child Support Program
2008 2009 2010 2011 2012
Number of Children in Child Support Cases 73,909 77,694 79,451 80,808 82,090

3434
DELAWARE (cont.)
Figure 4. Total Distributed Collections and Total Administrative Expenditures ($ Millions)
2008 2009 2010 2011 2012
Total Distributed Collections ($) 74.17 73.58 72.82 73.80 74.45
Total Distributed to Families ($) 68.31 68.27 68.29 69.23 70.09
Total Administrative Expenditures ($) 27.01 29.54 25.34 36.69 47.36
Table 7. Percentage of Cases with Support Orders that had Collections by Assistance Type
2008 2009 2010 2011 2012
Current Assistance (%) 54.44 54.15 51.32 49.85 47.93
Former Assistance (%) 58.84 56.29 52.08 52.45 51.59
Never Assistance (%) 70.18 65.86 63.61 63.92 63.29
Table 8. Average Collections per Case with Support Orders by Assistance Type
2008 2009 2010 2011 2012
Current Assistance ($) 1,633 1,519 1,483 1,563 1,555
Former Assistance ($) 2,009 1,975 2,000 1,951 1,899
Never Assistance ($) 3,342 3,258 3,234 3,246 3,278

35
DISTRICT OF COLUMBIA
Figure 3. Collecting Regular On-Time Payments
Performance Measures 2008 2009 2010 2011 2012
Current Support Collections (%) 57.29 57.43 58.09 59.97 60.94
Arrearage Collections (%) 47.96 50.48 49.71 51.89 51.94
Table 5. Other Incentive Performance Measures
Performance Measures 2008 2009 2010 2011 2012
Statewide Paternity Establishment (%) 83.25 86.30 88.35 90.00 90.01
IV-D Paternity Establishment (%) NA NA NA NA NA
Support Order Establishment (%) 54.80 61.53 64.76 68.20 68.86
Cost-Effectiveness ($) 2.76 2.02 2.10 2.13 1.89
Table 6. Total Number of Children in the Child Support Program
2008 2009 2010 2011 2012
Number of Children in Child Support Cases 60,485 52,667 50,084 47,216 46,291

3636
DISTRICT OF COLUMBIA (cont.)
Figure 4. Total Distributed Collections and Total Administrative Expenditures ($ Millions)
2008 2009 2010 2011 2012
Total Distributed Collections ($) 53.38 52.66 50.73 50.83 50.37
Total Distributed to Families ($) 46.41 46.78 45.27 45.13 44.62
Total Administrative Expenditures ($) 21.80 29.50 27.11 26.85 30.14
Table 7. Percentage of Cases with Support Orders that had Collections by Assistance Type
2008 2009 2010 2011 2012
Current Assistance (%) 55.36 57.10 55.56 60.65 60.16
Former Assistance (%) 61.51 61.08 56.69 56.85 56.17
Never Assistance (%) 59.94 61.55 58.27 59.25 59.39
Table 8. Average Collections per Case with Support Orders by Assistance Type
2008 2009 2010 2011 2012
Current Assistance ($) 1,400 1,484 1,444 1,401 1,474
Former Assistance ($) 2,400 2,456 2,479 2,360 2,309
Never Assistance ($) 3,318 3,204 3,267 3,321 3,429

37
FLORIDA
Figure 3. Collecting Regular On-Time Payments
Performance Measures 2008 2009 2010 2011 2012
Current Support Collections (%) 52.38 52.00 52.16 53.06 50.98
Arrearage Collections (%) 62.31 60.42 59.93 60.76 59.71
Table 5. Other Incentive Performance Measures
Performance Measures 2008 2009 2010 2011 2012
Statewide Paternity Establishment (%) 90.69 90.05 91.46 94.37 96.64
IV-D Paternity Establishment (%) NA NA NA NA NA
Support Order Establishment (%) 73.85 72.86 73.50 75.67 73.70
Cost-Effectiveness ($) 4.33 4.85 5.12 5.44 5.88
Table 6. Total Number of Children in the Child Support Program
2008 2009 2010 2011 2012
Number of Children in Child Support Cases 891,525 930,711 965,926 970,128 1,004,525

3838
FLORIDA (cont.)
Figure 4. Total Distributed Collections and Total Administrative Expenditures ($ Millions)
2008 2009 2010 2011 2012
Total Distributed Collections ($) 1,260.91 1,289.35 1,358.11 1,508.85 1,466.27
Total Distributed to Families ($) 1,192.05 1,229.36 1,301.48 1,437.58 1,423.89
Total Administrative Expenditures ($) 314.33 293.70 291.92 301.65 270.55
Table 7. Percentage of Cases with Support Orders that had Collections by Assistance Type
2008 2009 2010 2011 2012
Current Assistance (%) 52.63 50.64 53.97 58.45 67.69
Former Assistance (%) 76.05 75.67 73.39 74.32 82.01
Never Assistance (%) 82.43 82.33 81.15 82.68 102.93
Table 8. Average Collections per Case with Support Orders by Assistance Type
2008 2009 2010 2011 2012
Current Assistance ($) 1,325 1,386 1,152 1,334 766
Former Assistance ($) 2,672 2,602 2,630 2,692 2,033
Never Assistance ($) 2,987 3,018 3,138 3,264 2,696

39
GEORGIA
Figure 3. Collecting Regular On-Time Payments
Performance Measures 2008 2009 2010 2011 2012
Current Support Collections (%) 58.16 59.32 60.67 60.79 61.67
Arrearage Collections (%) 67.33 69.19 68.17 66.75 66.44
Table 5. Other Incentive Performance Measures
Performance Measures 2008 2009 2010 2011 2012
Statewide Paternity Establishment (%) 102.10 NA 92.52 98.80 96.53
IV-D Paternity Establishment (%) NA 112.41 NA NA NA
Support Order Establishment (%) 83.52 85.38 84.33 83.44 86.59
Cost-Effectiveness ($) 6.59 7.22 6.58 7.02 6.83
Table 6. Total Number of Children in the Child Support Program
2008 2009 2010 2011 2012
Number of Children in Child Support Cases 372,030 495,015 524,023 538,139 529,258

4040
GEORGIA (cont.)
Figure 4. Total Distributed Collections and Total Administrative Expenditures ($ Millions)
2008 2009 2010 2011 2012
Total Distributed Collections ($) 584.77 588.95 603.36 632.45 647.28
Total Distributed to Families ($) 554.03 561.47 577.93 602.97 619.44
Total Administrative Expenditures ($) 99.28 90.57 101.73 99.78 104.85
Table 7. Percentage of Cases with Support Orders that had Collections by Assistance Type
2008 2009 2010 2011 2012
Current Assistance (%) 91.56 77.87 72.10 73.89 62.39
Former Assistance (%) 65.53 66.33 63.70 64.41 73.05
Never Assistance (%) 66.49 65.56 63.63 62.59 73.20
Table 8. Average Collections per Case with Support Orders by Assistance Type
2008 2009 2010 2011 2012
Current Assistance ($) 501 580 625 673 1,242
Former Assistance ($) 2,569 2,538 2,883 2,940 2,479
Never Assistance ($) 3,144 3,231 3,166 3,267 2,821


![Order Child Support Guidelines Amendments to Child Support ... · Use of the Child Support Guidelines As a Rebuttable Presumption [No changes.] 3. ... child support award only when](https://img.pdfslide.us/doc/110x75/5fda9d8a0c3f33644e6c74bd/order-child-support-guidelines-amendments-to-child-support-use-of-the-child.jpg)