Embed Size (px)
Citation preview
OFFICE ENERGY NEEDS AND INDOOR COMFORT WITH DIFFERENT TYPES OF EXTERNAL ROLLER SHADES IN A SOUTHERN EUROPE CLIMATE
Anna Maria Atzeri1, Francesca Cappelletti2,
Andrea Gasparella3 and Athanasios Tzempelikos4 1 Free University of Bozen-Bolzano, Bolzano, Italy, [email protected]
2 University IUAV of Venezia, Venezia, Italy, [email protected] 3 Free University of Bozen-Bolzano, Bolzano, Italy, [email protected]
4 Purdue University, West Lafayette, Indiana (USA), [email protected]
ABSTRACT In this paper, the effect of the windows shading systems both on visual and thermal comfort and on the total building energy needs (for heating, cooling and artificial lighting) has been analyzed. An open-space office module with different windows characteristics has been simulated with EnergyPlus 7.2, controlling the internal conditions with appropriate comfort setpoints. Different window distributions (on a single façade or on opposite façades), and two orientations have been analysed, varying the glazed area and the glazing type. Three external moveable roller shades have been considered, controlled by two setpoint variables: the glare index and the total solar radiation incident on the windows.
INTRODUCTION The office building category is often characterized by an extensive use of glazing façades. The presence of large transparent components and the application of shading devices have been usually object of analysis because solar gain values can largely influence the building thermal energy balance both in summer and winter seasons, the lighting energy demand and both the thermal and visual comfort. Some authors have compared the influence of different kinds of glazing and shades on the heating and cooling energy needs in office buildings with a parametrical approach in order to evaluate different opaque envelope composition, floor shape ratio, windows area (Eskin and Türkmen, 2008; Shen and Tzempelikos, 2012a; Shen and Tzempelikos, 2012b; Zhu et al., 2013). Tsikaloudaki et al. (2012) carried out a similar analysis on a residential building and proposed some correlations. Some studies focus on the assessment of the thermal and visual efficiency of different shading devices (David et al., 2011 Kuhn, 2006). David et al. (2011), calculated by means of dynamic simulation, and evaluate their relation with the solar shading coefficient, cooling energy demand, daylight autonomy and sun patch index on work plane. Tzempelikos et al. (2010) introduced a transient thermal comfort model to investigate separately the impact of different shades and three kinds of glazing on mean radiant temperature, operative temperature, thermal discomfort index, radiant asymmetry, and daily heating needs for a perimeter office with a high
window area. Two representative days for winter conditions in Montreal (Canada) have been taken in consideration. The relation between the use of shading devices and availability of natural light was investigated by Kim et al. (2012) who suggest that optimal shading systems should increase daylight levels while controlling the amount of excessive sunlight. The effect of different shading devices has been often analyzed considering different control strategies in order to optimize the visual comfort and minimizing the artificial lighting demand (Ihm et al, 2011; Mahdavi and Dervishi, 2011; Correia da Silva et al., 2012). Moreover, some authors optimized the selection of the window size and of the properties of shades with reference to the heating, cooling and lighting energy performance considering different control strategies (Tzempelikos and Athienitis, 2007). In general, all the literature on solar shading devices is oriented to the evaluation of the strategies for the daylight harvesting in order to reduce lighting consumption, for the cooling or heating energy saving and for the indoor thermal comfort, but only a few authors analyze all these aspects together (Nielsen et al., 2011). By means of dynamic simulation they calculate the energy demand and the daylight level of a single office comparing different situations of shading (none, fixed, dynamic), modifying some variables such as the orientation and the size of windows. They also imposed an internal setpoint for heating/cooling and air flow rates for mechanical ventilation coherent with the comfort conditions of class II in the Standard EN ISO 15251:2007 (CEN, 2007). Also, Poirazis et al. (2008) used a comfort setpoint strategy for temperature and lighting. A minimum acceptable level for thermal comfort satisfaction was defined. In this paper, the energy performance of three different roller shades combined with different glazing systems has been evaluated calculating their effect on the total energy needs (for heating, cooling and artificial lighting) of an office module fixing the indoor thermal and visual comfort condition. The thermal comfort has been controlled by fixing the operative temperature setpoint consistent with the comfort conditions of class II of EN ISO 15251:2007. The visual comfort
Proceedings of BS2013: 13th Conference of International Building Performance Simulation Association, Chambéry, France, August 26-28
- 2626 -
requirements has been taken into account by fixing a maximum limit value for the glare index and a minimum illuminance level to be meet through the shading system control and artificial lighting integration. Simulations have been performed in Rome climatic conditions considering different building configurations. An office module with windows on a single façade, or on two opposite façades, has been simulated, varying the glazed area (2 sizes), the glazing systems (4 types). Three kinds of roller shades, with different values of visible reflectance and transmission coefficient, have been compared in order to have different degree of light transmission. One locality of Southern Europe (Rome) has been selected for the investigation. The PMV indices in 9 positions in the office have been calculated for each hour of occupation of the whole year assuming two seasons with regard to the set point conditions and clothing level. Calculations have then been repeated considering also the effect of the diffuse and beam solar radiation through the windows directly reaching the occupants in two positions. The evaluation of the long-term thermal and lighting comfort conditions has been conducted considering some statistical indicators of distribution (the median, minimum, maximum and the interquartile range) and the energy performance (heating, cooling and lighting needs) of the different shading solution have been compared accounting for comfort as well. Energetic, comfort and lighting simulations have been carried out with Energy Plus 7.2, while the correction on the PMV accounting for the solar radiation has been elaborated using a spreadsheet.
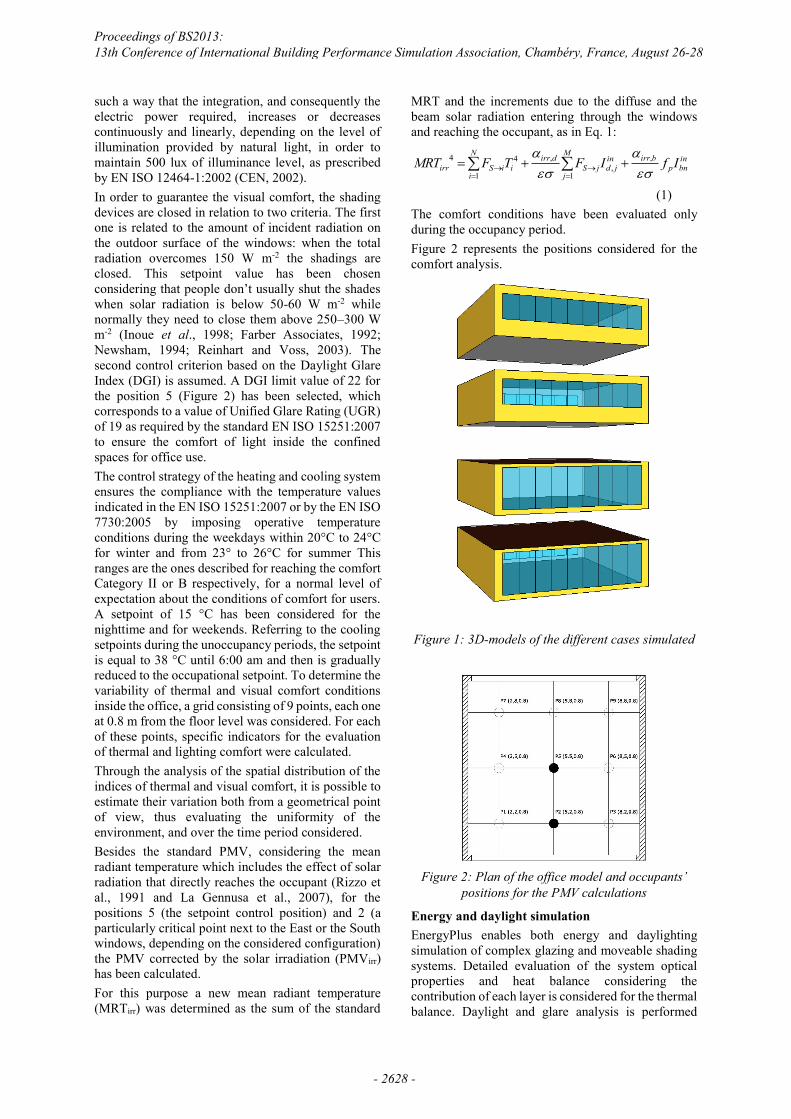
SIMULATION ASSUMPTION Office model The model is an open space office of 100 m2 of floor area and 3 m of interior height. Vertical walls and roof are exposed to the outdoor environment while the floor is considered as adiabatic. The composition of all the opaque elements, both vertical walls and roof slab, is identical, with a 20 cm thick internal layer of clay block and a 5 cm thick external insulation layer. The scrutcture has a thermal transmittance of 0.45 W m-2 K-1. The solar absorptance coefficients have been set to 0.6 for the floor (internal side) and 0.3 for the vertical walls and the roof (both sides). The wall emissivity is 0.9, both for the internal and the external side. The light reflection coefficients have been set to 0.4 for the floor (internal side) and 0.7 for the vertical surfaces (both side) and for the ceiling. All the roller shades are external, but they have different characteristics for the visible trasmittance and reflectance. A full factorial parametrical analysis has been performed by varying the parameters as summarized in Table 1. The building module with the
four alternative concerning the windows size and distribution is represented in Figure 1.
Table 1: Variables set for the analysis
FACTOR VALUES Location Rome: Lat. N 42° 54’ 39’’
Heating Degree-Days HDD18: 1420 K d Cooling Degree-Days CDD18: 827 K d
Glazing DH: Double Glazing with high SHGC Ugl = 1.140 W m-2 K-1; SHGC = 0.608; τd = 0.439
DL: Double Glazing with low SHGC Ugl = 1.099 W m-2 K-1; SHGC = 0.352; τd = 0.205
TH: Triple Glazing with high SHGC Ugl = 0.613 W m-2 K-1; SHGC = 0.575; τd = 0.391
TL: Triple Glazing with low SHGC Ugl = 0.602 W m-2 K-1; SHGC = 0.343; τd = 0.191
Window Size
S1: width = 9; height = 1.5 m; area = 13.5 m2 S2: width = 9; height = 2.5 m; area = 22.5 m2
Window distribu-tion
E: East E+W: East + West S: South S+N: South + North
External shadings
W/O: Without shades: SH1: High solar transmittance roller shades: s = 0.5; s = 0.4 SH2: Medium solar transmittance roller shades: s = 0.63; s = 0.16 SH3: Low solar transmittance roller shades s = 0.75; s = 0.064
Internal gains and schedule The office is occupied from 8:00 am to 6:00 pm, Monday to Friday. The occupancy index has been fixed according to the Italian Technical Standard UNI 10339:1995 (UNI, 1995) in 0.12 people/m2 which corresponds to 12 occupants. The occupants have a metabolic flux equal to 70 W m-
2 or 1.2 met. The heat flow is divided into the sensible portion of 75 W (58% as radiant exchange) and latent heat of 55 W. The unit thermal resistance of clothing is 1 clo (as with typical work clothing with long pants, shirt, tie and jacket) during the winter season, and 0.5 clo (as with lightweight summer pants and light long-sleeved shirt) during the summer season. The conventional winter season is from 1st of October to the 31st of March while the summer season from the 1st of April to the 30th of September. The considered Light Power Density (LPD) is 12 W m-2, with fluorescent lamps installed on the ceiling. The internal loads related to electrical equipment are quantified considering 12 computers, 12 monitors, a laser printer and a copier, with constant average power during the occupation period.
Lighting and Thermal comfort control The lights are turned on only during occupation hours. A control system operates on the artificial lighting in
Proceedings of BS2013: 13th Conference of International Building Performance Simulation Association, Chambéry, France, August 26-28
- 2627 -
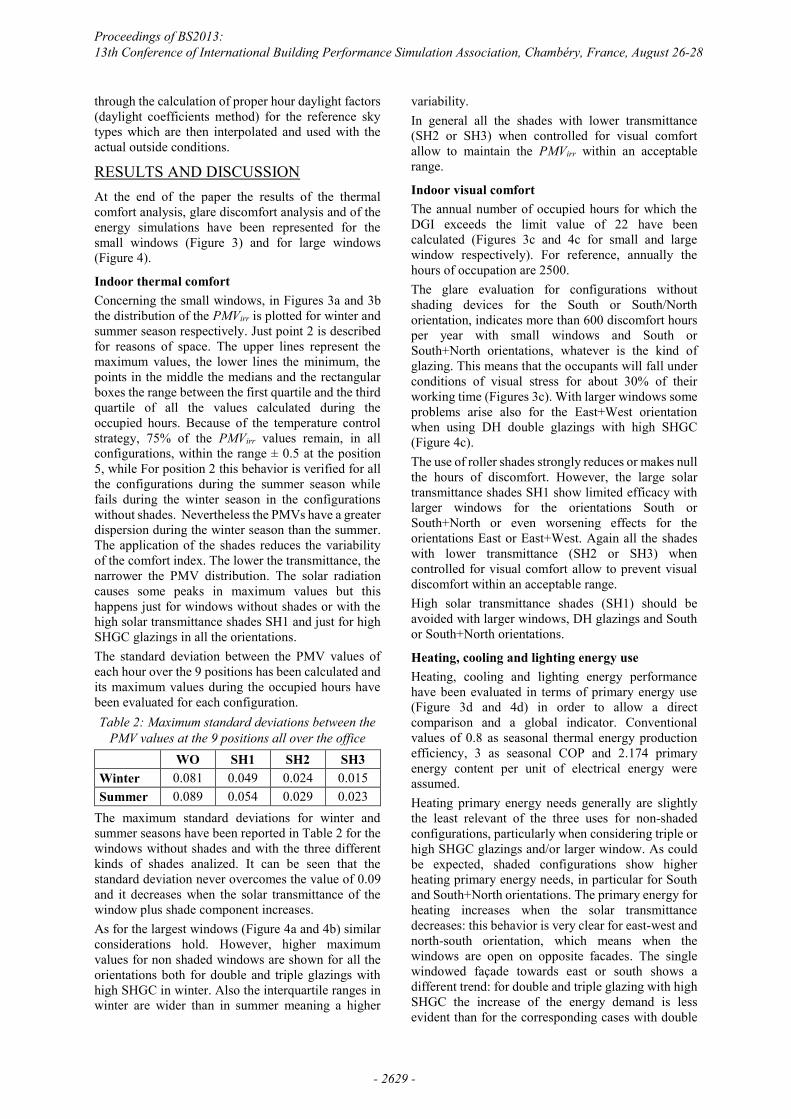
such a way that the integration, and consequently the electric power required, increases or decreases continuously and linearly, depending on the level of illumination provided by natural light, in order to maintain 500 lux of illuminance level, as prescribed by EN ISO 12464-1:2002 (CEN, 2002). In order to guarantee the visual comfort, the shading devices are closed in relation to two criteria. The first one is related to the amount of incident radiation on the outdoor surface of the windows: when the total radiation overcomes 150 W m-2 the shadings are closed. This setpoint value has been chosen considering that people don’t usually shut the shades when solar radiation is below 50-60 W m-2 while normally they need to close them above 250–300 W m-2 (Inoue et al., 1998; Farber Associates, 1992; Newsham, 1994; Reinhart and Voss, 2003). The second control criterion based on the Daylight Glare Index (DGI) is assumed. A DGI limit value of 22 for the position 5 (Figure 2) has been selected, which corresponds to a value of Unified Glare Rating (UGR) of 19 as required by the standard EN ISO 15251:2007 to ensure the comfort of light inside the confined spaces for office use. The control strategy of the heating and cooling system ensures the compliance with the temperature values indicated in the EN ISO 15251:2007 or by the EN ISO 7730:2005 by imposing operative temperature conditions during the weekdays within 20°C to 24°C for winter and from 23° to 26°C for summer This ranges are the ones described for reaching the comfort Category II or B respectively, for a normal level of expectation about the conditions of comfort for users. A setpoint of 15 °C has been considered for the nighttime and for weekends. Referring to the cooling setpoints during the unoccupancy periods, the setpoint is equal to 38 °C until 6:00 am and then is gradually reduced to the occupational setpoint. To determine the variability of thermal and visual comfort conditions inside the office, a grid consisting of 9 points, each one at 0.8 m from the floor level was considered. For each of these points, specific indicators for the evaluation of thermal and lighting comfort were calculated. Through the analysis of the spatial distribution of the indices of thermal and visual comfort, it is possible to estimate their variation both from a geometrical point of view, thus evaluating the uniformity of the environment, and over the time period considered. Besides the standard PMV, considering the mean radiant temperature which includes the effect of solar radiation that directly reaches the occupant (Rizzo et al., 1991 and La Gennusa et al., 2007), for the positions 5 (the setpoint control position) and 2 (a particularly critical point next to the East or the South windows, depending on the considered configuration) the PMV corrected by the solar irradiation (PMVirr) has been calculated. For this purpose a new mean radiant temperature (MRTirr) was determined as the sum of the standard
MRT and the increments due to the diffuse and the beam solar radiation entering through the windows and reaching the occupant, as in Eq. 1:
N
i
M
j
inbnp
birrinjdjS
dirriiSirr IfIFTFMRT
1 1
,,
,44
(1) The comfort conditions have been evaluated only during the occupancy period. Figure 2 represents the positions considered for the comfort analysis.
Figure 1: 3D-models of the different cases simulated
Figure 2: Plan of the office model and occupants’
positions for the PMV calculations
Energy and daylight simulation EnergyPlus enables both energy and daylighting simulation of complex glazing and moveable shading systems. Detailed evaluation of the system optical properties and heat balance considering the contribution of each layer is considered for the thermal balance. Daylight and glare analysis is performed
Proceedings of BS2013: 13th Conference of International Building Performance Simulation Association, Chambéry, France, August 26-28
- 2628 -
through the calculation of proper hour daylight factors (daylight coefficients method) for the reference sky types which are then interpolated and used with the actual outside conditions.
RESULTS AND DISCUSSION At the end of the paper the results of the thermal comfort analysis, glare discomfort analysis and of the energy simulations have been represented for the small windows (Figure 3) and for large windows (Figure 4).
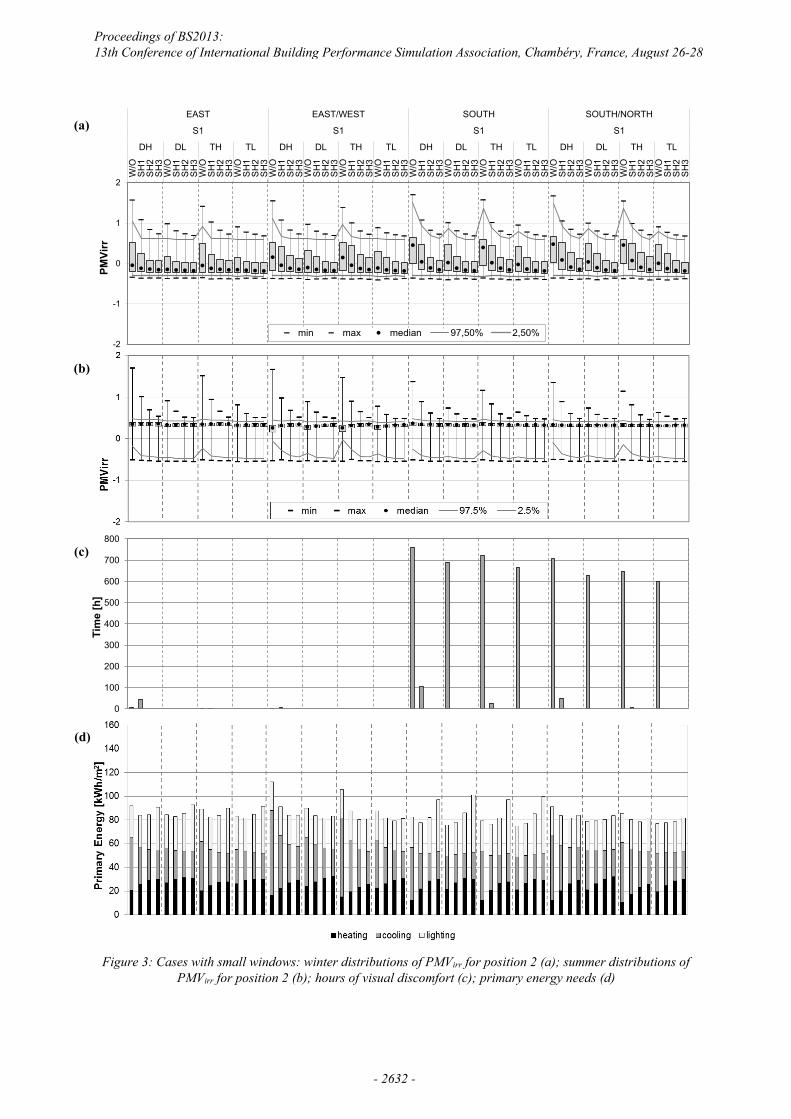
Indoor thermal comfort Concerning the small windows, in Figures 3a and 3b the distribution of the PMVirr is plotted for winter and summer season respectively. Just point 2 is described for reasons of space. The upper lines represent the maximum values, the lower lines the minimum, the points in the middle the medians and the rectangular boxes the range between the first quartile and the third quartile of all the values calculated during the occupied hours. Because of the temperature control strategy, 75% of the PMVirr values remain, in all configurations, within the range ± 0.5 at the position 5, while For position 2 this behavior is verified for all the configurations during the summer season while fails during the winter season in the configurations without shades. Nevertheless the PMVs have a greater dispersion during the winter season than the summer. The application of the shades reduces the variability of the comfort index. The lower the transmittance, the narrower the PMV distribution. The solar radiation causes some peaks in maximum values but this happens just for windows without shades or with the high solar transmittance shades SH1 and just for high SHGC glazings in all the orientations. The standard deviation between the PMV values of each hour over the 9 positions has been calculated and its maximum values during the occupied hours have been evaluated for each configuration. Table 2: Maximum standard deviations between the
PMV values at the 9 positions all over the office WO SH1 SH2 SH3 Winter 0.081 0.049 0.024 0.015 Summer 0.089 0.054 0.029 0.023
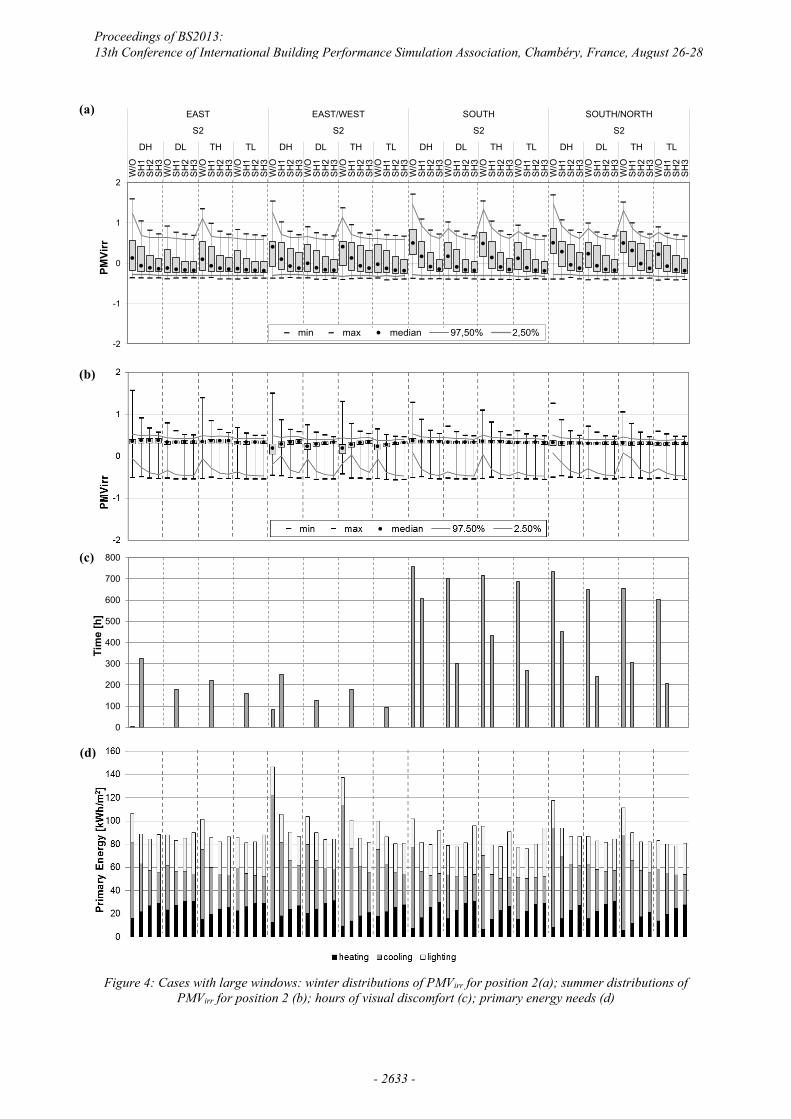
The maximum standard deviations for winter and summer seasons have been reported in Table 2 for the windows without shades and with the three different kinds of shades analized. It can be seen that the standard deviation never overcomes the value of 0.09 and it decreases when the solar transmittance of the window plus shade component increases. As for the largest windows (Figure 4a and 4b) similar considerations hold. However, higher maximum values for non shaded windows are shown for all the orientations both for double and triple glazings with high SHGC in winter. Also the interquartile ranges in winter are wider than in summer meaning a higher
variability. In general all the shades with lower transmittance (SH2 or SH3) when controlled for visual comfort allow to maintain the PMVirr within an acceptable range.
Indoor visual comfort The annual number of occupied hours for which the DGI exceeds the limit value of 22 have been calculated (Figures 3c and 4c for small and large window respectively). For reference, annually the hours of occupation are 2500. The glare evaluation for configurations without shading devices for the South or South/North orientation, indicates more than 600 discomfort hours per year with small windows and South or South+North orientations, whatever is the kind of glazing. This means that the occupants will fall under conditions of visual stress for about 30% of their working time (Figures 3c). With larger windows some problems arise also for the East+West orientation when using DH double glazings with high SHGC (Figure 4c). The use of roller shades strongly reduces or makes null the hours of discomfort. However, the large solar transmittance shades SH1 show limited efficacy with larger windows for the orientations South or South+North or even worsening effects for the orientations East or East+West. Again all the shades with lower transmittance (SH2 or SH3) when controlled for visual comfort allow to prevent visual discomfort within an acceptable range. High solar transmittance shades (SH1) should be avoided with larger windows, DH glazings and South or South+North orientations.
Heating, cooling and lighting energy use Heating, cooling and lighting energy performance have been evaluated in terms of primary energy use (Figure 3d and 4d) in order to allow a direct comparison and a global indicator. Conventional values of 0.8 as seasonal thermal energy production efficiency, 3 as seasonal COP and 2.174 primary energy content per unit of electrical energy were assumed. Heating primary energy needs generally are slightly the least relevant of the three uses for non-shaded configurations, particularly when considering triple or high SHGC glazings and/or larger window. As could be expected, shaded configurations show higher heating primary energy needs, in particular for South and South+North orientations. The primary energy for heating increases when the solar transmittance decreases: this behavior is very clear for east-west and north-south orientation, which means when the windows are open on opposite facades. The single windowed façade towards east or south shows a different trend: for double and triple glazing with high SHGC the increase of the energy demand is less evident than for the corresponding cases with double
Proceedings of BS2013: 13th Conference of International Building Performance Simulation Association, Chambéry, France, August 26-28
- 2629 -
windowed facades, with particularly small differences for the shades SH2 and SH3. Moreover for double and triple glazing with low SHGC the primary energy demand for heating is lower using the SH3 than the SH2. Symmetrically, the cooling primary energy needs which are the main part of the energy uses for windows without shades and for SH1, are significantly reduced by the shades. the decrease of cooling needs generally overcome the increase of heating needs even if, considering the smaller windows there are some exceptions, as for orientation South and South-North with low SHGC glazings. In other words it seems that the use of glazings with a high SHGC gets the largest advantages from the shading device. For larger windows the primary energy for cooling increases but still the reduction of cooling needs with shades overcomes the increment of heating needs for larger windows. Considering the small windows and the shades coupled with DL or TL glazings, the shades SH2 and SH3 give very similar primary energy demand for cooling when the windows are oriented towards East or South. In this last case the enery demand for cooling is higher for SH3 than for SH2. The probable reason for this behavior can be ascribed to the higher solar absorptance or solar reflectance of SH3 which could also justifies the heating demand decrement between the same cases. Finally, Figures 3d also confirm that the use of shading devices results in an increase of the lighting primary energy in each configuration. This effect is particularly emphasized for the orientations East and South, while doubling the windows on the opposite façade reduces the increment in energy demand for lighting. The larger windows determine a slight decrease of the primary energy demand for lighting. The overall annual primary energy needs do not allow to find a single optimal configuration suitable for any application, but per each orientation the combination of low SHGC triple glazings with high or medium (preferable for the larger window size S2 for glare control) solar transmittance shades is usually the right trade off between the different performance requiments. One exception is the orientation South S1 for which high SHGC triple glazings perform slightly better than the low ones.
CONCLUSIONS In this paper, different shading devices have been compared in relation to the energy needs for equivalent thermal comfort conditions and under an equivalent regulation setup for the glare control. Thermal comfort is generally improved by all the considered roller shades, except for a couple of cases in which a high solar transmittance shades is not sufficient. Visual comfort seems to be the most crucial requirement for high solar transmittance shadings. With respect to the unshaded configurations, the introduction of solar shading systems has resulted in
an increase in final energy demand for artificial lighting, in the net energy demand for heating mostly in winter, a decrease in net energy demand for cooling. The primary energy need of each configuration allows comparing the overall performance of the different shading systems. However, the shading configuration that gives the best energy performance appears to be strictly related to the orientation of the windows, to the windows position and to the glazing system to which it is coupled. Even if in some few cases also unshaded solution with low SHGC performs quite well, for Rome’s climatic conditions the shading devices seems to play an essential role to limit glare, preserving the thermal comfort conditions and containing the total primary energy demand. Further investigations will be carried out on different configurations and climatic context.
NOMENCLATURE HDD18 Heating Degree Days with reference temperature 18 °C CDD18 Cooling Degree Days with reference temperature 18 °C
Angle factor between the window and the person (-) fp Projected area factor of the subject in the
solar beam direction (-) Intensity of the inner diffuse solar radiation
(W m-2) Intensity of the indoor beam solar radiation
on a surface orthogonal to solar ray direction (W m-2)
PMV Standard Predicted Mean Vote according to EN ISO 7730:2005 definition (-)
PMVirr Predicted Mean Vote in presence of solar irradiation directly hitting the occupant (-)
SHGC Solar Heat Gain Coefficient (-) Ti Temperature of surface i (K) MRT Mean Radiant Temperature (K) MRTirr Mean Radiant Temperature including
entering solar radiation (K) Ugl Glazing thermal transmittance (W m-2 K-1) Greek Symbols irr, d / b Absorption coefficient of the subject
referring to the diffuse or beam solar radiation (-)
Emissivity of the subject (-) Stephan- Boltzmann constant (5.67 10-8)(W
m-2K-4) d / b Transmittance of the glass for the diffuse or
the beam component of solar radiation (-) s Shades solar transmittance (-) s Shades solar reflectance (-)
REFERENCES CEN, 2005, Standard EN 7730:2005 Ergonomics of
the thermal environment – Analytical
jiSF ,
indI
inbnI
Proceedings of BS2013: 13th Conference of International Building Performance Simulation Association, Chambéry, France, August 26-28
- 2630 -
determination and interpretation of thermal comfort using calculation of the PMV and PPD indices and local thermal comfort criteria.
CEN, 2002, Standard EN 12464-1:2002: Lighting of work places Part 1: Indoor work places.
CEN, 2007, Standard EN 15251:2007 Indoor environmental input parameters for design and assessment of energy performance of buildings addressing indoor air quality, thermal environment, lighting and acoustics.
Correia da Silva P., Leal V. & Andersen M. 2012. Influence of shading control patterns on the energy assessment of office spaces. Energy and Buildings, 50.
David M., Donn M., Garde F. & Lenoir A. 2011. Assessment of the thermal and visual efficiency of solar shades, Building and Environment, 46(7).
Eskin N. & Türkmen H. 2008. Analysis of annual heating and cooling energy requirements for office buildings in different climates in Turkey. Energy and Buildings, 40(5).
Ihm P. & Krarti M. 2012. Design optimization of energy efficient residential buildings in Tunisia. Building and Environment, 58.
Inoue T., Kawase T., Ibamoto T. & Takakusa S., Matsuo Y. 1988. The development of an optimal control system for window shading devices based on investigations in office buildings, ASHRAE Transactions, 94.
Kim G., Lim H. S., Lim T. S., Shaefer L. & Kim T. J. 2012. Comparative advantage of an exterior shading device in thermal performance for residential buildings, Energy and buildings, 46.
Kuhn T. E. 2006. Solar control: A general evaluation method for facades with venetian blinds or other solar control systems, Energy and Buildings, 38(6).
La Gennusa M., Nucara A., Pietrafesa M., Rizzo G. 2007. A model for managing and evaluating solar radiation for indoor thermal comfort, Solar Energy, 81.
Mahdavi A. & Dervishi S. 2011. Exploring the energy performance of simulation-powered lighting and shading systems controls in buildings, Proc. of Building Simulation 2011, Sydney, Australia.
Newsham G.R. 1994. Manual control of window blinds and electric lighting: implications for comfort and energy consumption, Indoor Environment, 3 (3).
Nielsen M. V., Svendsen S. & Jensen B. L. 2011. Quantifying the potential of automated dynamic solar shading in office buildings through
integrated simulations of energy and daylight, Solar Energy, 85(5).
Ochoa C. E., Aries M. B. C., van Loenen E. J. & Hensen J. L. M. 2012. Considerations on design optimization criteria for windows providing low energy consumption and high visual comfort. Applied Energy, 95.
Poirazis H., Blomsterberg Å. & Wall M. 2008. Energy simulations for glazed office buildings in Sweden. Energy and Buildings, 40(7).
Reinhart C.F. & Voss K. 2003. Monitoring manual control of electric lighting and blinds, Lighting Research and Technology, 35 (3).
Rizzo G., Franzitta G., Cannistraro G., Bertolino S. 1991. The optimum selection of the window shading levels and of the indoor ventilation rates as a design strategy for bioclimatic commercial buildings. Energy Conservation in Buildings, 60.
Shen H. & Tzempelikos A. 2012a. Daylighting and energy analysis of private offices with automated interior roller shades. Solar Energy, 86(2).
Shen H. & Tzempelikos A. 2012b. Sensitivity analysis on daylighting and energy performance of perimeter offices with automated shading. Building and Environment.
Tsikaloudaki K., Theodosiou T., Laskos K. & Bikas D. 2012. Assessing cooling energy performance of windows for residential buildings in the Mediterranean zone. Energy Conversion and Management, 64.
Tzempelikos A. & Athienitis A. K. 2007. The impact of shading design and control on building cooling and lighting demand, Solar Energy, 81.
Tzempelikos A., Bessoudo M., Athienitis A. K. & Zmeureanu R. 2010. Indoor thermal environmental conditions near glazed facades with shading devices – Part II: Thermal comfort simulation and impact of glazing and shading properties. Building and Environment, 45(11).
Zhu J., Chew D. a. S., Lv S. & Wu W. 2013. Optimization method for building envelope design to minimize carbon emissions of building operational energy consumption using orthogonal experimental design (OED). Habitat International, 37.
UNI, 1995, UNI 10339:2005 Impianti aeraulici a fini di benessere. Generalità. Classificazione e requisiti. (Air-conditioning systems for thermal comfort in buildings – General classification and requirements – Offer, order and supply specifications)
Proceedings of BS2013: 13th Conference of International Building Performance Simulation Association, Chambéry, France, August 26-28
- 2631 -
(a)
Figure 3: Cases with small windows: winter distributions of PMVirr for position 2 (a); summer distributions of
PMVirr for position 2 (b); hours of visual discomfort (c); primary energy needs (d)
-2
-1
0
1
2
W/O
SH1
SH2
SH3
W/O
SH1
SH2
SH3
W/O
SH1
SH2
SH3
W/O
SH1
SH2
SH3
W/O
SH1
SH2
SH3
W/O
SH1
SH2
SH3
W/O
SH1
SH2
SH3
W/O
SH1
SH2
SH3
W/O
SH1
SH2
SH3
W/O
SH1
SH2
SH3
W/O
SH1
SH2
SH3
W/O
SH1
SH2
SH3
W/O
SH1
SH2
SH3
W/O
SH1
SH2
SH3
W/O
SH1
SH2
SH3
W/O
SH1
SH2
SH3
DH DL TH TL DH DL TH TL DH DL TH TL DH DL TH TL
S1 S1 S1 S1
EAST EAST/WEST SOUTH SOUTH/NORTHPM
Virr
min max median 97,50% 2,50%
0
100
200
300
400
500
600
700
800
Tim
e [h
]
(c)
(b)
(d)
Proceedings of BS2013: 13th Conference of International Building Performance Simulation Association, Chambéry, France, August 26-28
- 2632 -
(a)
Figure 4: Cases with large windows: winter distributions of PMVirr for position 2(a); summer distributions of
PMVirr for position 2 (b); hours of visual discomfort (c); primary energy needs (d)
-2
-1
0
1
2
W/O
SH1
SH2
SH3
W/O
SH1
SH2
SH3
W/O
SH1
SH2
SH3
W/O
SH1
SH2
SH3
W/O
SH1
SH2
SH3
W/O
SH1
SH2
SH3
W/O
SH1
SH2
SH3
W/O
SH1
SH2
SH3
W/O
SH1
SH2
SH3
W/O
SH1
SH2
SH3
W/O
SH1
SH2
SH3
W/O
SH1
SH2
SH3
W/O
SH1
SH2
SH3
W/O
SH1
SH2
SH3
W/O
SH1
SH2
SH3
W/O
SH1
SH2
SH3
DH DL TH TL DH DL TH TL DH DL TH TL DH DL TH TL
S2 S2 S2 S2
EAST EAST/WEST SOUTH SOUTH/NORTHPM
Virr
min max median 97,50% 2,50%
0
100
200
300
400
500
600
700
800
Tim
e [h
]
(d)
(b)
(c)
Proceedings of BS2013: 13th Conference of International Building Performance Simulation Association, Chambéry, France, August 26-28
- 2633 -