Embed Size (px)
Citation preview
1
COMFORT AND INDOOR AIR QUALITY IN PASSIVE HOUSES IN THE U.S
Mike Beamer Department of Architecture
University of Oregon Eugene, OR 97403
Email: [email protected]
David Bisers Department of Architecture
University of Oregon Eugene, OR 97403
Email: [email protected]
Sophia Duluk
Department of Architecture University of Oregon Eugene, OR 97403
Email: [email protected]
Diana Hogard
Department of Architecture University of Oregon Eugene, OR 97403
Email: [email protected]
Alison Kwok
Department of Architecture University of Oregon Eugene, OR 97403
Email: [email protected]
ABSTRACT With the growing popularity of Passive Houses within the U.S., post-occupancy evaluations of the standard are essential in validating the Passive House performance to the public. The post-occupancy evaluation performed and proposed by this study focuses on thermal comfort, indoor air quality and energy use. Relatively new to North America, this German-based standard specifies energy targets, envelope enhancements, and several environmental principles to provide thermally comfortable buildings and healthy indoor air quality. This study seeks to verify the success of this construction type through participation of a select number of building owners. A 22 question survey was developed and sent to the building owners in addition to a toolkit of equipment and a set of instructions detailing the data collection process. Data collected included: indoor and outdoor temperatures, carbon dioxide levels, humidity, window-wall surface temperatures, and comfort attitudes, behaviors and perceptions. The study has shown that the houses were performing well; occupants were thermally comfortable, carbon dioxide readings were, in most instances, below recommended levels, and the window-wall (window and surrounding wall surface) temperatures stayed within 4 °F or 5 °F of ambient temperatures. 1. INTRODUCTION The Passive House standard provides performance targets for buildings to reduce energy use by 90% from the average
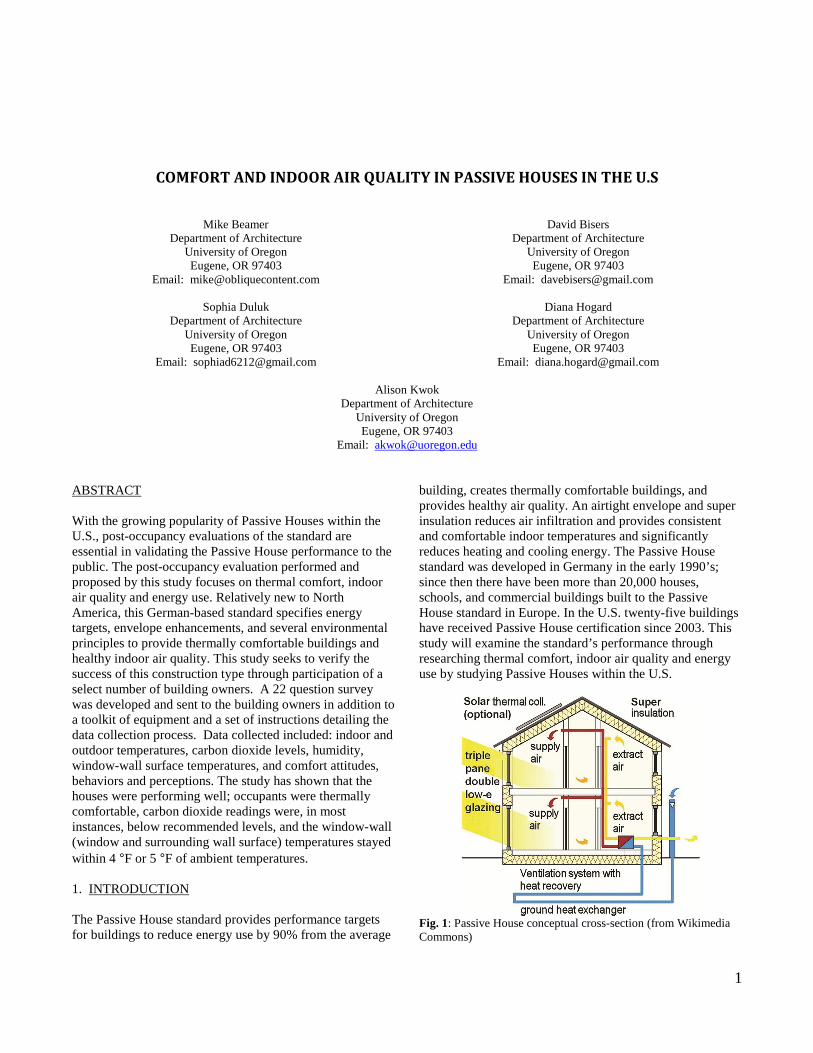
building, creates thermally comfortable buildings, and provides healthy air quality. An airtight envelope and super insulation reduces air infiltration and provides consistent and comfortable indoor temperatures and significantly reduces heating and cooling energy. The Passive House standard was developed in Germany in the early 1990’s; since then there have been more than 20,000 houses, schools, and commercial buildings built to the Passive House standard in Europe. In the U.S. twenty-five buildings have received Passive House certification since 2003. This study will examine the standard’s performance through researching thermal comfort, indoor air quality and energy use by studying Passive Houses within the U.S.
Fig. 1: Passive House conceptual cross-section (from Wikimedia Commons)
2
In many cases, the heating demand in Passive Houses is so small that it can be met by utilizing internal gains (heat from occupants, appliances, and lighting) and solar gains. The Passive House standard claims to provide up to a 90% space conditioning energy reduction over typical buildings. The theory behind thermal comfort in Passive Houses is to maintain uniform comfortable temperatures near windows – humans are acutely aware of the ‘coolth’ near single-paned windows on a cold winter day, where the body feels cold as it loses heat to the window. The Passive House standard influences comfort by requiring window-wall temperatures to be within 4°F of the interior set-point temperature which is usually 68 °F. Another requirement in the Passive House standard is airtight construction. Air infiltration is typically tested twice during the construction phase; once before the insulation is installed to confirm success of the taping of the air barrier; and once after the walls are closed in. In order to maintain good indoor air quality, every Passive House must be equipped with a heat recovery ventilator (HRV, or energy recovery ventilator, ERV); a device that constantly ventilates living spaces while recovering heating and cooling energy produced inside the envelope. This mechanical system operates continuously to provide fresh outdoor air. For the purposes of this study, carbon dioxide levels will be used as a predictor of general air quality which includes odors and bioeffluents; not as an indicator for health hazards. This paper focuses on thermal comfort and air quality in a selected sample of certified Passive Houses across the country during the 2011-2012 winter season. The objective of this study is to compare inhabitants’ comfort to accepted thermal comfort standards and to verify building practices. 1.1 Thermal Comfort Passive Houses are typically designed to maintain a constant indoor temperature of 68°F (20°C), although some variation is expected with varying outdoor temperatures (this variation is limited to a ±4°F swing by Passive House standards). Physical thermal conditions of the various houses will be compared to the comfort range specified by ASHRAE Standard 55-2010, Thermal Environmental Conditions for Human Occupancy (1). This standard states that the percentage of a buildings occupants dissatisfied with general comfort should be less than 6% (category A) and up to 15% (category C) in buildings with mechanical heating, cooling, and ventilation (3). In a recent study of 11 European Passive House projects, with more then 100 dwelling units, not a single occupant gave a negative thermal comfort rating of their dwelling space (2). In this same study, participants were asked if living in a Passive
House was more or less comfortable then their previous standard construction residence. All the residents indicated an increase in thermal comfort in their new residence after staying through a winter, despite their pre-winter apprehensions due to a lack of radiators, which they were accustomed to in their previous residences. According to the CEPHEUS study conducted, residents typically set thermostats between 70 °F (21 °C) and 71.6 °F (22 °C), and remained comfortable while the indoor air temperature remained between 62.6 °F (17 °C) and 77 °F (25 °C). Residents were also highly satisfied with the even temperature distribution throughout the space compared to the stratification seen in ‘normal’ houses (3). 1.2 Indoor Air Quality Indoor air quality is often a concern for owners first learning about Passive Houses given the elimination of ventilation through infiltration that results from airtight construction; if not properly ventilated this can lead to “sick building syndrome”. However, in a European Passive House study, where all the dwellings utilized a heat recovery ventilation system, 95% of occupants rated the indoor air quality of their dwellings to be good to very good with no negative ratings were reported (3). 2. THE PROBLEM & HYPOTHESIS The performance metrics this study will examine are temperature variations during the winter design week (related to occupant comfort) and annual energy use (related to annual carbon emissions.) This research is concerned with the following questions: 1. Do Passive Houses maintain an average indoor
temperature of 68°F (20°C) during the winter design week?
2. Does the window wall of the primary living space maintain an indoor temperature swing of less than 4°F above and below 68°F (20°C)?
3. Are people thermally comfortable in the Passive Houses? What changes, if any, have been made to their lifestyles?
Hypothesis: Houses built to the Passive House standard within the U.S. will successfully perform to Passive House expectations in areas such as thermal comfort, indoor air quality, and energy use.

3
3. METHODOLOGY 3.1 Building Selection and Permissions Owners of Passive Houses within the U.S. were contacted and invited to voluntarily participate in the study. Six houses have agreed to participate in the data logging; three sets of data have been received and analyzed at this time. Houses with analyzed data include the Eugene house, the Salem house, and the Chapel Hill house. Toolkits are expected soon from the Isabella house, Hudson house and Lafayette house. TABLE 1: PASSIVE HOUSE BUILDINGS TESTED HOUSE LOCATION HDD 65
°F AREA
s.f. A Eugene, Oregon 4546 B Salem, Oregon 4927 1,567 C Chapel Hill, North
Carolina 3457* 2,062
D Isabella, Minnesota 9818** 2,134 E Hudson, Wisconsin 7981*** 1,770 F Lafayette, Louisiana 1587 895
*Information for Raleigh, NC **Information for Duluth, MN ***Information for Minneapolis, MN 3.2 Selection of Measurement Parameters A building designed and certified to the Passive House standard is expected to remain at a consistent temperature between 4 degrees (either higher or lower) of 68°F and relative humidity within the range of 30-70%. Temperatures and humidity levels were recorded in various locations throughout the home to verify the home’s ability to stay within the prescribed range. As a control metric for the environment in which the house functions exterior temperature was also measured. Another criteria in the Passive House standard is the ability of the building to keep all surfaces within 4 °F of the ambient temperature. This is especially difficult to do with windows due to their higher conductance in relation to the rest of the building envelope. In order to test this criterion a system to compare the window surface temperatures against the wall surface temperatures was developed in which a number of measurements are taken along the window surface, the frame and a point on the wall one foot outside the window frame [Figure 2]. In taking these measurements verification that each surface was within 4 °F of each other and ambient air was performed.
Fig. 2: Temperature Measurement Points on Interior
Window Wall Elevation
Although the HRV or ERV brings in 100% fresh air indoor air quality (IAQ) is a concern in Passive Houses due to their airtightness. Testing the CO2 levels within the home allows users to determine if there is enough fresh air being provided to the space. A guideline of 1000ppm of CO2 will be used to analyze house performance as it typically is used as a predictor of odors and bioeffluents and not as an indicator for health hazards (6). When possible a years’ worth of energy bills were collected from homeowners. This information will be used to verify the Passive House claim of up to 90% space-conditioning energy reduction for houses built to this standard. 3.3 Toolkit Assembly and Training Protocol Toolkits were assembled and shipped to home owners. These toolkits included three dataloggers, one CO2 meter, one Raytek surface temperature gun, occupant surveys and an instruction sheet on how to use the tools for the study. The instruction sheet directed occupants to complete a series of tasks: place one HOBO datalogger (reading temperature and humidity) on the exterior or their home, place one HOBO datalogger (reading temperature and humidity) in the interior near the home thermostat, place one HOBO datalogger and CO2 meter (reading CO2 levels, temperature and humidity) within the kitchen; take surface temperature measurements of indicated locations of a window within the main living space [Figure 2], provide one year of utility bills. In addition to setting up the tools all occupants within each house were asked to complete a brief survey on their comfort and behavior within the home. 3.4 Survey Development A 22 question survey was developed regarding occupants’ perception of thermal comfort and indoor air quality within their homes. Although these homes may fall into
4
comfortable ranges by the Passive House standard an understanding of whether this resulted in a greater perception of comfort by the occupants was desired. Example questions of thermal comfort and behavior include: What is your thermal comfort within the primary living area at this moment? (Please select one)
□ Cold □ Cool □ Slightly cool □ Neutral □ Slightly warm □ Warm □ Hot
Right now I would prefer to feel: (Please choose one)
□ Warmer □ No change □ Cooler
Example questions of behavior include: If you have felt too cold, what actions id you take to become more comfortable? (Select all that apply)
□ N/A □ Turn on the heat □ Open sunshades □ Increase clothing □ Drink a warm beverage □ Move to a different room □ Nothing □ Other __________________________
If you have experienced too little air movement, what actions did you take to achieve acceptable air movement? (Select all that apply)
□ N/A □ Turn up ventilation system □ Open a window □ Turn on a fan □ Move to another room □ Nothing □ Other ___________________________
By including both questions about the environment and the occupant’s behavior conclusions can be made about how the house operates and what measures users take to maintain a comfortable environment.
3.5 Analysis Procedure All data collected from toolkits was imported into Excel and analyzed with respect to 1) whether the houses maintained average indoor temperatures of 68°F (20°C) during the logging period, 2) if CO2 levels remained below 1000ppm and 3) if the surface temperature of the primary living space window wall was within 4°F of ambient temperatures. The survey results were analyzed to determine if residents 1) are thermally comfortable in Passive Houses, 2) are satisfied with the indoor air quality provided, 3) are satisfied with energy use expectations and 4) the measures that are taken by occupants in maintaining a comfortable environment. 4. RESULTS & ANALYSIS 4.1 Thermal Conditions
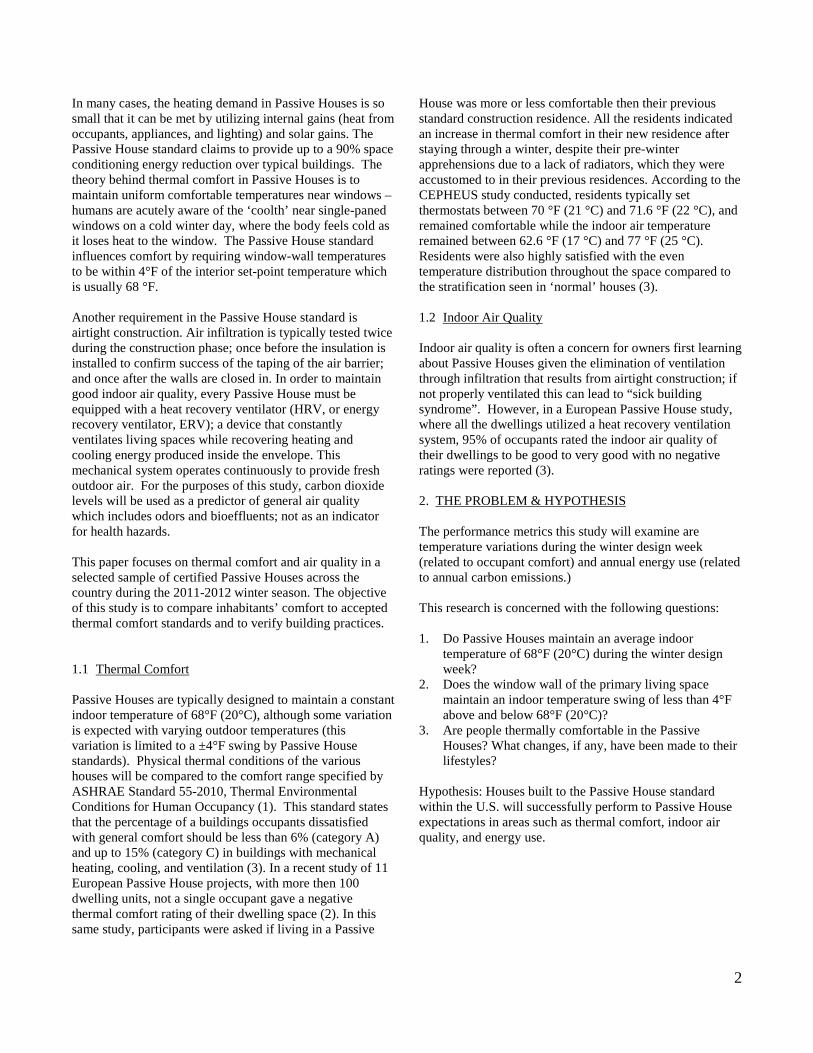
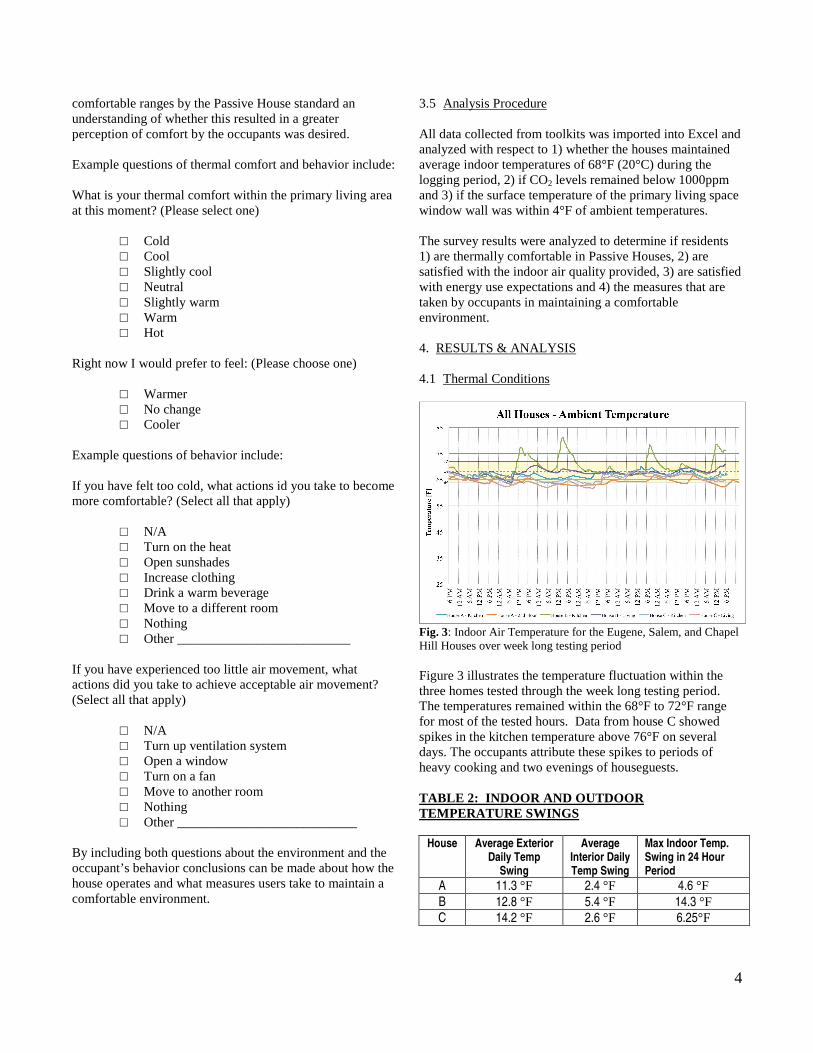
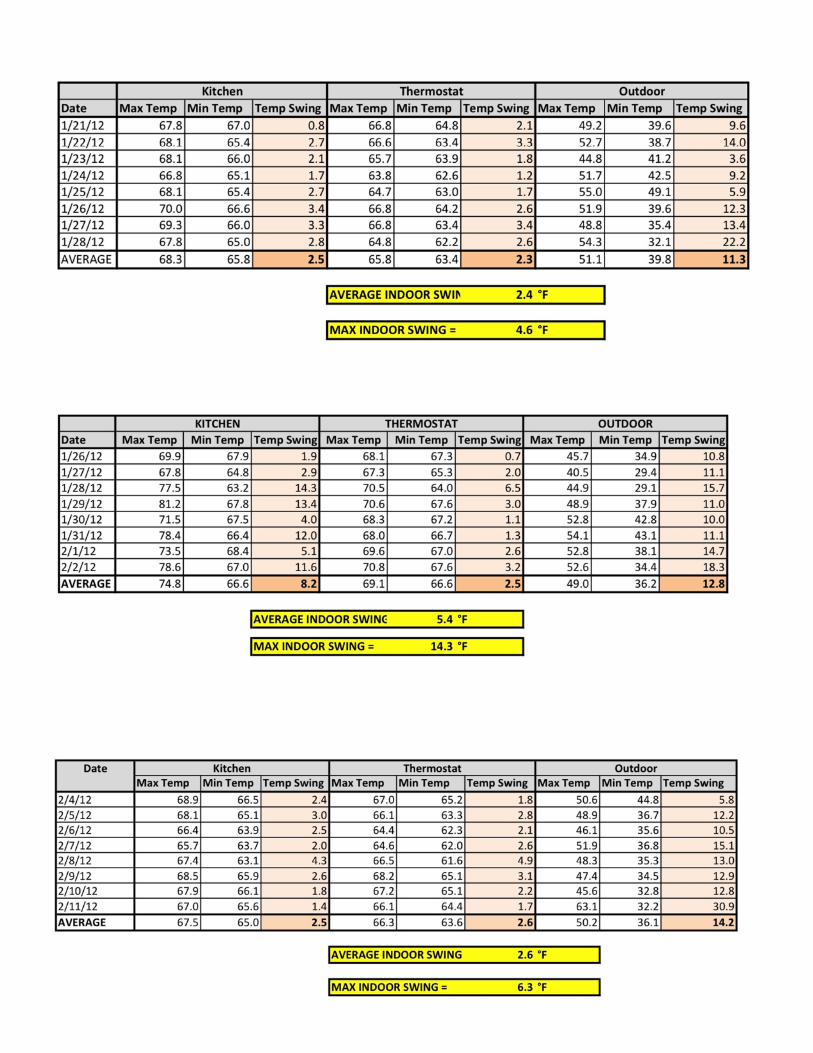
Fig. 3: Indoor Air Temperature for the Eugene, Salem, and Chapel Hill Houses over week long testing period Figure 3 illustrates the temperature fluctuation within the three homes tested through the week long testing period. The temperatures remained within the 68°F to 72°F range for most of the tested hours. Data from house C showed spikes in the kitchen temperature above 76°F on several days. The occupants attribute these spikes to periods of heavy cooking and two evenings of houseguests. TABLE 2: INDOOR AND OUTDOOR TEMPERATURE SWINGS
House Average Exterior Daily Temp
Swing
Average Interior Daily Temp Swing
Max Indoor Temp. Swing in 24 Hour Period
A 11.3 °F 2.4 °F 4.6 °F
B 12.8 °F 5.4 °F 14.3 °F
C 14.2 °F 2.6 °F 6.25°F
5
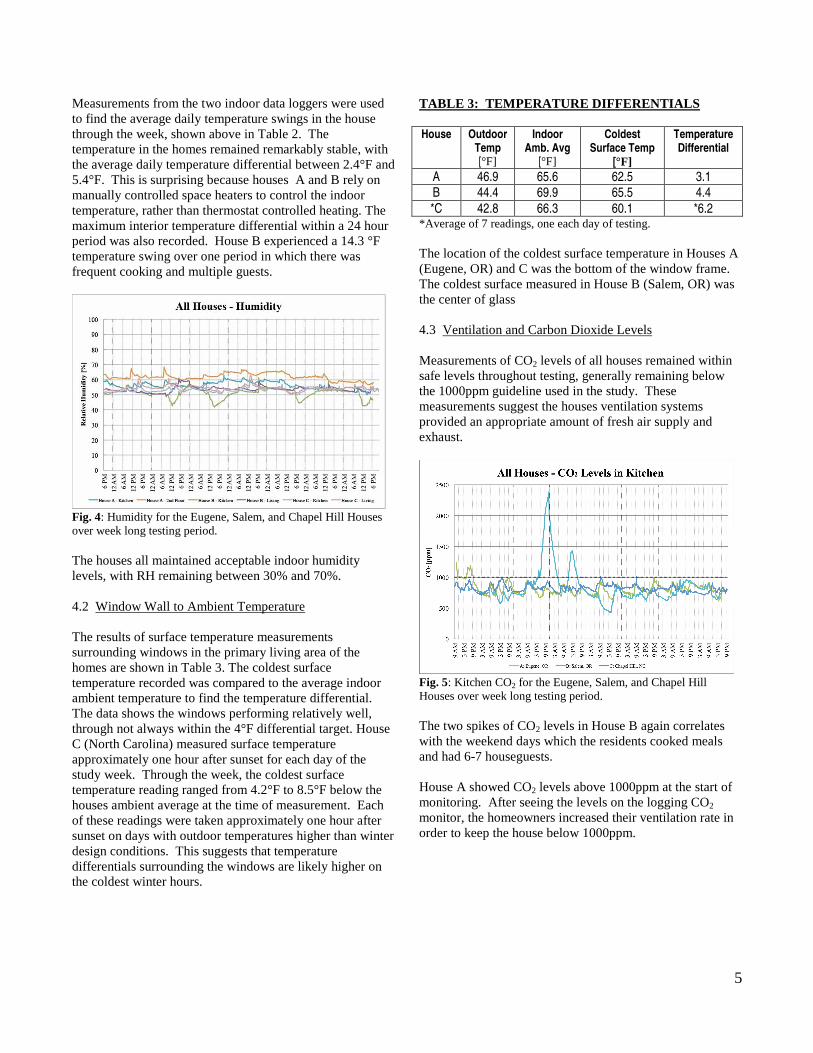
Measurements from the two indoor data loggers were used to find the average daily temperature swings in the house through the week, shown above in Table 2. The temperature in the homes remained remarkably stable, with the average daily temperature differential between 2.4°F and 5.4°F. This is surprising because houses A and B rely on manually controlled space heaters to control the indoor temperature, rather than thermostat controlled heating. The maximum interior temperature differential within a 24 hour period was also recorded. House B experienced a 14.3 °F temperature swing over one period in which there was frequent cooking and multiple guests.
Fig. 4: Humidity for the Eugene, Salem, and Chapel Hill Houses over week long testing period. The houses all maintained acceptable indoor humidity levels, with RH remaining between 30% and 70%. 4.2 Window Wall to Ambient Temperature The results of surface temperature measurements surrounding windows in the primary living area of the homes are shown in Table 3. The coldest surface temperature recorded was compared to the average indoor ambient temperature to find the temperature differential. The data shows the windows performing relatively well, through not always within the 4°F differential target. House C (North Carolina) measured surface temperature approximately one hour after sunset for each day of the study week. Through the week, the coldest surface temperature reading ranged from 4.2°F to 8.5°F below the houses ambient average at the time of measurement. Each of these readings were taken approximately one hour after sunset on days with outdoor temperatures higher than winter design conditions. This suggests that temperature differentials surrounding the windows are likely higher on the coldest winter hours.
TABLE 3: TEMPERATURE DIFFERENTIALS House Outdoor
Temp [°F]
Indoor Amb. Avg
[°F]
Coldest Surface Temp
[°F]
Temperature Differential
A 46.9 65.6 62.5 3.1
B 44.4 69.9 65.5 4.4
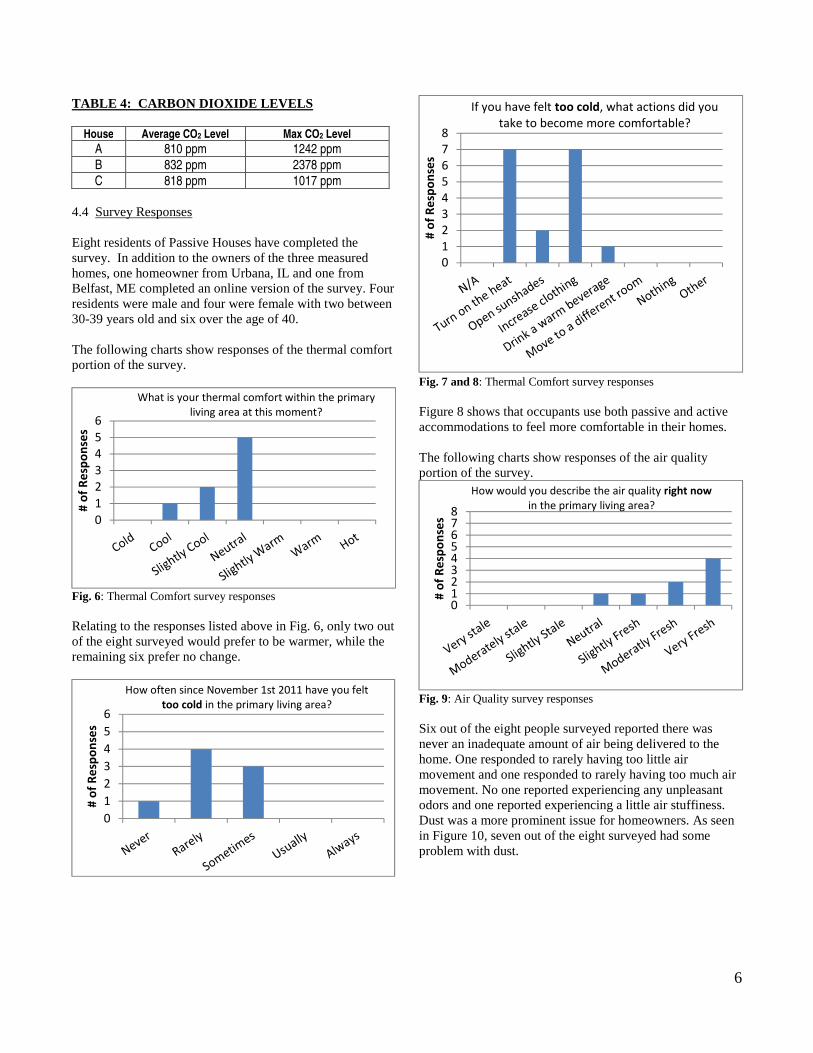
*C 42.8 66.3 60.1 *6.2 *Average of 7 readings, one each day of testing. The location of the coldest surface temperature in Houses A (Eugene, OR) and C was the bottom of the window frame. The coldest surface measured in House B (Salem, OR) was the center of glass 4.3 Ventilation and Carbon Dioxide Levels Measurements of CO2 levels of all houses remained within safe levels throughout testing, generally remaining below the 1000ppm guideline used in the study. These measurements suggest the houses ventilation systems provided an appropriate amount of fresh air supply and exhaust.
Fig. 5: Kitchen CO2 for the Eugene, Salem, and Chapel Hill Houses over week long testing period. The two spikes of CO2 levels in House B again correlates with the weekend days which the residents cooked meals and had 6-7 houseguests. House A showed CO2 levels above 1000ppm at the start of monitoring. After seeing the levels on the logging CO2 monitor, the homeowners increased their ventilation rate in order to keep the house below 1000ppm.
6
TABLE 4: CARBON DIOXIDE LEVELS
House Average CO2 Level Max CO2 Level
A 810 ppm 1242 ppm
B 832 ppm 2378 ppm
C 818 ppm 1017 ppm
4.4 Survey Responses Eight residents of Passive Houses have completed the survey. In addition to the owners of the three measured homes, one homeowner from Urbana, IL and one from Belfast, ME completed an online version of the survey. Four residents were male and four were female with two between 30-39 years old and six over the age of 40. The following charts show responses of the thermal comfort portion of the survey.
Fig. 6: Thermal Comfort survey responses Relating to the responses listed above in Fig. 6, only two out of the eight surveyed would prefer to be warmer, while the remaining six prefer no change.
Fig. 7 and 8: Thermal Comfort survey responses Figure 8 shows that occupants use both passive and active accommodations to feel more comfortable in their homes. The following charts show responses of the air quality portion of the survey.
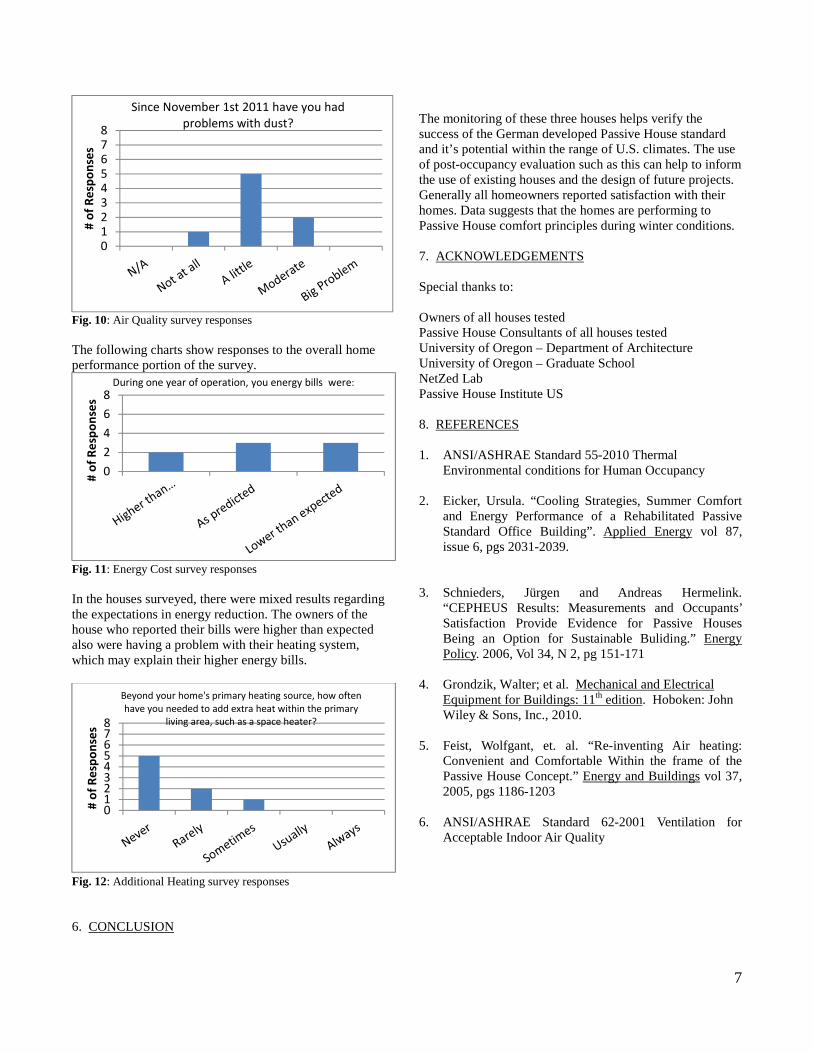
Fig. 9: Air Quality survey responses Six out of the eight people surveyed reported there was never an inadequate amount of air being delivered to the home. One responded to rarely having too little air movement and one responded to rarely having too much air movement. No one reported experiencing any unpleasant odors and one reported experiencing a little air stuffiness. Dust was a more prominent issue for homeowners. As seen in Figure 10, seven out of the eight surveyed had some problem with dust.
0
1
2
3
4
5
6
# o
f R
esp
on
ses
What is your thermal comfort within the primary
living area at this moment?
0
1
2
3
4
5
6
# o
f R
esp
on
ses
How often since November 1st 2011 have you felt
too cold in the primary living area?
0
1
2
3
4
5
6
7
8
# o
f R
esp
on
ses
If you have felt too cold, what actions did you
take to become more comfortable?
012345678
# o
f R
esp
on
ses
How would you describe the air quality right now
in the primary living area?
7
Fig. 10: Air Quality survey responses The following charts show responses to the overall home performance portion of the survey.
Fig. 11: Energy Cost survey responses In the houses surveyed, there were mixed results regarding the expectations in energy reduction. The owners of the house who reported their bills were higher than expected also were having a problem with their heating system, which may explain their higher energy bills.
Fig. 12: Additional Heating survey responses 6. CONCLUSION
The monitoring of these three houses helps verify the success of the German developed Passive House standard and it’s potential within the range of U.S. climates. The use of post-occupancy evaluation such as this can help to inform the use of existing houses and the design of future projects. Generally all homeowners reported satisfaction with their homes. Data suggests that the homes are performing to Passive House comfort principles during winter conditions. 7. ACKNOWLEDGEMENTS Special thanks to: Owners of all houses tested Passive House Consultants of all houses tested University of Oregon – Department of Architecture University of Oregon – Graduate School NetZed Lab Passive House Institute US 8. REFERENCES 1. ANSI/ASHRAE Standard 55-2010 Thermal
Environmental conditions for Human Occupancy
2. Eicker, Ursula. “Cooling Strategies, Summer Comfort and Energy Performance of a Rehabilitated Passive Standard Office Building”. Applied Energy vol 87, issue 6, pgs 2031-2039.
3. Schnieders, Jürgen and Andreas Hermelink.
“CEPHEUS Results: Measurements and Occupants’ Satisfaction Provide Evidence for Passive Houses Being an Option for Sustainable Buliding.” Energy Policy. 2006, Vol 34, N 2, pg 151-171
4. Grondzik, Walter; et al. Mechanical and Electrical
Equipment for Buildings: 11th edition. Hoboken: John Wiley & Sons, Inc., 2010.
5. Feist, Wolfgant, et. al. “Re-inventing Air heating:
Convenient and Comfortable Within the frame of the Passive House Concept.” Energy and Buildings vol 37, 2005, pgs 1186-1203
6. ANSI/ASHRAE Standard 62-2001 Ventilation for Acceptable Indoor Air Quality
0
1
2
3
4
5
6
7
8
# o
f R
esp
on
ses
Since November 1st 2011 have you had
problems with dust?
0
2
4
6
8
# o
f R
esp
on
ses
During one year of operation, you energy bills were:
012345678
# o
f R
esp
on
ses
Beyond your home's primary heating source, how often
have you needed to add extra heat within the primary
living area, such as a space heater?
8