Embed Size (px)
Citation preview
BENT PINES ASSISTED LIVINGWILLARDS, MARYLAND
October 18, 2012MAIN ENTRANCE PERSPECTIVE
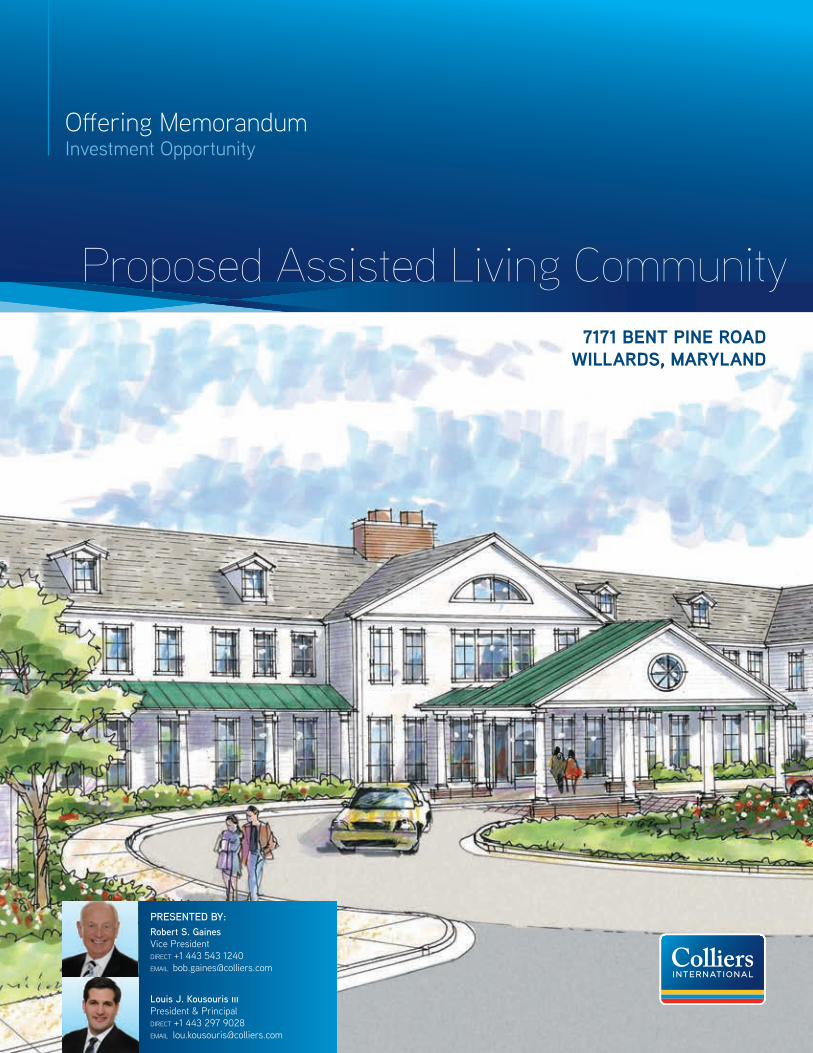
Proposed Assisted Living Community
PRESENTED BY:Robert S. GainesVice President direct +1 443 543 1240 email [email protected]
Louis J. Kousouris iiiPresident & Principal direct +1 443 297 9028 email [email protected]
Offering Memoranduminvestment Opportunity
7171 BENT PINE ROAD WILLARDS, MARYLAND
table Of cOntents
> ExEcuTivE SummaRY
> SiTuaTioN ovERviEw/ maRKET SYNoPSiS
> FiNaNciaL aNaLYSiS
> TEam & ExPERiENcE

executive suMMary
COLLIERS INTERNATIONAL | BALTIMORE BENT PINES
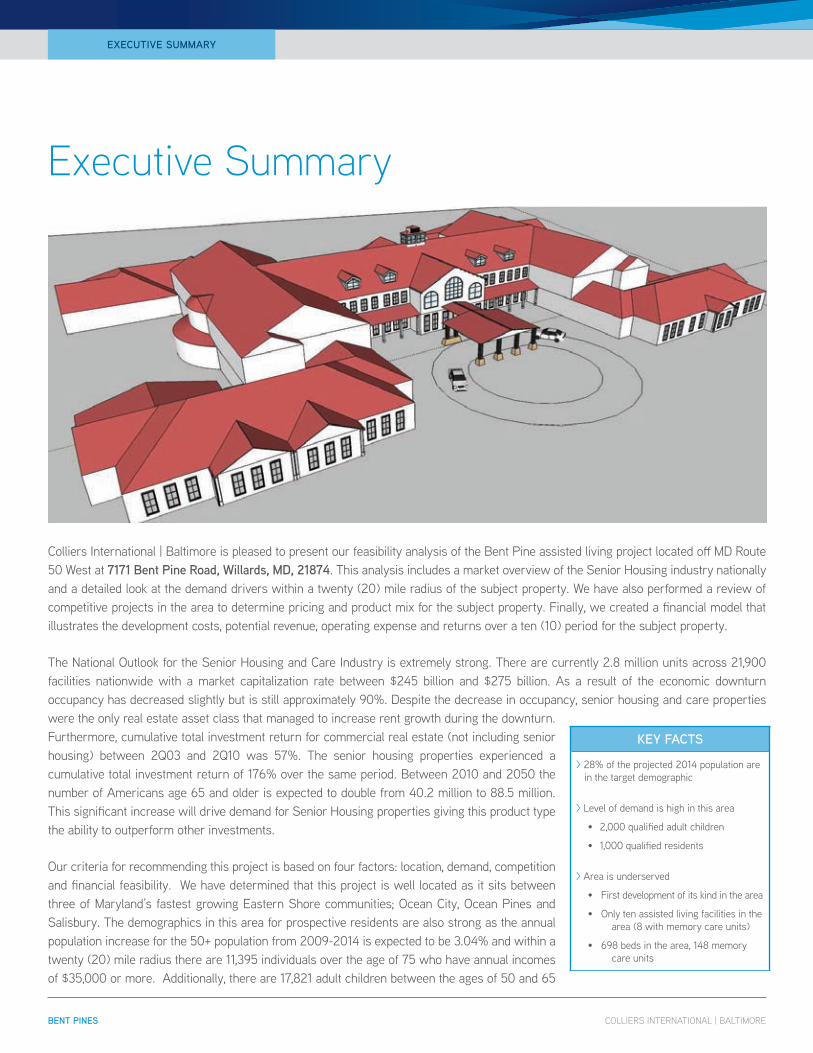
colliers international | Baltimore is pleased to present our feasibility analysis of the Bent Pine assisted living project located off md route 50 West at 7171 Bent Pine Road, willards, mD, 21874. this analysis includes a market overview of the Senior Housing industry nationally and a detailed look at the demand drivers within a twenty (20) mile radius of the subject property. We have also performed a review of competitive projects in the area to determine pricing and product mix for the subject property. Finally, we created a financial model that illustrates the development costs, potential revenue, operating expense and returns over a ten (10) period for the subject property.
the National Outlook for the Senior Housing and care industry is extremely strong. there are currently 2.8 million units across 21,900 facilities nationwide with a market capitalization rate between $245 billion and $275 billion. as a result of the economic downturn occupancy has decreased slightly but is still approximately 90%. despite the decrease in occupancy, senior housing and care properties were the only real estate asset class that managed to increase rent growth during the downturn. Furthermore, cumulative total investment return for commercial real estate (not including senior housing) between 2Q03 and 2Q10 was 57%. the senior housing properties experienced a cumulative total investment return of 176% over the same period. Between 2010 and 2050 the number of americans age 65 and older is expected to double from 40.2 million to 88.5 million. this significant increase will drive demand for Senior Housing properties giving this product type the ability to outperform other investments.
Our criteria for recommending this project is based on four factors: location, demand, competition and financial feasibility. We have determined that this project is well located as it sits between three of maryland’s fastest growing eastern Shore communities; Ocean city, Ocean Pines and Salisbury. the demographics in this area for prospective residents are also strong as the annual population increase for the 50+ population from 2009-2014 is expected to be 3.04% and within a twenty (20) mile radius there are 11,395 individuals over the age of 75 who have annual incomes of $35,000 or more. additionally, there are 17,821 adult children between the ages of 50 and 65
executive summary
ExEcuTivE SummaRY
KEY FacTS
> 28% of the projected 2014 population are in the target demographic
> level of demand is high in this area
• 2,000 qualified adult children
• 1,000 qualified residents
> area is underserved
• First development of its kind in the area
• Only ten assisted living facilities in the area (8 with memory care units)
• 698 beds in the area, 148 memory care units
ARIAL PERSPECTIVE VIEWBENT PINES ASSISTED LIVING
WILLARDS, MARYLANDOctober 18, 2012
COLLIERS INTERNATIONAL | BALTIMORE BENT PINES
who have annual incomes over $75,000. this statistic is critical as adult children are the primary decision makers in terms of where potential residents will locate. Finally, the competitive analysis indicates that this is an underserved market and a new facility with memory care units will perform well.
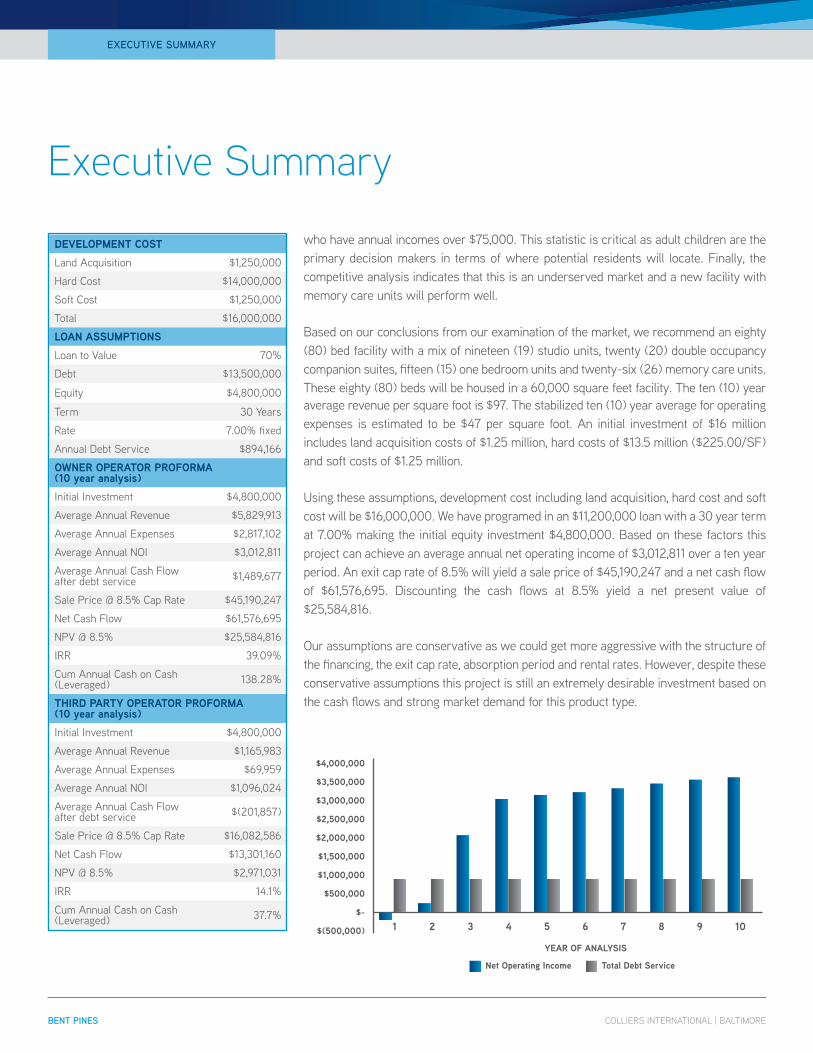
Based on our conclusions from our examination of the market, we recommend an eighty (80) bed facility with a mix of nineteen (19) studio units, twenty (20) double occupancy companion suites, fifteen (15) one bedroom units and twenty-six (26) memory care units. these eighty (80) beds will be housed in a 60,000 square feet facility. the ten (10) year average revenue per square foot is $97. the stabilized ten (10) year average for operating expenses is estimated to be $47 per square foot. an initial investment of $16 million includes land acquisition costs of $1.25 million, hard costs of $13.5 million ($225.00/SF) and soft costs of $1.25 million.
Using these assumptions, development cost including land acquisition, hard cost and soft cost will be $16,000,000. We have programed in an $11,200,000 loan with a 30 year term at 7.00% making the initial equity investment $4,800,000. Based on these factors this project can achieve an average annual net operating income of $3,012,811 over a ten year period. an exit cap rate of 8.5% will yield a sale price of $45,190,247 and a net cash flow of $61,576,695. discounting the cash flows at 8.5% yield a net present value of $25,584,816.
Our assumptions are conservative as we could get more aggressive with the structure of the financing, the exit cap rate, absorption period and rental rates. However, despite these conservative assumptions this project is still an extremely desirable investment based on the cash flows and strong market demand for this product type.
executive summary
ExEcuTivE SummaRY
DEvELOPMENT COSTland acquisition $1,250,000
Hard cost $14,000,000
Soft cost $1,250,000
total $16,000,000
LOAN ASSuMPTIONSloan to Value 70%
debt $13,500,000
equity $4,800,000
term 30 Years
rate 7.00% fixed
annual debt Service $894,166
OWNER OPERATOR PROfORMA (10 year analysis)initial investment $4,800,000
average annual revenue $5,829,913
average annual expenses $2,817,102
average annual NOi $3,012,811
average annual cash Flow after debt service $1,489,677
Sale Price @ 8.5% cap rate $45,190,247
Net cash Flow $61,576,695
NPV @ 8.5% $25,584,816
irr 39.09%
cum annual cash on cash (leveraged) 138.28%
ThIRD PARTY OPERATOR PROfORMA (10 year analysis)initial investment $4,800,000
average annual revenue $1,165,983
average annual expenses $69,959
average annual NOi $1,096,024
average annual cash Flow after debt service $(201,857)
Sale Price @ 8.5% cap rate $16,082,586
Net cash Flow $13,301,160
NPV @ 8.5% $2,971,031
irr 14.1%
cum annual cash on cash (leveraged) 37.7%
$4,000,000
$3,500,000
$3,000,000
$2,500,000
$2,000,000
$1,500,000
$1,000,000
$500,000
$-
$(500,000)
YEAR Of ANALYSIS
Net Operating Income Total Debt Service

situatiOn Overview / Market synOpsis
national senior living perspectiveinformation provided by: U.S. census Bureaureport: tHe NeXt FOUr decadeS; the Older Population in the United States: 2010 to 2050may 2010
1 In this report, the “older population” refers to those aged 65 and older. 2 This report discusses data for the United States, including the 50 states and the District of Columbia; it does not include data for Puerto Rico. 3 The baby boomer generation consists of people born between 1946 and 1964. 4 The data shown in Figure 1 represent a July 1 population, and because the baby boom began roughly in July 1946, the start of the baby boom is seen for age 63 rather than age 64, as would be suggested by the difference in the years 1946–2010 (Hogan, Perez, and Bell, 2008, Who (Really) Are the First Baby Boomers?, In JSM Proceedings, Social Statistics Section, Alexandria, VA: American Statistical Association, pp. 1009–1016). 5 The echo of the baby boomers refers to the children born to baby boomers. 6 In this report, the term “oldest old” refers to those aged 85 and older.
COLLIERS INTERNATIONAL | BALTIMORE BENT PINES
SiTuaTioN ovERviEw/maRKET SYNoPSiS
iNTRoDucTioN
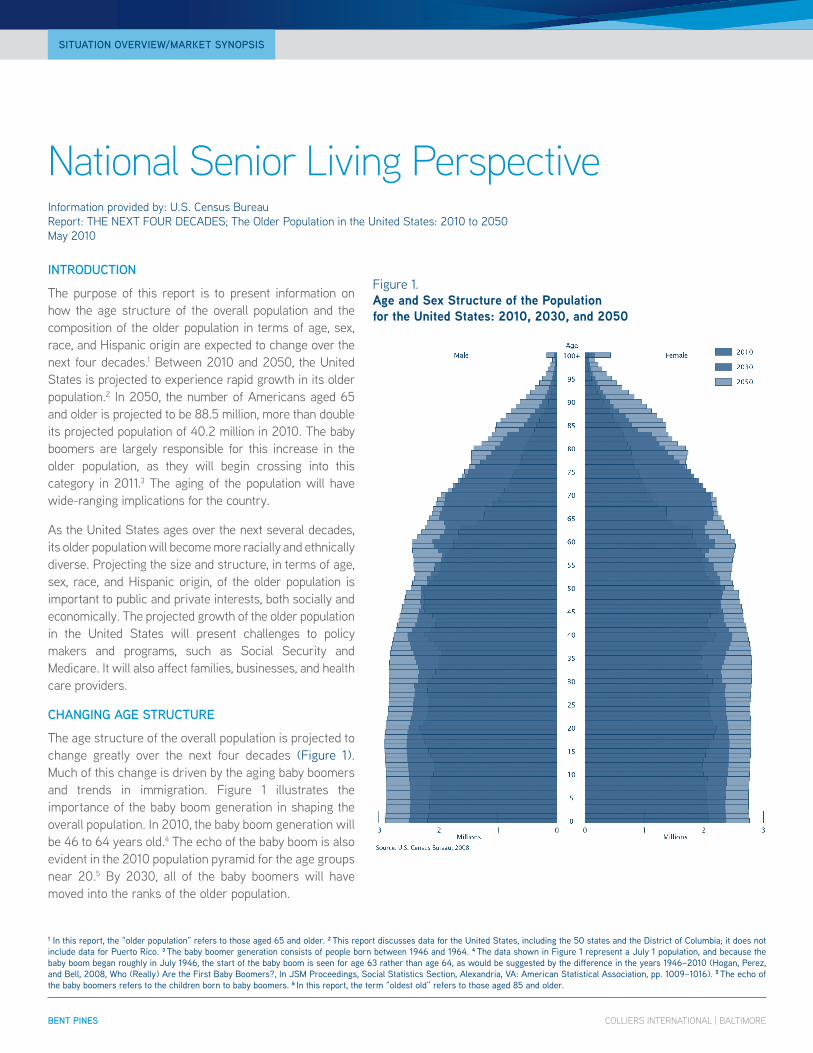
the purpose of this report is to present information on how the age structure of the overall population and the composition of the older population in terms of age, sex, race, and Hispanic origin are expected to change over the next four decades.1 Between 2010 and 2050, the United States is projected to experience rapid growth in its older population.2 in 2050, the number of americans aged 65 and older is projected to be 88.5 million, more than double its projected population of 40.2 million in 2010. the baby boomers are largely responsible for this increase in the older population, as they will begin crossing into this category in 2011.3 the aging of the population will have wide-ranging implications for the country.
as the United States ages over the next several decades, its older population will become more racially and ethnically diverse. Projecting the size and structure, in terms of age, sex, race, and Hispanic origin, of the older population is important to public and private interests, both socially and economically. the projected growth of the older population in the United States will present challenges to policy makers and programs, such as Social Security and medicare. it will also affect families, businesses, and health care providers.
cHaNGiNG aGE STRucTuRE
the age structure of the overall population is projected to change greatly over the next four decades (Figure 1). much of this change is driven by the aging baby boomers and trends in immigration. Figure 1 illustrates the importance of the baby boom generation in shaping the overall population. in 2010, the baby boom generation will be 46 to 64 years old.4 the echo of the baby boom is also evident in the 2010 population pyramid for the age groups near 20.5 By 2030, all of the baby boomers will have moved into the ranks of the older population.
Figure 1.Age and Sex Structure of the Population for the united States: 2010, 2030, and 2050
national senior living perspectiveinformation provided by: U.S. census Bureaureport: tHe NeXt FOUr decadeS; the Older Population in the United States: 2010 to 2050may 2010
Source: U.S. Census Bureau
COLLIERS INTERNATIONAL | BALTIMORE BENT PINES
SiTuaTioN ovERviEw/maRKET SYNoPSiS
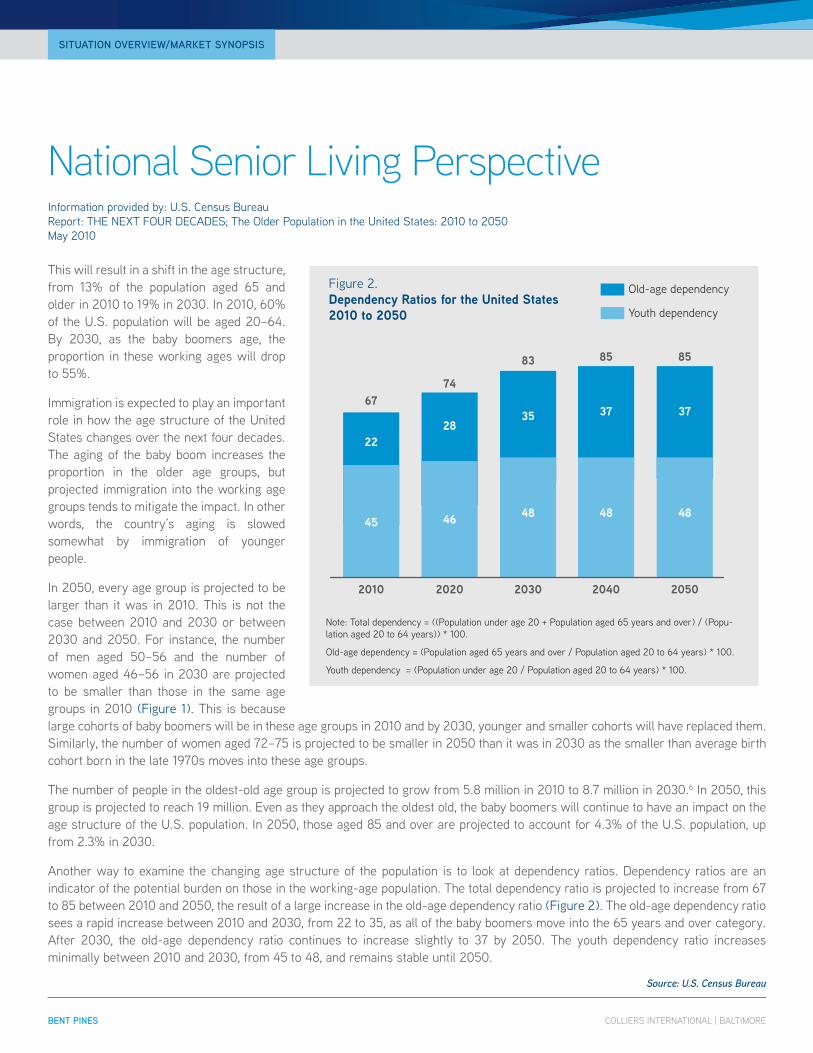
this will result in a shift in the age structure, from 13% of the population aged 65 and older in 2010 to 19% in 2030. in 2010, 60% of the U.S. population will be aged 20–64. By 2030, as the baby boomers age, the proportion in these working ages will drop to 55%.
immigration is expected to play an important role in how the age structure of the United States changes over the next four decades. the aging of the baby boom increases the proportion in the older age groups, but projected immigration into the working age groups tends to mitigate the impact. in other words, the country’s aging is slowed somewhat by immigration of younger people.
in 2050, every age group is projected to be larger than it was in 2010. this is not the case between 2010 and 2030 or between 2030 and 2050. For instance, the number of men aged 50–56 and the number of women aged 46–56 in 2030 are projected to be smaller than those in the same age groups in 2010 (Figure 1). this is because large cohorts of baby boomers will be in these age groups in 2010 and by 2030, younger and smaller cohorts will have replaced them. Similarly, the number of women aged 72–75 is projected to be smaller in 2050 than it was in 2030 as the smaller than average birth cohort born in the late 1970s moves into these age groups.
the number of people in the oldest-old age group is projected to grow from 5.8 million in 2010 to 8.7 million in 2030.6 in 2050, this group is projected to reach 19 million. even as they approach the oldest old, the baby boomers will continue to have an impact on the age structure of the U.S. population. in 2050, those aged 85 and over are projected to account for 4.3% of the U.S. population, up from 2.3% in 2030.
another way to examine the changing age structure of the population is to look at dependency ratios. dependency ratios are an indicator of the potential burden on those in the working-age population. the total dependency ratio is projected to increase from 67 to 85 between 2010 and 2050, the result of a large increase in the old-age dependency ratio (Figure 2). the old-age dependency ratio sees a rapid increase between 2010 and 2030, from 22 to 35, as all of the baby boomers move into the 65 years and over category. after 2030, the old-age dependency ratio continues to increase slightly to 37 by 2050. the youth dependency ratio increases minimally between 2010 and 2030, from 45 to 48, and remains stable until 2050.
Figure 2.Dependency Ratios for the united States2010 to 2050
Old-age dependency
Youth dependency
Note: total dependency = ((Population under age 20 + Population aged 65 years and over) / (Popu-lation aged 20 to 64 years)) * 100.
Old-age dependency = (Population aged 65 years and over / Population aged 20 to 64 years) * 100.
Youth dependency = (Population under age 20 / Population aged 20 to 64 years) * 100.
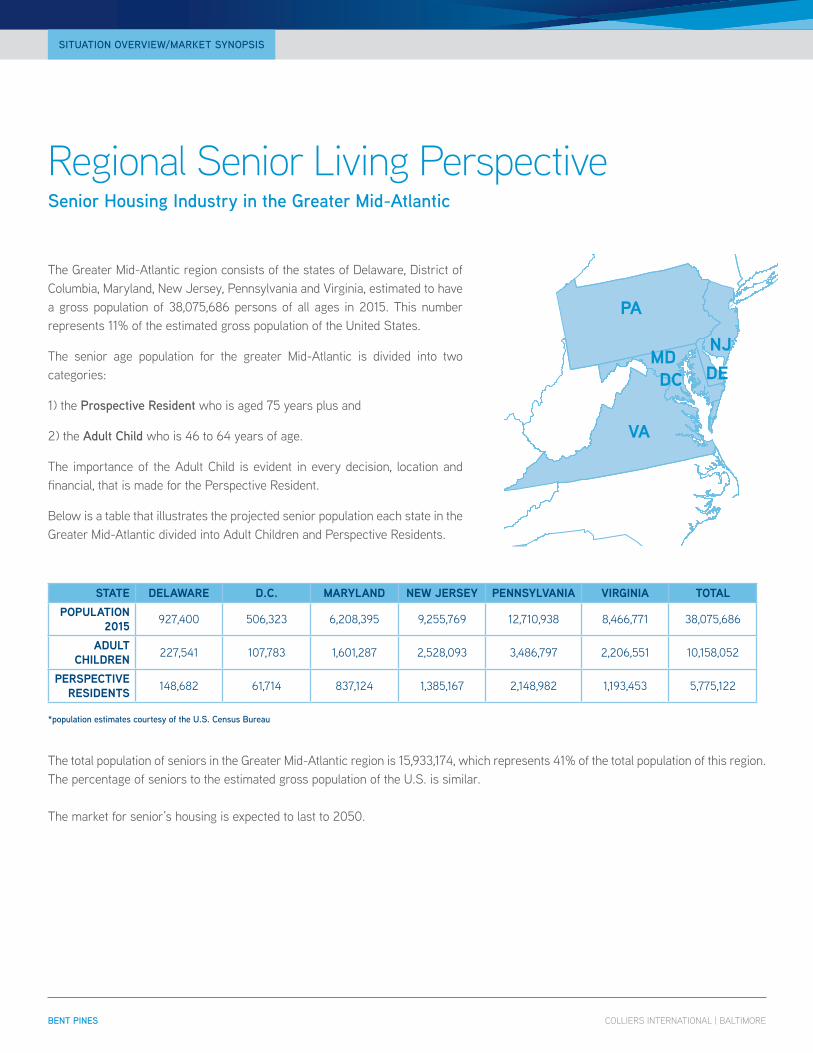
regional senior living perspective Senior Housing industry in the Greater mid-atlantic
the Greater mid-atlantic region consists of the states of delaware, district of columbia, maryland, New Jersey, Pennsylvania and Virginia, estimated to have a gross population of 38,075,686 persons of all ages in 2015. this number represents 11% of the estimated gross population of the United States.
the senior age population for the greater mid-atlantic is divided into two categories:
1) the Prospective Resident who is aged 75 years plus and
2) the adult child who is 46 to 64 years of age.
the importance of the adult child is evident in every decision, location and financial, that is made for the Perspective resident.
Below is a table that illustrates the projected senior population each state in the Greater mid-atlantic divided into adult children and Perspective residents.
*population estimates courtesy of the u.S. census Bureau
the total population of seniors in the Greater mid-atlantic region is 15,933,174, which represents 41% of the total population of this region. the percentage of seniors to the estimated gross population of the U.S. is similar.
the market for senior’s housing is expected to last to 2050.
COLLIERS INTERNATIONAL | BALTIMORE BENT PINES
SiTuaTioN ovERviEw/maRKET SYNoPSiS
STATE DELAWARE D.C. MARYLAND NEW JERSEY PENNSYLvANIA vIRGINIA TOTALPOPuLATION
2015 927,400 506,323 6,208,395 9,255,769 12,710,938 8,466,771 38,075,686
ADuLT ChILDREN 227,541 107,783 1,601,287 2,528,093 3,486,797 2,206,551 10,158,052
PERSPECTIvE RESIDENTS 148,682 61,714 837,124 1,385,167 2,148,982 1,193,453 5,775,122
local senior living perspective Senior Housing industry
COLLIERS INTERNATIONAL | BALTIMORE BENT PINES
SiTuaTioN ovERviEw/maRKET SYNoPSiS
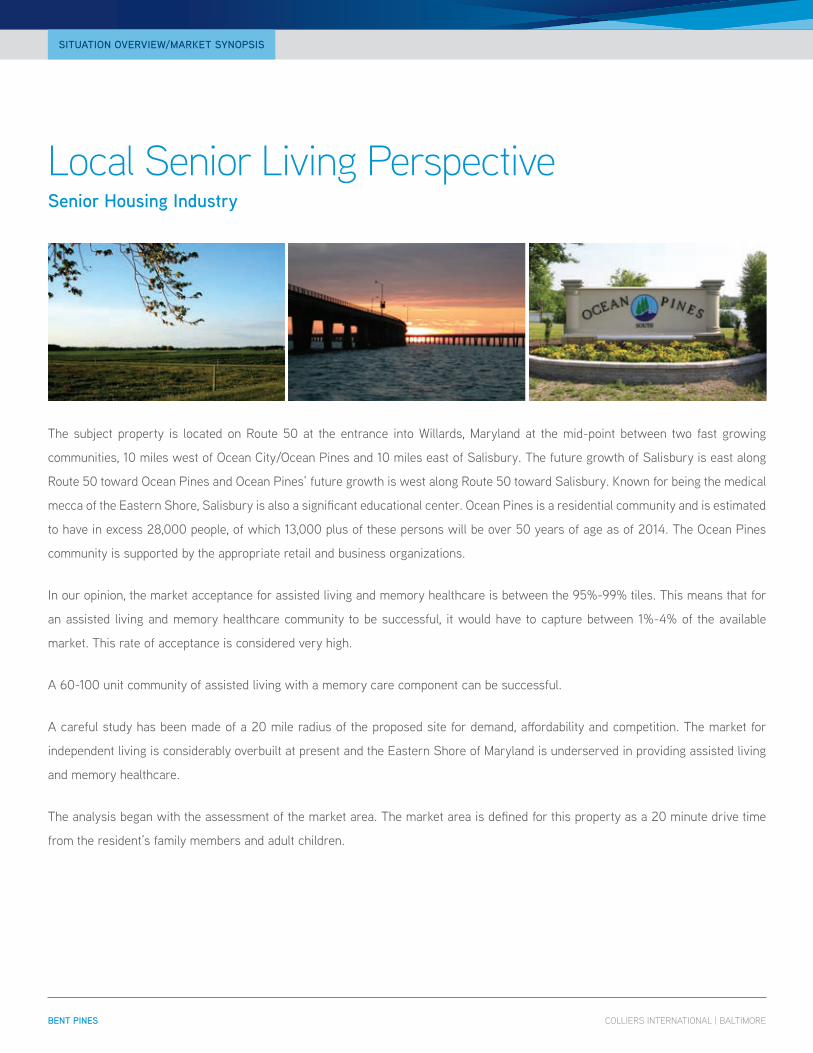
the subject property is located on route 50 at the entrance into Willards, maryland at the mid-point between two fast growing
communities, 10 miles west of Ocean city/Ocean Pines and 10 miles east of Salisbury. the future growth of Salisbury is east along
route 50 toward Ocean Pines and Ocean Pines’ future growth is west along route 50 toward Salisbury. Known for being the medical
mecca of the eastern Shore, Salisbury is also a significant educational center. Ocean Pines is a residential community and is estimated
to have in excess 28,000 people, of which 13,000 plus of these persons will be over 50 years of age as of 2014. the Ocean Pines
community is supported by the appropriate retail and business organizations.
in our opinion, the market acceptance for assisted living and memory healthcare is between the 95%-99% tiles. this means that for
an assisted living and memory healthcare community to be successful, it would have to capture between 1%-4% of the available
market. this rate of acceptance is considered very high.
a 60-100 unit community of assisted living with a memory care component can be successful.
a careful study has been made of a 20 mile radius of the proposed site for demand, affordability and competition. the market for
independent living is considerably overbuilt at present and the eastern Shore of maryland is underserved in providing assisted living
and memory healthcare.
the analysis began with the assessment of the market area. the market area is defined for this property as a 20 minute drive time
from the resident’s family members and adult children.
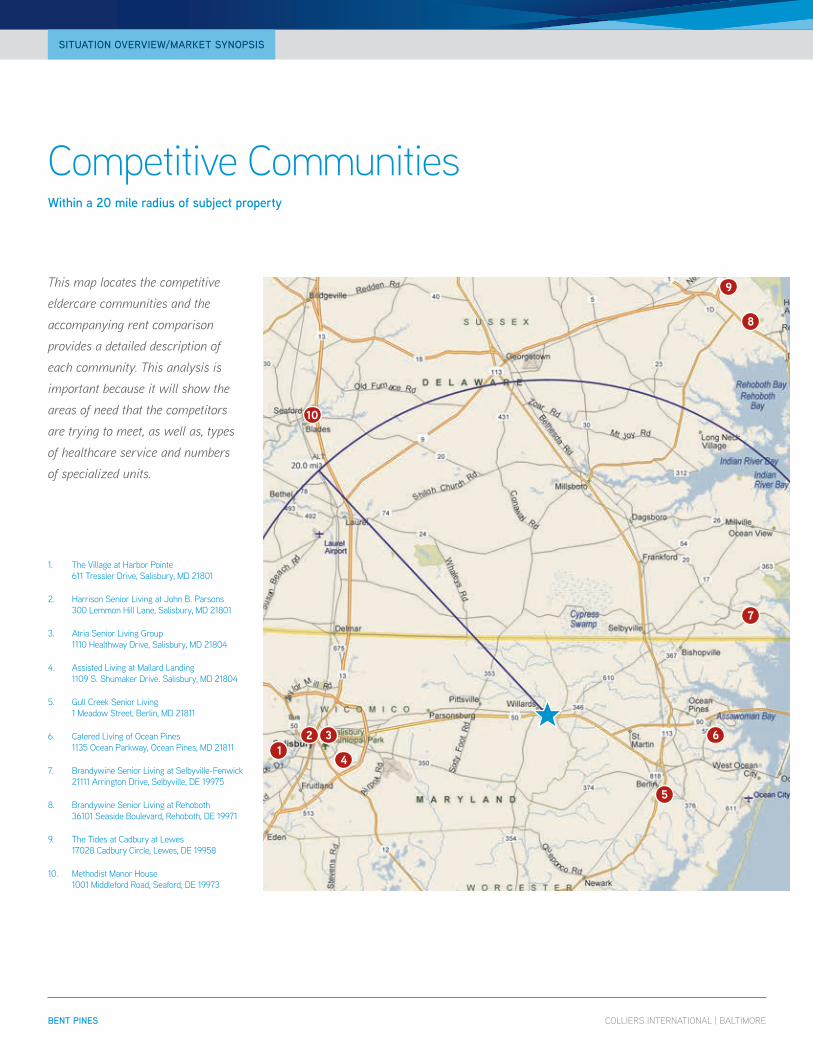
competitive communitieswithin a 20 mile radius of subject property
Copyright © and (P) 1988–2010 Microsoft Corporation and/or its suppliers. All rights reserved. http://www.microsoft.com/streets/Certain mapping and direction data © 2010 NAVTEQ. All rights reserved. The Data for areas of Canada includes information taken with permission from Canadian authorities, including: © Her Majesty the Queen in Right of Canada, © Queen's Printer for Ontario. NAVTEQ and NAVTEQ ON BOARD are trademarks of NAVTEQ. © 2010 Tele Atlas North America, Inc. All rights reserved. Tele Atlas and Tele Atlas North America are trademarks of Tele Atlas, Inc. © 2010 by Applied Geographic Systems. All rights reserved.
Maryland, United States, North America
0 mi 5 10 15
This map locates the competitive
eldercare communities and the
accompanying rent comparison
provides a detailed description of
each community. This analysis is
important because it will show the
areas of need that the competitors
are trying to meet, as well as, types
of healthcare service and numbers
of specialized units.
1. the Village at Harbor Pointe 611 tressler drive, Salisbury, md 21801
2. Harrison Senior living at John B. Parsons 300 lemmon Hill lane, Salisbury, md 21801
3. atria Senior living Group 1110 Healthway drive, Salisbury, md 21804
4. assisted living at mallard landing 1109 S. Shumaker drive. Salisbury, md 21804
5. Gull creek Senior living 1 meadow Street, Berlin, md 21811
6. catered living of Ocean Pines 1135 Ocean Parkway, Ocean Pines, md 21811
7. Brandywine Senior living at Selbyville-Fenwick 21111 arrington drive, Selbyville, de 19975
8. Brandywine Senior living at rehoboth 36101 Seaside Boulevard, rehoboth, de 19971
9. the tides at cadbury at lewes 17028 cadbury circle, lewes, de 19958
10. methodist manor House 1001 middleford road, Seaford, de 19973
COLLIERS INTERNATIONAL | BALTIMORE BENT PINES
SiTuaTioN ovERviEw/maRKET SYNoPSiS
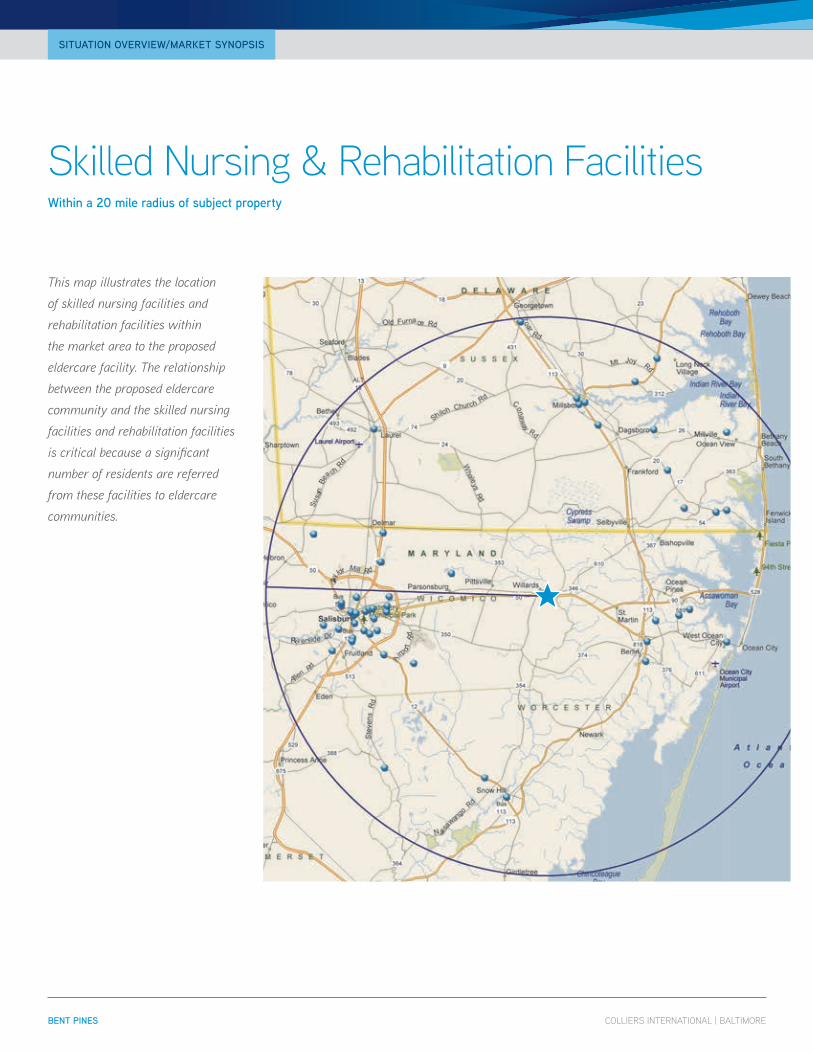
skilled nursing & rehabilitation facilitieswithin a 20 mile radius of subject property
Copyright © and (P) 1988–2010 Microsoft Corporation and/or its suppliers. All rights reserved. http://www.microsoft.com/streets/Certain mapping and direction data © 2010 NAVTEQ. All rights reserved. The Data for areas of Canada includes information taken with permission from Canadian authorities, including: © Her Majesty the Queen in Right of Canada, © Queen's Printer for Ontario. NAVTEQ and NAVTEQ ON BOARD are trademarks of NAVTEQ. © 2010 Tele Atlas North America, Inc. All rights reserved. Tele Atlas and Tele Atlas North America are trademarks of Tele Atlas, Inc. © 2010 by Applied Geographic Systems. All rights reserved.
Maryland, United States, North America
0 mi 5 10 15
This map illustrates the location
of skilled nursing facilities and
rehabilitation facilities within
the market area to the proposed
eldercare facility. The relationship
between the proposed eldercare
community and the skilled nursing
facilities and rehabilitation facilities
is critical because a significant
number of residents are referred
from these facilities to eldercare
communities.
COLLIERS INTERNATIONAL | BALTIMORE BENT PINES
SiTuaTioN ovERviEw/maRKET SYNoPSiS
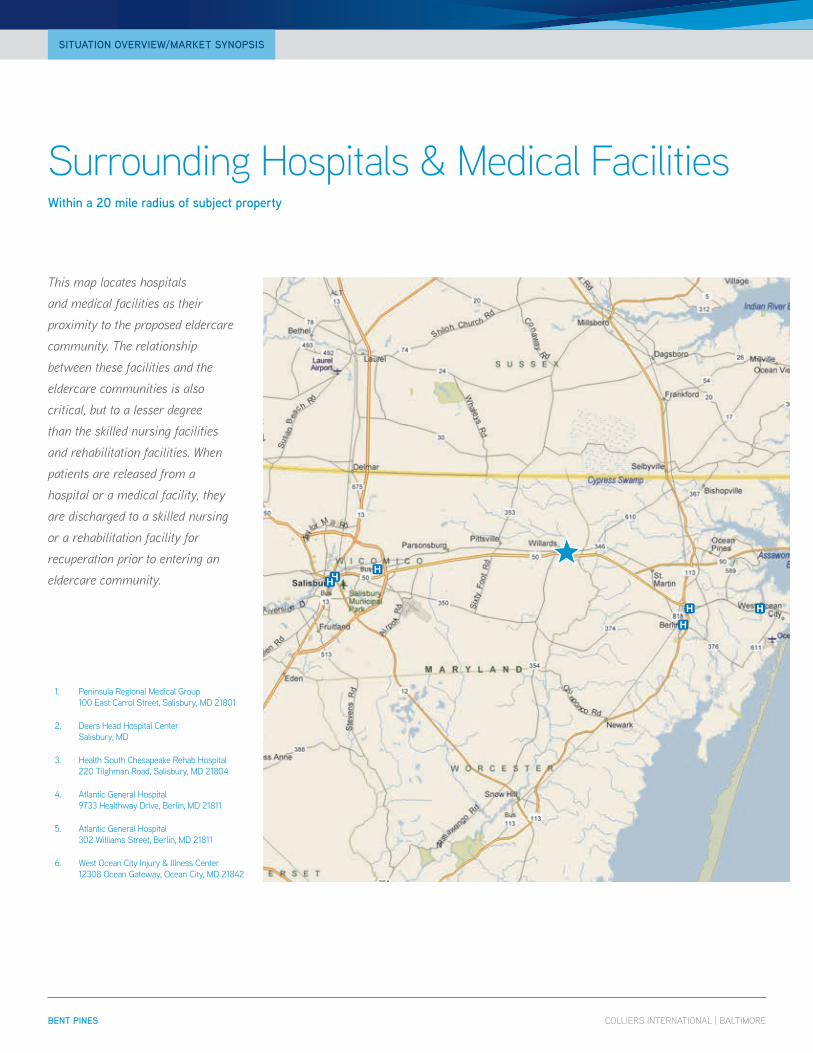
surrounding Hospitals & Medical facilitieswithin a 20 mile radius of subject property
Copyright © and (P) 1988–2010 Microsoft Corporation and/or its suppliers. All rights reserved. http://www.microsoft.com/streets/Certain mapping and direction data © 2010 NAVTEQ. All rights reserved. The Data for areas of Canada includes information taken with permission from Canadian authorities, including: © Her Majesty the Queen in Right of Canada, © Queen's Printer for Ontario. NAVTEQ and NAVTEQ ON BOARD are trademarks of NAVTEQ. © 2010 Tele Atlas North America, Inc. All rights reserved. Tele Atlas and Tele Atlas North America are trademarks of Tele Atlas, Inc. © 2010 by Applied Geographic Systems. All rights reserved.
Maryland, United States, North America
0 mi 5 10 15
This map locates hospitals
and medical facilities as their
proximity to the proposed eldercare
community. The relationship
between these facilities and the
eldercare communities is also
critical, but to a lesser degree
than the skilled nursing facilities
and rehabilitation facilities. When
patients are released from a
hospital or a medical facility, they
are discharged to a skilled nursing
or a rehabilitation facility for
recuperation prior to entering an
eldercare community.
1. Peninsula regional medical Group 100 east carrol Street, Salisbury, md 21801
2. deers Head Hospital center Salisbury, md
3. Health South chesapeake rehab Hospital 220 tilghman road, Salisbury, md 21804
4. atlantic General Hospital 9733 Healthway drive, Berlin, md 21811
5. atlantic General Hospital 302 Williams Street, Berlin, md 21811
6. West Ocean city injury & illness center 12308 Ocean Gateway, Ocean city, md 21842
COLLIERS INTERNATIONAL | BALTIMORE BENT PINES
SiTuaTioN ovERviEw/maRKET SYNoPSiS
recommendations
COLLIERS INTERNATIONAL | BALTIMORE BENT PINES
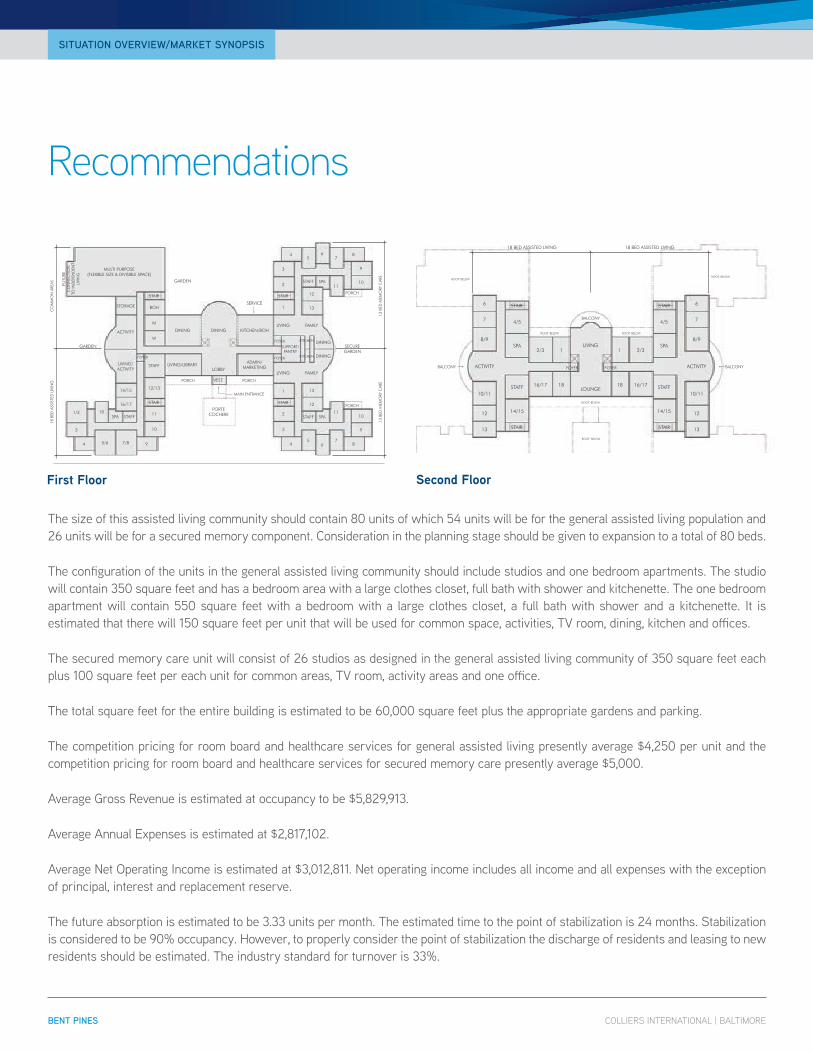
the size of this assisted living community should contain 80 units of which 54 units will be for the general assisted living population and 26 units will be for a secured memory component. consideration in the planning stage should be given to expansion to a total of 80 beds.
the configuration of the units in the general assisted living community should include studios and one bedroom apartments. the studio will contain 350 square feet and has a bedroom area with a large clothes closet, full bath with shower and kitchenette. the one bedroom apartment will contain 550 square feet with a bedroom with a large clothes closet, a full bath with shower and a kitchenette. it is estimated that there will 150 square feet per unit that will be used for common space, activities, tV room, dining, kitchen and offices.
the secured memory care unit will consist of 26 studios as designed in the general assisted living community of 350 square feet each plus 100 square feet per each unit for common areas, tV room, activity areas and one office.
the total square feet for the entire building is estimated to be 60,000 square feet plus the appropriate gardens and parking.
the competition pricing for room board and healthcare services for general assisted living presently average $4,250 per unit and the competition pricing for room board and healthcare services for secured memory care presently average $5,000.
average Gross revenue is estimated at occupancy to be $5,829,913.
average annual expenses is estimated at $2,817,102.
average Net Operating income is estimated at $3,012,811. Net operating income includes all income and all expenses with the exception of principal, interest and replacement reserve.
the future absorption is estimated to be 3.33 units per month. the estimated time to the point of stabilization is 24 months. Stabilization is considered to be 90% occupancy. However, to properly consider the point of stabilization the discharge of residents and leasing to new residents should be estimated. the industry standard for turnover is 33%.
SiTuaTioN ovERviEw/maRKET SYNoPSiS
BENT PINES ASSISTED LIVINGWILLARDS, MARYLAND
October 18, 2012 5’ 10’ 25’ 50’
N
GROUND FLOOR PLAN
LOBBY
VEST.
FOYER
FOYER KITCHEN
KITCHENFOYER
PORTECOCHERE
LIVING/LIBRARYADMIN/
MARKETING
KITCHEN/BOH
SECUREGARDEN
GARDEN
10
10
9
9
8
8
4
4
12
12
STAFF
STAFF
SUPPORT/PANTRY
SPA
SPA
13
13
3
3
2
2
1
1
STAIRSTAIR
STAIR STAIR
7
7
11
11
6
6
5
5
DINING
GARDEN
SERVICESTORAGE
STAFF
12/1314/15
16/17
1/2
3
4 9
10
11STAFFSPA
18
5/6 7/8
ACTIVITY
LIVING/ACTIVITY
BOH
M
W
MULTI PURPOSE(FLEXIBLE SIZE & DIVISIBLE SPACE)
DINING
DINING
DINING
FAMILYLIVING
FAMILY
PORCH
13 B
ED M
EMO
RY C
ARE
CO
MM
ON
ARE
AS FUTU
RE
CO
NN
ECTI
ON
TO
IND
EPEN
DEN
T LI
VIN
G
13 B
ED M
EMO
RY C
ARE
18 B
ED A
SSIS
TED
LIV
ING PORCH PORCH
MAIN ENTRANCE
PORCH
LIVING
BENT PINES ASSISTED LIVINGWILLARDS, MARYLAND
October 18, 20125’ 10’ 25’ 50’
N
SECOND FLOOR PLAN
6 6
13 13
7 7
12 12
4/5 4/5
14/15 14/15
SPA SPA
STAFF STAFF
8/9 8/9
10/11 10/11
2/3 2/3
16/17 16/17
1 1
18 18
STAIR STAIR
STAIR STAIR
ACTIVITY ACTIVITY
LIVING
roof below
roof below
roof below
roof below
roof below
foYerfoYer
bAlCoNY
bAlCoNY bAlCoNY
roof below roof below
roof below
LOUNGE
18 BED ASSISTED LIVING 18 BED ASSISTED LIVING
additional plans
BENT PINES ASSISTED LIVINGWILLARDS, MARYLAND
October 18, 2012SITE MASTER PLAN
MAIN ENTRY
80 BED ASSISTED LIVING
WB
WB BRL
BRL
BRL
FUTURE
EXPANSION
BENT PIN
E ROAD
(400’ TO U
S RT 50)
POCKET PARK
OUTDOOR
AMENITY SPACE
COVERED PORTE COCHERE DROP OFF
WETLAND BUFFER LINE
MEMORY SUPPORT
SECURE OUTDOOR
AMENITY
BUILDING
RESTRICTION
LINE
SERVICE ROAD SERVICE AREA
Site Master Plan2.5’
UNITS PLANSBENT PINES ASSISTED LIVING
WILLARDS, MARYLANDOctober 18, 2012
LIVING / BEDROOM
(190 SF)
LIVING / BEDROOM
(130 SF)
LIVING / BEDROOM
(140 SF)
CLOSET
CLOSET
LINEN
KITCHENETTE
CLOSET
LINEN
KITCHENETTE
BATHROOM BATHROOM
STUDIO
350 SF
COMPANION SUITE
525 SF
14’-10” 22’-3”
24’-0”
BROWN CRAIG TURNER
one charles center
100 n charles street 18th floor
baltimore, md 21201
t 410.837.2727
f 410.837.7447
www.bctarchitects.com
copyright © 2012 bct
BENT PINES ASSISTED LIVING
WILLARDS, MARYLAND
October 15, 2012
MASTER PLAN
Scale: 1/4” = 1’-0”
5’ 10’
units Plan
COLLIERS INTERNATIONAL | BALTIMORE BENT PINES
SiTuaTioN ovERviEw/maRKET SYNoPSiS

financial analysis
assumptions
DEvELOPMENT/OPERATING ASSuMPTIONSProperty type Senior assisted livingProperty Size 60,000 SF, 80 bedsanalysis Start January 2013analysis end december 2022inflation 3.00% General Vacancy rate 5.00%credit collection loss 0.50%initial investment $16 millionland acquisition $1.25 millionHard cost $13.5 million ($225/SF)Soft cost $1.25 million Operating expenses Stabilized $33.33/SF
LEASING ASSuMPTIONSabsorption 24 monthsPre-leased no units pre-leased
DEBT ASSuMPTIONSamount - $11,200,000loan to Value – 70%rate – 7.00% fixedterm – 30 years
colliers based the financial model for the subject property on a ten (10) year analysis period with twelve (12) months of construction and
a general inflation rate of 3.00%. development cost including land acquisition, hard cost and soft cost total $16,000,000 with an $11,200,000
loan with a 30 year term at 7.00% making the initial equity investment $4,800,000. absorption for the 80 units scheduled for 24 months
with operating expense increasing to stabilization based on estimated gross revenue. exit cap rate for the property is 8.5% based on the
final year’s net operating income. Based on these factors this project can achieve an average annual net operating income of $3,012,811
over a ten year period. an exit cap rate of 8.5% will yield a sale price of $45,190,247 and a net cash flow of $61,576,695. discounting the
cash flows at 8.5% yield a net present value of $25,584,816.
Our assumption are conservative as we could get more aggressive with the structure of the financing, the exit cap rate, absorption period
and rental rates. However, despite these conservative assumption this project is still an extremely desirable investment based on the cash
flows and strong market demand for this product type.
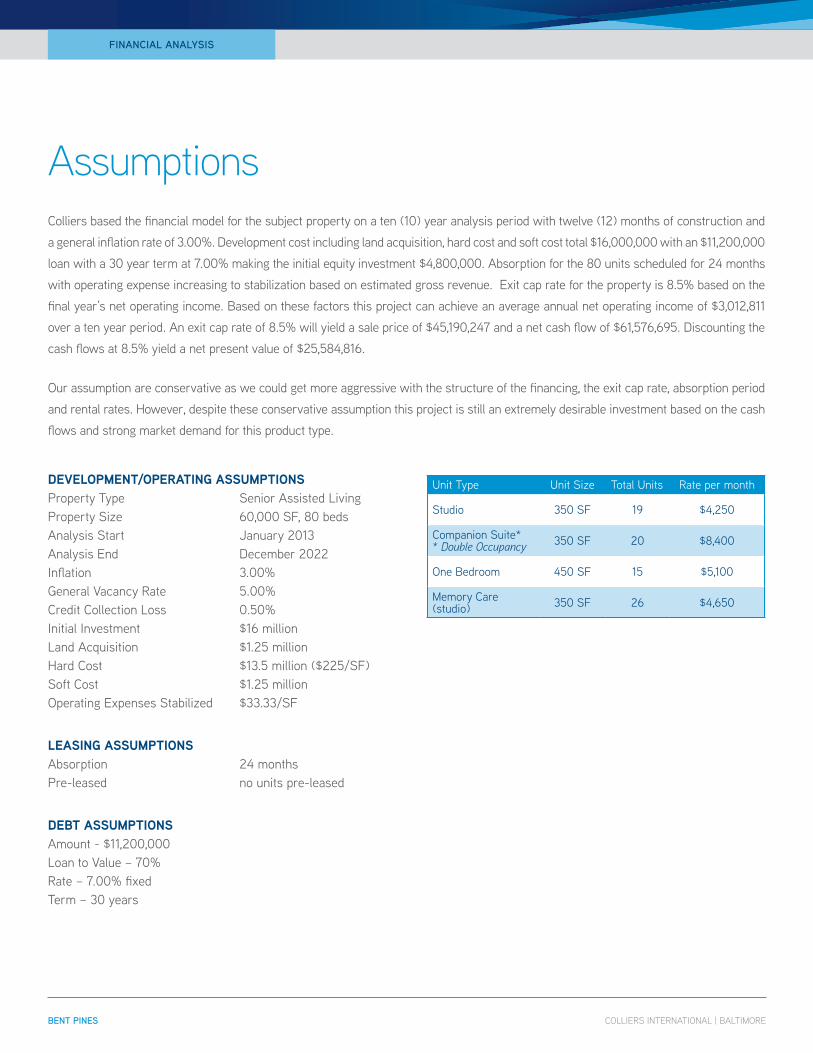
Unit type Unit Size total Units rate per month
Studio 350 SF 19 $4,250
companion Suite* * Double Occupancy 350 SF 20 $8,400
One Bedroom 450 SF 15 $5,100
memory care (studio) 350 SF 26 $4,650
COLLIERS INTERNATIONAL | BALTIMORE BENT PINES
FiNaNciaL aNaLYSiS
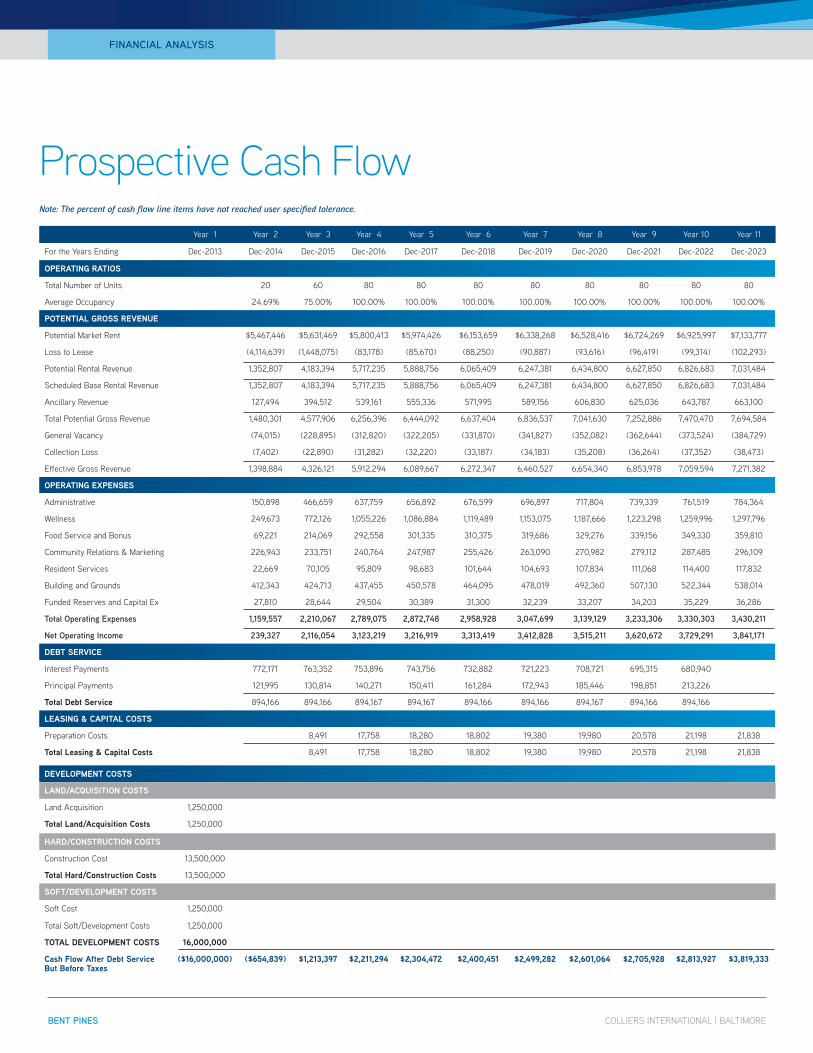
Year 1 Year 2 Year 3 Year 4 Year 5 Year 6 Year 7 Year 8 Year 9 Year 10 Year 11
For the Years ending dec-2013 dec-2014 dec-2015 dec-2016 dec-2017 dec-2018 dec-2019 dec-2020 dec-2021 dec-2022 dec-2023
OPERATING RATIOS
total Number of Units 20 60 80 80 80 80 80 80 80 80
average Occupancy 24.69% 75.00% 100.00% 100.00% 100.00% 100.00% 100.00% 100.00% 100.00% 100.00%
POTENTIAL GROSS REvENuE
Potential market rent $5,467,446 $5,631,469 $5,800,413 $5,974,426 $6,153,659 $6,338,268 $6,528,416 $6,724,269 $6,925,997 $7,133,777
loss to lease (4,114,639) (1,448,075) (83,178) (85,670) (88,250) (90,887) (93,616) (96,419) (99,314) (102,293)
Potential rental revenue 1,352,807 4,183,394 5,717,235 5,888,756 6,065,409 6,247,381 6,434,800 6,627,850 6,826,683 7,031,484
Scheduled Base rental revenue 1,352,807 4,183,394 5,717,235 5,888,756 6,065,409 6,247,381 6,434,800 6,627,850 6,826,683 7,031,484
ancillary revenue 127,494 394,512 539,161 555,336 571,995 589,156 606,830 625,036 643,787 663,100
total Potential Gross revenue 1,480,301 4,577,906 6,256,396 6,444,092 6,637,404 6,836,537 7,041,630 7,252,886 7,470,470 7,694,584
General Vacancy (74,015) (228,895) (312,820) (322,205) (331,870) (341,827) (352,082) (362,644) (373,524) (384,729)
collection loss (7,402) (22,890) (31,282) (32,220) (33,187) (34,183) (35,208) (36,264) (37,352) (38,473)
effective Gross revenue 1,398,884 4,326,121 5,912,294 6,089,667 6,272,347 6,460,527 6,654,340 6,853,978 7,059,594 7,271,382
OPERATING ExPENSES
administrative 150,898 466,659 637,759 656,892 676,599 696,897 717,804 739,339 761,519 784,364
Wellness 249,673 772,126 1,055,226 1,086,884 1,119,489 1,153,075 1,187,666 1,223,298 1,259,996 1,297,796
Food Service and Bonus 69,221 214,069 292,558 301,335 310,375 319,686 329,276 339,156 349,330 359,810
community relations & marketing 226,943 233,751 240,764 247,987 255,426 263,090 270,982 279,112 287,485 296,109
resident Services 22,669 70,105 95,809 98,683 101,644 104,693 107,834 111,068 114,400 117,832
Building and Grounds 412,343 424,713 437,455 450,578 464,095 478,019 492,360 507,130 522,344 538,014
Funded reserves and capital ex 27,810 28,644 29,504 30,389 31,300 32,239 33,207 34,203 35,229 36,286
Total operating Expenses 1,159,557 2,210,067 2,789,075 2,872,748 2,958,928 3,047,699 3,139,129 3,233,306 3,330,303 3,430,211
Net operating income 239,327 2,116,054 3,123,219 3,216,919 3,313,419 3,412,828 3,515,211 3,620,672 3,729,291 3,841,171
DEBT SERvICE
interest Payments 772,171 763,352 753,896 743,756 732,882 721,223 708,721 695,315 680,940
Principal Payments 121,995 130,814 140,271 150,411 161,284 172,943 185,446 198,851 213,226
Total Debt Service 894,166 894,166 894,167 894,167 894,166 894,166 894,167 894,166 894,166
LEASING & CAPITAL COSTS
Preparation costs 8,491 17,758 18,280 18,802 19,380 19,980 20,578 21,198 21,838
Total Leasing & Capital Costs 8,491 17,758 18,280 18,802 19,380 19,980 20,578 21,198 21,838
DEvELOPMENT COSTS
LAND/ACquISITION COSTS
land acquisition 1,250,000
Total Land/Acquisition Costs 1,250,000
hARD/CONSTRuCTION COSTS
construction cost 13,500,000
Total hard/Construction Costs 13,500,000
SOfT/DEvELOPMENT COSTS
Soft cost 1,250,000
total Soft/development costs 1,250,000
TOTAL DEvELOPMENT COSTS 16,000,000
Cash flow After Debt Service But Before Taxes
($16,000,000) ($654,839) $1,213,397 $2,211,294 $2,304,472 $2,400,451 $2,499,282 $2,601,064 $2,705,928 $2,813,927 $3,819,333
Note: The percent of cash flow line items have not reached user specified tolerance.
prospective cash flow
COLLIERS INTERNATIONAL | BALTIMORE BENT PINES
FiNaNciaL aNaLYSiS
cash flow Details
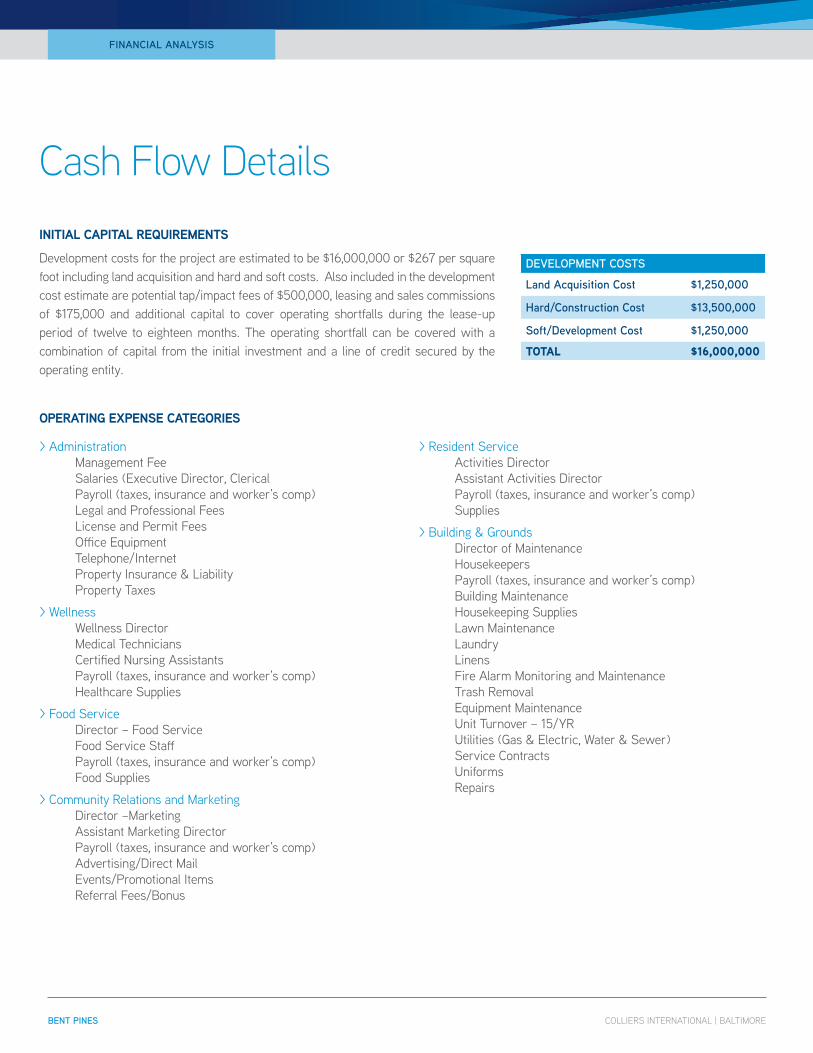
> administrationmanagement FeeSalaries (executive director, clericalPayroll (taxes, insurance and worker’s comp)legal and Professional Feeslicense and Permit FeesOffice equipmenttelephone/internetProperty insurance & liabilityProperty taxes
> WellnessWellness directormedical technicianscertified Nursing assistantsPayroll (taxes, insurance and worker’s comp)Healthcare Supplies
> Food Servicedirector – Food ServiceFood Service StaffPayroll (taxes, insurance and worker’s comp)Food Supplies
> community relations and marketingdirector –marketingassistant marketing directorPayroll (taxes, insurance and worker’s comp)advertising/direct mailevents/Promotional itemsreferral Fees/Bonus
> resident Serviceactivities directorassistant activities directorPayroll (taxes, insurance and worker’s comp)Supplies
> Building & Groundsdirector of maintenanceHousekeepersPayroll (taxes, insurance and worker’s comp)Building maintenanceHousekeeping Supplieslawn maintenancelaundrylinensFire alarm monitoring and maintenancetrash removalequipment maintenanceUnit turnover – 15/YrUtilities (Gas & electric, Water & Sewer)Service contractsUniformsrepairs
INITIAL CAPITAL REquIREMENTS
development costs for the project are estimated to be $16,000,000 or $267 per square foot including land acquisition and hard and soft costs. also included in the development cost estimate are potential tap/impact fees of $500,000, leasing and sales commissions of $175,000 and additional capital to cover operating shortfalls during the lease-up period of twelve to eighteen months. the operating shortfall can be covered with a combination of capital from the initial investment and a line of credit secured by the operating entity.
OPERATING ExPENSE CATEGORIES
DEvELoPmENT coSTS
Land acquisition cost $1,250,000
Hard/construction cost $13,500,000
Soft/Development cost $1,250,000
TOTAL $16,000,000
COLLIERS INTERNATIONAL | BALTIMORE BENT PINES
FiNaNciaL aNaLYSiS
COLLIERS INTERNATIONAL | BALTIMORE BENT PINES
FiNaNciaL aNaLYSiS
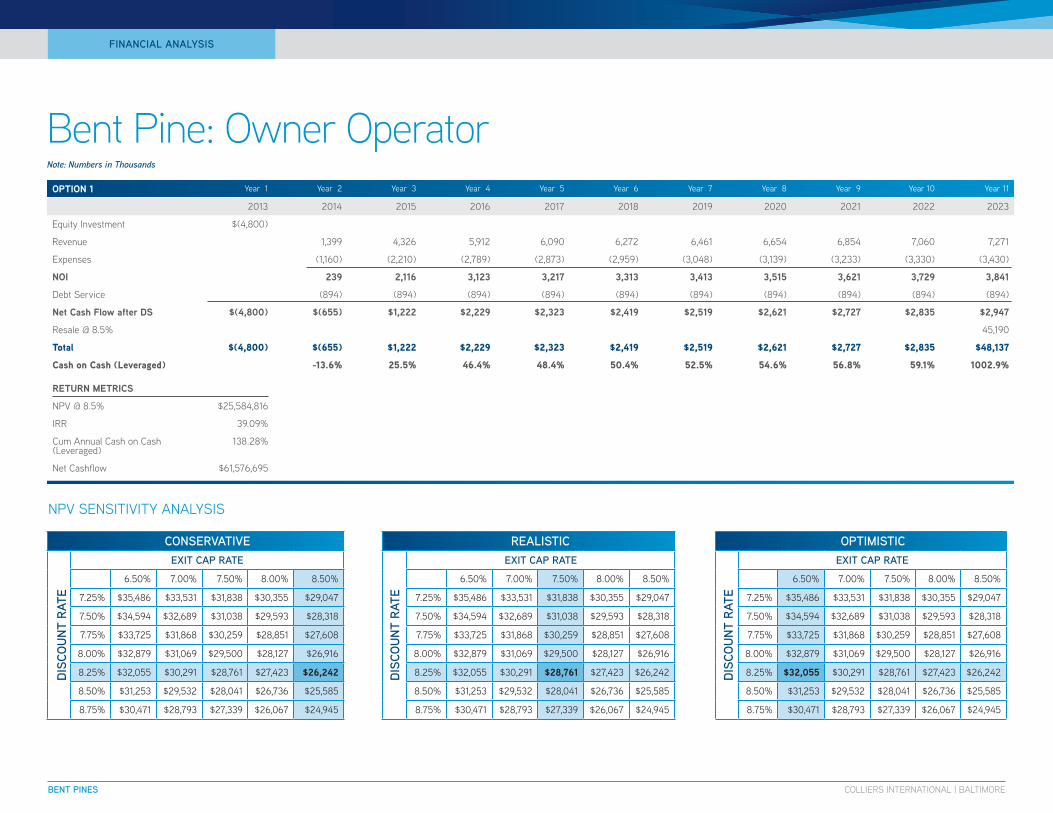
bent pine: Owner OperatorOPTION 1 Year 1 Year 2 Year 3 Year 4 Year 5 Year 6 Year 7 Year 8 Year 9 Year 10 Year 11
2013 2014 2015 2016 2017 2018 2019 2020 2021 2022 2023
equity investment $(4,800)
revenue 1,399 4,326 5,912 6,090 6,272 6,461 6,654 6,854 7,060 7,271
expenses (1,160) (2,210) (2,789) (2,873) (2,959) (3,048) (3,139) (3,233) (3,330) (3,430)
NOI 239 2,116 3,123 3,217 3,313 3,413 3,515 3,621 3,729 3,841
debt Service (894) (894) (894) (894) (894) (894) (894) (894) (894) (894)
Net Cash flow after DS $(4,800) $(655) $1,222 $2,229 $2,323 $2,419 $2,519 $2,621 $2,727 $2,835 $2,947
resale @ 8.5% 45,190
Total $(4,800) $(655) $1,222 $2,229 $2,323 $2,419 $2,519 $2,621 $2,727 $2,835 $48,137
Cash on Cash (Leveraged) -13.6% 25.5% 46.4% 48.4% 50.4% 52.5% 54.6% 56.8% 59.1% 1002.9%
RETuRN METRICS
NPV @ 8.5% $25,584,816
irr 39.09%
cum annual cash on cash (leveraged)
138.28%
Net cashflow $61,576,695
coNSERvaTivEExiT caP RaTE
6.50% 7.00% 7.50% 8.00% 8.50%
7.25% $35,486 $33,531 $31,838 $30,355 $29,047
7.50% $34,594 $32,689 $31,038 $29,593 $28,318
7.75% $33,725 $31,868 $30,259 $28,851 $27,608
8.00% $32,879 $31,069 $29,500 $28,127 $26,916
8.25% $32,055 $30,291 $28,761 $27,423 $26,242
8.50% $31,253 $29,532 $28,041 $26,736 $25,585
8.75% $30,471 $28,793 $27,339 $26,067 $24,945
DiSc
ouNT
RaT
E
REaLiSTicExiT caP RaTE
6.50% 7.00% 7.50% 8.00% 8.50%
7.25% $35,486 $33,531 $31,838 $30,355 $29,047
7.50% $34,594 $32,689 $31,038 $29,593 $28,318
7.75% $33,725 $31,868 $30,259 $28,851 $27,608
8.00% $32,879 $31,069 $29,500 $28,127 $26,916
8.25% $32,055 $30,291 $28,761 $27,423 $26,242
8.50% $31,253 $29,532 $28,041 $26,736 $25,585
8.75% $30,471 $28,793 $27,339 $26,067 $24,945
DiSc
ouNT
RaT
E
oPTimiSTicExiT caP RaTE
6.50% 7.00% 7.50% 8.00% 8.50%
7.25% $35,486 $33,531 $31,838 $30,355 $29,047
7.50% $34,594 $32,689 $31,038 $29,593 $28,318
7.75% $33,725 $31,868 $30,259 $28,851 $27,608
8.00% $32,879 $31,069 $29,500 $28,127 $26,916
8.25% $32,055 $30,291 $28,761 $27,423 $26,242
8.50% $31,253 $29,532 $28,041 $26,736 $25,585
8.75% $30,471 $28,793 $27,339 $26,067 $24,945
DiSc
ouNT
RaT
E
NPV SeNSitiVitY aNalYSiS
Note: Numbers in Thousands
COLLIERS INTERNATIONAL | BALTIMORE BENT PINES
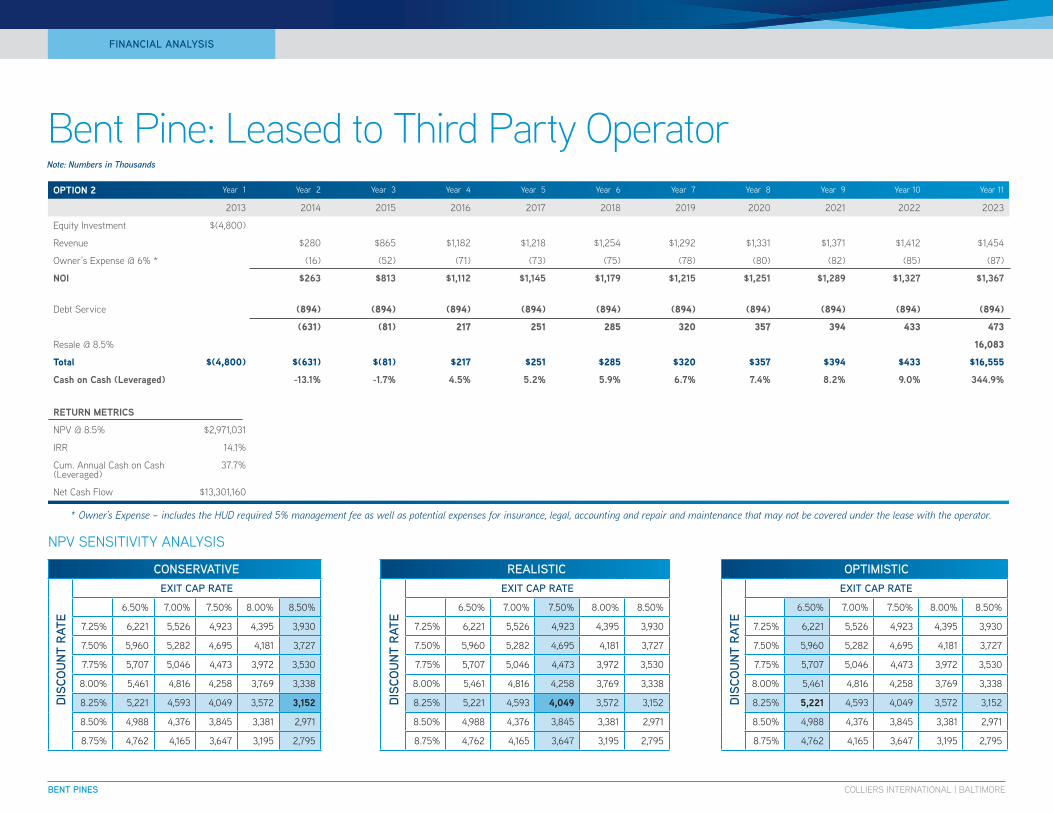
OPTION 2 Year 1 Year 2 Year 3 Year 4 Year 5 Year 6 Year 7 Year 8 Year 9 Year 10 Year 11
2013 2014 2015 2016 2017 2018 2019 2020 2021 2022 2023
equity investment $(4,800)
revenue $280 $865 $1,182 $1,218 $1,254 $1,292 $1,331 $1,371 $1,412 $1,454
Owner’s expense @ 6% * (16) (52) (71) (73) (75) (78) (80) (82) (85) (87)
NOI $263 $813 $1,112 $1,145 $1,179 $1,215 $1,251 $1,289 $1,327 $1,367
debt Service (894) (894) (894) (894) (894) (894) (894) (894) (894) (894)
(631) (81) 217 251 285 320 357 394 433 473
resale @ 8.5% 16,083
Total $(4,800) $(631) $(81) $217 $251 $285 $320 $357 $394 $433 $16,555
Cash on Cash (Leveraged) -13.1% -1.7% 4.5% 5.2% 5.9% 6.7% 7.4% 8.2% 9.0% 344.9%
RETuRN METRICS
NPV @ 8.5% $2,971,031
irr 14.1%
cum. annual cash on cash (leveraged)
37.7%
Net cash Flow $13,301,160
FiNaNciaL aNaLYSiS
bent pine: leased to third party OperatorNote: Numbers in Thousands
coNSERvaTivEExiT caP RaTE
6.50% 7.00% 7.50% 8.00% 8.50%
7.25% 6,221 5,526 4,923 4,395 3,930
7.50% 5,960 5,282 4,695 4,181 3,727
7.75% 5,707 5,046 4,473 3,972 3,530
8.00% 5,461 4,816 4,258 3,769 3,338
8.25% 5,221 4,593 4,049 3,572 3,152
8.50% 4,988 4,376 3,845 3,381 2,971
8.75% 4,762 4,165 3,647 3,195 2,795
DiSc
ouNT
RaT
E
REaLiSTicExiT caP RaTE
6.50% 7.00% 7.50% 8.00% 8.50%
7.25% 6,221 5,526 4,923 4,395 3,930
7.50% 5,960 5,282 4,695 4,181 3,727
7.75% 5,707 5,046 4,473 3,972 3,530
8.00% 5,461 4,816 4,258 3,769 3,338
8.25% 5,221 4,593 4,049 3,572 3,152
8.50% 4,988 4,376 3,845 3,381 2,971
8.75% 4,762 4,165 3,647 3,195 2,795
DiSc
ouNT
RaT
E
oPTimiSTicExiT caP RaTE
6.50% 7.00% 7.50% 8.00% 8.50%
7.25% 6,221 5,526 4,923 4,395 3,930
7.50% 5,960 5,282 4,695 4,181 3,727
7.75% 5,707 5,046 4,473 3,972 3,530
8.00% 5,461 4,816 4,258 3,769 3,338
8.25% 5,221 4,593 4,049 3,572 3,152
8.50% 4,988 4,376 3,845 3,381 2,971
8.75% 4,762 4,165 3,647 3,195 2,795Di
Scou
NT R
aTE
NPV SeNSitiVitY aNalYSiS
* Owner’s Expense – includes the HUD required 5% management fee as well as potential expenses for insurance, legal, accounting and repair and maintenance that may not be covered under the lease with the operator.

investMent teaM
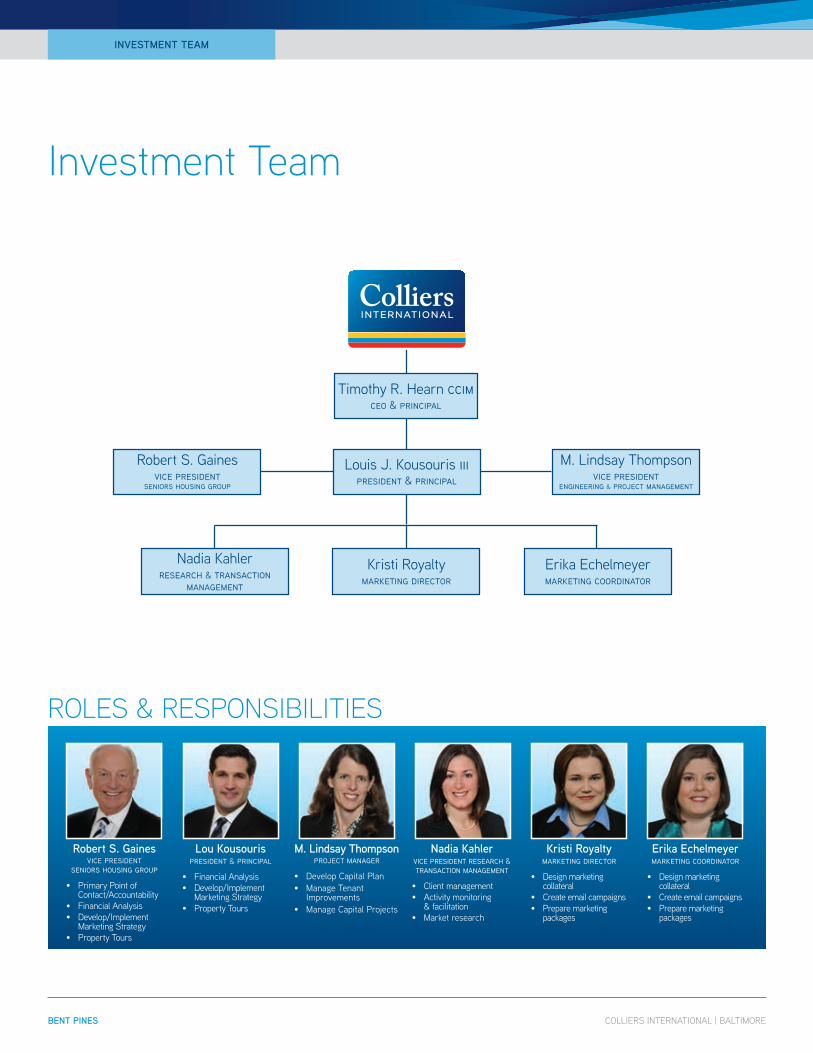
investment team
timothy r. Hearn ccimceo & principal
m. lindsay thompson vice president
engineering & project management
robert S. Gaines vice president
seniors housing group
louis J. Kousouris iii president & principal
Nadia Kahler research & transaction
management
Kristi royalty marketing director
erika echelmeyer marketing coordinator
Robert S. Gainesvice president
seniors housing group
• Primary Point of contact/accountability
• Financial analysis• develop/implement
marketing Strategy• Property tours
Lou Kousourispresident & principal
• Financial analysis• develop/implement
marketing Strategy• Property tours
Kristi Royaltymarketing director
• design marketing collateral
• create email campaigns• Prepare marketing
packages
Erika Echelmeyermarketing coordinator
• design marketing collateral
• create email campaigns• Prepare marketing
packages
Nadia Kahlervice president research & transaction management
• client management• activity monitoring
& facilitation• market research
rOles & respOnsibilities
m. Lindsay Thompsonproject manager
• develop capital Plan• manage tenant
improvements• manage capital Projects
COLLIERS INTERNATIONAL | BALTIMORE BENT PINES
iNvESTmENT TEam
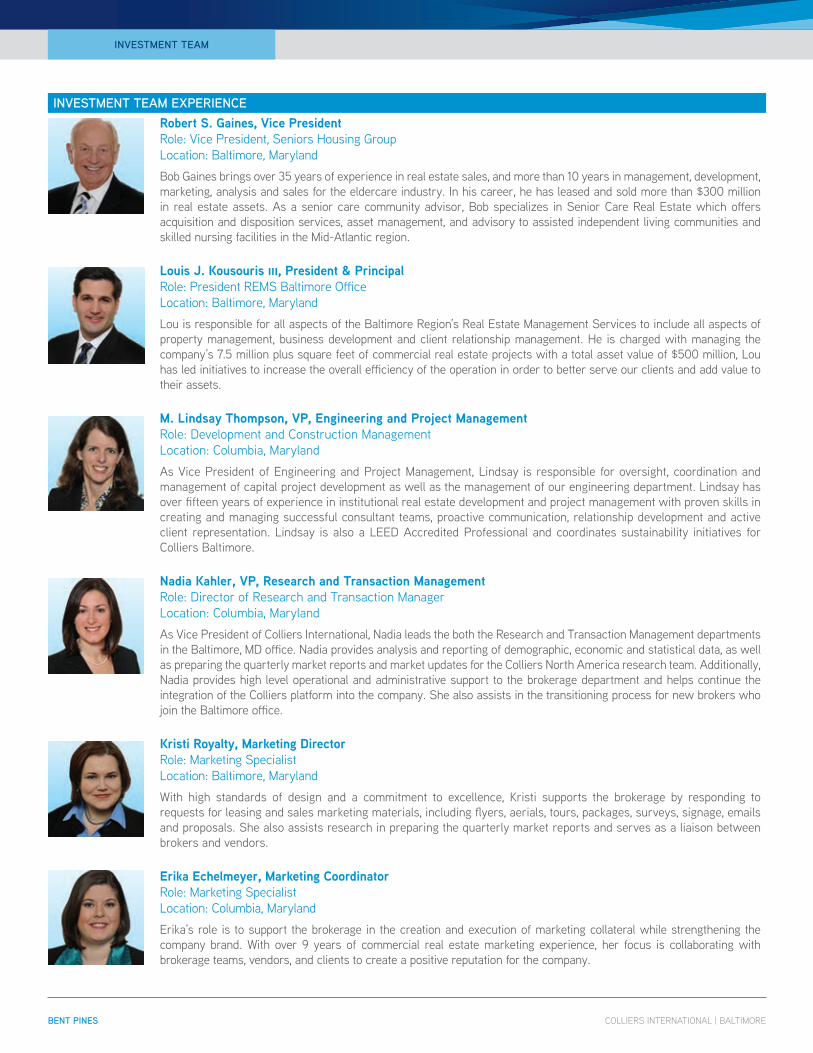
iNvESTmENT TEam ExPERiENcERobert S. Gaines, vice Presidentrole: Vice President, Seniors Housing Grouplocation: Baltimore, marylandBob Gaines brings over 35 years of experience in real estate sales, and more than 10 years in management, development, marketing, analysis and sales for the eldercare industry. in his career, he has leased and sold more than $300 million in real estate assets. as a senior care community advisor, Bob specializes in Senior care real estate which offers acquisition and disposition services, asset management, and advisory to assisted independent living communities and skilled nursing facilities in the mid-atlantic region.
Louis J. Kousouris iii, President & Principalrole: President remS Baltimore Officelocation: Baltimore, marylandlou is responsible for all aspects of the Baltimore region’s real estate management Services to include all aspects of property management, business development and client relationship management. He is charged with managing the company’s 7.5 million plus square feet of commercial real estate projects with a total asset value of $500 million, lou has led initiatives to increase the overall efficiency of the operation in order to better serve our clients and add value to their assets.
M. Lindsay Thompson, vP, Engineering and Project Management role: development and construction management location: columbia, marylandas Vice President of engineering and Project management, lindsay is responsible for oversight, coordination and management of capital project development as well as the management of our engineering department. lindsay has over fifteen years of experience in institutional real estate development and project management with proven skills in creating and managing successful consultant teams, proactive communication, relationship development and active client representation. lindsay is also a leed accredited Professional and coordinates sustainability initiatives for colliers Baltimore.
Nadia Kahler, vP, Research and Transaction Management role: director of research and transaction manager location: columbia, marylandas Vice President of colliers international, Nadia leads the both the research and transaction management departments in the Baltimore, md office. Nadia provides analysis and reporting of demographic, economic and statistical data, as well as preparing the quarterly market reports and market updates for the colliers North america research team. additionally, Nadia provides high level operational and administrative support to the brokerage department and helps continue the integration of the colliers platform into the company. She also assists in the transitioning process for new brokers who join the Baltimore office.
Kristi Royalty, Marketing Directorrole: marketing Specialistlocation: Baltimore, maryland With high standards of design and a commitment to excellence, Kristi supports the brokerage by responding to requests for leasing and sales marketing materials, including flyers, aerials, tours, packages, surveys, signage, emails and proposals. She also assists research in preparing the quarterly market reports and serves as a liaison between brokers and vendors.
Erika Echelmeyer, Marketing Coordinator role: marketing Specialistlocation: columbia, maryland erika’s role is to support the brokerage in the creation and execution of marketing collateral while strengthening the company brand. With over 9 years of commercial real estate marketing experience, her focus is collaborating with brokerage teams, vendors, and clients to create a positive reputation for the company.
COLLIERS INTERNATIONAL | BALTIMORE BENT PINES
iNvESTmENT TEam