Embed Size (px)
Citation preview

In Situ or Batch Visualizationof Biogeochemical Stateof the Mediterranean Sea
Real TimeExplorationof DataPetr Valenta
In situ visualization technique allowsscientists to explore the data whilethe simulation is running.Furthermore, they can adjust itsparameters and observe immediateimpact on the studied phenomena.This accelerates computation andprovides much better insight thantraditional approaches.
Traditionally, the process of per-forming numerical simulationsconsists of three separate steps:First, the input parameters
(such as initial or boundary conditions)are specified, then the simulation is exe-cuted and finally, in order to determinethe result, it is necessary to explore andanalyse generated data. For several lastdecades, increasing power of computerclusters and advancement in parallelcomputing methods allow scientists toperform more and more accurate sim-ulations in various fields of human re-search.
On the other hand, increasing de-mands of the simulations need moredata to be stored on a disk and anal-ysed. However, the capabilities of com-puting environment which is responsi-ble for transferring the data and com-munication have not grown up as rapidas the computational power. Dumping
and processing of all the data calculatedduring the simulation would take toomuch time, so in practice this usuallymeans that they are stored only at sev-eral time-steps or at much coarser res-olution than the original data. The restis just discarded and the significant partof information may be potentially lost.
What is in situ visualization?
In situ visualization stands for the tech-nique, where the data are visualized inreal-time, as it is being produced by sim-ulation, and without involving storageresources. By coupling the visualizationand simulation together, one can over-come the bottleneck of data transfer.Furthermore, this approach allows tomonitor and interact with running sim-ulation, so its parameters can be mod-ified and scientist can immediately seethe effect on investigating phenomena.
How to instrument my code?
Recently, there has already been donea significant work in the developmentof several in situ solutions that can bedirectly embedded into the simulationcode, so there is no need to rewrite itfrom scratch. Here I will look closer onParaView,1 a popular multi-platform sci-entific data analysis and visualizationenvironment which is distributed underan open source license. While demon-strating its qualities in post-processingof extremely large datasets for a longtime, thanks to Catalyst library Para-View now also belongs among currentlyavailable in situ visualization tools.
Adaptors and pipelines
Catalyst, a relatively new componentof ParaView, has been designed for fastintegration with numerical codes and

Example of simulation connected to Catalyst (image on the left). In the top-left window you can see the Catalyst sources and the datasetsthat are extracted to the server. Real-time results are then visualised in the main window. User can observe the data as it is beinggenerated using visualization nodes of supercomputer (top-right image).
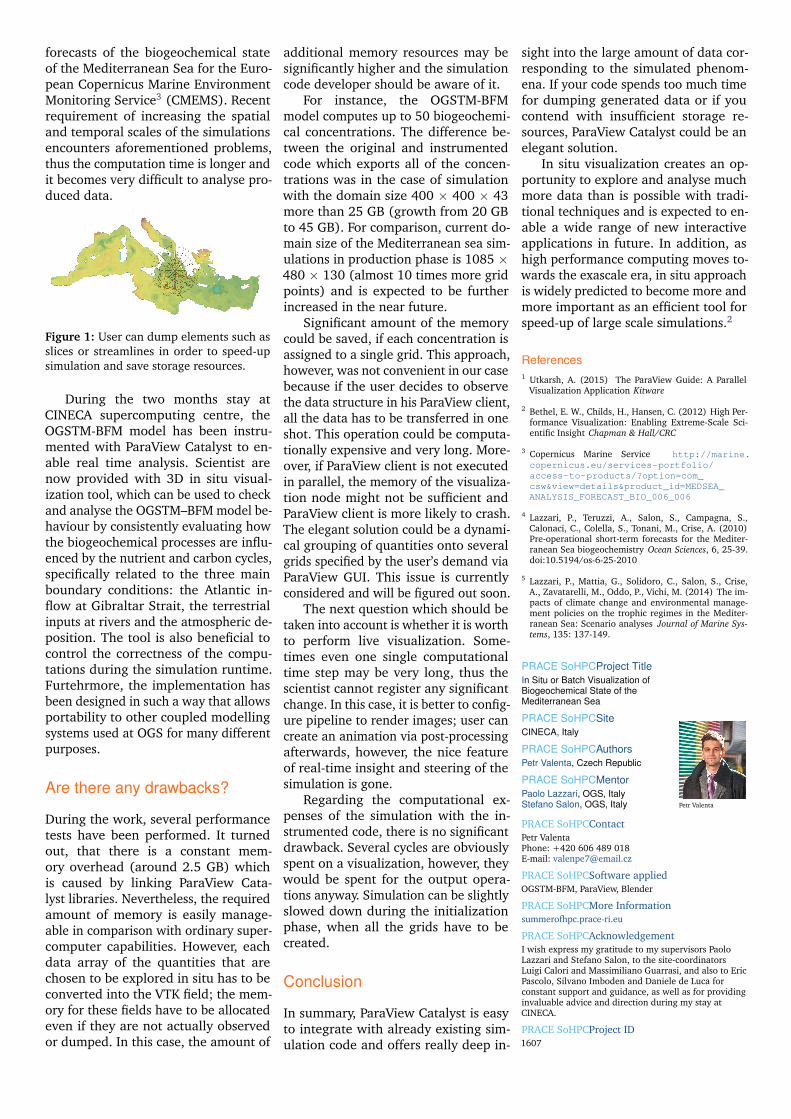
performing real-time analysis of gen-erated data. It changes the traditionalthree-step simulation workflow. Hereyou first specify, which data you wouldlike to see and analyse in situ. For thisreason Catalyst uses a pipelines thatare executed during the initial phaseof the numerical simulation. In thesepipelines, you can utilize all the post-processing capabilities which ParaViewoffers. In other words, you select thedata which simulation produce, thenapply filters such as slices, streamlinesor iso-surfaces and finally choose whatshould be dumped for deeper investiga-tion. This way, the output can be signifi-cantly reduced because the processed el-ements, which carry all the informationyou are interested in, are much smallerthan the full datasets (Fig. 1).
Since ParaView is built on the stan-dard visualization toolkit VTK, the sim-ulation internal data structures have tobe transferred into the VTK data struc-tures. This is done via so called adap-tors. Adaptor is a simulation interface,which should be separated from thecode, in order not to disturb it and sim-plify build process. At the end of the day,you have to call only three functions ofthe adaptor from the original code. Thefirst one, which is called only once persimulation run, initializes Catalyst andloads pre-configured pipelines. The sec-
ond one creates VTK grids, appends thecomputed attributes on it and dumpsselected elements with frequency spec-ified by the user. And the last functionis used at the end of the simulation torelease all Catalyst resources.
Time to run simulation
Once you finish the procedure speci-fied above and instrument your codewith Catalyst, it is time to run the sim-ulation. First you should run pvserver,a component representing the serveron which ParaView is running and pro-cess all the data. Then you can con-nect to that server with ParaView clientand control the visualization remotelyfrom your local machine or using vi-sualization nodes of a supercomputer.The main advantage of doing this isthat pvserver can be executed in par-allel, so with enough resources you cansmoothly explore even extremely largedatasets. Via ParaView client you canthen connect to Catalyst with port num-ber specified in the pipelines. Once youare connected, the pvserver waits forthe simulation data. The last step is toexecute the simulation. Notice that theorder is not important, there is no prob-lem of connecting to already runningjobs.
During the simulation, user can see
the size of the datasets that simula-tion produces. But by default, none ofthe data is available on the server. Thecomputationally expensive operationsare done only on user’s demand viaParaView graphical interface. So theuser can select data structures and anal-yse them the same way as via post-processing. But there is one difference:the simulation is running so user canobserve the data as it is being gener-ated. With Catalyst, it is also possible topause the simulation or specify a break-point at selected time step. This can behelpful if you expect some interestingbehaviour of investigated phenomenaor for identifying of regions, where thenumerical instability arises.
Real world example
Researchers in OGS (National Insti-tute of Oceanography and ExperimentalGeophysics) use a 3D numerical state-of-the-art model OGSTM–BFM to studythe nutrient and carbon cycles in theMediterranean Sea and their sensitiv-ity to climatic changes.4,5 The modelcomputes biogeochemical fluxes whichtransform organic and inorganic com-ponents and can be used to predict en-vironmental health state of the Mediter-ranean sea. The OGSTM-BFM modelsystem is currently used to produce
forecasts of the biogeochemical stateof the Mediterranean Sea for the Euro-pean Copernicus Marine EnvironmentMonitoring Service3 (CMEMS). Recentrequirement of increasing the spatialand temporal scales of the simulationsencounters aforementioned problems,thus the computation time is longer andit becomes very difficult to analyse pro-duced data.
Figure 1: User can dump elements such asslices or streamlines in order to speed-upsimulation and save storage resources.
During the two months stay atCINECA supercomputing centre, theOGSTM-BFM model has been instru-mented with ParaView Catalyst to en-able real time analysis. Scientist arenow provided with 3D in situ visual-ization tool, which can be used to checkand analyse the OGSTM–BFM model be-haviour by consistently evaluating howthe biogeochemical processes are influ-enced by the nutrient and carbon cycles,specifically related to the three mainboundary conditions: the Atlantic in-flow at Gibraltar Strait, the terrestrialinputs at rivers and the atmospheric de-position. The tool is also beneficial tocontrol the correctness of the compu-tations during the simulation runtime.Furtehrmore, the implementation hasbeen designed in such a way that allowsportability to other coupled modellingsystems used at OGS for many differentpurposes.
Are there any drawbacks?
During the work, several performancetests have been performed. It turnedout, that there is a constant mem-ory overhead (around 2.5 GB) whichis caused by linking ParaView Cata-lyst libraries. Nevertheless, the requiredamount of memory is easily manage-able in comparison with ordinary super-computer capabilities. However, eachdata array of the quantities that arechosen to be explored in situ has to beconverted into the VTK field; the mem-ory for these fields have to be allocatedeven if they are not actually observedor dumped. In this case, the amount of
additional memory resources may besignificantly higher and the simulationcode developer should be aware of it.
For instance, the OGSTM-BFMmodel computes up to 50 biogeochemi-cal concentrations. The difference be-tween the original and instrumentedcode which exports all of the concen-trations was in the case of simulationwith the domain size 400 × 400 × 43more than 25 GB (growth from 20 GBto 45 GB). For comparison, current do-main size of the Mediterranean sea sim-ulations in production phase is 1085 ×480 × 130 (almost 10 times more gridpoints) and is expected to be furtherincreased in the near future.
Significant amount of the memorycould be saved, if each concentration isassigned to a single grid. This approach,however, was not convenient in our casebecause if the user decides to observethe data structure in his ParaView client,all the data has to be transferred in oneshot. This operation could be computa-tionally expensive and very long. More-over, if ParaView client is not executedin parallel, the memory of the visualiza-tion node might not be sufficient andParaView client is more likely to crash.The elegant solution could be a dynami-cal grouping of quantities onto severalgrids specified by the user’s demand viaParaView GUI. This issue is currentlyconsidered and will be figured out soon.
The next question which should betaken into account is whether it is worthto perform live visualization. Some-times even one single computationaltime step may be very long, thus thescientist cannot register any significantchange. In this case, it is better to config-ure pipeline to render images; user cancreate an animation via post-processingafterwards, however, the nice featureof real-time insight and steering of thesimulation is gone.
Regarding the computational ex-penses of the simulation with the in-strumented code, there is no significantdrawback. Several cycles are obviouslyspent on a visualization, however, theywould be spent for the output opera-tions anyway. Simulation can be slightlyslowed down during the initializationphase, when all the grids have to becreated.
Conclusion
In summary, ParaView Catalyst is easyto integrate with already existing sim-ulation code and offers really deep in-
sight into the large amount of data cor-responding to the simulated phenom-ena. If your code spends too much timefor dumping generated data or if youcontend with insufficient storage re-sources, ParaView Catalyst could be anelegant solution.
In situ visualization creates an op-portunity to explore and analyse muchmore data than is possible with tradi-tional techniques and is expected to en-able a wide range of new interactiveapplications in future. In addition, ashigh performance computing moves to-wards the exascale era, in situ approachis widely predicted to become more andmore important as an efficient tool forspeed-up of large scale simulations.2
References1 Utkarsh, A. (2015) The ParaView Guide: A Parallel
Visualization Application Kitware
2 Bethel, E. W., Childs, H., Hansen, C. (2012) High Per-formance Visualization: Enabling Extreme-Scale Sci-entific Insight Chapman & Hall/CRC
3 Copernicus Marine Service http://marine.copernicus.eu/services-portfolio/access-to-products/?option=com_csw&view=details&product_id=MEDSEA_ANALYSIS_FORECAST_BIO_006_006
4 Lazzari, P., Teruzzi, A., Salon, S., Campagna, S.,Calonaci, C., Colella, S., Tonani, M., Crise, A. (2010)Pre-operational short-term forecasts for the Mediter-ranean Sea biogeochemistry Ocean Sciences, 6, 25-39.doi:10.5194/os-6-25-2010
5 Lazzari, P., Mattia, G., Solidoro, C., Salon, S., Crise,A., Zavatarelli, M., Oddo, P., Vichi, M. (2014) The im-pacts of climate change and environmental manage-ment policies on the trophic regimes in the Mediter-ranean Sea: Scenario analyses Journal of Marine Sys-tems, 135: 137-149.
PRACE SoHPCProject TitleIn Situ or Batch Visualization ofBiogeochemical State of theMediterranean Sea
PRACE SoHPCSiteCINECA, Italy
PRACE SoHPCAuthorsPetr Valenta, Czech Republic
PRACE SoHPCMentorPaolo Lazzari, OGS, ItalyStefano Salon, OGS, Italy Petr Valenta
PRACE SoHPCContactPetr ValentaPhone: +420 606 489 018E-mail: [email protected]
PRACE SoHPCSoftware appliedOGSTM-BFM, ParaView, Blender
PRACE SoHPCMore Informationsummerofhpc.prace-ri.eu
PRACE SoHPCAcknowledgementI wish express my gratitude to my supervisors PaoloLazzari and Stefano Salon, to the site-coordinatorsLuigi Calori and Massimiliano Guarrasi, and also to EricPascolo, Silvano Imboden and Daniele de Luca forconstant support and guidance, as well as for providinginvaluable advice and direction during my stay atCINECA.
PRACE SoHPCProject ID1607