Embed Size (px)
Citation preview

FULL PAPER
1703334 (1 of 11)
www.small-journal.comsmall
NANO MICRO
© 2018 WILEY-VCH Verlag GmbH & Co. KGaA, Weinheim
Super-Absorbent Polymer Valves and Colorimetric Chemistries for Time-Sequenced Discrete Sampling and Chloride Analysis of Sweat via Skin-Mounted Soft MicrofluidicsSung Bong Kim, Yi Zhang, Sang Min Won, Amay J. Bandodkar, Yurina Sekine, Yeguang Xue, Jahyun Koo, Sean W. Harshman, Jennifer A. Martin, Jeong Min Park, Tyler R. Ray, Kaitlyn E. Crawford, Kyu-Tae Lee, Jungil Choi, Rhonda L. Pitsch, Claude C. Grigsby, Adam J. Strang, Yu-Yu Chen, Shuai Xu, Jeonghyun Kim, Ahyeon Koh, Jeong Sook Ha, Yonggang Huang, Seung Wook Kim,* and John A. Rogers*
DOI: 10.1002/smll.201703334
1. Introduction
In humans, sweating is a highly evolved physiological process primarily adapted to maintain thermal homeostasis. Sweat is a hypotonic solution composed pre-dominately of water (<99%).[1,2] Beyond inherently low solute concentrations, the amount of electrolytes and biomarkers of interest in sweat can vary significantly with sweat rate, body composition, and ambient conditions.[3–5] The eccrine gland secretes sweat but also selectively
This paper introduces super absorbent polymer valves and colorimetric sensing reagents as enabling components of soft, skin-mounted microfluidic devices designed to capture, store, and chemically analyze sweat released from eccrine glands. The valving technology enables robust means for guiding the flow of sweat from an inlet location into a collection of isolated reservoirs, in a well-defined sequence. Analysis in these reservoirs involves a color responsive indicator of chloride concentration with a formulation tailored to offer stable operation with sensitivity optimized for the relevant physiological range. Evaluations on human subjects with comparisons against ex situ analysis illustrate the practical utility of these advances.
Soft Microfluidics
Dr. S. B. Kim, S. M. Won, Dr. K. E. Crawford, Dr. K.-T. Lee, Y.-Y. ChenDepartment of Materials Science and Engineeringand Frederick Seitz Materials Research LaboratoryUniversity of Illinois at Urbana-ChampaignUrbana, IL 61801, USADr. K. E. CrawfordDepartment of Materials Science and EngineeringUniversity of Central FloridaOrlando, FL 32816, USADr. Y. Zhang, Dr. A. J. Bandodkar, Dr. J. Koo, Dr. T. R. Ray, Dr. J. Choi, Prof. J. A. RogersCenter for Bio-Integrated Elecctronics at the Simpson Querry Institute for BioNanotechnologyNorthwestern UniversityEvanston, IL 60208, USAE-mail: [email protected]. Y. Zhang, Dr. A. J. Bandodkar, Dr. J. Koo, Dr. T. R. Ray, Dr. J. Choi, Prof. J. A. RogersDepartment of Materials Science and EngineeringNorthwestern UniversityEvanston, IL 60208, USADr. Y. SekineMaterials Sciences Research CenterJapan Atomic Energy AgencyTokai, Ibaraki 319-1195, Japan
Y. XueDepartment of Civil and Environmental EngineeringNorthwestern UniversityEvanston, IL 60208, USAProf. Y. HuangDepartment of Civil and Environmental EngineeringDepartment of Mechanical EngineeringDepartment of Materials Science and EngineeringNorthwestern UniversityEvanston, IL 60208, USAY. Xue, Prof. Y. Huang, Prof. J. A. RogersDepartment of Mechanical EngineeringNorthwestern UniversityEvanston, IL 60208, USADr. S. W. Harshman, Dr. J. A. Martin, C. C. Grigsby711th Human Performance WingAirman Systems DirectorateHuman-Centered ISR DivisionHuman Signatures Branch Air Force Research Laboratories WPAFBOH 45433, USAJ. M. ParkDepartment of PhysicsDuke UniversityDurham NC 27708, USAJ. M. ParkDepartment of ChemistryDuke UniversityDurham NC 27708, USA
The ORCID identification number(s) for the author(s) of this article can be found under https://doi.org/10.1002/smll.201703334.
Small 2018, 14, 1703334

1703334 (2 of 11)
www.advancedsciencenews.com www.small-journal.comsmall
NANO MICRO
© 2018 WILEY-VCH Verlag GmbH & Co. KGaA, Weinheim
reabsorbs electrolytes and glucose back into the intersti-tial fluid. Of the electrolytes in sweat, chloride has the most established clinical relevance. As the most abundant anion in sweat, sweat chloride concentration is a widely accepted diagnostic screening tool for cystic fibrosis, a disease charac-terized by a mutation in the cystic fibrosis trans-membrane conductance regulator gene leading to an abnormal cellular chloride channel that results in elevated hypertonic sweat and thickened body fluid excretions.[6–8] Excess perspiration without adequate replacement hydration has been shown to negatively affect athletic performance.[9] Insufficient sweating in the setting of elevated core body temperature can lead to life-threatening heat stroke, a leading cause of death in young athletes.[10–12] Conditions where physical activity occurs in high ambient temperatures (e.g. military scenarios) increase this risk.
The challenges associated with accurate and reliable sweat collection have hindered the practical utility of this biofluid outside of select applications.[4] Traditional methods use cotton sponges and gauze to capture sweat for follow-on laboratory analysis. These methods are laborious, require specialized training, and introduce risks of evaporation and contamina-tion with exposure to the atmosphere.[13] Although recent advances have demonstrated the feasibility of collecting and analyzing sweat in real time, numerous technical challenges still remain.[14,15] In particular, there is a need for technologies capable of collecting sweat volumes that are adequate for anal-ysis, and methods to securely store sweat in selective channels or chambers to prevent evaporation and cross contamination.[16]
Since sweat is produced by eccrine glands in nearly every part of human skin, it is particularly conducive to wearable
and continuous monitoring. Continuous skin-integrated sweat sensing for both sweat rate and biomarker analysis presents its own unique set of challenges particularly in use cases such as intense exercise or military applications. First, information should be provided simply, directly, and immediately to the user while minimizing the necessary steps to infer data with electronic readers or mobile phones.[17–20] Second, the device must isolate sufficient volumes for multiple assay samples without crosscontamination or evaporation.[13,21] Finally, the operation should afford capabilities in continuous monitoring but without prolonged contact of sweat with the skin itself to minimize skin irritation.
In this work we describe a precision, continuous, real-time microfluidic device that provides chronographic information on sweat loss and sweat chloride, conducive to prolonged use. The chemistry and fluidic designs are distinct from those in related platforms reported recently, thereby pro-viding additional engineering options in valve construction and colorimetric chemical reagents. For chloride sensing, chemical modifications of standard assays yield strong responses across the entire physiologically relevant ranges of concentrations, with long-term stability and precision in sensing that both exceed those of previously reported sys-tems.[22] For time-sampling, water-actuated valves based on super absorbent polymers selectively isolate individual sweat reservoirs, in a manner that prevents backflow and allows air ventilation, as an alternative to passive capillary bursting valve approaches.[15] Pilot testing with human volunteers demonstrates the functionality and performance of these platforms through comparisons against laboratory-standard tools.
Dr. R. L. PitschContractor for The Henry M. Jackson Foundation for the Advancement of Military Medicine 711th Human Performance WingAirman Systems DirectorateHuman-Centered ISR DivisionHuman Signatures Branch Air Force Research Laboratories WPAFBOH 45433, USADr. A. J. StrangAir Force Research LaboratoryWright-Patterson AFBOH 45433, USADr. S. XuCenter for Bio-Integrated ElectronicsNorthwestern UniversityEvanston, IL 60208, USADr. S. XuDepartment of DermatologyNorthwestern UniversityFeinberg School of MedicineChicago, IL 60611, USAProf. J. KimDepartment of Electronics Convergence EngineeringKwangwoon UniversityNowon-gu, Seoul 01897, Republic of KoreaProf. A. KohDepartment of Biomedical EngineeringBinghamton UniversityState University of New YorkBinghamton, NY 13902, USA
Prof. J. S. Ha, Prof. S. W. KimDepartment of Chemical and Biological EngineeringKorea UniversitySeongbuk-gu, Seoul 02841, Republic of KoreaE-mail: [email protected]. J. A. RogersDepartment of Biomedical EngineeringNorthwestern UniversityEvanston, IL 60208, USAProf. J. A. RogersDepartment of ChemistryNorthwestern UniversityEvanston, IL 60208, USAProf. J. A. RogersDepartment of Electrical Engineering and Computer ScienceNorthwestern UniversityEvanston, IL 60208, USAProf. J. A. RogersDepartment of Neurological SurgeryNorthwestern UniversityEvanston, IL 60208, USAProf. J. A. RogersSimpson Querrey Institute for Nano/BiotechnologyMcCormick School of Engineering and FeinbergSchool of MedicineNorthwestern UniversityEvanston, IL 60208, USA
Small 2018, 14, 1703334

1703334 (3 of 11)
www.advancedsciencenews.com www.small-journal.comsmall
NANO MICRO
© 2018 WILEY-VCH Verlag GmbH & Co. KGaA, Weinheim
2. Results and Discussion
2.1. Skin-Compatible Soft Microfluidic Systems with Active, Mechanical Valving
Sweat is easily contaminated by the surrounding environment. The inherent low concentration of biomarkers and electro-lytes such as chloride underscore the need to control surface evaporation. Thus, systems for capturing and storing sweat via direct contact with the skin in platforms that offer precise engineering control of the device parameters and constituent materials are of interest. A recently reported device design that satisfies these requirements involves thin, elastomeric microfluidic technologies that bond to the surface of the skin in a way that avoids leakage and exposure of sweat to the sur-rounding environment.[23] Here, sweat samples collected into specially designed microscale channels and chambers can be stored for relatively long periods of time (up to 72 h) without contamination or evaporation, for biomarker analysis within the device platform (i.e., in situ) or for external evaluation with
laboratory apparatuses (i.e., ex situ). Advanced, passive schemes based on capillary bursting valves allow capture of sweat into separate reservoirs that fill in sequence to enable tracking of sweat chemistry with programmed release rates through the time course of an event (e.g., a prolonged bout of exercise). The designs introduced here provide alternative, active valving strategies with similar functionality but in a format that is comparatively insensitive to deformations or contact pressures associated with practical applications. Additional results dem-onstrate the ability to support quantitative, in situ colorimetric analysis of chloride concentration within the context of these microfluidic designs. Specific examples enable sampling in five different reservoirs, each with three separate chambers filled with tailored formulations of a colorimetric chemical reagent to enable determination of chloride concentration over a broad range with good accuracy.
Figure 1 highlights the key features of the microfluidic design. The channel system adopts a double layer geometry that separately supports the microfluidic channels and a col-lection of active valves based on superabsorbent polymer (SAP)
Small 2018, 14, 1703334
Figure 1. Schematic illustration and digital images of the chrono-sampling epidermal microfluidic device for sweat chloride monitoring. a) The exploded schematic illustration describes the structure of the device. b) Optical image of the fabricated device (up), and its mechanical flexibility under mechanical distortions: bending (middle) and twisting (bottom). c) The fabricated device is shown deployed on human skin of the neck, forearm, lower back, and thigh.
1703334 (4 of 11)
www.advancedsciencenews.com www.small-journal.comsmall
NANO MICRO
© 2018 WILEY-VCH Verlag GmbH & Co. KGaA, Weinheim
materials and passive valves that exploit tailored hydrophobic and hydrophilic surface chemical functionalization on the surfaces of the channels. The former acts to close the inlets and outlets of each reservoir when the sweat reaches the valves (Figure 1a); the latter act to passively guide the flow directionality. The fabrication processes follow conventional steps in multilayer polydimethylsiloxane (PDMS) microfluidics, as reported else-where.[24–26] Openings on the bottom adhesive surface of the device allow colocated collections of glands to pump sweat into the channel structure. Robust adhesion to the skin and soft mechanics are critically important features that simultaneously eliminate leakage and any irritation or discomfort at the skin interface, even under extreme modes of deformation (bending, stretching, twisting, etc.) associated with natural motions from daily activities or strenuous exercise (Figure 1b). These skin-compatible mechanical properties also enable mounting of the devices onto nearly any region of the body (Figure 1c), with good adherence even during profuse sweating.
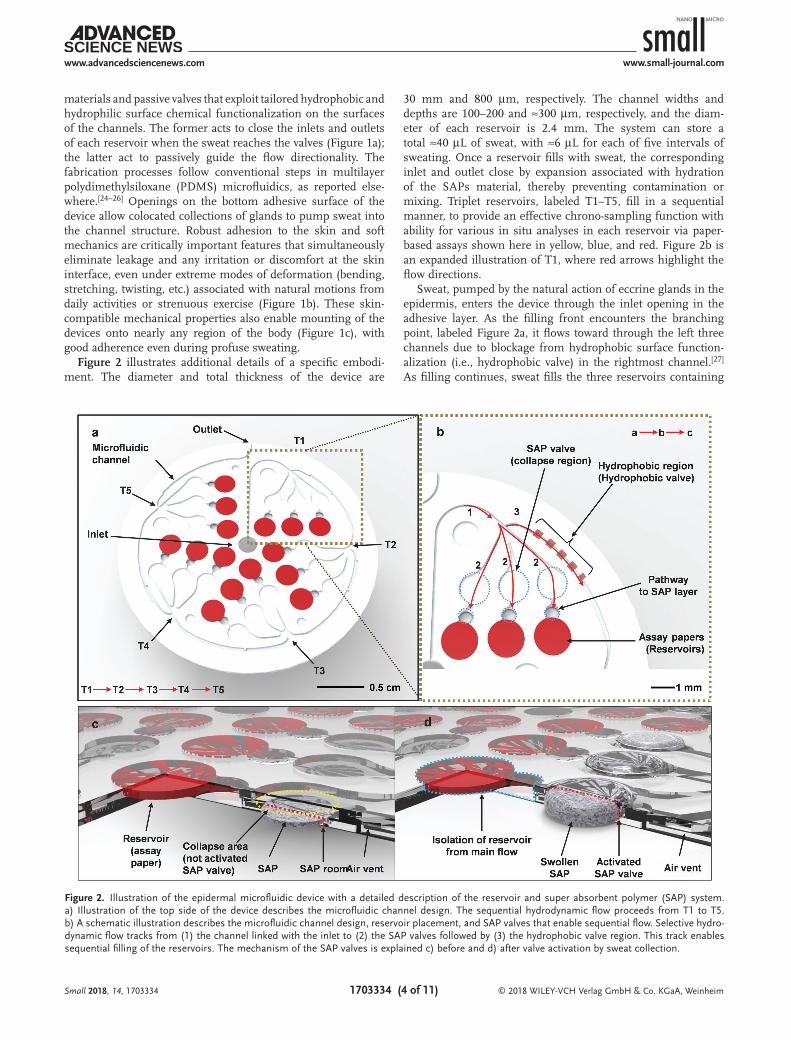
Figure 2 illustrates additional details of a specific embodi-ment. The diameter and total thickness of the device are
30 mm and 800 µm, respectively. The channel widths and depths are 100–200 and ≈300 µm, respectively, and the diam-eter of each reservoir is 2.4 mm. The system can store a total ≈40 µL of sweat, with ≈6 µL for each of five intervals of sweating. Once a reservoir fills with sweat, the corresponding inlet and outlet close by expansion associated with hydration of the SAPs material, thereby preventing contamination or mixing. Triplet reservoirs, labeled T1–T5, fill in a sequential manner, to provide an effective chrono-sampling function with ability for various in situ analyses in each reservoir via paper-based assays shown here in yellow, blue, and red. Figure 2b is an expanded illustration of T1, where red arrows highlight the flow directions.
Sweat, pumped by the natural action of eccrine glands in the epidermis, enters the device through the inlet opening in the adhesive layer. As the filling front encounters the branching point, labeled Figure 2a, it flows toward through the left three channels due to blockage from hydrophobic surface function-alization (i.e., hydrophobic valve) in the rightmost channel.[27] As filling continues, sweat fills the three reservoirs containing
Small 2018, 14, 1703334
Figure 2. Illustration of the epidermal microfluidic device with a detailed description of the reservoir and super absorbent polymer (SAP) system. a) Illustration of the top side of the device describes the microfluidic channel design. The sequential hydrodynamic flow proceeds from T1 to T5. b) A schematic illustration describes the microfluidic channel design, reservoir placement, and SAP valves that enable sequential flow. Selective hydro-dynamic flow tracks from (1) the channel linked with the inlet to (2) the SAP valves followed by (3) the hydrophobic valve region. This track enables sequential filling of the reservoirs. The mechanism of the SAP valves is explained c) before and d) after valve activation by sweat collection.

1703334 (5 of 11)
www.advancedsciencenews.com www.small-journal.comsmall
NANO MICRO
© 2018 WILEY-VCH Verlag GmbH & Co. KGaA, Weinheim
assay paper; overfilling routes sweat to the lower level of the microfluidic construct where it encounters the SAP material underneath each of the three circular valve structures high-lighted with red dashed circles. Expansion closes the valves, and thereby forces additional flow to move along the direction labeled c, past the hydrophobic valve, and on toward the next triplet reservoirs. Figure 2c,d provides cross-sectional views that highlight this process.
The closing of the inlets and outlets to the reservoirs by action of the SAPs valves captures the sweat and prevents fur-ther flow, which could otherwise wash reagents from the col-orimeter paper assays. The expansion of the SAP materials operates in ways that are similar to that of widely used pneu-matic or hydraulic values in soft microfluidic systems.[28,29] A plane strain model can capture the essential mechanics, and aid in optimizing the geometry of the valve and the loading of SAP materials. Figure 3a presents a schematic diagram of a deformed channel with cross-sectional width (2L) and height (H) after volume expansion of the SAP (ΔVSAP). The thick-ness of the middle layer (red dashed line) is taken as half of the thickness of the top cover (red solid line), consistent with
the experimental configuration. Figure 3b shows the relation-ship between the normalized valve collapse length b/L and the ratio of expanded volumes versus the original channel volume (ΔVSAP/2HL). Stable collapse (2b > 0) occurs only when ΔV/2HL > 0.6 and the collapse length increases as the SAP expands. As shown in Figure 3c, excessively large expan-sions of the SAP will lead to overall deformation of the entire device ΔVdevice in a way that can adversely affect the microflu-idics. Thus, the volume expansion ΔVSAP/2HL should be less than ≈0.9 to ensure that the overall deformation lies within an acceptable limit ΔVdevice/2HL < 0.2.
The choices of design parameters follow from insights provided by these models. Figure 3d,e shows cross-sectional optical images of a device before and after filling with water dyed blue for ease of visualizing the flow and the action of the SAP valve. As the reservoir fills and flow reaches the valve, the SAP material swells to close the inlet and prevent fur-ther flow. For an efficient seal, the cavity region for the SAP adopts a curved shape to ensure conformal closing, similar to design approaches described in the past for externally actuated valves.[30]
Small 2018, 14, 1703334
Figure 3. Description of the design and modeling of super absorbent polymer (SAP) valves for selective flow and sequential sweat sampling. a) Geometry of the SAP valve division as described with simulation modeling. The correlation of b) b/L and ΔVSAP/2HL was determined. The relation-ship between b) b/L and ΔVSAP/2HL and c) ΔVdevice /2HL and ΔVSAP/2HL were modeled and shown. This cross-sectional view of the SAP valve shows a d) before and e) after appearance after sweat collection. Note the red box indicating SAP swelling within the reservoir. The yellow dotted box shows the volumetric change of SAP valve that controls hydrodynamic flow.

1703334 (6 of 11)
www.advancedsciencenews.com www.small-journal.comsmall
NANO MICRO
© 2018 WILEY-VCH Verlag GmbH & Co. KGaA, Weinheim
2.2. Wettability Controlled by Surface Chemistry for Microfluidic Routing
Combined use of SAP valves with passive structures to con-trol directional flow properties enables operation of the entire system. Figure S1 in the Supporting Information presents an optical image of a Y-shaped microchannel to illustrate the role of the hydrophobic value. Here, one side of the Y is hydrophilic and the other is hydrophobic. Flow of water with blue dye illustrates the preference for flow in the direc-tion of the hydrophilic channel, as expected. Once further flow in this direction is blocked by closing of the SAPs valve via mechanisms described in the previous section, sufficient pressure will lead to flow into the hydrophobic channel. This concept can be implemented with PDMS by controlling the density of surface –OH groups through exposure to ozone plasma.[31] Figure S2 in the Supporting Information shows procedures that involve conformal masking of certain regions of the channels with a piece of PDMS and an antiadhesion agent (Ease release 200) to spatially control the plasma expo-sure. Exposed regions become hydrophilic; unexposed regions remain hydrophobic. Although changes in hydrophobicity induced in this manner with PDMS materials are known to be only temporary,[32] the effect is sufficiently long lived to support the experiments reported here. Figure S3 in the Sup-porting Information shows the contact angle on the PDMS surface at 0, 3, 9, and 17 d after exposure to ozone plasma of 18 W RF for 1 min. The results show that the surface proper-ties are maintained for at least 17 d, allowing effective opera-tion of the valve. Experimental tests demonstrate that the devices work well even 1 month after fabrication enabling future storage prior to use.[22]
Figure 4a illustrates in a time sequence of diagrams the oper-ation of a hydrophobic valve. Figure 4b provides optical images of various stages of operation to the point of complete filling, performed with blue colored artificial sweat pumped into the device at a pressure of ≈300 Pa. The reservoir and channel geometries, as well as the inlet sizes, can be tailored to match specific use scenarios. Figure S4 in the Supporting Information shows effects of flow rate and pressure, indicating that pressure and inlet size are proportional to filling rate.[33] This combina-tion of valving using SAP materials and hydrophobic surface functionalization adds to the set of options in design of pas-sive microfluidic platforms for sweat collection and analysis. By comparison to previous schemes, such as those based on pneu-matic,[34] magnetic[35,36] valves, a key advantage is in operation without external supply of power.
2.3. Formulation of Colorimetric Chemical Reagents for Chloride Sensing
Colorimetric methods provide a simple visual readout of chlo-ride concentration conducive to further digital analysis. Paper-based colorimetric analysis platforms[37] are attractive due to their simple, low cost construction, but they do not interface readily with the surface of the skin, they cannot effectively quantify sweat rate or total sweat loss nor can they conveniently store and sample sweat in a manner that allows efficient extrac-tion. The approach incorporated here exploits a well-known colorimetric assay commonly used for the determination of chloride ion concentration in applications involving wastewater and biofluid media. This assay relies on competitive chela-tion between mercury-(II), Hg2+, and ferrous-(II), Fe2+, using
Small 2018, 14, 1703334
Figure 4. Demonstration of sequential hydrodynamic fluid flow through the epidermal microfluidic device using blue dyed artificial sweat. a) Illustra-tion of the active role of the hydrophobic valve after closing of the super absorbent polymer (SAP) valve. b) Digital images show chrono-sampling of artificial sweat introduced at a rate of 10 µL min−1.

1703334 (7 of 11)
www.advancedsciencenews.com www.small-journal.comsmall
NANO MICRO
© 2018 WILEY-VCH Verlag GmbH & Co. KGaA, Weinheim
2,4,6-tris(2-pyridyl)-s-triazine (TPTZ) as a chelating agent.[38–40] In a solution containing TPTZ (chelator), Hg2+ and Fe2+, stoi-chiometric complexation between Hg2+ and TPTZ is favored, resulting in the formation of colorless Hg[TPTZ]
2 (Figure S5, Supporting Information). Upon introduction of chloride, a reaction with Hg2+ yields mercuric chloride, HgCl2. In con-cert, the free TPTZ generated by the HgCl2 precipitation reac-tion readily chelates with a stoichiometric equivalence of Fe2+. The newly formed Fe[TPTZ]
2 exhibits an absorption peak at ≈595 nm yielding a visually blue complementary color with an optical density (visual and spectrophotometric) that corre-sponds directly to the concentration of chloride ions following calibration.[41,42]
Enhancing the solubility of TPTZ through the addition of polysorbate-80 surfactant improves the performance of this col-orimetric assay. This biocompatible, Food and Drug Adminis-tration (FDA) of United States-approved surfactant is nonionic thereby eliminating the possibility of its role as a secondary chelator toward Hg2+ or Fe2+.[43] In the absence of surfactant, the relative intensity of the blue color exhibited by the nonco-valent Fe(TPTZ)2 complex formation is limited and diminishes by ≈75% within 30 min. The intensity and stability of the blue color increase with increasing polysorbate-80 concentration. The minimum surfactant concentration necessary to establish color stability for a period of at least 3 h is 0.8 wt% (observation time selected based on exercise time during human studies, vide infra), as determined by evaluating a series of surfactant concen-trations, 0.2, 0.4, 0.6, 0.8, and 1.0 wt%, under otherwise constant
conditions (7 × 10⁻³ m Hg2+, 3 × 10⁻³ m Fe2+, and 2.4 × 10⁻³ m TPTZ) as shown in Figure 5a. Figure 5b illustrates that the color intensity remains stable when compared to a representative assay as soon as the color has developed (blue line, 0 h) after exposure to 100 × 10−3 m chloride and again after 24 h (pink line).
Effective determination of differences in chloride concen-trations as small as 1 × 10⁻³ m is possible through quantitative capture of the developed color. For example, Figure 5c shows the change in RGB (red-green-blue) index values of the devel-oped color at chloride concentrations of 50 × 10−3, 90 × 10−3, and 130 × 10−3 m using the above-mentioned assay concentration formulation.[23,44] The concentration of chloride in sweat typi-cally lies between 10 × 10−3 and 150 × 10−3 m, most commonly at the lower end of this range.[45] In the work presented here, max-imum color separation in three separate chloride concentration ranges (0–76 × 10−3, 77 × 10−3–160 × 10−3, and >160 × 10−3 m) is achieved by controlling the relative assay concentration. Visual separation of color intensity in each range is tested by incorpora-tion of a stepwise increase in chloride concentration from 0 to ≈125 × 10−3 m using a doped artificial sweat solution (1700–0020 Pickering Laboratory, Mountain View, CA) (Figure 5d).
Formulating an assay by using a low concentration of TPTZ yields high color intensity separation at low chloride concentra-tions (0–75 × 10−3 m chloride) but with color saturation at high chloride concentrations. Conversely, an assay with higher TPTZ concentration requires a higher chloride concentration for appear-ance and separation of color intensity. Specifically, Figure 5e shows the resulting shifts in calibration curves for formulations
Small 2018, 14, 1703334
Figure 5. Development of intuitive and stable quantitative colorimetric assay for the determination of chloride concentration in sweat. a) The effect of polysorbate 80, a surfactant, on the stabilization of color development in the TPTZ competition reaction for chloride determination. b) Comparison of color intensity at 0 and 12 h after stabilization using 0.8% (v/v) polysorbate 80. c) Changes in the RGB index are shown as a function of chloride concentration. d) The color development of the assay is shown at varying levels of TPTZ (0.7 × 10⁻³, 2.4 × 10⁻³, 3.2 × 10⁻³ m) and chloride concentration (25 × 10−3, 50 × 10−3, 75 × 10−3, 100 × 10−3, 125 × 10−3 m). e) The calibration curve shifts dependent on the ratio of TPTZ-Hg2+.

1703334 (8 of 11)
www.advancedsciencenews.com www.small-journal.comsmall
NANO MICRO
© 2018 WILEY-VCH Verlag GmbH & Co. KGaA, WeinheimSmall 2018, 14, 1703334
with different TPTZ concentrations. The color reference below Figure 5e is from analysis of in vivo human sweat. Figure S6 in the Supporting Information summarizes the results of modi-fied assay solutions evaluated in a 96-well plate. To facilitate visual perception of chloride concentration within the three selected ranges, the microfluidic device contains three reser-voirs in series, one for each chloride concentration range.
Quantitative analysis is possible through processing of digital images using procedures described previously.[22] Normaliza-tion against a known reference color (white in this case) yields relative distances measured in color space. Figure S7a,b in the Supporting Information shows images of printed blue reference colors collected under different lighting conditions and corre-sponding CIE L*a*b* (CIELAB; where the lightness of the color
Figure 6. In vivo testing of the epidermal microfluidic device in multiple use cases. The detection of sweat chloride is also shown in situ. a) A healthy normal subject #1 performs a simple exercise in a controlled climate room on a stationary bike. b) The device is deployed on the subject’s left forearm. c) Sweat chloride concentrations of Subject #1 are shown sequentially at five time points. d) The sweat chloride results are shown (Subject #1) using the chloride gauge. e) In an additional test, we show an overview of the STRONG military research lab operated by the United States Air Force. Three additional Air Force servicemen were tested (Subjects #2–#4) in controlled military exercises with full military gear. f) The device is deployed on all subjects on the left forearm. g) The device is shown after sweat collection. h–j) The sweat chloride concentrations of Subjects #2–#4 are shown at five sequential time points. The chloride concentrations are well within prior reported literature values for healthy, normal subjects.
1703334 (9 of 11)
www.advancedsciencenews.com www.small-journal.comsmall
NANO MICRO
© 2018 WILEY-VCH Verlag GmbH & Co. KGaA, WeinheimSmall 2018, 14, 1703334
is denoted by L*, green to red scale by a*, and blue to yellow by b*, and CIE is abbreviation of French Commission internationale de l’éclairage) values to determine the magnitude of the color dif-ference, ΔE c, with respect to the white reference in the same image, computed using CIE76 (Equation (S1), Supporting Infor-mation), defined by the International Commission on Illumina-tion.[46] As shown in Figure S7c in the Supporting Information, the normalized single-value color difference is robust allowing for accurate analysis even with variations in lighting conditions (Figure S8a, Supporting Information). A blurring algorithm can help to eliminate effects of slight color variations across the assay paper. Color variations tend to diminish with time, over ≈20 min, as shown in Figure S8b in the Supporting Information.
2.4. Human Studies
In vivo tests in volunteer human subjects involved devices designed to offer precise measurements of chloride over three ranges of concentration, separately distributed in three reser-voirs: 0–75 × 10−3, 75 × 10−3–150 × 10−3, and over 150 × 10−3 m as shown in Figure 5d. The subjects operated a stationary bike in a controlled environment (temperature and humidity ≈15 °C and ≈67%, respectively) with devices mounted on the forearm as expected in Figure 6a,b. The chloride levels shown in Figure 6c,d are within reasonable range which could be expected in physiological observation for healthy adults. (Figure 6c,d).[47,48]
Additional secondary verification tests involved rigorous marching exercises with active duty military personnel (N = 3) (Figure 6e,f) and included reference measurements performed by conventional lab analysis of l-lactate, chloride, and pH in parallel with those determined using devices placed on the forearm. For the former, sweat collection exploited an existing FDA-cleared device (Macroduct). Figure 6g shows the device after the test. Figure 6h–j highlights the changes in chloride con-centration for Subjects #2–#4. Two same devices were tested on the forearm of each subject for duplication (Figure 6f), and the mean value of them was plotted. The variations in sweat chlo-ride and sweat rate reflect the expected physiological responses to physical activity and thermal stress.[1,2] The values and tem-poral trends are similar to those reported previously, based on conventional sweat analysis approaches Ohara et al.[47,48] The institutional review board of the Human Signatures Branch Air Force Research Laboratories approved all human studies.
Measuring l-lactate and pH was also conducted using the device. Figure S9 in the Supporting Information summarizes the in vivo involving subject 2–4. Laboratory analysis of col-lected sweat in Macroduct was conducted in parallel with colori-metric analysis and spectrophotometer (Figure S10, Supporting Information). Mean values of five time points of the device were used in the t-test. The results were analyzed using a two-tailed t-test within 95% confidence level (α = 0.05) to estimate the significance and reliability of the device. A comparison of the device and laboratory data did not demonstrate a statistical difference (p-value: 0.12 for l-lactate and p-value: 0.43 for pH). Variations between the reference systems may be explained from calibration or color normalization errors, as well as the induction of compensatory sweating due to device placement itself.
3. Conclusion
As a biofluid, sweat has the potential to offer broad diagnostic value in clinical medicine, military medicine, and sports sci-ence. The results presented here demonstrate new, important capabilities for skin-mounted microfluidic systems, including passive valving technologies for fluidic manipulation and opti-mized chemistries for colorimetric detection of chloride without the need for modification of natural sweat. The results enable colorimetric readout of time-sequenced samples of sweat col-lected from the surface of the skin. The valving approach uti-lizes a combined use of patterned regions of hydrophobic and hydrophilic channel surfaces and super absorbent polymers, in a multilayer design. The key concepts in the assay chemistry involve stabilization of color development by introduction of noninteracting ions and surfactant, for precision quantitative analysis over multiple ranges of chloride concentration. In vivo tests and comparisons against laboratory analysis standards suggest the potential for practical use of this technology in many areas ranging from exercise physiology to screening for cystic fibrosis.
4. Experimental SectionSoft Lithography for the Microfluidic Channel Structure: The techniques
of soft lithography yielded samples of PDMS (Sylgard 184, Dow Corning; mixed at a 20:1 ratio of base to curing agent by weight) with features of relief defined by silicon molds. The molds were created by photolithography (KMPR 1010, MicroChem, Westborough, MA) and deep reactive-ion etching (STS Pegasus ICP-DRIE, SPTS Technologies Ltd, UK) to a depth of 300 µm. A spin cast layer of polymethylmethacrylate (3000 rpm for 30 s, curing at 180 °C for 10 min) prevented adhesion to PDMS spin cast on top (30 s, 250 rpm for microchannel layer; 400 rpm for valve layer) and cured at 70 °C for 4 h.[22]
Chemicals for Chloride Assay: The chloride assay agent used TPTZ (Sigma-Aldrich, St. Louis, MO) was dissolved in methanol to a concentration of 50 × 10−3 m. Solubility of TPTZ in aqueous media (i.e., sweat) was optimized by the addition of 0.8 wt% polysorbate 80. HgSO4 and FeSO4 (Sigma-Aldrich, St. Louis, MO) solutions were prepared to concentrations were prepared per the colorimetric resolution desired for a specific range of chloride concentration, typically ≈10 × 10−3 m. Filter paper (Whatman No. 1, Pittsburgh, PA) served as the assay agent matrix, hole-punched into circular shapes with diameters of ≈2.5 mm. The final steps to complete the assay included adding a small volume (≈2.6 µL) of the assay solution placed onto each piece of filter paper followed by drying at room temperature for 1 h.
Preparation of the SAP Material: Sodium polyacrylate (Sigma-Aldrich, St. Louis, MO) served as the SAP material, with modifications as outlined by Kabiri et al.[29] Addition of 55% KOH to glacial acrylic acid monomer (Sigma-Aldrich, St. Louis, MO) neutralized a solution that included 2 mL ammonium sulfate (37.5 g L−1) and 4 g sodium bicarbonate. Mixing N,N′-methylenebisacrylamide, a fast swelling agent (Sigma-Aldrich, St. Louis, MO) of 2 mL sodium metabisulfite (31.5 g L−1), and crosslinker of 2 mL increased the viscosity necessary for gelation. The gel was spread evenly over a tray and allowed to dry at 70 °C for 24 h. The resulting gel-like material was ground using a mortar and then passed through a No. 120 sieve (100 µm mesh size) to yield the final SAP material.
Fabrication of the Device: The sweat sensing devices combine PDMS microfluidic structures, assay paper coupons, and the SAP materials, as outlined in the main text. Both the SAP material and chloride assay papers were manually loaded onto the valve locations and reservoirs, respectively. Methods for defining hydrophilic and hydrophobic regions in the microfluidic channels used a masking approach shown in

1703334 (10 of 11)
www.advancedsciencenews.com www.small-journal.comsmall
NANO MICRO
© 2018 WILEY-VCH Verlag GmbH & Co. KGaA, WeinheimSmall 2018, 14, 1703334
Figure S2 in the Supporting Information, where the native surface of PDMS, which is hydrophobic, can be converted to hydrophilic by local exposure to ozone plasma.[32] This scheme defined both the hydrophilic and hydrophobic regions in the channels (Figure S1, Supporting Information). An antiadhesion material (Ease release 200, Mann Release Technologies Inc., Macungie, PA) allowed easy removal of the piece of PDMS used for masking purposes. Bonding of the channel and valve layers occurred via contact after exposing the surfaces to ozone plasma and removing the PDMS from microfluidic channel. An adhesive layer with a defined opening to the skin bonded to the bottom surface of the device.
Instrumental Analysis: A halide analyzer defined the chloride concentration, using an ion-specific electrode (Thermo Scientific “Orin”) calibrated to the ppm level. An additional laboratory analysis procedure used a MAK023, chloride assay kit (Sigma-Aldrich, St. Louis, MO). Here, the color analysis was conducted with Varian Cary5G UV–Vis–NIR spectrophotometer (Agilent, Santa Clara, CA).
Human Studies: Tests involved the use of a stationary bike in a room with controlled temperature (≈15 °C) and humidity (≈67%), with devices placed on the forearm (Figure 6b). The test continued to the point of complete filling. Additional tests for chloride, l-lactate, and pH involved subjects performing marching exercises wearing combat gear including a helmet, Kevlar vest, 50 lb. pack, and an M4 rifle. The ruck march involves a treadmill protocol with two inclines and speeds of easy and moderate difficulty (Figure 6e). Before equipment removal, a conventional sweat sampler (Macroduct, Elitechgroup, Pueauz, France) and a microfluidic device were placed on the right forearm and then covered with a compression arm sleeve (Figure 6f). The march was maintained until the subject exhibited exhaustion and dehydration, typically within 1.5–2 h. Human studies were conducted with due process of law. All subjects were informed and provided signed consent.
Supporting InformationSupporting Information is available from the Wiley Online Library or from the author.
AcknowledgementsS.B.K. and Y.Z. contributed equally to this work. This research was funded by the Air Force Research Laboratory (AFRL) Human Signatures Branch through Core funds provided to Northwestern University under contract FA8650-14-D-6516 and Industrial Strategic Technology Development Program (10051513) funded by the Ministry of Trade, Industry and Energy (MI, Korea). The authors appreciate the members of Bioprocess Engineering Lab in Korea University helped this research. Also, Y.H. acknowledges the support from NSF (Grant Nos. 1400169, 1534120 and 1635443) and NIH (Grant No. R01EB019337). Y.X. gratefully acknowledges support from the Ryan Fellowship and the Northwestern University International Institute for Nanotechnology.
Conflict of InterestThe authors declare no conflict of interest.
Keywordsmicrofluidics, perspiration, super absorbent polymer, sweat chloride
Received: September 25, 2017Revised: November 9, 2017
Published online: February 2, 2018
[1] S. Robinson, A. H. Robinson, Physiol. Rev. 1954, 34, 202.[2] M. A. Baker, J. Physiol. 1989, 417, 421.[3] K. Sato, W. H. Kang, K. Saga, K. T. Sato, J. Am. Acad. Dermatol.
1989, 20, 537.[4] A. Mena-Bravo, M. D. Luque de Castro, J. Pharm. Biomed. Anal.
2014, 90, 139.[5] S. M. Fortney, C. B. Wenger, J. R. Bove, E. R. Nadel, J. Appl. Physiol.:
Respir., Environ. Exercise Physiol. 1984, 57, 1688.[6] J. C. Davies, E. W. F. W. Alton, A. Bush, Br. Med. J. 2017, 335, 1255.[7] D. R. VanDevanter, J. S. Kahle, A. K. O’Sullivan, S. Sikirica,
P. S. Hodgkins, J. Cystic Fibrosis 2016, 15, 147.[8] H. M. Emrich, E. Stoll, B. Friolet, J. P. Colombo, R. Richterich,
E. Rossi, Pediatr. Res. 1968, 2, 464.[9] B. Murray, J. Am. Coll. Nutr. 2007, 26, 5425.
[10] A. Bouchama, J. P. Knochel, N. Engl. J. Med. 2002, 346, 1978.[11] G. Broessner, R. Beer, G. Franz, P. Lackner, K. Engelhardt,
C. Brenneis, B. Pfausler, E. Schmutzhard, Crit. Care 2005, 9, R498.[12] J. Gilchrist, T. Haileyesus, M. W. Murphy, E. E. Yard, Morb. Mortal.
Wkly. Rep. 2011, 60, 977.[13] L. J. McCutcheon, R. J. Geor, M. Jessie Hare, G. L. Ecker,
M. I. Lindinger, Equine Vet. J. 1995, 20, 153.[14] S. Jadoon, S. Karim, M. R. Akram, A. K. Khan, M. A. Zia,
A. R. Siddiqi, G. Murtaza, Int. J. Anal. Chem. 2015, 2015, 164974.[15] J. Choi, D. Kang, S. Han, S. B. Kim, J. A. Rogers, Adv. Healthcare
Mater. 2017, 6, 1601355.[16] J. N. Hussain, N. Mantri, M. Cohen, J. Hussain, Clin. Biochem. Rev.
2017, 38, 13.[17] A. J. Bandodkar, J. Wang, Trends Biotechnol. 2014, 32, 363.[18] L. Leclair-Visonneau, T. Bosquet, A. Magot, G. Fayet, C. G. Guen,
A. Hamel, Y. Pereon, Clin. Neurophysiol. Pract. 2016, 1, 43.[19] H. Y. Y. Nyein, W. Gao, Z. Shahpa, S. Emaminejad, S. Challa,
K. Chen, H. M. Fahad, L. Tai, H. Ota, R. W. Davis, A. Javey. ACS Nano 2016, 10, 7216.
[20] W. Gao, S. Emaminejad, H. Y. Y. Nyein, S. Challa, K. Chen, A. Peck, H. M. Fahad, H. Ota, H. Shiraki, D. Kiriya, D. Lien, G. A. Brooks, R. W. Davis, A. Javey, Nature 2016, 529, 509.
[21] J. Heikenfeld, Electroanalysis 2016, 28, 1242.[22] A. Koh, D. Kang, Y Xue, S Lee, R. M. Pielak, J. Kim, T. Hwang,
S. Min, A. Banks, P. Bastien, M. C. Manco, L. Wang, K. R. Ammann, K. I. Jang, P. Won, S. Han, R. Ghaffari, U. Paik, M. J. Slepian, G. Balooch, Y, Huang , J. A. Rogers. Sci. Transl. Med. 2016, 8, 366ra165.
[23] L. K. Fiddes, N. Raz, S. Srigunapalan, E. Tumarkan, C. A. Simmons, A. R. Wheeler, E. Kumacheva, Biomaterials 2010, 31, 3459.
[24] G. C. Biswas, T. Watanabe, E. T. Carlen, M. Yokokawa, H. Suzuki, ChemPhysChem 2016, 17, 817.
[25] A. J. Blake, T. M. Pearce, N. S. Rao, S. M. Johnson, J. C. Williams, Lab Chip 2007, 7, 842.
[26] E. Leclerc, Y. Sakai, T. Fujii, Biotechnol. Prog. 2004, 20, 750.[27] M. Zhang, J. Wu, L. Wang, K. Xiao, W. Wen, Lab Chip 2010, 10,
1199.[28] M. L. Sin, J. Gao, J. C. Liao, P. K. Wong, J. Biol. Eng. 2011, 5, 6.[29] K. Kabiri, H. Omidian, S. A. Hashemi, M. J. Zohuriaan-Mehr, Eur.
Polym. J. 2003, 39, 1341.[30] W. Park, S. Han, S. Kwon, Lab Chip 2010, 10, 2814.[31] S. M. Hong, S. H. Kim, J. H. Kim, H. I. Hwang, J. Phys.: Conf. Ser.
2006, 34, 656.[32] Y. Berdichevsky, J. Khandurina, A. Guttman, Y.-H. Lo, Sens. Actua-
tors, B 2004, 97, 402.[33] Z. Sonner, E. Wilder, J. Heikenfeld, G. Kasting, F. Beyette, D. Swaile,
F. Sherman, J. Joyce, J. Hagen, N. Kelley-Loughnane, R. Naik, Biomicrofluidics 2015, 9, 031301.
[34] K. Kwai, K. Arima, M. Morita, S. Shoji, J. Micromech. Microeng. 2015, 25, 065016.
[35] X. Li, P. Zwanenburg, X. Liu, Lab Chip 2013, 13, 2609.

1703334 (11 of 11)
www.advancedsciencenews.com www.small-journal.comsmall
NANO MICRO
© 2018 WILEY-VCH Verlag GmbH & Co. KGaA, Weinheim
[36] M. Rahbar, L. Shannon, B. L. Gray, J. Micromech. Microeng. 2016, 26, 055012.
[37] A. Yakoh, P. Rattanarat, W. Siangproh, O. Chailapakul, Talanta 2018, 178, 134.
[38] J. A. O’Malley, A. Hassan, J. Shiley, H. Traynor, Clin. Chem. 1970, 16, 92.[39] B. G. Stephens, H. A. Suddeth, Analyst 1970, 95, 70.[40] P. F. Collins, H. Diehl, Anal. Chem. 1959, 31, 1862.[41] E. B. Buchanan, D. Crichton, J. R. Bacon, Talanta 1966, 13, 903.[42] E. B. M. de Jong, H. M. J. Goldschmidt, A. C. C. M. van Alphen,
Clin. Chem. 1980, 26, 1233.
[43] E. P. Diamandis, C. E. Efstathiou, T. P. Hadjiioannou, Clin. Chem. 1982, 28, 254.
[44] A. O. Jackson, B. A. Larkins, Plant Physiol. 1976, 57, 5.[45] M. Saat, R. G. Sirisinghe, R. Singh, Y. Tochihara, J. Physiol.
Anthropol. Appl. Hum. Sci. 2005, 24, 541.[46] J. Melin, S. R. Quake, Annu. Rev. Biophys. Biomol. Struct. 2007, 36,
213.[47] K. Ohara, Jpn. J. Physiol. 1966, 16, 274.[48] T. Fukumoto, T. Tanaka, H. Fujioka, S. Yoshihara, T. Ochi,
A. Kuroiwa, Clin. Cardiol. 1988, 11, 707.
Small 2018, 14, 1703334


![MS83 - Poclain Hydraulics...2 494 [152.1] 8 349 [509.2] 5 009 [305.5] A 3 340 [203.7] Brake Valving System Torque Module D1 Valving type 1-displacement valving 1 2-displacement symmetrical](https://img.pdfslide.us/doc/110x75/60abc56e4b097313437c4d0c/ms83-poclain-hydraulics-2-494-1521-8-349-5092-5-009-3055-a-3-340.jpg)