Embed Size (px)
Citation preview

AD-RI53 066 A FRACTURE MECHANICS AND CRACK PROPAGATION APPROACH TO L/i
THE STUDY OF OYERC..(U) CASE INST OF TECH CLEVELAND OHDEPT OF CIVIL ENGINEERING A S SAR ET AL. FEB 95
m hhRSIFED FRhE R-18i.hhhhEI-3--01 /G813

J-2
IIIII5
MIROOP RSLINTSCHRNATIONAL BUEA OFSANADS O96-
71.8

0
(0(0
S
LA
IS
S
S~-. 4**
S
0
S
S
S
S
I' °Nr -. A FTF1
SECURITY CLASSIFICATION OF THIS PAGE (When Data Enteed)
REPORT DOCUMENTATION PAGE READ INSTRUCTIONS SBEFORE COMPLETING FORM
. REPORT NUMBER 2. GOVT ACCESSION NO. 3. RECIPIENT'S CATALOG NUMBER/tN N/A N/A
4. TITLE (and Subtitle) S. TYPE OF REPORT b PERIOD COVERED
A FRACTURE MECHANICS AND CRACK PROPAGATION Final Technical ReportAPPROACH TO THE STUDY OF OVERCONSOLIDATED 12/1/82 - 11/30/84 SCLAY 6. PERFORMING ORG. REPORT NUMBER
7. AUTHOR(s) S. CONTRACT OR GRANT NUMBER(&) '.
Prof. Adel S. Saada DAAG29-83-K-0010Prof. Alexander Chudnovsky
9. PERFORMING ORGANIZATION NAME AND ADDRESS 10. PROGRAM ELEMENT, PROJECT. TASKAREA & WORK UNIT NUMBERS
Dept. of Civil EngineeringCase Western Reserve Universit-Clevelandi Ohio 44106
II. CONTROLLING OFFICE NAME AND ADDRESS 12. REPORT DATE
U. S. Army Research Office February, 1985Post Office Box 12211
14. MONITORING AGENCY'W AME a AORE$S(I -dirent from ControllInj Ofice) IS. SECURITY CLASS. (of this repon)
r Unclassified"15. OECLASSIFICATION/DOWNGRAOING
SCHEDULE
16. DISTRIBUTION STATEMENT (of this Report)
Approved for public release; distribution unlimited.I AY 1 1985
17. DISTRIBUTION STATEMENT (of the abstract emitered In Block 20, II different hem Report) A
NA
1B('SUPPLEMENTARY NOTES
The view, opinions, and/or findings contained in this report arethose of the author(s) and should not be construed as an officialDepartment of the Army position, policy, or decision, unless so
"-- , ipgigat-dh te dnetimprntarnn,1t. KEY WORDS (Contlnue on severee tide It necessary and Identify by block number)
Overconsolidated Clay/ Irreversible Thermodynamics,Stress Intensity Factors Kinetics,
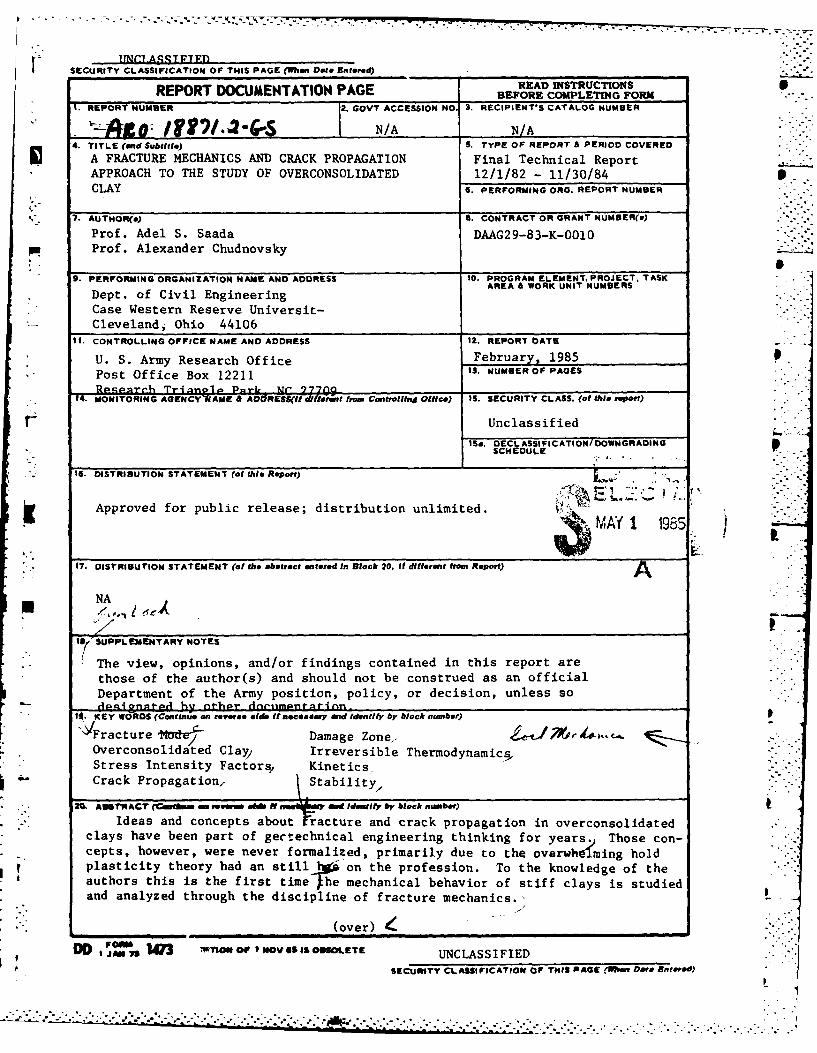
-" . Crack Propagation, \ Stability,,M0. ABs TRACT (=tMm -m , revre 6 N m Ideatf, by block member)
Ideas and concepts about racture and crack propagation in overconsolidatedclays have been part of gectechnical engineering thinking for years. Those con-cepts, however, were never formalized, primarily due to the overwhelming holdplasticity theory had an still on the profession. To the knowledge of theauthors this is the first time Jhe mechanical behavior of stiff clays is studiedand analyzed through the discipline of fracture mechanics.,
* " (over) -
D J AN 13 [email protected] UNCLASSIFIED
SECUITY CLASSIFICATION OF THIS PAGE (When Dta Entered)
~~~~............................................-, ..... ,.........:...-................:........................'.."...........

INCT.A TFTFRf
SECURITY CLASSIFICATION OF THIS PAGE(Wham Data Entered)
A test is developed to determine the critical stress intensity facto5K_
for the opening mode. The specimen with the configuration of a hollow disk and anotch cut in its internal surface is fatigued under cyclic internal pressure,then failed to determine the pattern of crack propagation. The critical lengthof the crack is -thevFused to determine K C for various degrees of overconsolida-tion While overconsolidation leads to an increase in strength, --- ws--fotn1 - -".
it resulted in a noticeable decrease in the value of Kr".IC
A second test was developed to determine the critical stress intensityfactor Kr--- for the shearing mode. it 'zewiy -This is the first timea non-amiguous mode II fracture has been obtained for any material. Thespecimen with the configuration of a thin long hollow cylinder with a notch cutinto it, is subjected to hydrostatic pressure and pure torsion. Here too, theknowledge of the critical crack length and shearing stress allows n to get K1 1
for a large spectrum of overconsolidation ratios. Here, however *he influenceof overconsolidation on Ko was much smaller than that observed on Klr.
TIC IC-/
Most intriguing are the observed damage zones which have very little Ianything to do with the predictions of plasticity theory. A honey combed networ k
of fissures was observed enclosing undamaged material with localized discon-tinuities emanating from the tip of the crack. Here damage zone theory ratherthan plastiity is the most promising tool in the process of understanding thedeformation and failure of fissured clays.
K'C and Kr characterize catastrophic failure and do not describe thephenomenon of slow crack propagation. The kinetics of crack propagation for mode
el was studied by direct surface observation,-those observations Were-"compared tc
crack lengths calculated from crack opening displacement measurements., The rela-tion between the rate of crack propagation with respect to the number of cycles,and the energy release rate which was deduced, is at the core of the developmentof constitutive equations for crack propagation: provided it is verified irfurther experiments on different clays.
A thermodynamic criterion of stability is applied to the stability of arinfinite slope with a crack parallel to the surface.
p.- - -6
UNCLASSIFIED
SECURITY CLASSIFICATION OF THIS PAGE(U7en Date Entered)
....................................................................................................................................................................................................................................................................................

FORIARD
The study reported herein was made by the faculty and students of Case
Western Reserve University (CWRU) during the period 1 December, 1982
through 30 December, 1984. The investigation was sponsored by the U.S.
" Army Research Office, under Research Agreement No. DAAG2Q-83-K-0010 and the
supervision of Dr. Steven J. Mock of the Geosciences Division. The
Co-Principal Investigators were Professors Adel S. Saada and Alexander
Chudnovsky, Graduate Students M. Kennedy and H. Sharaf participated in this
investigation as part of their Master's degree requirements.
IL
or's
4 -
. . . . . . . -...

CONTENTSPAGE
LIST OF ILLUSTRATIONS 3 _
PART I INTRODUCTION 5
Ia - Soil Mechanics and Fracture Mechanics- A Review of Some Relevant Work 5
lb - Some Questions to be Answered by Fracture Mechanics 11 PIc - Goals of the Present Study 13
PART II DETERMINATION OF THE CRITICAL VALUE OF THE STRESSINTENSITY FACTOR KIC FOR MODE I FRACTURE 15
Ila - Sample Preparation and Testing Equipment 15lib - Calculation of K 18Ilc - Kinetics of CraciCPropagation 22
PART III DETERMINATION OF THE CRITICAL VALUE OF THE STRESS .INTENSITY FACTOR K FOR MODE II FRACTURE 35
Ilc
lIla - Sample Preparation and Testing EquipmentIlIb - Calculation of K 37IlIc Observations of Uaaged Zones in the Vicinity
of Cracks 37
PART IV THERMODYNAMIC CRITERIA OF STABILITY AND APPLICATIONTO THE SLOPE STABILITY PROBLEM 44
IVa - Thermodynamic Criteria of Stability 44IVb - Application to the Stability of Infinite Slopes 46
PART V CONCLUSION 49
PART VI BIBLIOGRAPHY 50
2
L. ..
.................................-................---.i..

7.- -Jb
LIST OF ILLUSTRATIONS
FIG. 1 Fracture Modes
FIG. 2 Vertical Section Through Typical Fissured Clay
FIG. 3 An Energy Parameter for Brittle Soils
FIG. 4 Successive Stages in the Development of Shear Zones
FIG. 5 Crack Growth and Residual Strength curves
FIG. 6 Sample Preparation
FIG. 7 Specimen for Mode I Test
FIG. 8 Mode I Test Fixture
FIG. 9 Mode I Test Set Up
FIG. 10 Crack Propagation and COD Measurements
FIG. 11 Calculation of Kic
FIG. 12 Determination of K for a Hollow Disk
FIG. 13 Elastic Stress Distribution in a Hollow Disk
FIG. 14 K for Overconsolidated ClayIC
FIG. 15 Crack Length Versus Number of Cycles for Four Tests
FIG. 16 Average Value of Crack Length and Data Scatter
FIG. 17 Derivation of Crack Opening Displacement
FIG. 18 The Use of Tada's Strip to Derive an Approximate Solution
FIG. 19 Calculated Values of the COD Versus £
FIG. 20 Measured Values of the COD Versus N
FIG. 21 Average Values of the COD Versus N
FIG. 22 Comparison Between Measured and Calculated Crack Lengths
FIG. 23 Crack Length Rate Versus k.
FIG. 24 Energy Release Rate Versus 9t
FIG. 25 Average Crack Length Rate Versus Energy Release Rate
3 ,.- -. . . . .. . . . . . . .o-.

FIG. 26 Failure of Hollow Cylinder in Mode II
FIG. 27 Mode II Torsional Testing System
FIG. 28 K for Overconsolidated ClayIC
FIG. 29 Sections Observed in Mode II Specimen Fracture
FIG. 30 Damaged Pattern and Localized Discontinuities
FIG. 31 Fragments of Honeycomb Damage
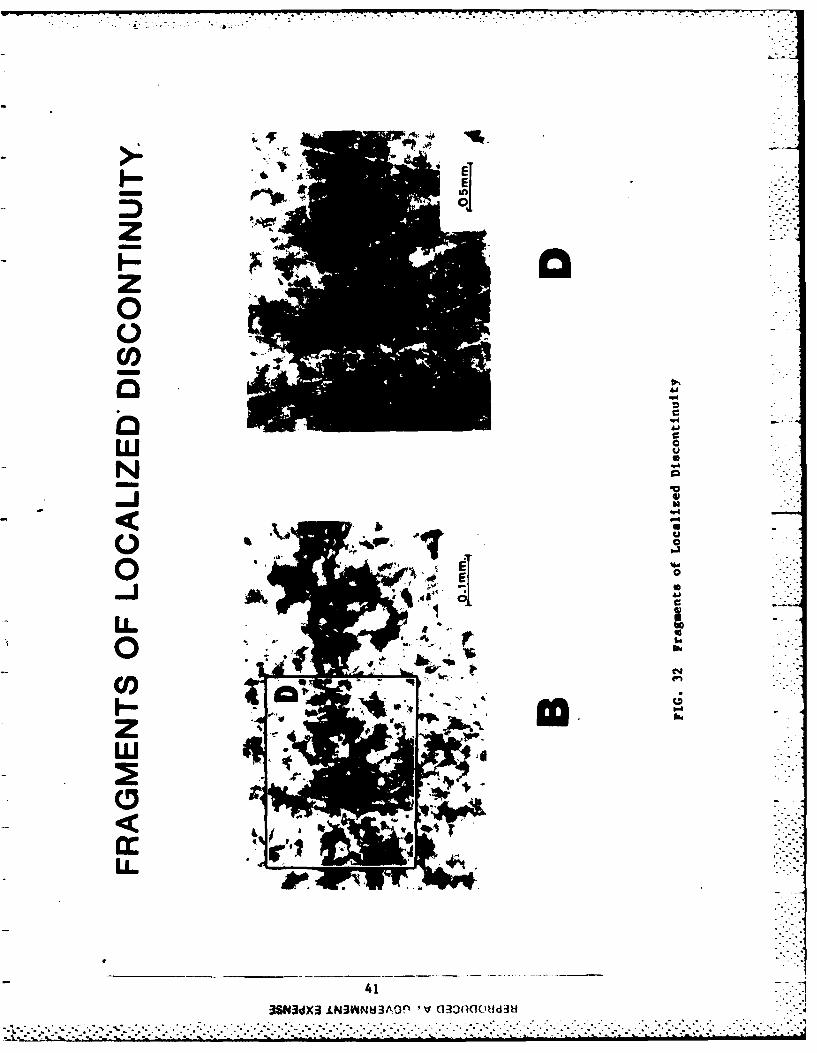
FIG. 32 Fragments of Localized Discontinuity
FIG. 33 Fracture Surface and Damage Zones.
4
'C -
-. -.-. -~ -. . . . . . . . .•

PART I: INTRODUCTION
Ia - Soil Mechanics and Fracture Mechanics - A Review of Some Relevant Work P.
Cracks are very often observed in stiff clays. Some appear during a
shrinkage process; some appear during an expansion process; and some are
initiated by high levels of stress concentration at low nominal stress
levels. Once a crack has been initiated subsequent propagation may follow
any of the three modes shown in Fig. 1. Mode I, the opening mode, is of
importance in hydraulic fracturing and modes II and III, the shearing
modes, are of interest in all problems involving sliding.
Ideas and concepts about fracture and crack propagation have been in
the back of the mind of geotechnical engineering researchers for years.
Often the terminology is different from that used by classical fracture
mechanicians, but the problems are common. The geotechnical engineering
profession is quite familiar with stiff fissured or jointed clays where the L
discontinuities, in contrast to the Griffith cracks, are found on a
macroscopic scale (Fig. 2). The possible geological processes that may
lead to the formation of fissures has been discussed by Fookes [7]. A
preliminary classification of different types of discontinuities which .
constitute planes of weakness has been given by Skempton and Petley [15]
and Skemption, Schuster and Petley 116]. The importance of size effect on
the undrained strength of stiff fissured clay was demonstrated by Bishop
and Little [21 who showed that the strength of London clay determined by
in-situ shear box testing on a 2 ft. by 2 ft. square sample is only 55
percent of that given by laboratory unconsolidated undrained triaxial tests
on 1.5 in. diameter samples. Similar strength decrease was found for blue
5 ...............................................Jo% %

modo de deU mode MIopmnsngmnof@ sliding Mode tearing Mode
FIG. 1 Fracture Nodes -
2 3 4 ins
FIG 2 Veticl eioThogTyiaFsurdCy

London clay by Simons [131. For a glacio-lacustrine clay north of lake
Erie, Lo, adams and Seychuk 119] found that the size effect was more
pronounced. The phenomenon is therefore, not only a mathematical prob-
ability, but a physical reality of no infrequent occurence. The remarkable
work of Lo [9] on the operational strength of fissured clay has in it most
of the elements on which classical fracture mechanics rests.
A characteristics common to "most" stiff clays is that they are over-
consolidated and therefore they have the capacity of decreasing their
shearing strength with increasing deformation. Deformation is time
dependent and, as pointed out by Morgenstern [10], one has to distinguish
betwen two aspects of the time dependent behavior of soils. These are
creep and progressive failure. A soil exhibiting creep at a given stress
level will still be able to sustain a higher stress level although possibly
with a higher strain rate. The best documented evidence for creep in soils
is secondary consolidation and field evidence shows that secondary
consolidation in stiff clays can be substantial and depend upon the history
of loading [4]. Progressive failure relates to the fact that the available
shearing resistance of a soil mass can be between the peak and the residual
value. The strength can be attacked in various ways giving rise to dis-
placements which vary with time. When the shearing strength drops below
the shearing stress, catastrophic movement can ensue. Both creep and
progressive failure are dependent upon the loading path.
In his Terzaghi lecture Bjerrum (31 states that in order to start a
progressive failure there must be a discontinuity somewhere in the clay
mass where failure can be initiated and the deformations required for
further development can be produced. Stress concentrations, in other words -- !
77~~~............. .....-...... ,.-,......-...•-............ ...--.-.-.--..-..............-. ............ ... .o................... ,j. . ... ... ,. , ,_.....___ . ,

local high shearing stresses exceeding the peak are given as a prerequisite
for the development of a continuous failure surface by progressive failure.
The more overconsolidated the clay, the greater its content of recoverable
strain energy and the greater the danger of progressive failure. Bishop
Ill defined brittle clays by means of a brittleness parameter defined by
(Fig. 3)
T Tf rI f - %r-:
B Tf
which for overconsolidated soils varies with stress. He also suggested
that brittleness may be considered in terms of the additional energy
required to make the shear failure progress from the peak to the residual
state (Fig. 3). This is represented by the shaded area Ef If the sample
had shown no drop in strength after the peak, the work done would have been
represented by E . The difference between these areas expressed as a ratioP
of E may he a useful measure of brittleness also. It was called thep
rupture index (Fig. 3):
Ep E fRupture Index
p
Bishop cautioned against evaluating any parameter based on the shape of the
stress strain curve, particularlily after the peak, because of the tendency
for failure to develop in a single thin shear zone in many samples which
show marked dilatancy or marked structural breakdown or shear.
The mechanism of propagation of a shear surface in a fissured clay may
well prove to involve concepts similar to those put forward by Griffith.
These Include energy absorbed in forming the surface and released by
relieving the stresses in the locally highly stressed material adjacent to
it.
8
. . . . ~ . .. .. . . . . . . . . . . . . .
-'. ..'. , " . .i € - - i"
. . ". . . ."
. . . . . .,: _ . . .. = .L .. _ . _

..-.- --..-.-.. - - -,-° .-'.--
-
Iris%
~tV~aof ato I 4.06,
gii
(are# Cop & 5
vPtaell Fade CLO, M ~
IF., ',&o as4;" Os'
Fig. 3 An Energy Parameter for Brittle Soils
Stage (ti)
Stage (ii
Stage (il
Thrust (P) Riedel Ar4- - - - Dspacmen~t (01
FIG. 4 Successive Stages In the Development of Shear Zones
-- -
50
*Testi1*Test 2*Test 3
40 Ts
0
f20
10
20 60 100 140N umber of Cycles, N
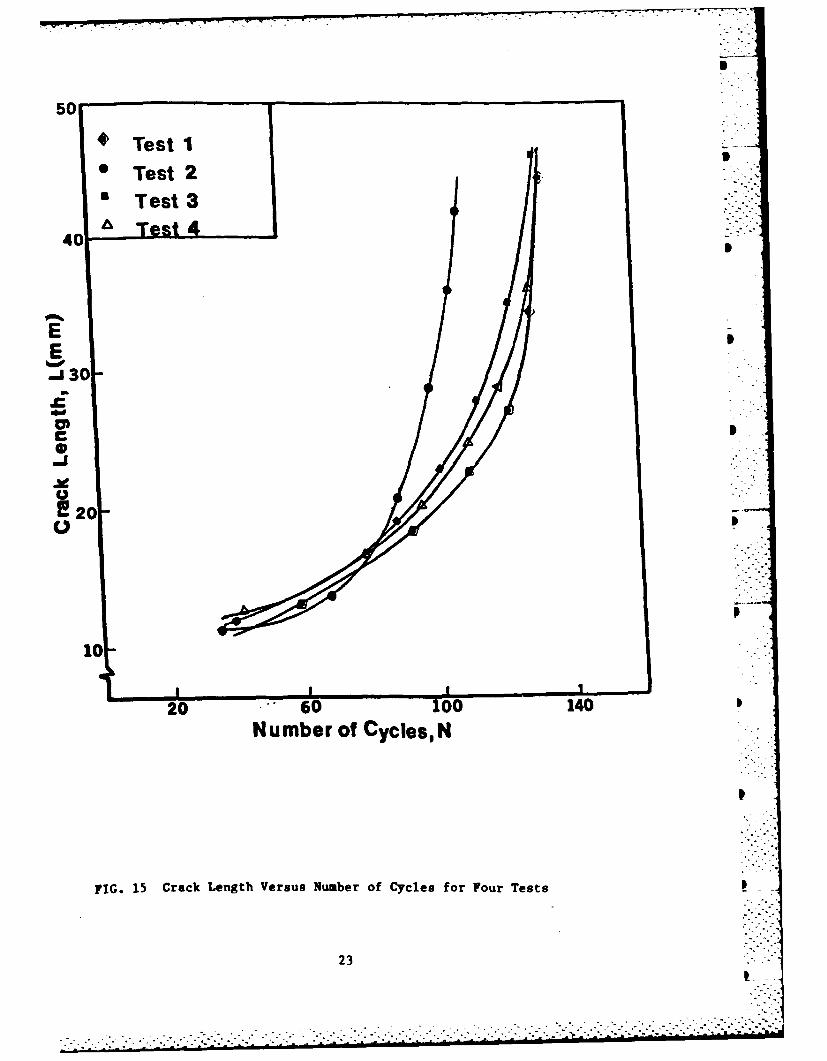
FIG. 15 Crack Length Versus Number of Cycles for Four Teats
23

HIc - Kinetics of Crack Propagation
To study the kinetics of crack propagation four tests were conducted
during which the crack length was measured as the number of internal
pressure cycles increased. Fig. 15 shows the results of those tests.
Average values are plotted in Fig. 16 together with a measure of the amount --
of scatter. As previously indicated the crack length is measured on the
face of the disk with a follower attached LN an LVDT. There is no
guarantee that this crack length extends all the way across the material.
Thus, an alternate method for recording the crack length was sought. This
method is based on a simple relation between the crack length and the crack
opening 6 at a certain point. According to Castigliano's second theorem,
for a linearly elastic material, the displacement 6 caused by a load Q is
given by
(6)Q - Q
where U is the strain energy of the solid and T the potential energy.
Let us consider the disk shown in Fig. 17. The potential energy
can be expressed as:
1 1 = 1 1 no crack J d2. (7)
The derivative - is the energy release rate J for linear elasticity andah 1
can be expressed in terms of the stress intensity factor:
_ = (Il-v2) 2 ~
K (8)E 1I8
To compute the crack opening 6 at a distance c from the inner face of the
22
-.... . .. . . . . . ,-~

2a2
2b
FIG. 13 Elastic Stress Distribution in a Hollow Disk
00
10.0- 0
'E 0
9s.0 02
04 Kid' 4.8-(20.000CR- 2.5(OCRJ7.2L\\
4.0 0
S 4.0 5.0 6.0 -7.'0-OCR
FIG. 14 K for Oyerconsolidated Clay
21

Green's function GK(X) for the hollow disk with a crack emanating from the
hole is not known. As a first approximation use was made of Green's
function for the stress intensity factor in the strip shown in Fig. 12:
K ( 3)-
where F(!, -) is a geometric correction factor given in reference 17 pagew
2-27. To apply Eq. 3 to the hollow disk we set (b-a) equal to W. b and a
are the outer and inner radii of the disk. The elastic stress distributionI
along a radius in a hollow disk subjected to internal pressure is given by
(Fig .13).pa2 b4 2...
ae(a+x) - 11 + (-)I (4)b-a a+x
Using the superposition principle and equations 2, 3 and 4, the stress
intensity K1 for a hollow disk with a crack emanating from the hole is
P3 x= I( a , + c b )2KI f/" 2(L a2 dx (5) •i2
0
Numerical integration of Eq. 5 leads to the curve shown in Fig. 12.
If I and p are replaced by their critical value k and P and substitutedc c
in Eq. 5, the critical value K C of the stress intensity factor is
obtained. For the tests conducted in this investigation, this value as a
function of the overconsolidation ratio is shown in Fig. 1A. Ki. is a
basic parameter to be used in design when failures such as those occurring
during hydraulic fracturing are studied.
Damage zone propagation studies are presently in progress to clarify
the dependence of K on the preconsolidatlon pressure.
I C
20
.... -.
2,¢2.'f~~o"'',',''''.........."..................'-..". ..-. ". ..-. "-.."

FIG. 11 Calculation of K 1C
3.0-
*Tada's single edgenotched specimen of
2.5- fi Ate width.P
1z2.0 -P
Hollow Disk
.5-
0.1 0.2 0.3 0.4 0.5 0.6 0.7
FIG. 12 Detoraination of .1 for a Hollow Disk
19

* .... .. .. . . . . . . . . . . . . . .79
overconsolidation ratio were mounted in the testing fixture as shown in
Fig. 8 and sinusoidally varying air pressure sent through the air inlet.I
Under cyclic pressure the crack propagates in a stable manner as long as
the pressure is moderate and the crack length below the critical. The
crack was allowed to propagate half way through thickness to allow for the
study of damage zones. Crack propagation was followed with a pointer
attached to an LVDT. The crack opening displacement (COD) was measured
with a transducer mounted on the specimen. The cyclic loading was then
stopped and a sudden high pressure was applied inside the membrane which
caused failure in a very short time. An X-Y plotter gave a graph of the
inside pressure versus the COD. The maximum pressure is the critical
pressure. The critical length was obtained from the examination of the
fracture surface.
Fig. 9 shows the whole apparatus designed and built for this purpose.
Fig. 10 shows the details of the micrometer driven pointer following the
crack propagation.
IIb- Calculation of KIC
The most general and elegant way to calculate K is through the use of
Green's function. Let G (x) be Green's function for the stress intensity
factor for a given sample geometry; i.e., the expression for the stress
intensity factor K caused by the unit double forces applied at the point x
(Fig. 11):
K G Czx) (1)KI GKW
Then for an arbitrarily distributed traction o(x) normal to the crack's
edges, the stress intensity factor is given by,
KI G K o(x)dx (2)
18
7-'. -,

FIG. 9 Mode I Test Set Up
FIG. 10 Crack Propagation and COD Measurements
17

. . . . . . . . . . . .. . . . . . . . . ... . . .. .
4 1
FIG- 7-pcie4orMd.ITs
2. - 4 4
AI INE
I "I
FIG. SpcMe rNode I Testr
p1

PART II: DETEMIATION OF THE CRITICAL VALUE OF THE STRESS INTENSITY
FACTOR .IC FOR MODE I FRACTURE
Fracture Modes I and II are respectively distinguished by symmetry and
antisymmetry of stress, strain and displacement fields with respect to the
crack plane. For Mode I fracture the sample configuration used is that of a
hollow disk with a precut notch or stress concentration cut in the inside
edge. Static or dynamic pressure is applied to the inner surface through a
rubber membrane.
For linear elastic media, the stress intensity factor K is uniquely
defined by the stress and the length. Thus, its critical value K can be
obtained once the value of the critical stress and that of the critical
crack length at which unstable fracture takes place are known.
Ila - Sample Preparation and Testing Equipment
Kaolinite clay with liquid and plastic limits of 56.3 percent and 37.5
percent respectively was mixed with deaired distilled water at twice the
liquid limit. The slurry was consolidated in a large metal consolidometer
under a series of pressures namely 414, 517, 620 and 723 kPa to provide a
range of overconsolidation ratios. After equilibrium was reached the clay
was allowed to rebound under atmospheric pressure leading to overconsolida-
tion ratios of 4, 5.1, 6.1 and 7.1 respectively. Fig. 6 shows the consoli-
dometer set-up.
The blocks of clay were sliced horizontally to yield specimens 25mm
thick. A simple rig was used to punch a 35.6mm hole at the center of the
discs and to cut a radial notch 10mm deep (Fig. 7). They were covered with
silicone oil wrapped and stored in a fog room. The specimens with a given
15
. k.'.;..........o .......................o. ........ . . -- °

4crock 4residualsize strength
- -- design strength
expected highestservice load
forrmatIservice load
Jfotlurema failure
occur
10 cycle crock sizeaa time btm
FIG. 5 Crack Growth and Residual Strength curves
FIG. 6 Sample Preparation
14

.. . .. . . .. . .
their density and their statistical distribution in the material.
Ic - Goals of the Present Study
Following a path similiar to that taken for other materials, this
*'-" study seeks to develop standard tests for the determination of K I and K
for stiff clays. Zones of microcracking are studied as well as the
kinetics of crack propagation. This and future investigations well
hopefully lead to realistic constitutive relations and lay a foundation for
better understanding the behavior of stiff clays under static and dynamic
loading.
13
.... .. ...... .. .............
.*,. .- * .* ~ *-.~ . . . . . . . .. . .. . . . . . . . . . . .

very small peak. High stress concentrations or large strains are needed to
1P initiate cracks in such clays. Often, however, Inclusions such as coarse
particles from stress concentrators for cracks to start and propagate.
Due to the presence of a crack the strength of the soil is decreased.
As the size of the crack increases with time additional degradation of the
strength takes place (Fig. 5). After a certain time it becomes so low that
the soil cannot withstand accidental high loads that may occur in service.
- From this moment on the soil is liable to fail. On the other hand, if
accidental high loads do not occur, cracks may continue to grow with time
until the strength falls below the service load. With respect to Fig. 5,
r fracture mechanics should help answer the following questions:
1 - What is the strength as a function of the crack size?
2 - What size of crack can be tolerated at the expected
service stresses (static or dyanmic)? And what is the,-
critical crack size?
3 - Under a given state of loading, how long does it take
for a crack to grow from a certain initial size to the
critical size?
. 4 - How do cracks coalesce and ultimately reduce the strength
to its residual value?
.Many theories which have been found satisfactory for both brittle and
ductile materials have never been tried for clays. The aim of this research
is to examine the mechanical behavior of clay from the point of view of
fracture mechanics. Since failure generally appears in the form of a
" surface, one has to start by studying the single crack and its propagation,
* followed by the coalescence of cracks; a topic which obviously involves
12
....................................................................

presently the subject of some research and may become another useful tool
* in the geotechnical engineering arsenal. Some results suggest that the
-5 mechanism involved is that of a tensile failure resulting from water
. -." pressure acting on a crack in a soil medium. A discontinuity is needed and
the soil at the tip of the crack deforms plastically.
More recently researchers have turned their attention to the behavior
of clays under large cyclic loadings. Under such loadings cracks can be
initiated as a result of plastic deformations. Even if the nominal
stresses are well below the yield limit, locally the stresses may be above
yield due to stress concentrations such as those occurring in simple shear
devices. Cracks can coalesce after a number of cycles leading to fatigue
fracture.
Slb - Some Questions to be Answered by Fracture Mechanics
Under stress clays seem to have in them the capability of responding
as elastic, viscous or plastic materials. It all depends on the level and
the rate at which the stresses are applied. They can be in a brittle state
or in a plastic state; they can be intact or fissured; they can beLinsensitive; they can be strain hardening or strain softening. High
" -overconsolidation ratios lead to clays which develop fissures upon rebound,
and such fissures can be visible to the naktd eye; they have a residual
. strength much lower than the peak. Moderate overconsolidation ratios
result in clays which "may" have in them flaws or micro-cracks invisible to
I the naked eye, but whose presence expresses itself through the existence of
- .a peak and a residual strength; and through an influence of the size of the
* test specimen on the strength. Low overconsolidation ratios result in
clays whose behavior is of the strain hardening type or at best presents a
+1 1
.......................................,............ ...... ,......,.,,,....,..,....-.-•.... ..... .. . . . . . . o . . - . + . • . . w . . . . .•. . . . o • . .

*.~~P P. ... 7 * -
Skempton [14] recognized five stages in the shearing deformation of a
stiff clay. The first one before the peak is one of continuous non-
homogeneous strain. In the second which occurs at or just before the peak
Riedel shears are formed (Fig. 4). They lie en echelon at an inclination
usually between 10 to 30 degrees to the direction of general movement (the
D axis) and conjugate shears R* are sometimes seen. With further movement
a third stage is soon reached at which slip along the Riedel shear is no
longer kinematically possible and the clay is compelled to develop new slip
surfaces parallel or subparallel to the D axis. These are the displacement
shears. With greater movement the displacement shears extend and even-
tually in the fourth stage some of them link up to form a slip surface.
This surface is undulating since the shears involved were not originally
all in line. Thrust shears typically inclined at about 1602 to the D axis
also tend to develop in the third and fourth stages. In the fifth stage
the slip surface undergoes appreciable flattening as a result of still
greater movements. Once a slip surface has formed subsequent movements are
mostly concentrated along it; and large displacements can then take place
without a fundamental change in the pattern of shears. the development of
shear is accompanied by particle orientation. Morgenstern and Tchalenko
[111 and Yong and Warkentin [181 have shown that the slip surface consists
of a thin band in which the particles are strongly oriented more or less in
the direction of the movement. A flattened slip surface must possess the
minimum shear resistance and this is the residual strength of the clay.
An interesting test that is sometimes conducted in the field in
conjunction with permeability tests is hydraulic fracturing. It has been
used for years to determine in-situ earth pressures. Such a test is
10
................... .

50
2 2xStandardjDeviation*40
E
A 30V
~20
0
20 60 100 140
Number of Cycles, N
FIG. 16 Average Value of Crack Length and Data Scatter
24
.' .7

FIG. 17 Derivation of Crack Opening Displacement
tx
Ia=1.8 cmbz5.5 cm
a
q(a+z) = (0-oe3+3.36/(S+X) 2)pFIG. 18 The Use of Tada's Strip to Derive an Approximate Solution
25
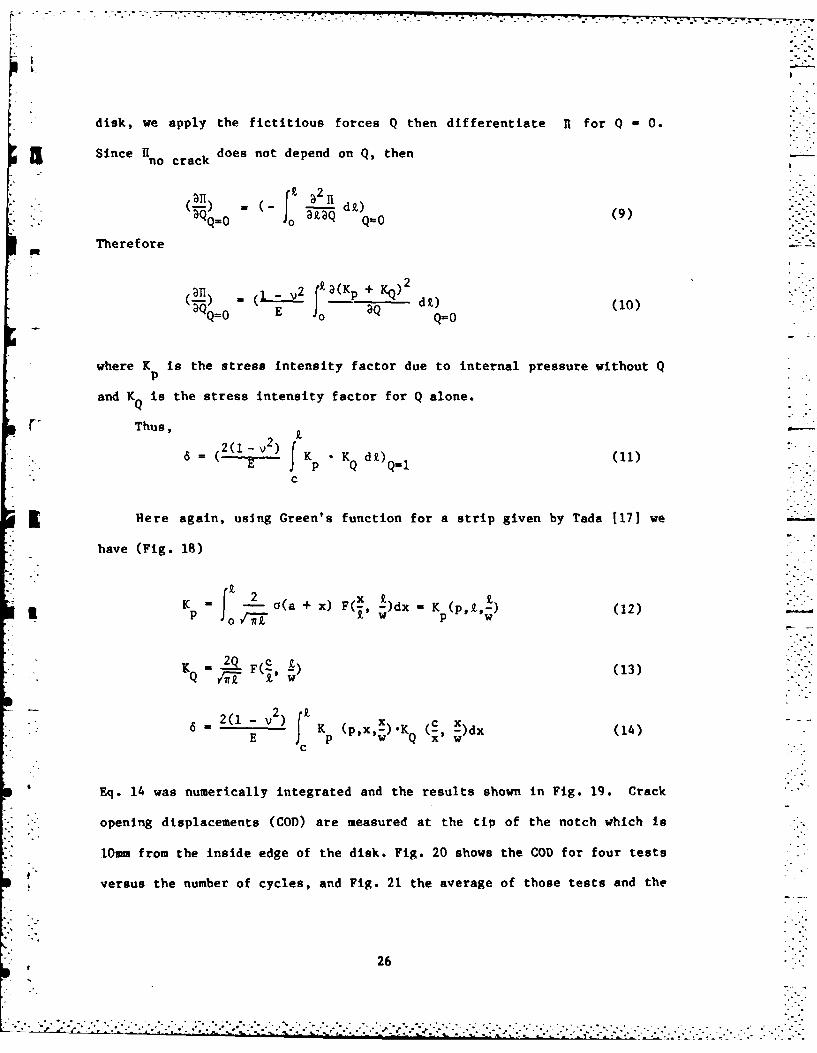
disk, ye apply the fictitious forces Qthen differentiate it f or Q -0.
Since RI does not depend on Q, thenI no crack
(E) a2 ] - d9,)(9QO f Zo Q-0
Therefore
(-) E a dR.) (10)= 0 Q-0
where K is the stress intensity factor due to internal pressure without Qp
and K is the stress intensity factor for Q alone.Q
r Thus,
6 (2(1- V) f ( K i6= E J *KQ diQ 1 11
c
Here again, using Green's function for a strip given by Tada 1171 we-
have (Fig. 18)
K l (a + x) F , dx K(ts (12)
EQ 2Q F(c,& (13)
2 z~
21-v)r K (Pvxq )*KQ )d (14)
Eq. 14 vas numerically integrated and the results shown In Fig. 19. Crack
* .opening displacements (COD) are measured at the tip of the notch which is
10mm from the inside edge of the disk. Fig. 20 shows the COD for four tests
* versus the number of cycles, and Fig. 21 the average of those tests and the
26

0.9
0.
OFa
00.
I0.3
0030
Crack Length, L(mm)
* . FIG. 19 Calculated Values of the COD Versus I
27

Co V
944
(WW) a0
28z
We.

K
U
SbeS
z 0
r 0~'-
CE) .So -UK SK
beS
I . zS -
60 -'4
C.6*-(1)0 0
NCd
I I
U) U) U)Cl aS U
0 ww '<ao~:~, eSsiGAy
L 29 - .11~1

scatter involved. Combining figures 19, 20 and 21 one can deduce the
relation between the crack length and the number of cycles. This relationS
is shown in Fig. 22, together with the experimentally measured one. The
two curves are signficantly different. This may be due to the fact that
the COD versus the crack length was obtained from a strip instead of from a
disk. Apparently the error due to such an approximation increases with the
crack length. Also linear elasticity may have limited applicability to the
material. Both these limitations can be eliminated by further theoretical
developments. In addtiion the experimental length of the crack was
obtained from outside observation on the face of the disk. Cross sections
would help insure that this length indeed extends throughout the thickness.
The kinetics of crack propagation In terms of crack propagation rate
versus crack length obtained from direct observation is shown in Fig. 23.
The relation between and I strongly depends on the specimen's geometrydN
and thus does not represent a material behavior. The same time, the energy
release rate J accounting for specimen geometry, crack length and loading
conditions is commonly used as an invariant parameter. Fig. 24 shows the
energy release rate versus the crack length. versus J is then plotted in
Fig. 25. This last relation, if verified in further experiments, is at the
core of the development of constitutive equations for crack propagation.
30
.............................
. . . .* '* .*. *. * -. .
. . . . . . . . . . . . . . . . . . . . . . .. .

50* Experimental
*Theoretical
40
E'j 30__ Measured-;
.j
0 2
Calculated
f rom COD measurements
10
20 60 100 140
Numbe.r of Cycles, N
FIG. 22 Comparison Between Measured and calculated Crack LIntS
31

2.0
2 x StandardDeviatio
1.6l o
1.2
4;0.cc
c
23

-m -w %6
600
Jc500
.,400
300
*200
100
Lc
10 20 30 40 50
Crack Length,L(~nm)
FIG. 24 Energy Release Rate Versus I
33

2.4 1
~2.0
~1.2
0O.8
0.4
Jc
100 200 300 400 500 600
Energy Release Rate, J (N/rn)
FIG. 25 Average Crack Length Rate Versus Energy Release Rate
34

PART III: DETERMINATION OF THE CRITICAL VALUE OF THE STRESS
INTENSITY FACTOR Kuc FOR MODE lI FRACTURE P
In this mode the displacement of the crack surfaces is parallel to the
plane of the crack. the sample configuration used is that of a thin long
hollow cylinder with the dimensions shown in Fig. 26. Once the length of
the crack and the critical shearing stress are known a solution due to
Erdogan and Ratwani 161 allows one to compute KIIc.
lia - Sample Preparation and Testing Equipment
Clay slurries consolidated at approximately 280 kPa were first cut in
a shape of a hollow cylinder. A special lathe was used to reduce them to
the size shown in Fig. 26. Two diametrically opposite horizontal notches
were cut in the specimens and 2 layers of teflon tape inserted in them to
prevent hydrostatic pressure from closing and healing the crack. The
specimens were then placed in a special cell where they were one
dimensionally consolidated under a given cell pressure. Three cell
pressures were used leading to vertical consolidation pressures of 1394,
1174 and 954 kPa; K for this clay being 0.47. The samples were then
allowed to rebound at a cell pressure of 207 kPa leading to vertical
overconsolidation ratios of 6.7, 5.7 and 4.6.
A system of pullies and actuator was used to apply rapidly a very high
torque to the piston; while transducers inside the cell measured the actual
torque transmitted to the sample, and the angle of rotation. These values
were recorded on an X-Y plotter. The maximum torque is the critical value
needed to compute Kiic . Fig. 26 shows a series of failure surfaces in MODE
II for 3 of the hollow cylinders tested. Fig. 27 shows the torsional set up
35

IS. q
FIG. 26 Failure of Hollow Cylinder in Mode IT
FIG. 27 Mode IT Torsional Testing System
36

th the hollow cylinders of clay inside piessurized cells.
[Ib - Calculation of KiiC
Knowing the geometry of the sample and the crack as well as the
ritical torque, Erdogan's [61 solution yields the value of KIIC. Fig. 28
riows the relation between KTIC and the overconsolidation ratio for the
aolinite tested.
llc - Observations of Damaged Zones in the Vicinity of Cracks
One of the most intriguing observations made during the study is
elated to the changes in the material micro-structure caused by crack
,ropagation. It is well known that right on the fracture (or slip) surface
.he clay particles align themselves parallel to this surface. However,
)eyond this exceedingly thin layer made of the thickness of a few
)articles, a zone of damage is present. To examine this zone of damage a
Large portion of the hollow cylinder surrounding the crack was first vacuum
Lmpregnated with wax. Then a section of about I cm in height was cut
Derpendicular to the fracture surface with a diamond tipped wafering blade
'Fig. 29). When photographed in the direction indicated by the arrow, Fig.
30 is obtained. The magnification in Fig. 30 is approximately 10, which is
very small compared to what is ususally obtained in the scanning electron
nicroscope. The advantage of such a magnification is that one can see the
Dverall picture of the damage and the zone involved.
In Fig. 30, a damage zone similar in shape to the zone predicted by
plasticity theory can be seen. However, contrary to plasticity which
involves a field of slip or Luder lines, this zone consists of a honey-
combed network of fissures (dark regions) enclosing undamaged material
(light regions). the cellular structure of this region is quite evident
37
"- -',' - " . ---. - - .J . .':, ; .--#, . -- . .. . . . . . . . . . . . . . . . . . . . . . . . . . . . . . .. .::: ..

PART IV: BIBLIOGRAPHY
1. Bishop , A.W. (1967). Discussion on Shear Strength of Stiff Clay.Proc. Geotechnical Conf., Oslo 2, 142-150.
2. Bishop, A.W. & Little, A.L. (1976). The Influence of the Size andOrientation of the Sample on the Apparent Strength of the London Clayat Maldon, Essex. Proc. Geotechnical Conf., Oslo 1, 89-96.
3. Bjerrum, L. (1967). Progressive Failure in slopes of Over-ConsolidatedPlastic Clay and Clay Shales. J. Soil Mech. Fdns. Div. Am. Soc. Civ.
Engrs. 93, SM5, Part I.
4. Bjerrum, L. (1966). Secondary Settlement of Structures Subjected toLarge Variations in Live Load - in Rheology and Soil Mechanics, Ed. byJ. Kravtchenko and P. Sirleys, Springer, Berlin.
5. Chudnovsky, A. (1983). Crack Layer Theory, NASA Report, GrantNAG-3-23.
6. Erdogan, F.E. and Ratwani, M. (1973). A Circumferential Crack in aCylindrical Shell Under Torsion. Int. J. Fract. Mech., 8, 87-95.
7. Fookes, P.G. (1965). Orientation of Fissures in Stiff OverconsolidatedClay of the Siwalik System. Geotechnique 15, No. 2, 195-206.
8. Lo, K.Y. Adams, J.1. & Seychuk, J.L. (1969). The Shear Behaviour of aStiff Fissured Clay. Proc. 7th Int. Conf. Soil Mech., Mexico 1,249-255.
9. Lo, K.Y. (1970). The Operational Strength of Fissured Clay.Geotechnique 20, No. 1, 57-74.
10. Morgenstern, N.R. (1967). Shear Strength of Stiff Clays. Proc.Geotechnical Conf., Oslo 2, 59-69.
11. Morgenstern, N.R. & Tchalenko, J.S. (1967). MicrostructuralObservations on Shear Zones From Slips in Natural Clays. Proc.Geotechnical Conf., Oslo 1, 147-152.
12. P. Glansdorff and I. Prigogine (1971). Thermodynamic Theory ofStructure, Stability and fluctuations". Wiley-Interscience. New York.
13. Simons, N.E. (1967). Discussion on Shear Strength of Stiff Clay. Proc.Geotechnical Conf., Oslo 2, 159-160.
14. Skempton, A.W. (1966). Some Observations on Tectonic Shear Zones.proc. 1st. International Conference on Rock Mechanics (Libson) Vol. 1,
50
................................................

* .. - - - -"r ..r-. C-.
PART IV: CONCLUSION
A framework for the use of fracture mechanics in the study of the
behavior of stiff clays has been established. Tests have been proposed and
then conducted for the determination of KIc and KIIC* The kinetics of
crack propagation in Mode I has been examined. Experimentally this is the
first time a pure Mode II has been obtained for any material; and the
observations made on the microstructure in the damage zone seem to provide
a turning point in the interpretation of failure phenomena in clays.
Perhaps the most important contribution of K. Terzaghi to soil mech-
anics was his bringing together in one treatise many of the branches of the
mechanics of continuous media; and casting them in a form easily used by
engineers. Fracture mechanics is a relatively young science which has its
place in the interpretation of the behavior of soil masses. It is hoped
that this research will help develop new testing and analysis techniques
leading to more rational design in fissured soils.
49
. . . . . . . . .. . ...-

TABLE I
Critical length of cracks for various h and i.
i0 15.00 20.00 25.00 30.00 35.00
h h
5.0 33.13 20.05 14.11 11.04 9.386.0 23.01 13.92 9.80 7.67 6.51
8.0 12.94 7.83 5.51 4.31 3.6610.0 8.28 5.01 3.53 2.76 2.34
I
L
48
.-*. -° -, . .- " " • "%"". "" ° " '.. ,''. % ,° °- °-" '7"

.-- .--
Conventionally the energy release rate for plane strain and MODE II is
written J (I - V2 )Al E, where E and v are Young's modulus and
Poisson's ratio respectively. Thus,
J 2(1 - v2) KI":Kl ->0 (23)
and condition (21b) is always satisfied. Condition (22) can be rewritten
in the following equivalent form
K lS K KI C (24)
where K is the fracture toughness coefficient. It can be obtained for11C
instance from tests conducted on hollow cylinders in MODE II fracture.
Substituting (22) into (24) we obtain the expression for the critical crack
length 2t . Thus,
c
8K2
2 - (25)c n(Pgh sin 21)
2
The values of K for a range of overconsolidation ratios can be obtainedTic
from Fig. 28. Table 1 gives values of the critical lengths of crack which
would cause catastrophic failure for various depths h and slope inclina-
tions I. The value of Pg is 17.3 kN/m3 and that of K is 156 x 103 N3/2
The dimensions are in meters. As one can notice the results seem to be
quite reasonable.
47
* . .* * * * ... . . , . . . . . . . • . . ." " "-'"-'' "' '-'-" '-: " " " " "" ; " " " " "" " m" .T -. .: . , .. ."'-" '" :< :' '- :'-"L ", ", " "":'' ":': " " '" "' "" "" ".".

sufficient condition of stability (19) reduces to
a < (20)at G - coast - ...
T - const
Therefore, at constant temperture T, the necessary and sufficient
conditions of instability are
eff aJlJ1 eY (a) JI > 0 (b) (21)
IVb - Application to the Stability of Infinite Slopes
Consider an infinite slope with a crack of length 21 parallel to the -.-
surface and at a depth h. It will be assumed that there is no shearing
resistance along the crack and that for saturated overconsolidated
undrained clay, compressive stresses do not change the shear response. A
MODE II fracture is under consideration. The shearing stress on any plane
parallel to the surface at a depth h is given by T = pgh sin(i) cos(i),
where i is the inclination of both slope and crack. Let us now consider a
MODE II crack in an infinite plane under the uniform shearing stress and
use the principle of superposition. If K is the fracture toughness of
the plane and K is that of the problem at hand then K - K becauseuIS IUS 11W
of the symmetries involved in an infinite slope. Thus,
K -Kl p -= gh/i sin(2 i) (22)
46
. .* . * . . . . .*. .% . . . . . .

appears as a generalized force reciprocal to the generalized flux X.
When (y*R- J1) < 0 the crack propagates spontaneously. When (y*R1 -
J )>0, the crack can prorpagate only if D > i(yR1 - J1 ), i.e., if the
dissipation compensates for the negative entropy production I(J *
This implies that the crack propagation is controlled by dissipative pro-
cesses like irreversible deformation, diffusion, chemical reaction, etc.
Apparently, the critical condition for instability (stability) Is
- Y'R 0 (17)
which is Griffith's criterion if Y R is taken as the surface energy. This1
effquantity in the fracture mechanics literature is referred to as y or the
critical energy release rate J . While Eq. 17 is a necessary condition1C,
for instability, the sufficient condition results from the universal -
criterion of evolution. For a stable process, the following inequality
holds [12]:
dSi dXk (18)J < 0 (18)
dt k k dt
where Jk is assumed to remain constant. For an elastic crack D - 0 and
Eqs. 16 and 18 yield
d 2 (J 1 - Y RI)T- const 0 (19)
T const
where o is the stress tensor. If the damaged zone does not change as the
crack length increases one can assume that y*R1 = yeff is constant. The
45
.................'.' -- ', - -L, - ' .. . -. '. .' ". ". .", .•,-,-.-. . - .-.- ''''' .,..,--. . ., ,_ ~~~~~~... . .. . . .. ,........,,mil.... +.........,. ....... +,.-' I

PART IV: TEKMODTNAKIC CRITERIA OF STABILITY AND APPLICATION
TO THE SLOPE STABILITY PROBLE"
IVa - Thermodynamic Criteria of Stability
For an irreversible process the second law of thermodynamics states
that the rate of entropy production Si is such that
i ik Xk > 0 (15)
where k is a generalized flux and Xk is a generalized force. The rate of
entropy production for a propagating crack has be written by Chudnovsky (5)
TSi D+ i(J -y*R) > 0 (16)i 1-
where, T is the absolute temperature, D is the portion of the irreversible
work spent on the development of micro damage in the vicinity of the crack
tip, X is the rate of crack growth; J - d l is the energy releasedt
rate, 11 is the potential energy also called Gibbs potential; Y is the
specific enthalpy of damage. It can be looked upon as the surface energy if
the damage consists of microcracks only. R1 is a value integral
characterizing the damaged zone around the crack tip 151. Whereas Y R I
represents the amount of energy needed for the crack and its surrounding
damaged zone to advance, Jl characterizes the amount of accumulated
potential energy available for crack propagation. Thus (Y*R -J)
represents the energy barrier which must be overcome for the crack to
advance. Within the framework of irreversible thermodynamics, (Jl - y*RI)
44
- 5o 5 • 5a - ~"~ 45 - . . . . . . . . -. . . .5o2S'

- .-... I.. . - -. .. 0 .r< .. :% . .- , , . .' i -.- = .. - - - "- ,- . - -. -. . . - , , :. . ,. . . . . ."- - : - - ; - .
in the enlargements of Fig. 31.
In addition to this damage zone Fig. 30 shows several localized bands
of discontinuity of slippage. Enlargements of one of these localized
discontinuities is shown in Fig. 32. The localized discontinuity has a
cellular structure similar to the honeycomb damage zone, but on a much
smaller scale. These localized discontinuities are inclined cracks which
have propagated from the notch tip as shown in Fig. 33. The horizontal
crack, rather than the inclined cracks, led to catastrophic failure.
43
....
V . * .. *! 2 .

HONEYCOMBDAMAGE ZONE-
LOCALIZED
DIRECTION
FIG. 33 Fracture Surface and Damage Zones.
42
I-w
CO) az
0 U41

Cf)
-4-0
jS~X.N3N310 IV0X(I~

U i
0
oc
043Skid3 INWNWAU IV 3D~j2H49

tj W Pi -
0
0 0 10
06t-91
392
3SaX NmIU O V(A:'((dP

rF
16.0
0
14.0
4.61 5.67 6.74OCR
FIG. 28 KCIC for Overconsolidated Clay
T4PI
K
OBSERVATIONDIRECTION NOTCH
SECTION PLANE
p
MODE II SPECIMEN
FIG. 29 Sections Observed in Mode II Specimen Fracture
38
i '. t

pp. 329-335.
15. Skempton, A.W. & Petley, D.J. (1967). The Strength Along StructuralDiscontinuities in Stiff Clays. Proc. Geotechnical Conf., Oslo 2,29-46.
16. Skempton, A.W., Schuster, R.L. & Petley, D.J. (1969). Joints andFissures in the London Clay at Wraysbury and Edgware. Geotechnique 19,No. 2 205-217.
17. Tada, H., Paris, P.C. and Irwin, C..R. (1973). The Stress Analyses ofCracks Handbook. Del Research Corporation 2-27.
18. Yong, R.N., and Warkentin, B.P. (1975). Soil Properties and BehaviorElsevier, New York.
51

FILMED
5-85
DTlC...
. . . . . . . . . . . . . . ..