Embed Size (px)
Citation preview
HANDBOOK OF GEOPHYSICAL PROSPECTING METHODS FOR THE ALASKAN PROSPECTOR
1 MlRL REPORT No. 19
Lawrence E. Hoinr Steven A Wulf
Mineral Industry Research Laboratory Univenity of Alaska
College, Almka 99701
OCTOBER 1968
;i KEC'D. - JUNEAU
FORWARD
the 1
This Ha
n m recml
P, "Search
*I.- k.4:~
ndbook hor bean eanpilrd to acquaint the Almkm k p e c t o r wlth
t application of geophysics for locating economic mto l l i c minerals.
Fw this reason, well documented subjectr such m the use of the dip d e and
mineral detectora have been excluded.
Became of continuom rareclrch in the field, new bchniqws tend to outmod.
ant geophysical prwpecting methods. Coreequently, the reader is advised ta
keep abreast of new geophyricaI developments through literatwe pertaining to the
subject. Developmank in the field wi l l be forthcoming thrwgh the continuous
advance of science and technology. Perhap Heinrichs Geuexploratlon Company's
Research equals Discovery, " best explains this fact. for this
mu-ull, ..,,neml Industry Research Laboratory of the .University of Aloska is
continuing ih research toward the development of the t o o k for mineral searoh.
College of Earth science and Mineral Industry
ACKNOWLEDGEMENTS
The authors wish to express their appreciation for the help and assistance
given by many manufacturers, distributors and exploration contractors for their
conhlbution~ to thf handbook and for review of the manvscript. Each company
listed in Appendix I hus contributed substantially to this report.
TABLE OF CONTENTS
. . . . . . . . . . . . . . . . . . . . . . ACKNOWLEDGEMENTS
TABLE OF CONTENTS . . . . . . . . . . . . . . . . . . . . . . . ' OF TABLE
' OF F l C U
INTRODUCTION . . . . . . . . . . . . . . . . . . . . . . . . . . . . . . . . . . . . . 1
Field Work . . . . . . . . . . . . . . . . . . . . . . . . . . . . . . . . . . . . 5 rsical Maps . . . . . . . . . . . . . . . . . . . . . . . . . . . . . . . . 8
. . . . . . . . . . . . . . . . . . . . . . . . ARlZATlON METHOD 11
. . . . . . . . . . . . . . . . . . . . . . . . . . . . . . . . . . . . ~nrroauction 11 Fieldwork . . . . . . . . . . . . . . . . . . . . . . . . . . . . . . . . . . . . . 12
time-Domain Method . . . . . . . . . . . . . . . . . . . . . . . . . . . 12 Frequency-Domain Method . . . . . . . . . . . . . . . . . . . . . . . 13
................................... IP Equipment 17
. . . . . . . . . . . . . . . . . . . . . . . . . . . . . . . F-POTENTIAL METHOD 22
Introduction . . . . . . . . . . . . . . . . . . . . . . . . . . . . . . . . . . . . 22 Field Work . . . . . . . . . . . . . . . . . . . . . . . . . . . . . . . . . . . . 23 Instruments and Equipment . . . . . . . . . . . . . . . . . . . . . . . . . . . 25
Electrodes . . . . . . . . . . . . . . . . . . . . . . . . . . . . . . . . . . 25 Potentiometer ................................ 25 Cable . . . . . . . . . . . . . . . . . . . . . . . . . . . . . . . . . . . . . 26
RESISTIVITY METHOD ................................... 27
Introduction .................................... 27 Field Work .................................... 29 Resistivify Equipmnf .............................. 33
GNETIC METHODS ................................. 34
Introduction . . . . . . . . . . . . . . . . . . . . . . . . . . . . . . . . . . . . 34 Field Work .................................... 36 Ah..- tic Equipment .............................. 43
TABLE OF CONTENTS (Cm't.)
!?!E
ELECTROMAGNETIC METHODS ............................ 46
.................................... Introduction 46 ................................... Field Methods 49 EM Equipment a d Consulting Robs ..................... 52
GRAVITY METHODS ................................... 53
introduction .................................... 53 Field Work ..................................... 55 Gravfty Instrumnk ............................... 56
RADIOMETRIC METHODS ................................ 58
.n..uct..n.................................... 58 Field Rocedum .................................. 59 Equipmnt ..................................... 59
SEISMIC METHOD ..................................... 61
Introduction .................................... 61 Fieldwork ..................................... 62
................................ Seismic Equipment 65
AIRBORNE GEOPHYSICS ................................ 67
Applications and Types ............................. 67 Magnetic Methods ................................ 67 E lectr~magnetic Methods ............................ 68 Radioactive Methods .............................. 69 CombinsdMethods ................................ 69
REFERENCES ......................................... 72
... APPENDIX I: Manufacturers and b i s t r i b u h of Geophysical Equipmnt 74
APPENDIX II: Terms and General Application ................... 77
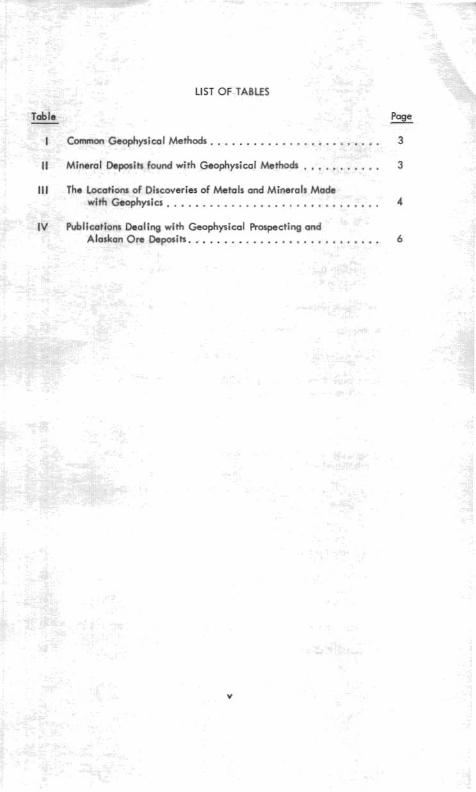
LIST OF TABLES
Tabl - I
e Page - - .... . . . . . . . . . . . . . . . . . . . Common Geophysical Methods. 3
. . . . . . . . . . . II Mineral Depo~ik found with Geophysical Methods 3
Ill The Locations of Discoveries of Metals and Minerals Mode . . . . . . . . . . . . . . . . . . . . . . . . . . . . . with Geophysics. 4
Publications b a l i n g with Geophysical Prospecting and . . . . . . . . . . . . . . . . . . . . . . . . . . Alaskan Ore Deposib. 6
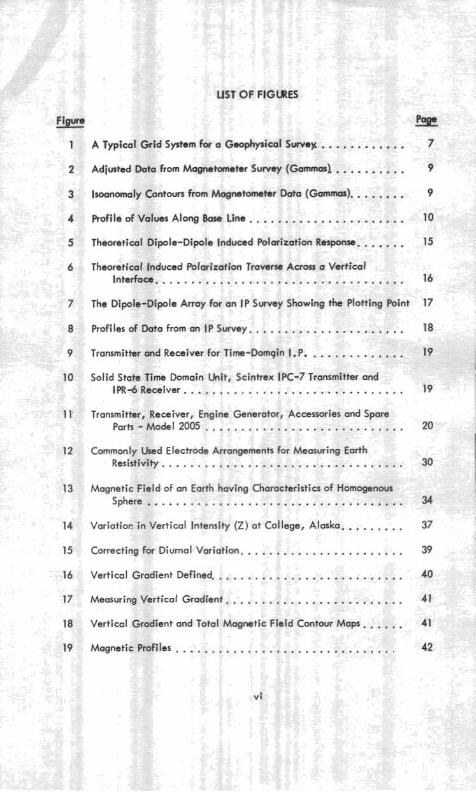
UST OF FlGUIES
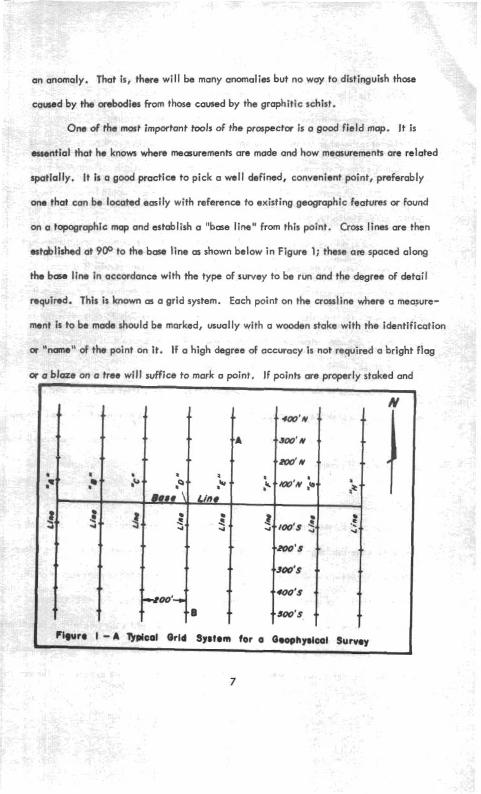
Figure . EE ............ 1 A Typical Grid System for a Geophysical S-)r 7
.......... 2 Adjmtod Data from Magnetometer Surwy ( G a m ) 9
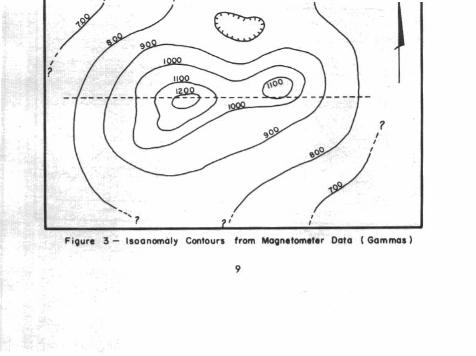
3 Imanomaly Contwrr from Magnetometer Data (Gammas) ........ 9
4 Profile of Values Along Base Line ...................... 10
5 Theoretical Dipole-Dipole Induced hlarization Responw ....... 15
6 Theoretfcal Induced Polarization traverse Acrou a Vertical Interface ................................... 16
7 The Dipole-Dipole Array for an IP Survey Showing the Plotting Point 17
8 Profiles of Data from on I P Survey ....................... 18
. ............ 9 Transmitter and Receiver for Time-Domgin I.P. 19
10 Solid State Time Domain Unit. Scintrex IPC-7 Transmitter and IPR-6Receiver . . . . . . . . . . . . . . . . . . . . . . . . . . . . . . . 19
11 Transmitter. Receiver. Engine Generator. Accessories and Spare ............................ Parts . Model 2005 20
12 Commonly UKd Electrode Arrangements for Measuring Earth Resistivity .................................. 30
13 Magnetic Field of an Earth having Chameteristics of Homogenous . . . . . . . . . . . . . . . . . . . . . . . . . . . . . . . . . . . . Sphere 34
14 Variatior: in Vertical Intensity (Z) at College. Alaska. . . . . . . a . 37
15 Correcting for Diurnal Variation . . . . . . . . . . . . . . . . . . . . . . . 39
16 Vertical Gradient Defined ........................... 40
......................... 17 Measuring vertical Gradient 41
18 Vertical Gradient and Total Magnetic Field Contour Maps . . . . . a 41
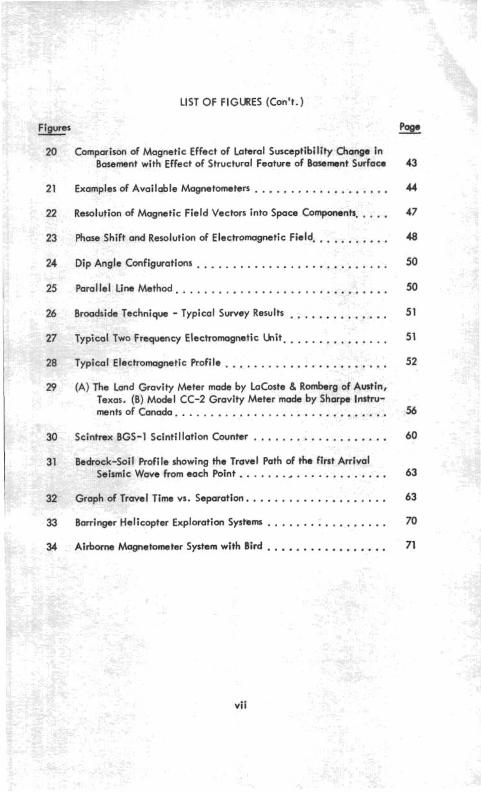
LIST OF FIGURES (Con't.)
Fig . *, n r... . LU ~ u ~ r ~ ~ d r i s o n of Magnetic Effect of Lateral Susceptibility Change in
Basement with Effect of Structural Feature of Bosetmnt Surface 43
21 Examples of Available Magnetometers ................... 44
22 Resolution of Magnetic Field Vectors into Space Components . . . . . 47
23 Phase Shift and Resolution of Eleck~rncl~netic ~ i e l d . .......... 48
24 Dip Angle Configuratims ........................... 50
26 Broadside Technique . Typical Survey Results + . . . . . . . . . .a .q 51
11 Two Frequency Electromagnetic b i t . . . . . . . . . . . .a* . 51
ZM ~yprcal Electromagnetic Profile ....................... 52
29 (A) The Land Gravity Meter mads by LaCoste & Rombrg of Austin. Texas . (0) Model CC-2 Gravity Meter made by Shorpe Instru- ments of Canada . . . . . . . . . . . . . . . . . . . . . . . . . . . . . . 56
0 Scintrex BGS-1 Scintillation Counter ................... 60
1 Bedror 51
2 Graph
:k-Soil Profile showing the Travel Path of tho first Arrival sismic Wave from each Point ..................... 63
. .................... of Travel T i m vs Separation 63
33 Barringer Helicopter Exploration Sysmms ................. 70
34 Airborne Magnetometer System with Bird ................. 71
INTRODUCTION
such a
few.
amoun
rlt. The su
.-..A --.I .-
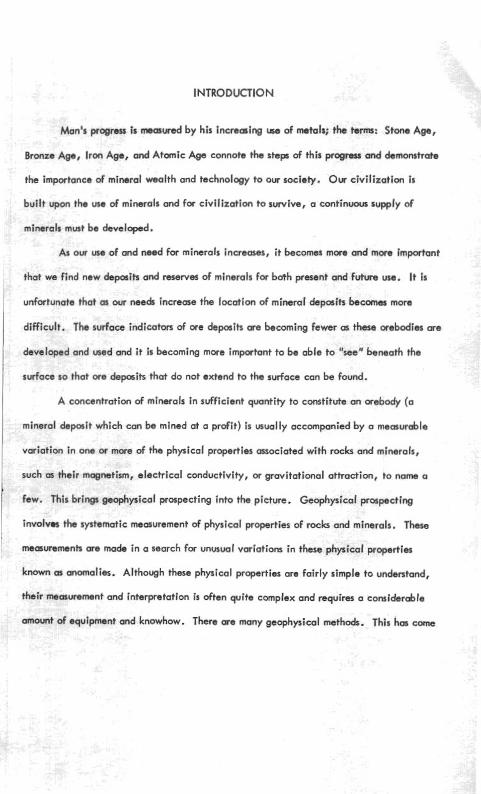
Man's progress b measured by his increming use of metals; the term: Stone Age,
Bronze Age, Iron Age, and Atomic Age connote the step of this progresa and demonstrate
the importance of mineral wealth and technology to our society. Our civilization i s
built upon the use of minerals and for civilization to survive, a continuous upp ply of
11s must be developed.
A$ our use of and need for minerals increctses, i t becomas more and mom important
that we find new deposits and reseww of minerals for both present and future me. It i s
unfortunate that as our needs increase the location of mineral Lposih becomes more
difficr dace indicators of we depaits ore becoming fewer CIS these orebodies are
develwu =ed and i t is becoming more important to be able to "see" beneath the
surface so that ore deposits that do not extend to the surface can be found.
A concentration of minerals in sufficient quantity to constitute an webody (a
mineral deposit which can be mined at a profit) i s usually accompanied by a meo~urclble
variation in one or more of the phyical properties associated with rocks and minerals,
lecfrical conductivity, or gravitational attraction, to name a
eal prospecting into the picture. Geophysical prospecting
involves the systematic measurement of physical properties of rocks and mfnerals. These
measuremenk me made in a search for unusual variations in these physical properties
known as anomalies. Although these physical properties are fairly simple to understand,
their measurement and interpretation i s often quite complex and requires a comiderable
t of equipment and knowhow. There are many geophysical methods. This has come
s their mag
This br ing
about from necessity rather than ca a matter of choice, sin- unfortunahly, no one geo-
physical method can find a l l ws cbpc6ik.
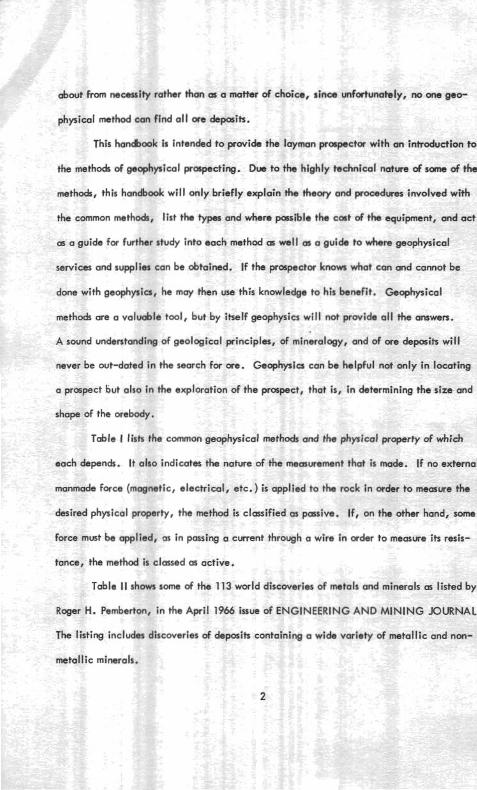
This handbook 1s intended to prwide the layman prorpector with an introduction to
the methods of geophysical prospecting. Due to the highly technical nature of some of the
methods, this handbook wi l l only briefly explain the theory and prowdures involved with
the common methods, list the types and where pcssible the c-t of the equipment, and act
as a guide for further study into each method 5 wall 5 a g u i l to where geophysical
services and suwlies can be obtoined. I f the prospector know what can and cannot be
done with geophpics, he may then use this knowledge to his benefit. Geophysical
methods are a valuable tool, but by itself geophysics wi l l not prwide al l the answers.
A sound understanding of geological principles, of mineralcrgy, and of ore deposits wi l l
never be out-dated in the search for ore. Geophysic~ can be helpful not only in locating I
a prospect but also in the exploration of the prospect, that is, in determining the size and
shape of the orebody.
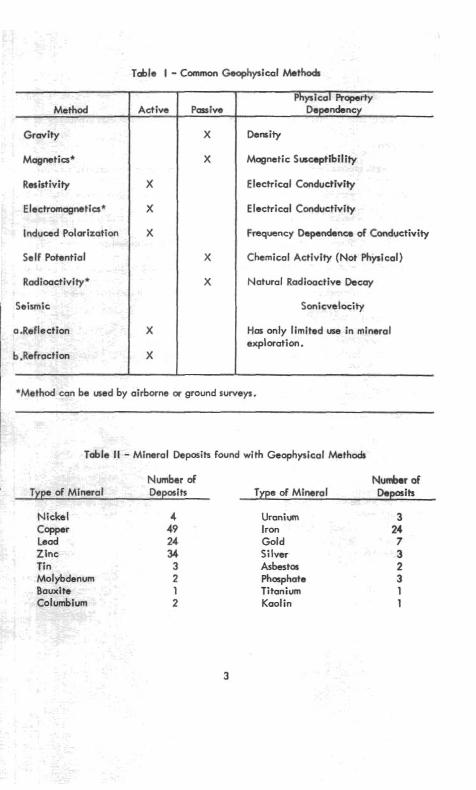
Table I lists the common geophysical methods and the property of which
each depends. I t also indicates the nature of the measurement that is made. I f no externa
manmade force (magnetic, electrical, etc.) i s applied to tha rock in order te mecrrwe the ,
desired physical property, the method i s classified as pasive. If, on the other hand, some
force must be applied, as in pmsing a current through a wire in order to measure its resis- 1
tance, the method i s classed as active,
Table II show some of the 113 world discweries of metals and minerals as listed by
Roger H. Pemberton, in the April 1966 issue of ENGINEERING AND MINING JOURNAL
The listing includes discoveries of deposits containing a wide vclriefy of metallic and non-
metallic minerals.
Tsble I - Common Geophysical Moth&
d can be us ed by airborne or ground surveys.
Method
Gravity
Magnoti-'
Rmistivity
magnetics*
~d Polarization
Self Potential
Radioc~ctivity*
Seismic
a.Reflection
b .Refracb:--
! fable II - Mineral Deposits found with Geophysical Methods
Pasive
X
X
X
X
Active
X
X
X
X
X
Nickel Copper Lead Zinc Tin Molybdenum Bauxite Columbium
Physical Ploparty Depn&ncy
Demity
Mqnetic Saceptibility
Electrical Conductivity
Electrical Conductivity
Frequency Dependence of Conductivity
Chemical Activity (Not Physical)
Natural Radioactive Decay
Sonicvelocity
Hm only limited me in mineral explwotion.
Number of Number of I Deposits Type of Mineral Depaaih
Uranium Iron Gold Silver Asbestos Phaphats Titanium Kaolin
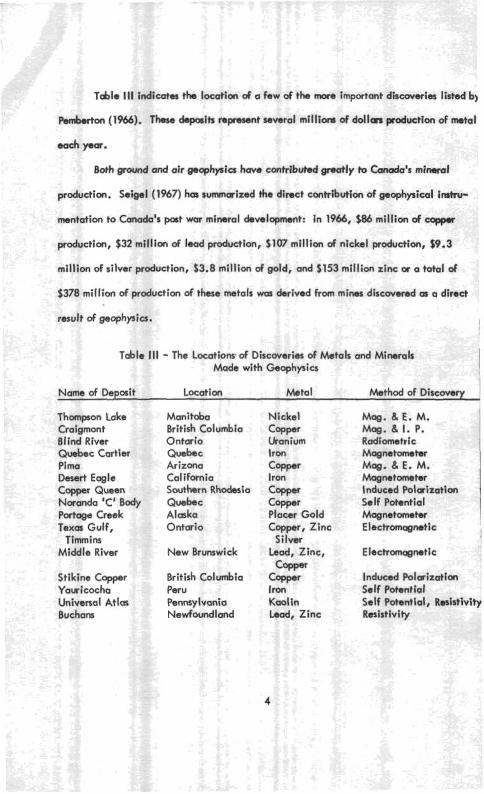
T d l e Ill i n d i e m tb location of a few of the more important discwerles listed b)
h b w t o n (1966). T h deposits represent several m i l l i m of do l lm pmduction of m t a l
wch par.
Both grovnd and air gecphyricr have contributed grwtly to Conoda's mineral
production. Seigel (1967) h a summmitd the direct contribution of geophysical imtru-
mentation to Canada's pott war mineral development: in 1966, $86 million of cappar
$32 million of lead production, $107 million of nickel production, $9.3
million of silver production, $3.8 million of gold, and $153 million zinc a a total of
$378 million of production of these metals wm &rlved from mines discovered as a direct
result Df geoph~ics.
Table 111 - The Locations of Discoveries of Metals and Minerals Made with Geophyiu
Name of Depwit
Thompson Lake Cmigmont Blind River Quebec Cattier Pima Desert Eagle Copper Queen Noranda 'C' Body Portage Creek Texas Gulf,
Timmins Middle River
Stikino Copper Yauricocha Universal Atlon Buchans
Manikoba British Columbia Ontario Quebec Arizona California Southern Rhodesia Quebec Alaska Ontario
New Brunswick
British Columbfa Peru Pennsylvania Newfoundland
Metal Method of Discovery
Nickel Mog. & E. M. C ~ P P ~ Mog. & I. P. Uranium Radiometric Iton Magnetometer
C ~ P P ~ Mag. B E. M. Iron Magnetometer
CTPtr Induced Polarization C ~ P P ~ Self Potential Placer Gold Magnetometer Ceppr, Zinc Electromognstic
Silver Lead, Zinc, Electromagnetic
Coppm I
CTP~ Induced Polarization Iron Self Potontial Kaolin Self PotentIol, Resistivity Lead, Zinc Rstistivity
Field Work
Before any geophysical surveying is undertaken, the prospector should collect all
the information avail&le about the area he intenck to explwe. Thls includes topo-
of Mi
and c
graphical, mineralogical, and geological information. Literature which m y help him
ere the publications of the United States Geological Survey, the United Stotea Bureau
ines, the Alaska Division of Mines and Minerals, the Geolqicol Society of America,
~rticles listed i n the Annotated Bibliography of Economic Geology. Table IV on the
following page l l s k some specific publications dealing with Alaskan we deposits and geo-
physical prapecting. This list is by no means complete, but it can wrve Q a guide. Them
nation available covering almost al l pmts of Alaska, and a is a grs
person
at quantify
can waste t
-. .
of infwr
ime and I money by ignoring what h a been done by others.
The literature often indicates which of the gecphysical moth& is most likely to
produce successful results i n a particular area w in a particula geologic setting. I t
should be remembered that a good guide to we i s ore, that is, I t is roasonoble to search
for an c sn m a where other orebodiw have already been discovered or in areas
where s ~eologic co
In areas of
nditions me similar to area of known ore d e p f k .
I d topography mosrgeophysical msthoda become very difficult
to run, and the interpretation of the resulk will be uncertain due to the effact that
1 vertical relief has upon the survey measurements. Under them condltionr the value of
geophysical prospecting may be doubtful. Occastonally geological conditions wi l l work
ogainst the me of the methadr; For instance, an area which contalm a l o w
amount of graphitic schist not uzsocioted with arcl wtll produea anomalim by m o t h which
mawe conductivlty. Them may be we d e p i k i n the area, but their presence would be
..masked" by the anomalous readings of tho schist even though the om might also produm
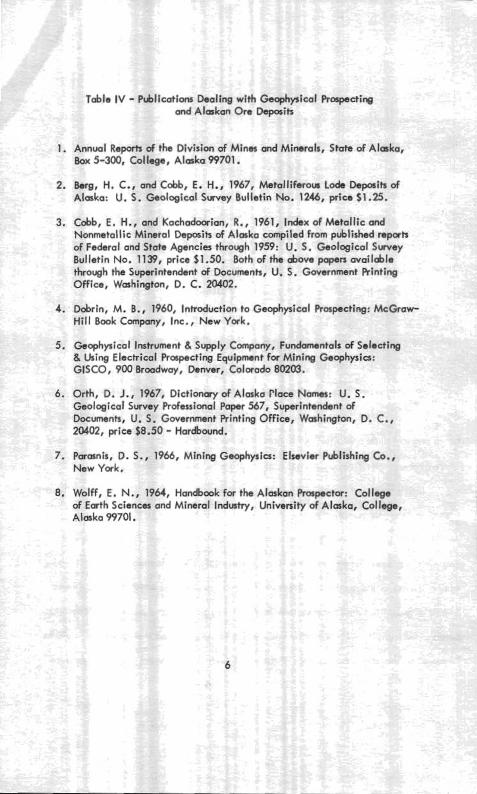
Table IV - Publfcotiom Dealing with Geophysical R a p c l i n g and Alaskan Ore Deposits
1. Annual Reports of the Division of Mines and Minerals, State of Alaska, Box 5-30, College, Almka 99701.
2. Berg, H. C., and Cobb, E. H., 1967, Metalliferow Lads Depoaik of Alaska: U. S. Cbological Survey Bulletin No. 1246, price $1 -25.
3. Cobb, E. H., and Kachadmian, R., 1961, Index of Metallic and Nonmetallic Mineral Dsposih of A1 a k a compiled from published repark of Federal and State Agencies throgh 1959: U. S. Gaological Survey Bulletin No. 1139, price $1.50. Both of the above papen crvailable through the Superintendent of Documents, U. S. Government Binting Office, Wo~hington, D. C. 20402.
4. Dobrtn, M. B., 1960, Introduction to Geophysical Prospecting: McGraw- Hill Book Company, Inc., New Ywk.
5. Geophysical Instrument 8 Supply Company, Fundamentals of Selecting 8 Using Electrical Prospecting Equipment for Mining Geophysics: GISCO, 900 Brwdway, Denver, Colwado 80203.
6. Orth, D. J. , 1967, Dictionary of Alaska Place Names: U. S. Eeolagical Survey Professional Paper 567, Superintendent of Documents, U. S. Government Printing Office, Washington, D. C., 20402, price $8.50 - Hardbwnd.
7. Paranis, D. S., 1966, Mining Geophysic~: Elsevier Publishing Co., New Ywk.
8. Wolff, E. N., 1964, Handbook for the Alaskan Prospectar: College of Earth Sciences and Mineral Indmtry, University of Alaska, College, Alaska 99701.
ease
spat
---
men
Ol "
good fie
an anamaly. That is, there wi l l be many anomalies but no we~y to distinguish those
cawed by the orebodiw from those caused by the graphitic schist.
One of the most important tools af the prwpctrx is a Id map, I t i s
nricll that he know where measurements are made and how measurements are related
tally. I t is a good practice to pick a well defined, convenient point, pmferably
that con be located easily with reference to existing geographic features or found
on o topographic map and establish a "bme line" from this point. Cross lines are then
ast&lished at 90° to the b m line as shown below i n Figure 1; these am spaced along I
8 tree wi l l suffice to mark a point. I f points ore properly staked and
I the bow line in accordance with the t y p of survey to be run and the degree of detail
reauimd. This is known os a grid system. Each point on the crossline where a rneasure-
ado should be marked, usually with a wooden stake with the identification
,,,.., ,. ..la point on it. I f a high degree of accuracy i s not required a bright flag
identified, field work wi l l be ecrrier and mistakea will be fewer.
I f a large m a 1s to b cwered, i t mcry be convenient to l&ntify points by
coordinates rcrther than by tb systam shown in F l g m 1. With cowdinatas al l pointr
me identified by their pasition or disfanw from the point of origin. Point A of F i g m 1
which is 300 feet north and 800 feet emt of the point of origin would be designated:
3WN, 800E; slmf lmly, point B would be 5005, 6OOE.
Thew is no necessity to establish the bare lirm in an emt-t or a north-wth
direction, In fact, many geophpical methods wi l l give the bast results if the crorr linea
along whlch measurements me to be made intersect the trend or strike of t h deposit Gt
approximcttely right angles. This, of course, may not be possible to dotermins but in
many instances some evidenw of structural trends wil l b qpment in an ama or the
trend of other, nearby deposits may act ca a guide.
Regardless of the identificafion method used, survey lines should be laid out with
a much care m possible. Ahheugh i t is not nscessary to usa a transit (a brunton compms
survey i s usually sufficient), memurements should be m& carefully and lines established
6 accurately a pwsible.
Geophysical Maps 1 Once field meosummonts have bean made, the data must be compiled in such a
way as to make the large number of readings and obssrvations meaningful. Data, after 1
necessary corrections and computations h've been maderare plotted an a map at points
corresponding to the location at which measurements were made. Fw making mp,
ruled gtaph-papr i s a very convenient medium especially when working with a coordinate
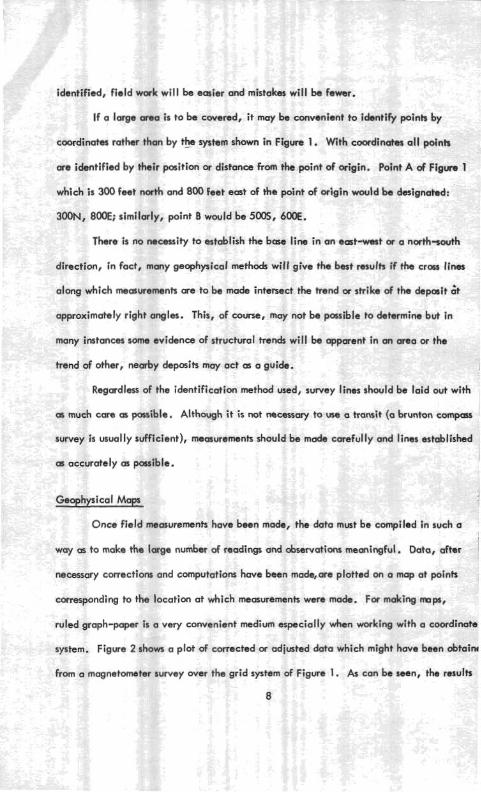
system. Figure 2 shew a lot of comctsd or adjusted data which might have been obtalnr
from a magnetometer survey over the grid sptern of Figure 1. As can be seen, the results
8
Figure
I
7' I
3 - lsoanomaly Contours from Mopnetmeter Data ( Gommos )
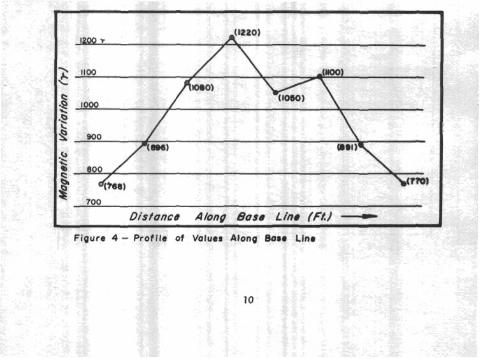
Figure 4 - Prof lle of Valuer Along Bas. Llnr
*
Disfoncs Along Base Line f F k ) - r I
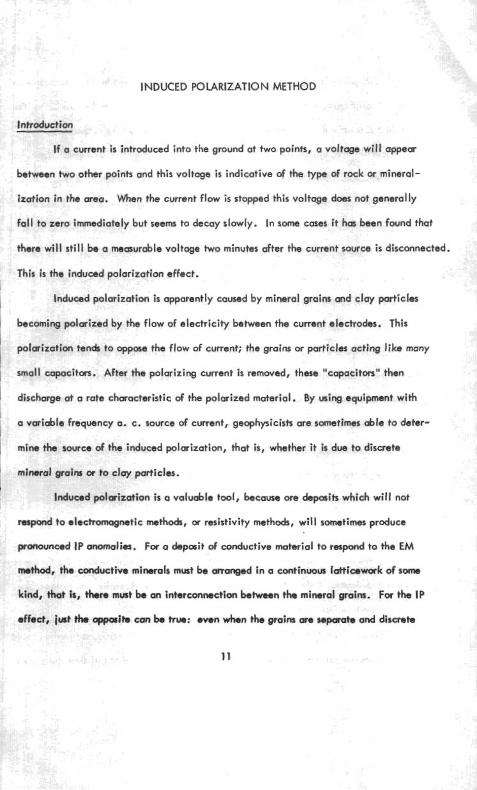
INDUCED POLARIZATION METHOD
fall to ;
there w
small CI
* If a current is introduced Into the ground at two points, a voltage wi l l appear
between two other points and this voltage i s indicative of the type of rock or mineral-
ization in the area. When the current flow is stopped this voltage docs not generally
rero immediately but seems to decay slowly. In some eases i t has been found that
ill still be a measurable voltage two minutes after the current source is disconnected.
this is the induced polarization effect.
Induced polarization is apparently caused by mineral grains and clay particles
becomi~ d by the flow of electricity between the current electrodes. This
polarixat~on rencrr to oppose the flow of current; the gmins or particles acting like many
upacitors. After the polarizing current i s removed, these "capacitors" then
discharge ot a rats chmactsristic of the polarized material. By using equipment with
a varioble frequency a. c. source of current, geophysicists are sometimes able to deter-
mine the source of the induced polarization, that is, whether i t is due to discrete
mineral
mthod
kind, t
effect,
wticles.
In is a valuablo tool, because ore &paits which wi l l not
respond to elochurmognotic nmthods, w resistivity methocb, wi l l sometimes produce
pronoun& I P anomalim. Fw o depcsit of conductive material to respond to the EM
, the conductive minerals must k arranged i n a continuous latticework of some
hat is, them must k an interconnection batumn the mineral groins. Far the I P
w i t s can be trw: even when the gmins arm separah and discrete
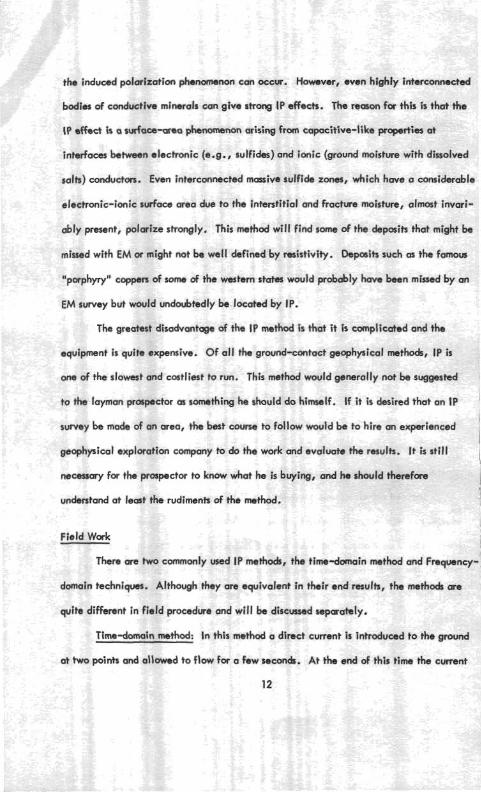
the indumd phenomenon can occur. However, even highly interconnected
bodies of conductive mimrals can give strorlg IP affects. The mason for this is that the
\P effect is a surface-aw phenomenon arising from capacitive-like preporties at
interfaces beween electronic (0.8.~ sulfides) and ionic (ground moisture with dissolved
$alh) conductors. Even interconnected morsive sulfide zones, which have a considerable
electronic-ionic surfaw area due to the interstitial and fracture moisture, almost invari-
ably present, polarize strongly. This method will find soma of the deposits that might be
missed with EM rn might not be well &fined by resistivity. bpclsih such os the famous
"pwphy$ coppen of mmo of tho western states would probdly b o been mined by an
EM survey but would undoubtedly be located by IP.
The greatest disadvantage of the 1P method is that i t is complicated and the
equipment i s quik sxpemive. Of all the ground-ccmtact geophysical methods, IP h
one of the slowust and costliest to run. Thb method would gsnerolly not be suggestad
to the layman prospector 0 something he should do himrrlf. If i t L desired that an I P
survey be made of an orw, the best course to follow would b to hire an experienced
geophysical exploration company to do the work and evaluate the results. I t i s still I nscesaary for the prospector to know what he is buying, and he should therefore I undsrstand at least the rudiments of the r~ thod. 1
Field Work I
Them ure two cclmrnonly med IP methods, the timedomain method and Frequency-
domain techniqtms. Although they am equivalent in their end results, the methodr ore
quite different in field procedwa and will k discussed sepcrately.
Time-domain method: In this method a direct current i s introduced to the ground
at )WD points and allowed to flow for a faw seconds. At t h end of this time the current
12
shut ott and me induced voltage between two other points i s observed for several
a recorded measurement i s usually the amount of voltage remaining after
s-rlYlrl liVlnber of seconds divided by the voltage at the instant the current was shut
off. This is necessary since the tote1 induced voltage wi l l not be the same for each set
of points and therefore to be able to compare readings a relative difference must be
found. Several sets of measurements are taken and weraged at each station while
reversing the direction of the current flow to minimize adverse SP drift and polarization
"P orally speaking, the voltage at the time the current i s stopped
- netnay" eff
r the tlh-1
.. . .
i l l d e c m ~ e
bets. Gen
w-lk --A i s ,,,-w,,,, .,, .,,,. ,,,, the decoy voltage i s measured in millivolts. Therefore, readings
domain method are recorded in millivolts per volt (mVh/). I f both the
itial and residual v o l t a g ~ are recorded in mV the division i s made, multiplied by
100 and referred to as percent IP. Although any of the electrode arrays discussed with
the msistivlty method can be used for these measurements, the Wenner and Dipale-
Dipole arrays are mwt frequently used, however, the three array or pole- dipole array
has proved m a t useful in certain instances.
in method: I t has boon found that the resistivity of some rock ancy -doma
when the I hqmncy of an a.c. current, i t i s apparent that en I P effect
exisk. Om measure of this IP ir known as the percent frequency effect (PFE). The
resistivity of the rock is marumd at two different frequencies, for example, usually
0.1 and 10 cycles per second, and the percent frequency effect is:
where: '0.1 = rsridivity @ 0.1 cps
10 resistivity @ 10 cps
Another masum of I P with the freqwncydomain method is known m metal fact-
(M.F.) and, in eswnco, the percent frequency effect divided by the low frequency
resistivity, Since this n m k r is very small, t h M.F ., by definition, includes this
value multiplied by 2000lt. Metal factor is therefore:
M.F. = [ % . I - 501 2Wfl = 2 W W (WE)
Po.1 ( P1O Po. 1
Resistivities ore expressed i n ohm-feet w ohmmeten, depending upon the units mod
to measure the electrode spacing, and since M.F. calculations produce values of
l/ohrn-ft., the M.F. is really a measure of the change in the inverse of resistivity,
namely, electrical conductivity.
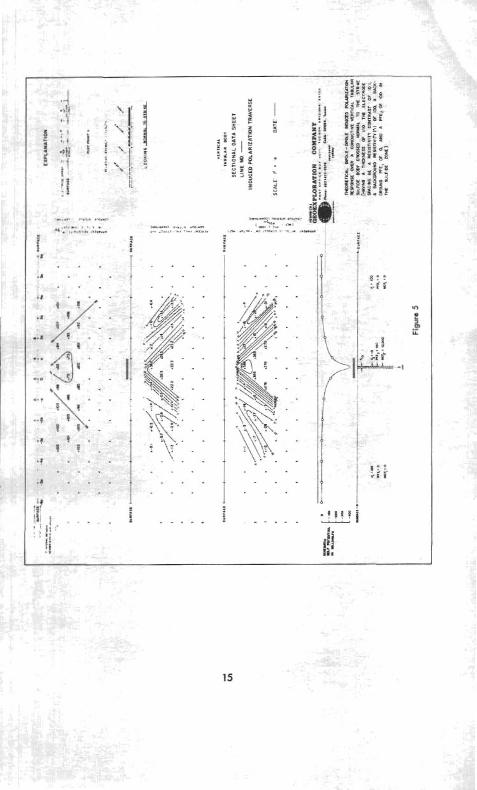
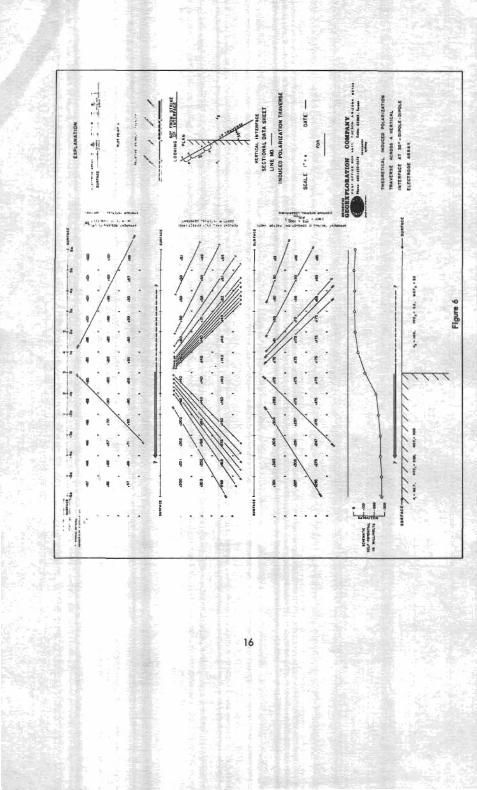
Whether from time-domain or frequencydunain memvroments, IP valws are
usually plotted rrs profiles along the lines surveyed. Figures 5 and 6 courtesy of
Heinrichs Geaexplorotion Company are excellent examples of theoretical profiles.
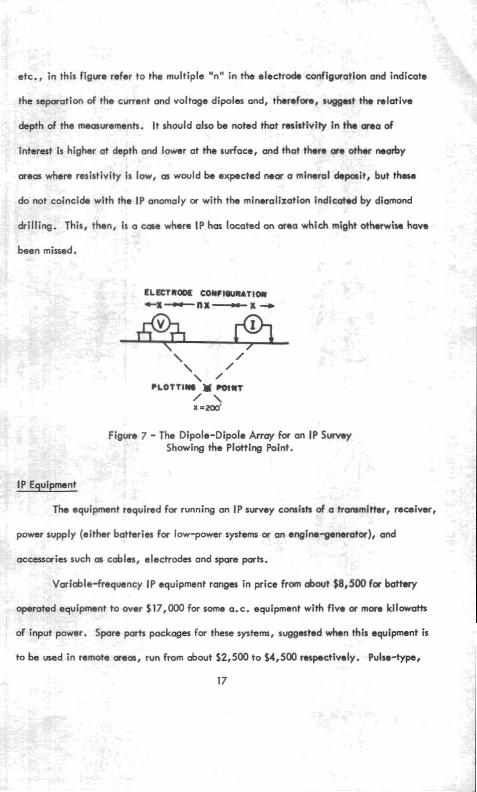
The dipole-dipole electrode array is usually used for freqwncy-domain
measurements. With this array the resistivity, percent frequency effects and m t a l
factor values produced are ossigned to a point midway between the electrodes as shown
in Figure 7 and down from each dipole midpoint at an angle of 45O from the horizontal.
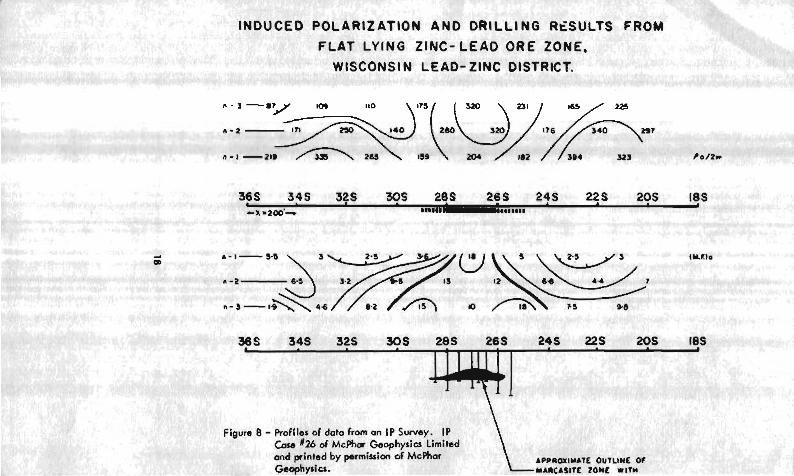
Values of I P and resistivity are then found for various depths and locations in the area
of interest by varying the distance "nx" between the dipoles of the array and by moving
the entire array laterally along the survey line. Profiles similar to that shown in
Figure 8 are produced. In this figure both profiles am of the same area, tho tap
i s the resistivity data, the bottom that of the M.F. data. PFE i s not shewn
in this particular example but is often displayed similarly. The numbers n = 1, n = 2,
etc., in this figure refer to the multiple "nu in the electrode configuration and indicate
the seoaration of the current and voltoge dipoles and, themfore, suggest the mlotive
f the measurements. I t should also be noted that resistivity in the area of
I ~ I I ~ C * ~ i s higher at depth and lower at the surface, and that them ore other nearby
areas where resistivity i s low, as would be expected near a mineral depeit, but tha r
w.4 ,,"#
drilling
haan m
A- --+ coincide with the IP anomaly or with the minoralization indicated by diamond
1. This, then, i s a cana where I P has located an area which might otherwise have
. ... issed.
Figure 7 - The Dipole-Dipole Array for an IP Survey Showing the Plotting Point.
The equipment required for running an IP survey corrsish of a trammltter, receiver,
power supply (either batteries fw low-powr systems or an engine-generator), and
lries such m cables, electrodes and spars parh.
Variable-frequency IP equipment ranges in price from about $8,500 for b a t w
operated equipment to over $17,000 for some a.c. equipment with five or more kilowarn
of input power. Spare parts packages for these system, suggested when this equipment is
to be used in remote areas, run from about $2,500 to $4,500 mspoctivsly. Pulse-typ,
17
INOUCED POLARIZATION AND DRILLING RCSULTS FROM
FLAT LYING ZINC- L E A D ORE ZONE. WISCONSIN LEAD- ZINC DISTRICT.
Figurn 8 - W i l e s of data from an IP Survsy. I ? Case 126 of M c h r Geophysics Limited and printed by parmission of McPhar APPROI IMATE OUTLINE OF Geophysics. Y A R C ~ S L T E 20ME W ~ T W
time-domain equipment cwk slightly less, varying in price from 68,MH) to about $13,000,
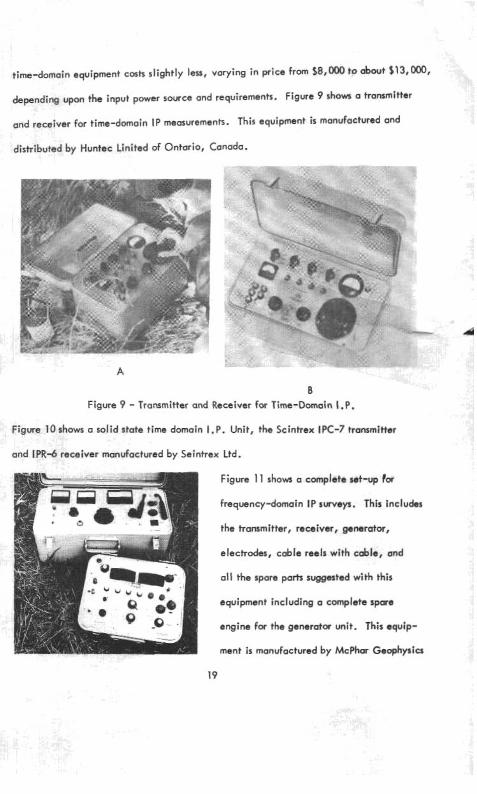
depending upon the input power source and requirements. Figure 9 rho- a transmitter
and receiver for time-domain IP measurements. This equipment i s manufactured and
distributed by Huntec Linited of Ontario, Canada.
A
B Figure 9 - Transmitter and Receiver for f ime-Domain I .P.
Figure 10 show a solid state time domain I.P. Unit, the Scintrex IPC-7 transmitter
and IPR-6 receiver manufactured by Seintrex Ltd.
Figure 1 1 show a complete set-up for
frequency-domain IP surveys. This inclubs
the transmitter, receiver, generator,
electrodes, cable reels with cable, and
all the spars pa* suggested with this
equipment including a complete $pad
engine for the generator unit. This equip-
ment i s manufactured by McPhm Goophpics
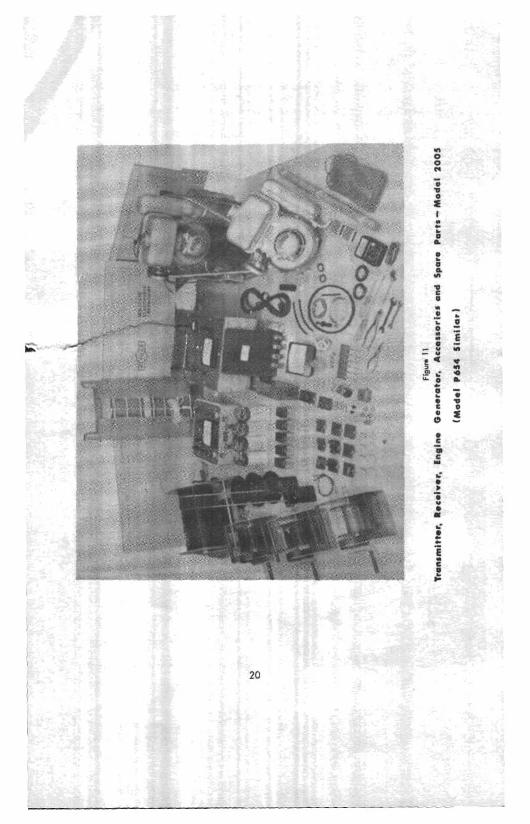
Limited of Ontario, Canada.
Manufactwen d distributors of IP equipment we Ibted in Appendix I.
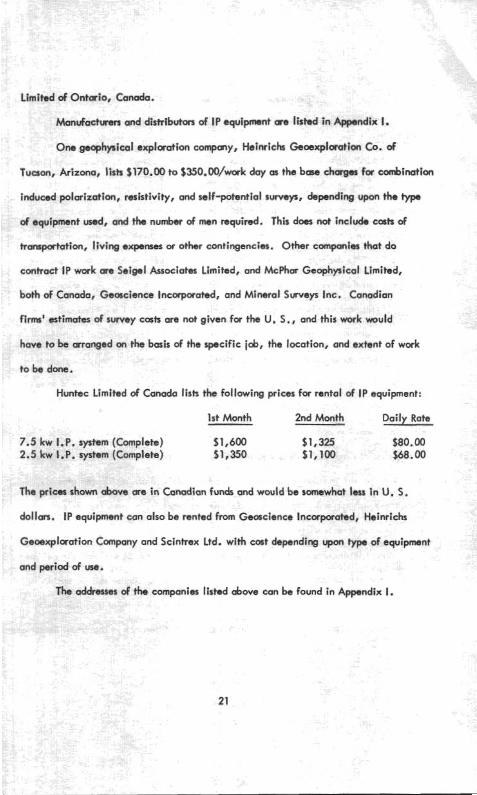
One g q h p i c a l exploration compmy, Heinrich Gemxploration Co. of
Tucson, Arizona, lists $170.00 to $350.00/work day m the b m chargms for combinatton
induced polafzblon, reristivlty, and self-potential sump, depnding upon the type
of equi
h-po
pmnt wed, and the number of men m q u i d . This doas not ineludo cmk of
rtatlon, living expenses or other contingencias. Other cmpaniw that do
contract IP wwk am Solgel Associates Limited, a d MePhm Goophyslcal Limited,
both of Canada, Gscscience Incapwufed, and Mineral Srrrveys Inc. Canadian
1 f I rmL estimates of survey costs are not given for the U. S., and this work w u l d
have to be arranged on the basis of the specific job, the locotion, and extent of work
~ Huntec Limited of Canada lists the following prices for rental of IP equipment:
1st Month 2nd Month Daily Rate
1 7.5 kw I.P. v t e m (~ompleh) $1,600 $1,325 $80.00 I 2.5 kw I .P. system (Complete) f 1,350 $1,100 $68.00
The prt n Canadian funds and w w l d be somewhat less i n U. S.
dollan. IP equipment can also be rented from Geoscience Incwporated, Heinrlehs
Geoexplaration Company and Scintrex Ltd. with cost depnding upan type of equipment
and per .id of use.
The addressas of the companies Ibtsd &wo can be found in Appendix I.
SELF-POTENTIAL METHOD
Introduction
The -If-potential method is one of the simplwt, emfast to psrfwm, grid Iemt
expensive of the geophysical math&. Due to this e m and simplicity of operation,
i t is highly mcmmnded to the prospector searching for sulfide mineralization, but
i t must be remembered that this method, like al l other geophysical methods, wi l l not
locate al l sulfide deposits. Instrumentation is neither expensive nor complicated, and
qualitative evaluation of results i s not difficult.
I f two non-Polarizing electrdos am but in contact with the ground and con-
nected to a semitive vo(tmeter, a small difference i n electrical potential (voltage)
will usually be observed to exist between them. These voltages normally range from
a few to a few tens of millivolts. (1 volt = 1m millivolts). In the vicinity of some
sulfide bodies, notably these containing pyrite, chalcopyrite, and pyrrhotite, voltage
differences may run os high hundreds of millivolts to a volt or moss. The difference
in potential at two locationsis due to the difference in chemical activity in the ground.
These voltqes are in essence caused by natwal wet-cell "battaries" in the ground.
Since th-e voltages are naturally-occuring, self-potentials are sometimes referred
to as spontaneom-potentials, and the method i s usually called, simply, SP.
There is no universal egreement ce to the source of self-potentials. One of the
most commonly accepted explanations f a this phenomenon attributes self-potentials to
tho difference in the rate of oxidation betvmen the top cmd bottom of a sulfide body,
thus creating an electrochemical cell and a subsequent difference i n electrical potential.
Whatever the cam, self-potentials have proven to k simple g u i h to ore.
elf-potential method wi l l indicate a deposit only when that body i s under-
ion and when other conditiom are favorable. I t wi l l not work i f the
surface material is a bad electrical conductor and may not give satisfactory results
in frozen ground or permafrost.
The SP method is a qualitative method, that is, i t wi l l only indicate the presence
of a sulfide body and sometimes give an indication of its sire. Other important factors,
such os the depth of burial, must be determined by some other means.
There
rrveys. Bat
Field Work
9 are twa field methods which are commonly emplayed for running SP
,h of them methods involve the measurement of the natural potential that
exists between two electrodes placed soma distance apart.
the f i n t method produces a series of natural potential readings a1 I relative to
one base station or location. In this method, one electrode is left stationary at the
base location while the other electrode i s moved from station to station generally dong
M line of a
ith i t s sign
I grid system. The magnituds of the potential difference is recorded along
(plus w minus voltage relative to the base station) for each station. As
cable length runs out, or when one line i s completed and another i s to be started, a
new "temporcry bose" i s established; the potential of the new base i s f i n t meorured
relative to the original base so that the potential of al l poink along this line can be
converted to reading relative to the original base. For instance, i f the difference
hstween the bast station and the temporary base is +I50 mV (millivolts), a l l readings,
Ith the fixed electrode at the temporary base, must then be increased by 150 rnV;
these station readings then bear the same relation to the original bare station as i f
23
the fixed electrode held been at the miginal bme. In this manner, the entire area of
interest is covered, the spacing between statiom being determined by the detail desired.
Readings are then plotted on a suitable mcp and iswnomaly curves of equal electrical
potential me drawn w profiles of electrical potential along individual lines are plotted.
By the nature of self-potentials, arem of interest wi l l demonstrate negative
potentials, but from field work this depends upon the location chosen for the base station.
If the bae station were located directly above an oxidizing sulfids deposit, all other
readings would likely have a positive sign. In the SP method m in m a y others, i t i s
advisable to select a base station away from the immediate effect of any suspected
mineralization. A simple method of dettnining the sign,& a reading is or follow:
Most SP meters have pmitive (+) and negative (-) termimls, the sign of each station
reading will be the same a the terminal that the cable from the electrode must be
attached to produce a positive reading on the volt meter.
In the second procedure, both electrodes am moved continually, with a fixed
distance of separation between them, usually 25 to 100 feet depending upon the detall
desired. The electrodes are moved along each survey line i n a leap-frog fushion. I f
the points along a line are desfgnated A, B, C, the first reading i s taken between A
and B, the second between 0 and C, and so on until the entire area h a been covered.
This method produces the gradient of the potential or electric field along the lines I
surveyed. The sign of the gradient i s established in much the some manner as that
described for the fixed electrode method. Data from this type of survey is usually
plotted as a profile.
An examination of the &we decriptiom of the two SP methods wi l l show that
they me equivalent in that gradient values can be derived from fixed bae potenfiials
and vice versa. The chance of finding a weak SP anomaly i s greater with the fixed base
methoc
easier
i because of less adverse drift effects and in general fixed base potential maps are
to interpret.
Inskumenk and Equipment
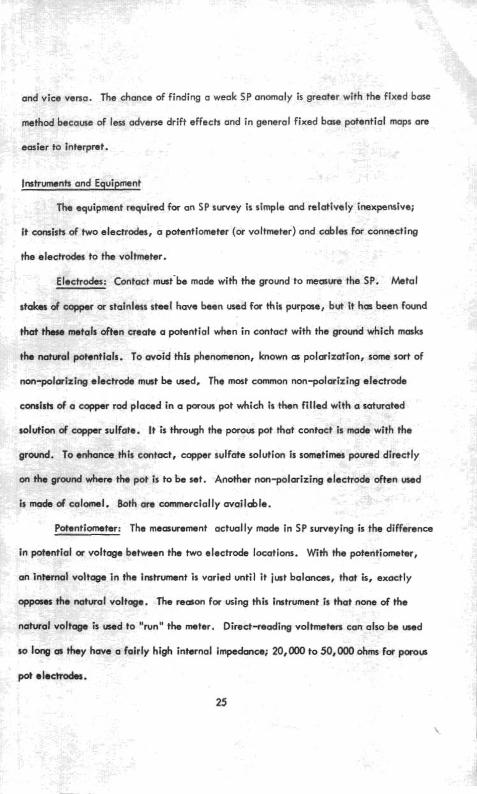
The equipment required for an SP survey is simple and relatively inexpensive;
it comirts of two electredas, a potentiometer (or voltmeter) and cables for connecting
the electrodes to the voltmeter,
Electrodes: Contact mwibe made with the ground to m u r e the SP. Metal
s t o h of c-r w stainless steel have been used for this purpase, but i t hm been found
that th
*L- -A
, ,
me metals t ate a when in contact with the ground which masks
rural pur=tm~~ials. To clvoid this phenomenon, known ar polarization, some sort of
blurizing electrode mat be wed, The mat common non-polarizing electrode
- 1 on the
i s ma&
an i n h
e p F
natural
so l o w
carrists of a cqper red placed i n a porous pot which Is then fi l led with a saturated
solution of ceppcr sulfate. I t is through the porow pot that contact i s made with the
around. To enhance this contact, copper sulfate solution i s sometimes poured directly
ground whe
- .
Iro the pot is to be sot. Another non-polarizing electrode often ussd
1 oF calomel. Both am commercially available.
Potentiometer: The measurement actually mode in SP surveying is the difference
in petential or voltage between the two electrode locations. With the petentiometer,
e i n the instrument is varied until it lust balances, that is, exactly rnal voltog
I the rmtwa 11 voltage. The rewon for using this instrument is that none of the
voltage i s wed to "run" the meter. Direct-reading voltmeters can also be used
or they hove a fairly high internal impedancs 20,000 to 50,000 ohms for porous
pot el.ctr&.
25
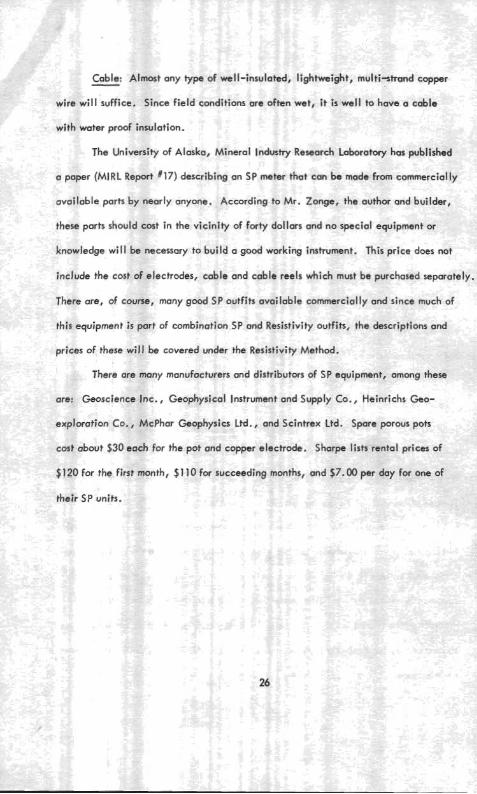
Cable: Almost any type of well-insulated, lightweight, multi-trmd copper - wire wi l l suffice, Since field conditions are often wet, i t i s well to hove a cable
with water proof insulation.
The University of Alaska, Mineral lndushy Research Laboratmy has published
a paper (MIRL Report 617) describing an SP meter that can be made from commercially
available parts by nearly anyone. According to Mr. Zonge, the author and builder,
these parts should cost in the vicinity of forty dollars and no special equipment or
knowledge wi l l be necessary to build a good working instrument. This price does not
include the cost of electrodes, cable and coble reels which must be purchased separately.
There are, of course, many good SP outfits available commercially and since much of
this equipment is part of combination SP ond Resistivity outfits, the descriptions and
prices of these wi l l be covered under the Resistivity Method,
There are many manufacturers and distributors of SP equipment, among these
are: Geescience Inc., Geophysical Instrument and Supply Ce., Heinrichs Geo-
exploration Co., McPhar Geophysics Ltd., and Scintrex Ltd. Spare porous pots
cogt about $30 each for the pot and copper electrode. Sharp lists rental prices of
$120 for the first month, $1 10 for succeeding months, and $7.00 per day for one of
their SP units.
RESISTIVITY METHOD
lntroductton
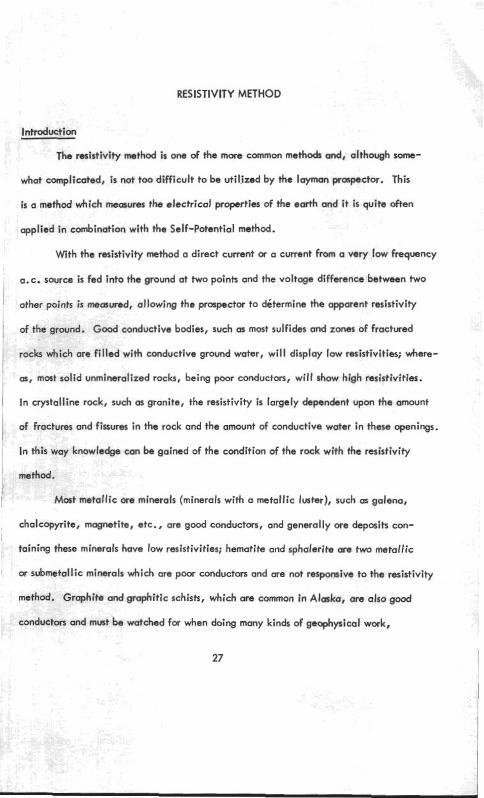
The resistivity method is one of the m m common methods and, although somo-
what complicated, i s not too difficult to be utilized by the layman p r w c t o r . This
is a method which memum the electrical properties of the earth and i t is quite often
applied in combination with the Self-Potential method.
With the resistivity method a direct current or a current from a very low frequency I
a.c. source i s fed into the ground at two points and the voltage difference between two
other points i s measured, allowing the prospector to ditermine the apparent resistivity
of the ! aod conductive bodies, such as most sulfides and zones of fractured
rocks which are t ~ l l e d with conductive ground water, wi l l display low resistivities; where-
a, mat solid unmineralized rocks, being pmr conductors, wi l l show high resistivities.
/ In crystalline rock, such as granite, the resistivity i s largely dependent upon the amount
of fractures and fissures in the rock and the amount of conductive wcrter in these openings.
( In this way knowledge can be gained of the condition of the rock with the resistivity
1, I mmr rr~erallic ore minerals (minerals with a metallic luster), such as galena,
, chalcopyrite, magnetite, etc., are good conductors, and generally ore deposits con- I
taining these minerals have low resistivities; hematite and sphalerite are two metallic
I or submetallic minerals which ore poor conductors and are not responsive to the resistivity
method. Graphlte and graphitic schists, which are common in Alaka, are also god
conductors and must be watched for when doing many kinds of geophysical work, 1
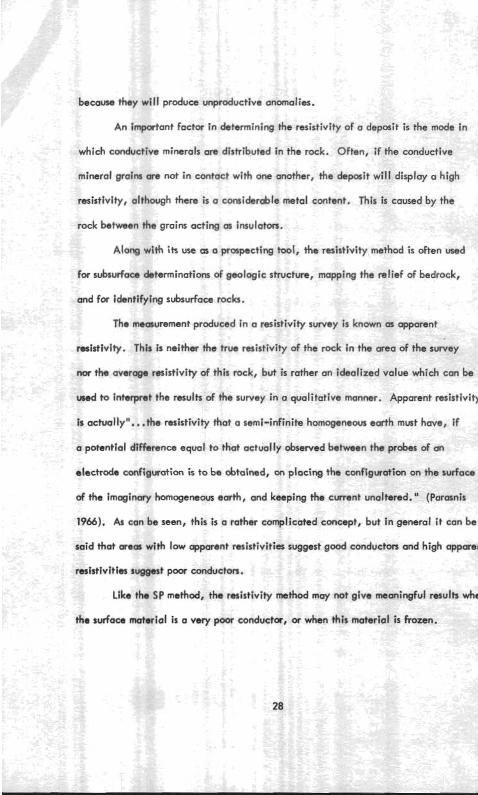
because they wi l l produce unproductive anomalies.
An important factor in determining the resistivity of a deposit i s the mode in
which conductive mirmrals are distributed in the rock. Often, i f the conductive
mlneral grains are not i n contact with one another, the deposit wi l l display a high
resistivity, although there i s a considerable metal content. This i s caused by the
rock betwen the grains acting crs imulators.
Along with ik at m a prapecting tool, the resistivity method i s often used
for subsurface Lterminatiom of geologic structure, mapping the relief of bedrock,
cmd for identifying subsurface rocks.
The memurement produced i n a resistivity survey is known as apparent
malativlfy. This is neither the true resistivity of the rock in the area of the survey
nor the average rsslstfvity of this rock, but is rather an idealized value which can be
wed to interpret the resulk of the survey in a qualitative manner. Apparent resistivi*,
Is actually". . .the resistivity that a semi-infinite homogeneous earth mwt have, i f
a potential difference equal to that actually observed between the of an
electrode configuration is to be obtained, m~ placing the configuration on the surface
of the imaginary homogensous earth, and keeping the current unaltered." (Parasnis
1966). As can be seen, this is a rather complicated concept, but in general i t can be
said that meas with low apparent resistivities suggest good conductors and high apparel
resistivities suggest poor conducton.
Like the SP method, the resistivity method may not give meaningful resulk wha
the surface material i s a very poor conductor, or when this material is frozen.
uratio~
until t
i The pc
methot
betwee
would
ns shown in
L- --A:-- -
btential ele
1. When tc
!n points 2
have to be
Field Work
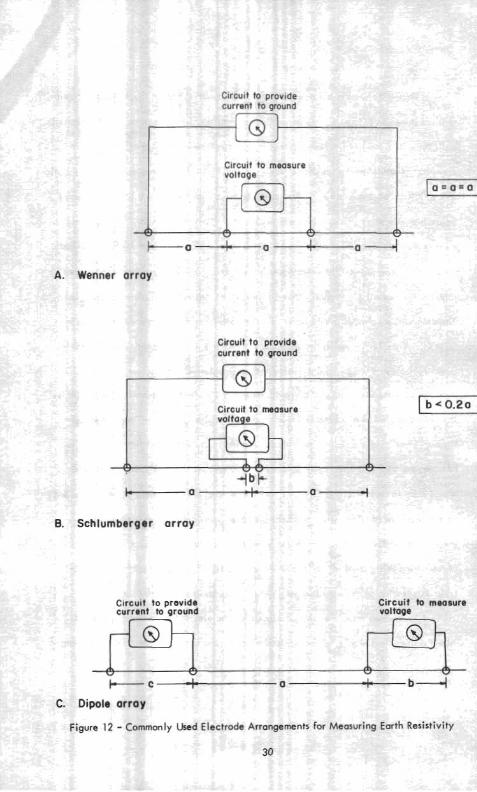
Resistivity surveys are generally carried out, using one of the electrode config-
Figure 12, along the lines of a grid system in a point-to-~oint manner
,,= c ; t n n m , c ~ r e a of interest i s covered. Since there i s some variation in inter-
pretation of results as the electrode configuration i s changed, these various configurations
wi l l be discussed one at a time. The configurations shown i n Figwe 12 and discussed
below are only three of many vsed but are the more common methods. In each cape,
current flow i s induced between two electrodes and the voltage, i.e., the electrical
potential, between two other electrodes i s measured. Many types of electrodes may be
used for the current electrodes; often stainless steel rods about 2 : feet long are used.
ctrodes should be of the non-polarizing type discussed under the SP
2king resistivity reading with some d.c. equipment, the spontaneous
I potential between the two points where the potential electrodes are set must f in t be
determined without any flow of current between the current electrodes. This value i s
then either added to or subtracted from the final resistivity reading, depending upon
the sign (+or -) of the natural potential. For instance, i f the $pontaneous potential
gure 12-A were +250 mV (from 2 to 3), then, this value
from any positive reading between these points and added
and 3 of F i
subtracted
to any negative reading, when readings are taken with current flowing between the
current electrodes 1 and 4. Fw this reason some resistivity equipment i s also capable
suring self-potentials, and i t is a good practice to record the SP while doing
rity work. In this way two geophysical methods are performed at once.
ar array - In this configuration the electrodes are equally spaced
spacing "a" being determined by the detail and depth of measurement
A. Wennc
a line; the
Circuit to provide current to ground
Circuit to measure voltage
A. Wenner array
Circuit to provide current to ground
Circuit to meaaure volto e e -Ibt-
-0-0-
Schlumberger orray
C I ~ C U I ~ to provide Circuit to measure current to ground voltage
+ @ E -+ @ k A L,
m " m rk V
C. Dipole orroy
Figure 12 - Commonly Used Electrode Arrangements for Measuring Earth Resistivity
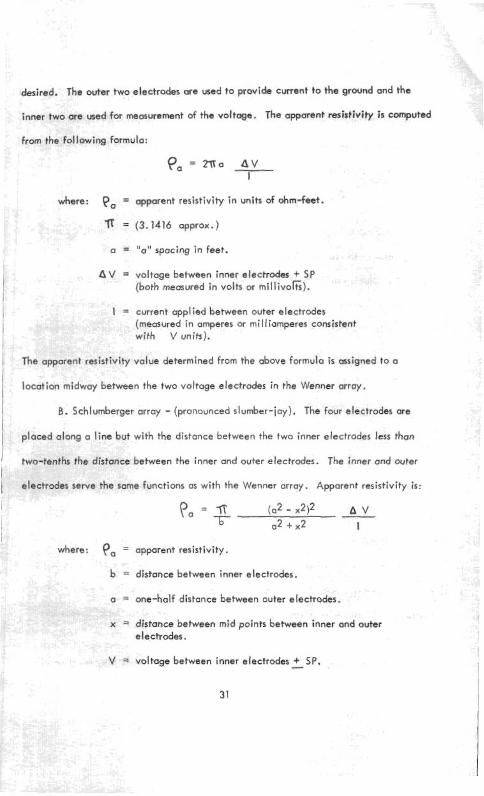
desired. The outer two electrodes are used to provide current to the ground and tha
inner I 'WO are usel
le followin!
d for measurement of the voltage. The apparent resistivity is computed
from tl g formula:
pa = m a A V I
where: 0, = apparent resistivity i n units of ohm-feet.
= (3.1416 approx.)
a = "a" spacing in feet.
P V = voltage between inner electrodes + SP (both measured in volts or millivo(T;).
I = current applied between outer electrodes (measured in amperes or mi l l iumperes consistent with V units).
/ The apparent resistivity value determined from the above formula i s assigned to a
location midway between the two voltage electrodes in the Wenner array.
I B. Schlumberger array - (pronounced slumber-jay). The four electrodes are
placed along a l ine but with the distance between the two inner electrodes less than
j two-tenths the distclnce between the inner and outer electrodes. The inner ond outer
*he same functions as with the Wenner array. Apparent resistivity is:
where: pa = apparent resistivity.
b = distance between inner electrodes.
a = one-half distance between outer electrodes.
x = distance between mid points between inner and outer electrodes.
V = voltage between inner electrodes+ SP.
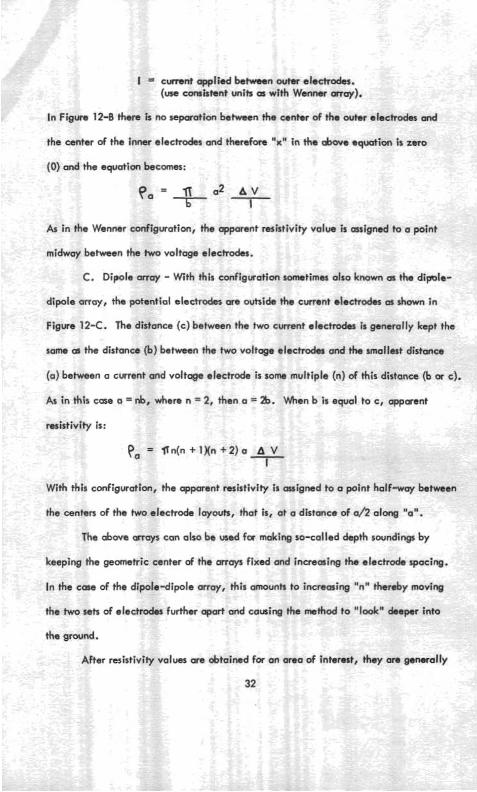
I cvrront applied between wter eleci~cides. (we consistent units as with Wennsr away).
In Figure 12-8 them is no separation betmen the center of the outer electrodua and
the center of the inner electrades and therefore "x" i n the & w e oquation is zero
(0) and the equation beemnos:
As in the Wenmr configuration, the apparent resistivity value b assigned to a point
midway between the two voltage electrodes.
C. Dipole array - With this configuration sometimua also known cn the dipole-
dipale array, the potential electrodas are outside the cwent electrodm as shown i n
Figure 12-C. The distance (c) between the two current slectroda is generally kept the
same m the distance (b) betwen the two voltage electrodes and the smallest distance
(a) between a current and voltage electrode is soma multiple (n) of this distance (b or c).
As i n this ease a = nb, where n = 2, then a = 20. When b i s equal to c, appment
resistivity is:
Po = .I ln(n+lXn+2)a A V I
With this configuration, the apparent resistivity is assigned to a paint halfway between
the centers of the two electrode Ictyouk, that is, at a distcmce of a/2 along "a".
The &we arrays can also b t wed fu making so-called depth sounding$ by
keeping the geometric center of the a r r v fixed and increcsing the electrode spacing.
In the case of the dipale-dlpols array, this amounts to inenasing "n" thereby moving
the two sek of electrodes further apart and cawing the method to "look" cbewr into
the ground.
After rcsistiviiy values are obtainod for arb area of interest, they am generally
32
,u utm u wup and iswnomaly curves of equal apparent resistivity are drawn. p aorrc
From these maps the inteirpmtation of the survey results i s made.
Resistivity Equipment
The essential componsnts of r ~ i s t i v i t y equipment are a current source, either
low frequency a.c. or d.c.; a mA-meter for measuring the current put into the ground;
a voltmeter for measuring the SP and the induced between the electrodes;
four suitable electroda, preferably two of which are of the non-polarizing type for
use as electrodes; and suitable, we l I-insulated, cables for connection.
! many manufacturers of resistivity equipment and there i s a great
variel
There are
.y of resistis
. . . t i ty equipment available both for purchase and rental. The price of
this equipment depends primarily on the type of current source used with the equipment.
Generally, equipment using d.c. sources of current are less expensive. These do not,
of course, have the capability of range or depth of examination of the high power
equipment.
1 ul"'n
from:
. . .. the power s
r.. .. :.-.
ource and s
. m C.
n-=i=tivity equipment ranges in price from about $1000 to over $2,700, depending
ensitivity of the equipment. This equipment can be obtained
veoscrenca Inc., veophysical Instrument and Supply Co., Heinrichs Geo-
exploration Co., Hoskin Scientific Ltd., McPhar Geophysics Ltd., Scintrex Limited,
and Soiltest Inc. Rental costs are about $180 per month. Contract surveys are run by
Geoscience Inc., Heinrichs Geoexploration, McPhar Geophysical and Seigel Associates
Limited. The cost of this work depends upon the job and a general estimate cannot be
given
MAGNETIC METHODS
Introduction
Magnetic methods ore the oldest form of geophpical prospecting; they are also
amoq the cheapest, easiest, and fastest. I t i s generally a good policy to include 0
magnetometer survey in any extensive geophysical program.
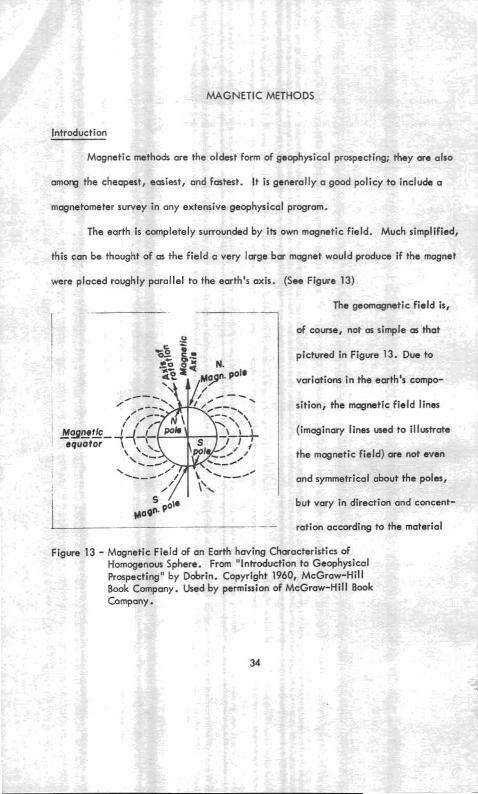
The earth i s completely surrounded by ik own magnetic field. Much simplified,
this can be thought of us the field a very large bar magnet would produce i f the magnet
were placed roughly parallel to the earth's axis. (See Figwe 13)
. - The gomagnetic field is, I 1
' Moqnetlc equator
z - 5 * * 5 5 H G5 * Mop". POI' /---p /' @--* ,-- \ '/--.
I / /- \ \ \
+4$; -'-L+ I I \ .-- Pol -2 /' ', -,, ---@'
\ .--* 0', i '---0°
/
S moo". PO"
of come, not as simple m that
pictured in Figure 13. Due to
voricttions i n the earth's compo-
sition, the magnetic field lines
(imaginary lines used to illustrate
the mugnetic field) are not even
and symmetrical about the poles,
but vary in direction and concent-
LI-- -- ration according to the material
Figure 13 - Magnetic Field of an Earth having Characteristics of Homogenous Sphere. F r m "Introduction to Geophysical Prospecting" by Dobrin. Copyright 1960, McGraw-Hill Book Company. Used by permission of McGraw-Hill Book Company.
fielc
of tt
t i s used in
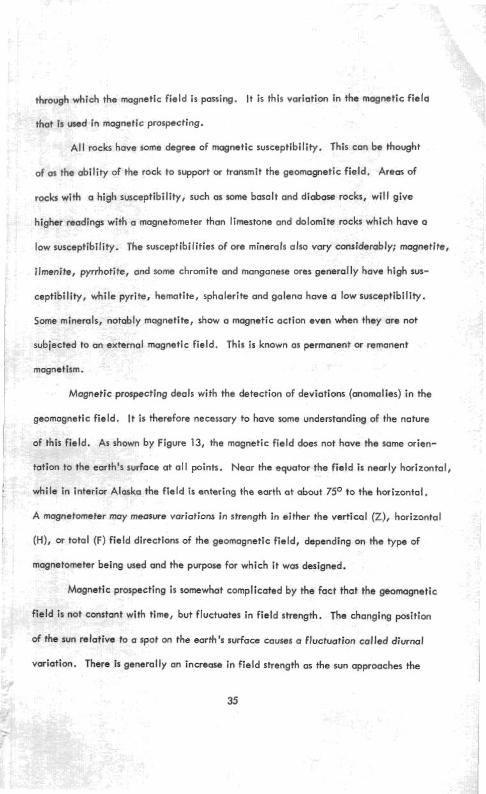
A l l roc
e minerals,
ected to an
>n to the ec
e in interic
through which the magnetic field i s passing. I t i s this variation in the magnetic field
magnetic prospecting.
ks have some degree of magnetic susceptibility. This can be thought
of 0 s the ability of the rock to support or transmit the geomagnetic field. Areas of
rocks with a high susceptibility, such as some basalt and diabase rocks, wil l give
higher readings with a magnetometer than limestone and dolomite rocks which have a
low susceptibility. The susceptibilities of ore minerals also vary considerably; magnetite,
ilmenite, pyrrhotite, and some chromite and manganese ores generally have high sus-
ceptibility, while pyrite, hematite, sphalerite and galena have a low susceptibility.
Som notably magnetite, show a magnetic action even when they are not
subi 1 externol magnetic field. This i s known as permanent or remanent
magnetism.
Magnetic prospecting deals with the detection of deviations (anomalies) in the
geomagnetic field. I t i s therefore necessary to have some understanding of the nature
of this field. As shown by Figure 13, the magnetic field does not have the same oritn-
ace at all points. Near the equator the field i s nearly horizontal,
1 the field i s entering the earth at about 75O to the horizontal.
I A magnetometer m y measure rariafions in strengfh in either the vertical (Z), horizontal I I (HI, or total (F) field directions of the geomagnetic field, depending on the type of
magnetometer being used and the purpose for which i t was designed.
Magnetic prospecting i s somewhat complicated by the fact that the geomagnetic
4 i s not constant with time, but fluctuates in field strength. The changing
ive to a spot on the earth's surface causes o fluctuation called diurncll
variation. There i s generally an increase in field strength as the sun approaches the
le sun relat
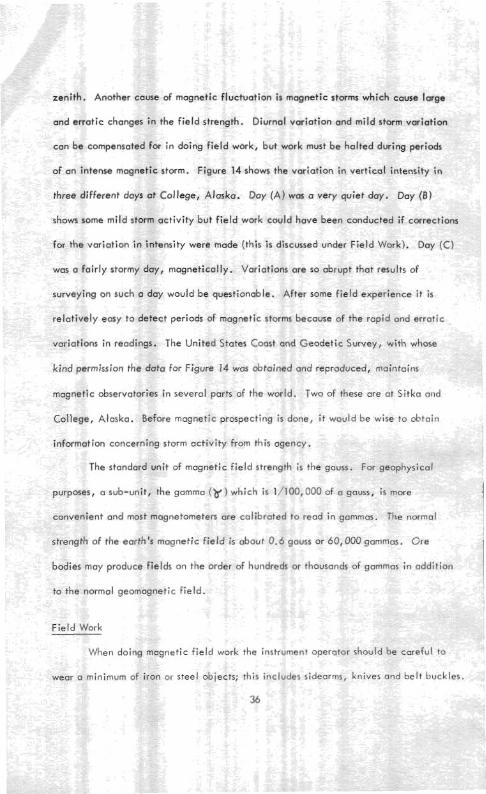
zenith. Another cause of mognetic fluctuation is magnetic stwms which cause large
and erratic changes i n the f ield strength. Diurnal variation and mild stwm variation
can be compensated for in doing field work, but work must be halted during periods
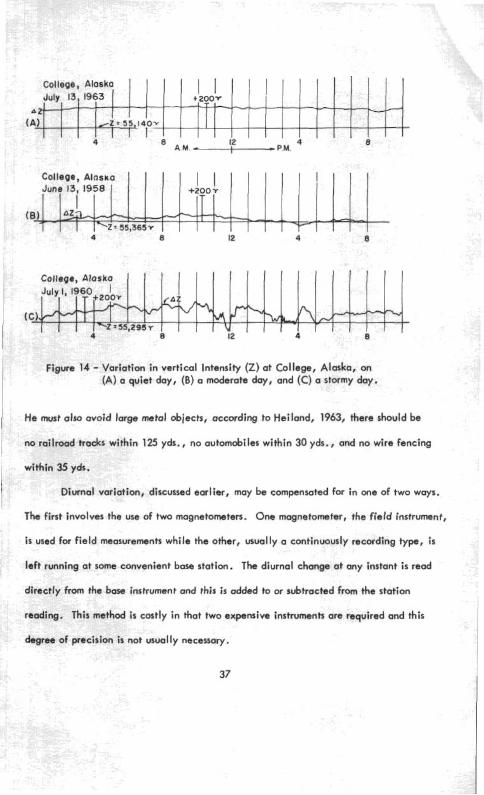
of an intense magnetic storm. Figure 14 shows the variation i n vertical intensity in
three different days at College, Alaska. Day (A) was a very quiet day. Day (0)
shows some mild storm activity but f ield work could have been conducted i f corrections
for the variation i n intensity were made (this i s discussed under Field Work). Day (C)
was a fairly stormy day, magnetically. Variations are so abrupt that results of
surveying on such a day would be questionable. After some field experience i t i s
relatively easy to detect periods of magnetic storms because of the rapid and erratic
variations in readings. The United States Coast and Geodetic Survey, with whose
kind permission the data for Figure 14 was obtained and re~roduced, maintains
magnetic observatories in several parts of the world. Two of these are at Sitka ond
College, Alaska. Before mognetic prospecting i s done, i t would be wise to obtoir,
information concerning storm activity from this ogency.
The standard unit of magnetic f ield strength i s the gauss. For geophysical
purposes, a sub-unit, the gamma (v) which i s 1/100,000 of o gauss, i s more I convenient and most magnetometers ore calibrated to read in gammas. The normal ~ strength of the earth's magnetic f ield is about 0.6 gouss or 60,000 gommas. Ore
bodies may produce fields on the order of hundreds or thousands of gammas in oddition
to the normal geomagnetic field.
Field Work
When doing mognetic f ield work the instrument operator should be careful to
wear a minimum of iron or steel objects; this includes sidearms, knives ond belt buckles.
36
College, Alosko July I , 1960
-----
College, AICISUO
June 13, 1958
Figure 14 - Variation in vertical Intensity (Z) at College, Alaska, on (A) a quiet day, (B) a moderate day, and (C) o stormy day.
4 1
I2 8 A M --PM
Colleoe, Alosko July 13 1963
He must also avoid large metal objects, according to Heiland, 1963, there should be
no roilroad tracks within 125 yds., no automobiles within 30 yds., and no wire fencing
a 2
( A )
I I +200 r
withir
1 I
H Z * 55L140v I I
1 I +200v
I
I 35 yds.
Diurnal i
I
(8)
~nning at st
tly from the
--
4 8 12 4 8
-
lariation, discussed earlier, may be compensated for in one of two ways.
The first involves the use of two magnetometers. One magnetomafer, the field instrument,
i s used for field measurements while the other, usually a continuously recording type, i s
left r~ ,me convenient base station. The diurnal change at any instant is read
direct ! base instrument and this is added to or subtracted from the station
ethod is cwtly in that two expensive instruments arc required and this
sual l y necessary.
-- I
79. This m
e of precisi
n ! - . - + - - ~ - - -Z : 55,365 V
ion i s not LI
For most prospecting surveys i t is usually sufficient to pick some base station,
p f e r a b l y i n a magnetically " f la t " area, and take readings at this station at some
regular time interval, usually every one or two hours. As f ie ld readings are taken
the time of each reading should be recorded. I f when checking in to the base station
after two hours work i t is found that diurnal change has increased the base station
reading by f i f ty gammas, i t w i l l then be necessary to subtract twenty-five gammas
from a f ie ld reading taken one hour earlier, thirty-seven and one-half gammas from
a reading taken one-half hour earlier, and so on. This assumes a linear diurnal change,
which i s not necessarily true (see Figure 14), but as was stated before, this is accurate
enough for most prospecting work.
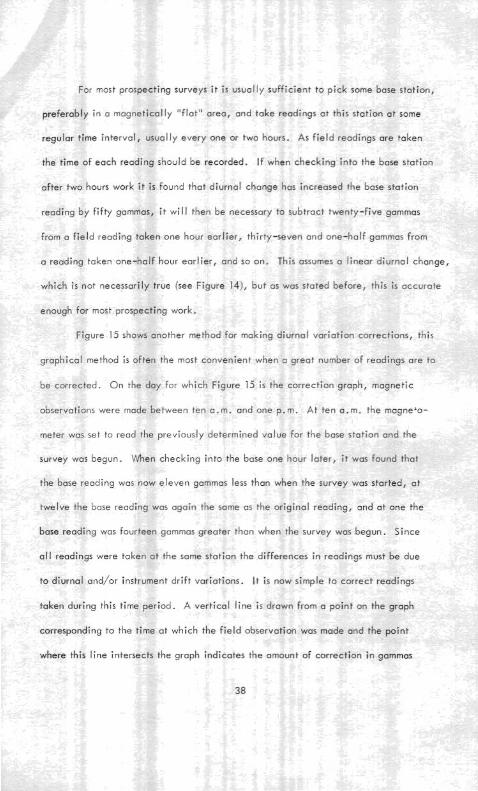
Figure 15 shows onother method for making diurnal variation corrections, this
yaph ica l method is often the most convenient when a great number of readings are to
be corrected. O n the day for which Figure 15 i s the correction graph, magnetic
observations were made between ten a.m. and one p.m. A t ten a.m. the magnebo-
meter was set to reod the previously determined value for the base station and the
survey was begun. When checking into the base one hour later, i t was found that
the base reading was now eleven gammas less than when the survey was started, at
twelve the base reading was again the same as the original reading, and at one the
base reading was fourteen gammas greater than when the survey was begun. Since
a l l readings were taken at the same station the differences i n readings must be due
to diurnal and/or instrument dr i f t variations. I t is now simple to correct readings
taken during this time period. A vert ical l ine is drawn from a point on the g r a ~ h
corresponding to the time at which the f ie ld observation was made and the point
where this l ine intersects the graph indicates the amount of correction i n gammas
to be made to that reading. If, for instance, a reading was made at 11:40, a line
From this time on the zero correction scale and the correction value
bout three gammas i s read on the vertical scale at the left. The field reading
plus three gammas i s now the correct value for the point at whtch the reading was
taken. I t should be noted that an increase in the base station reading requires a
negative correction, and vice versa,
Figure 15 - Correcting for Diurnal Variation.
The essential result of a magnetic survey i s the relative change in the field
strength with location, not necessarily the absolute value of the field strength. Most
magnetometers are adjustable so that i f one sets his instrument at some convenient
value (in gammas) at his base station each day, al l readings, after diurnal correction,
wil l have the same basis. This simplifies the reduction and plotting of data, Magnetic
results are usually presented as contour maps or profiles of field readings minus back-
ground, that Is, the local valw of rnogmtio in-mity from tho me deporit.
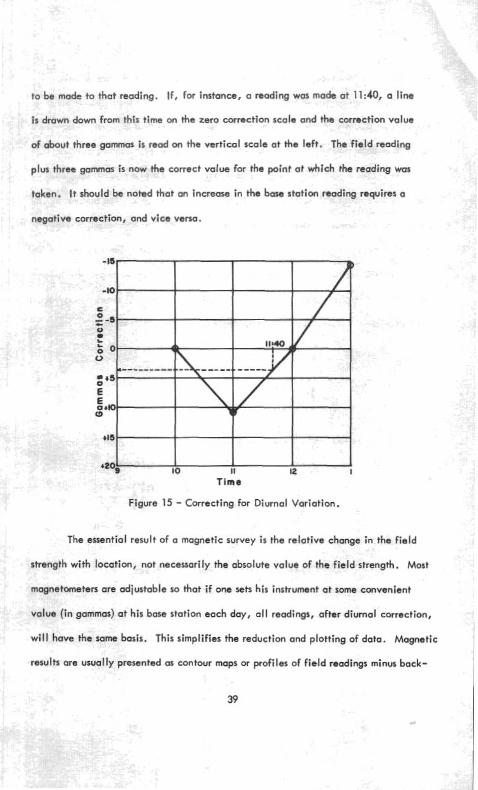
With the fluxgah a nuc lm pramassion mqmtornahr i t is ps ib le to maaswe
the vertical gradient of the wrth's mogrmtic field. This method involves taking two
readings at wch station with much vertical sepmotiar pmct ic~le, but over the
some spot. (See Figure 16) The fluxgub magmbtnetw mat be roughly leveled,
thsrefm only about a three-foot separation i s generally parrible. The nuclear
magnetometer which requires little or no orientation and usually has an
external sensing probe can be wed more reodily for th is purpcse. The vertical gradient
i s the magnetic reading at the higher height mlnw the magnetic mading at the lower
height divided by the distance between thme positions. F i g m 17 s h o w Q marl making
vertical gradient measuremenis with a nuclear prowion magnetometer.
I Surface
h, t XAtl
Vertical Gradient
bAZ AZt-AZ, bh-m where h,-h,c*h,
Figure 16 - Vertical Gradient Defined.
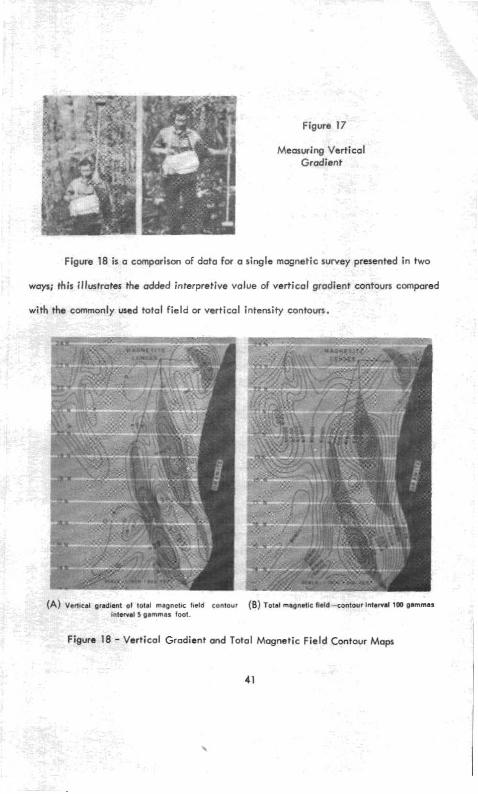
Figure 17
Measuring Vertical Gradient
Figure 18 i s a comparison of data for a single magnetic survey presented in two
ways; this illustmtes the added interpretive value of vertical gradient contours compared
with the commonly used total field or vertical intensity contours.
(A) Vertical gradisnt of total magnellc field contour (6) Total magnetic field -contour Interval 100 gammas
intewnl 5 Qammas loot.
Figure 18 - Vertical Gradient and Total Magnetic Field Contour Maps
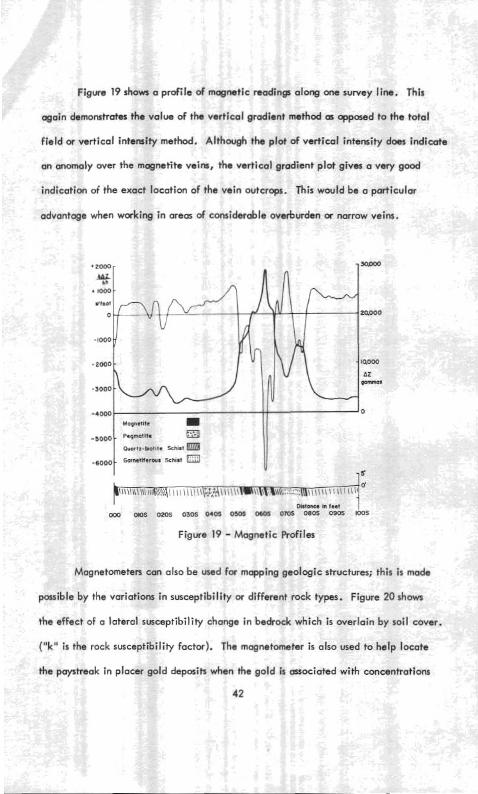
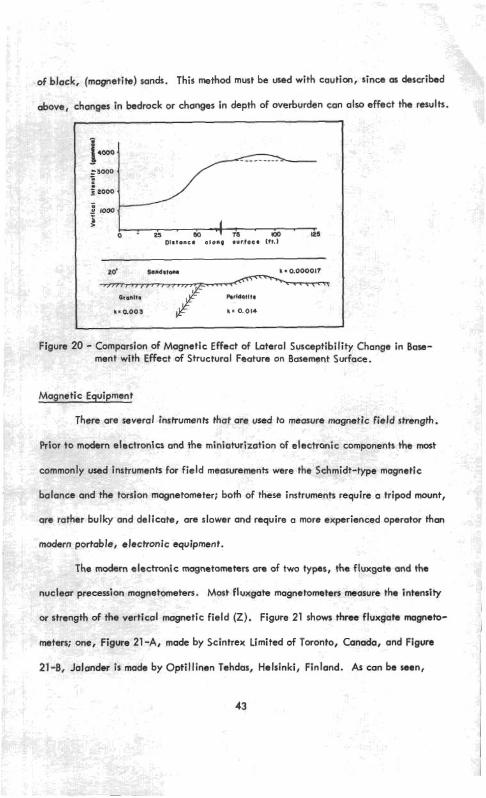
Figure 19 shorn a profile of magnetic reading along one survey line. This
again demonstrafes the vo lw of the vertical gradient method CE opposed to the total
field or vertical intensity method, Although the plot of vertical intensity does indicate
an anomaly over the mognatite veinr, the vertlcol gradient plot gives a very good
indication of the exact location of the vein outcrops. This would be a particular
advantcge when working in area of considerable overburden a narrow veins.
Figure 19 - Magnetic Profiles
Magnetometers can also be used for mapping geologic structures; this i s made
possible by the variations in susceptibility or different rock types. Figure 20 shows
the effect of a lateral susceptibility change in bedrock which is overlain by soil cover.
("k" i s the rock susceptibility factor). The magnetometer i s also used to help locate
the paystreak in placer gold deposits when the gold i s associated with concentrations
42
of black, (magnetite) sands. This method must be used with caution, since as desctibd
&ove, changes in budrock or changes in depth of overburden can also effect the resulk.
Fig lure 20 - Cs m,
lgnetic Equ
There
or to model
The mf
:leer preco
strength of
ters; one, f
- . . .
I of Magnetic Effect of Lcltetol Susceptibility Change in Base- enr wlrn Effect of Structural Feature on Basement Surface,
are several instruments that are used to mea!
cs and the miniaturization of ele
sure magnel
chonic con
tic field strength.
~ponenh the most
- ~
uion magnc
the vettic0
'igure 21 -1
. . .
nmonly used instruments for field measurements were the Schmidt-type magnetic
lance and the torsion magnetometer; both of these instruments require a tripod mount,
are rather bulky cmd delicate, arc slower and require a more experienced operator than
modern portable, electronic equipment.
odern electronic magnetometers ate of two types, the fluxgate and the
ttornekrs. Most fluxgak magnetometers measure the intensity
11 magnetic field (2). Figure 21 shows three fluxgok magneto-
r, made by Scintrex Limited of Toronto, Canada, and Figure
21-6, Jalonder is made by Optillinen Tehdas, Helsinki, Finland. As con be wen,
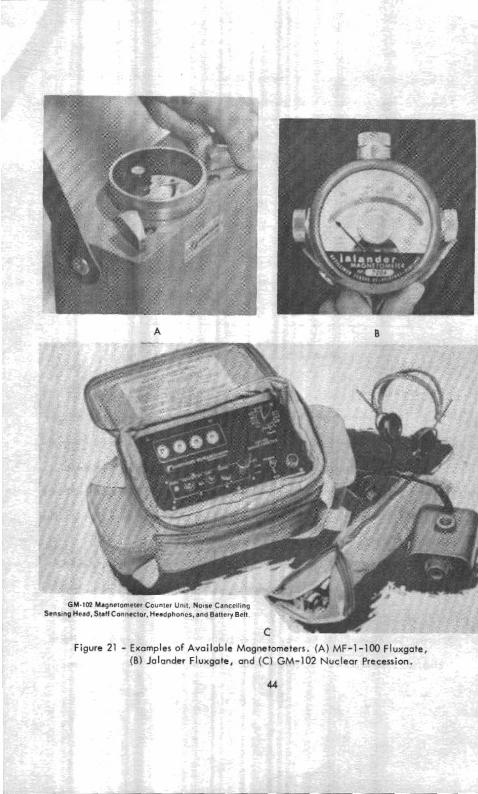
Figure 21 - Examples of Available Magnetometers. (A) MF-1-100 Fluxgate,
(0) Jalander Fluxgate, and (C) GM-102 Nuclear Precession.
44
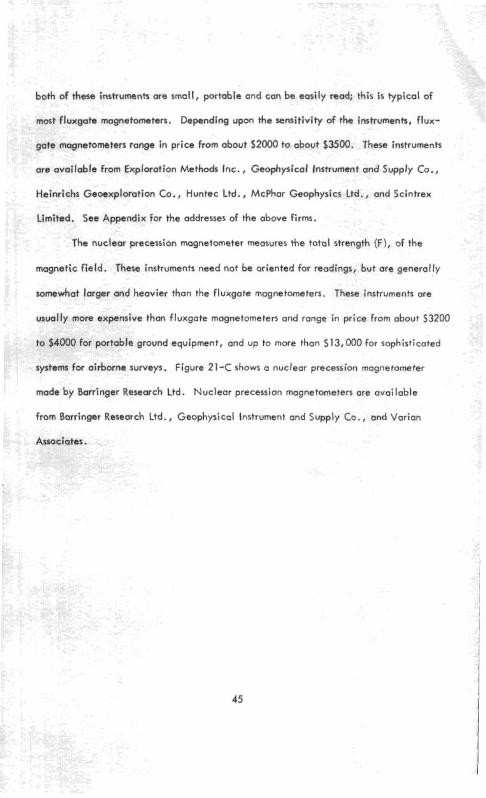
bath of these instruments are small, and can be easily read; this is vp ica l of
most fluxgate mognetometcrs. Depending upon the sensitivity of the instruments, flux-
gate magnetometers range in price from about $2000 to about $3500. These instruments
are available from Exploration Methods Inc., Geophysical instrument and Supply Co.,
Heinriehs Geaexploration Co., Huntec Ltd., McPhar Geophysics Ltd., and Scintrex
Limited. See Appendix for the addresses of the above firms.
The nuclear precession magnetometer measures the total strength (F), of the
magnetic field. These instruments need not be oriented for readings, but are generally
somewhat larger and heavier than the fluxgate magnetometers. These instruments are
usually more e
54000 for p,
xpensive t l
ortable grol
Ian fluxgate magnetometers and range in price from about $3200
und equipment, and up to mere than $13,000 for sophisticated
systems for airborne surveys. Figure 21-C shows a nuclear precession mognetorneter
made by Barringer Research Ltd. Nuclear precession magnetometers are available
from Borringer Research Ltd., Geophysical Instrument and Supply Co., ond Varion
Associates.
ELECTROMAGNETIC METHODS
Introduction
There are several electromagnetic methods and types of equipment available.
Some of these ore extremely simple to run and relat ively inexpensive, while others
are h ighly sophisticated and require considerable experience and money t o produce
meaningful results. When compored to other methods, electromagnetic surveys must
be classed as fast.
This method is used quite extensively for exploration i n Conada where both
ground and airborne techniques ore ut i l ized. E l e ~ t r o m o ~ n e t i c surveying is
used for the location of massive and vein type deposits. The method is good for locating
minerals wi th high conductivities such as galena, graphite, chalcopyrite, pyrite,
pyrrhotite and magnet;fe. Due to low conductivity, minerolr such as hematite, sphol-
eri te and chrornite w i l l not produce onomolies unless they also contain sufficient amounts
of conductive minerals such as those listed above. Electromagnetic disturbances can
also be caused by faults, fractures, zones of crushed rock and fissures containing water.
The electromagnetic method is based on the interrelation of two fundamental
physical phenomena-electricity and magnetism.
When a strong alternating current passes through a wire, usuolly wound in o coi l
for this purpose, i t produces an alternating mugnetic f i e ld (referred to as the primary
f ie ld) about the coi l . I f there is a conductive mass near the coi l , the prirnory alternating I
magnetic f ie ld produces on alternating electr ical current i n this mass. This secondary I
e lect r ica l current then produces i t s own alternating magnetic field, known 0s the seconda
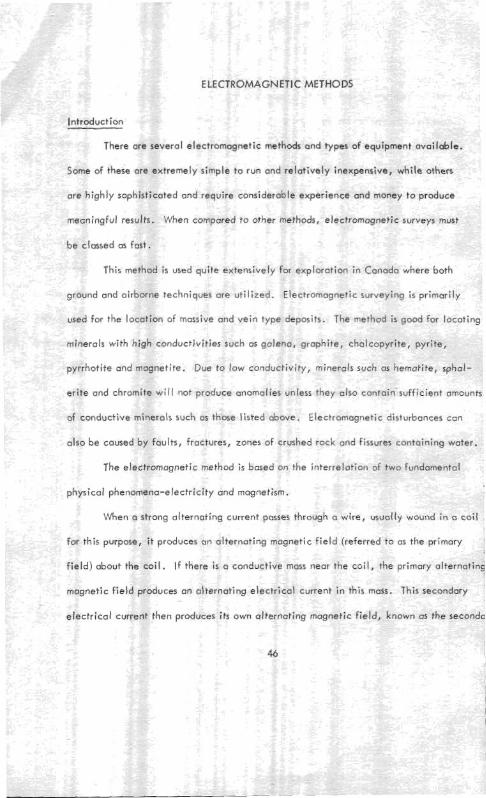
field. The secondary field, along with the primary field, produces a resultant total
Id. (See Figure 22-A). I t is measurements of the differences between the primary
. - Id and the resultant f ield that are used in electromagnetic surveying. Figure 22-A
shows the mast common and easiest
measurement that can be made of the
total field, that is, the difference in
direction between the total f ield and
the primary field; as can be seen, the
I greater the secondary field, the greater
C
I I
the direction difference,
Horizontal component Figure 22-8 shows other memure-
w B ments that can be made of the resultant
Figure 22 - Resolution of Magnetic Field total field; the vertical and horizontal Vectors into Space Components.
components of the total field,
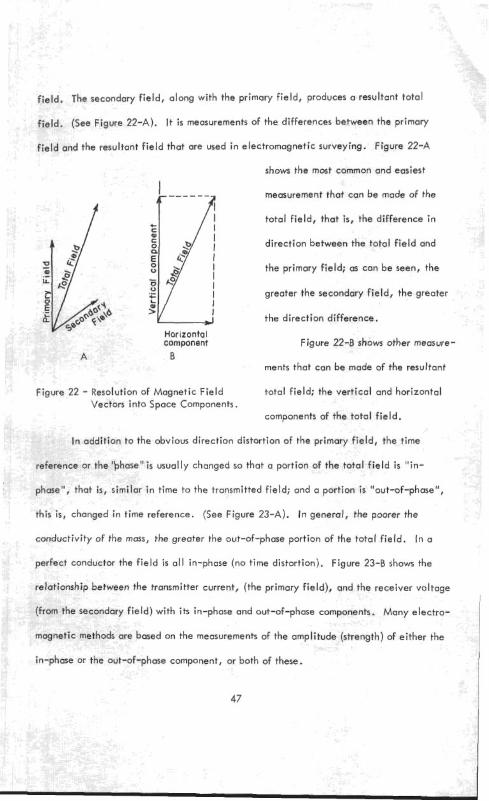
In addition to the obvious direction distortion of the primary field, the time
le "phasel'is usually changed so that o portion of the total f ield i s "in-
se.., tnat IS, similar in time to the transmitted field; and a portion i s "out-of-phase",
this is, changed in time reference. (See Figure 23-A). In general, the poorer the
conductivity of the mass, the greater the out-of-phase portion of the total field. In a
relc
,I .
Fect conductor the f ield i s a l l in-phase (no time distortion). Figure 23-B shows the
rtionship between the tronsmitter current, (the primary field), and the receiver voltage
m the secondary field) with i t s in-phase and out -~ f -~hase components. Many electro-
ods are based on the measurements of the amplitude (strength) of either the
,,, ?base or the out-of-phase component, or both of these.
Phose shift
-4 I- 1- , Current at tronsrnttter
\ 1 '\\\cl i 't P 1 t 0 . e ot receiver LV " 'w L PHASE SHIFT BETWEEN THE VOLTAGE OBSERVED AT THE RECEIVER AND THE CURRENT SUPPLIED TO THE TRANSMITTER
Current to transmitter
Phose angle
I A -
Out -o f - phase component
RESOLUTION OF MAGNETIC FIELO VECTORS OR COMPONENTS INTO TIME COMPONENTS
( B )
Figure 23 - Phase Shift and Resolution of Electromagnetic Field
A great variety of methods differing in primary f ie ld source-total f ield receiver
layouts ore employed i n electromagnetic prospecting. The most convenient manner of
clmsifying these i s to divide them into two main catagories: ( I ) methods in which the
source of the primary f ield is stationary and the receiver mobile (called fixed-ource);
( 2 ) methods in which the source as well as the receiver is mobile (called moving-source).
It i s important to consider the differences between fixed-source and moving-source methods
in selecting the best method for a particular type of exploration problem. The depth of
seclrch which can be achieved with movlng-rource equipment may not be adequate
for soma types of problem, so that a large fixed-~ource method must be employsd.
Generally, the greatest depth of search i s no mwe than half the distance between
the source and receiver. The separation between the source and the receiver is limited
by the intensity of the magnetic field that can be developed by the trammitfer, and
this in turn is limited by the amount of weight which can be carried with mobile
equipment. Standard moving-source equipment can be mad with a separation of 300
to 400 feet, implying (I maximum dspth of search of &out 150 to 200 feat under ideal
conditions; b e t results are obtained with moving source methods when the target i s no
more than 50 to 100 feet in depth. With fixed-source equipment, i t i s reasonable to
prospect to depths of several hundred feet, and under ideal conditions, manufacturen
of somt equipment claim search depths ef up to 1000 fast. Fixedlswrce equipment i s
somewhat more difficult to use than mwing-source equipment and i s generally slower.
They are, howcver, far more effective in mountainous areas. I f a large area i s to be
surveyed in detail and to a great depth i t would seem advisable to consider hiring a
professional geophysical exploration concern with the proper equipment and experience.
f ield Methods
The two most popular methods, the t i l t angle and phme angle methods wi l l be
discussed briefly. The t i l t angle method is probably the simplest and fatest of the
electromagnetic systerns wailable.
Tilt Angle:
e electromagnetic imkumenh we among the cheapest wailable, Tilt angl
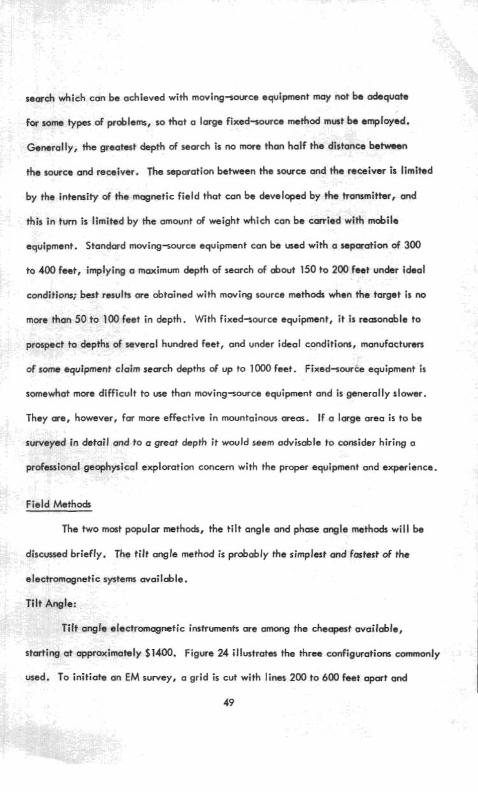
ng at appro lximately $1400. Figure 24 illustrattx the three configurations commonly
used. To initiate an EM survey, a grid is cut with lines 200 to 600 h o t aport and
49
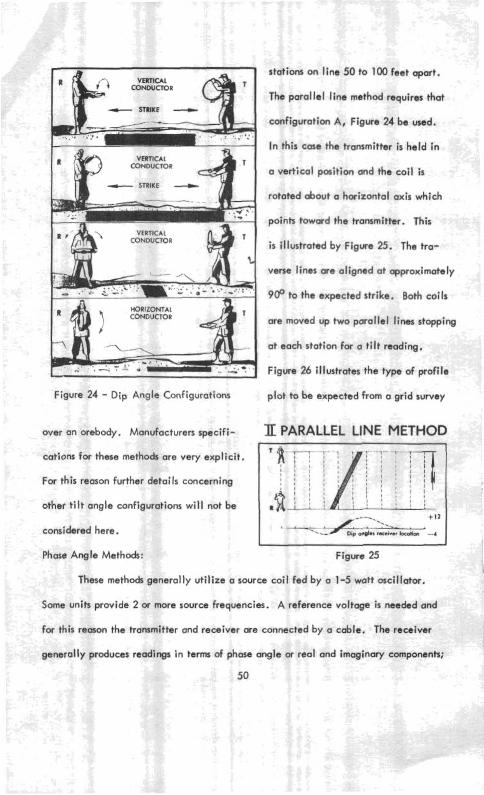
stations on line 50 to 100 feet apart.
The parallel line method requires that
configuration A, Figure 24 be used.
In this cme the transmitter i s held in
a vertical position and the coil i s
rotated &out a horizontal axis which
points toward the transmitter. This
i s illustrated by Figwe 25. The tra-
verse lines are aligned at approximately
9Cf' to the expected strike. Both coils
are moved up two parallel lines stopping
at each station for a t i l t reading.
Figure 26 illustrates the type of profile
Figure 24 - Dip Angle Configurations plot to be expected from a grid survey
over an orebody. Manufacturers specifi- IC PARALLEL LINE METHOD
I These methods generally utilize a source coil fed by a 1-5 watt oscillator,
cations for these methods are very explicit,
For this reason further details concerning
other t i l t angle configurations wi l l not be
considered here.
Some units provide 2 or more source frequencies. A reference voltage i s needed and
for this reason the transmitter and receiver are connected by a cable. The receiver
Phase Angle Methods: Figure 25
+ I 2
a ..., - , - ~ ~ ~ ~ - * ~ : nip .+., rKa,mr *,. - h.~a -.,
generally produces readings i n terms of phase angle or real and imaginary components;
50
i
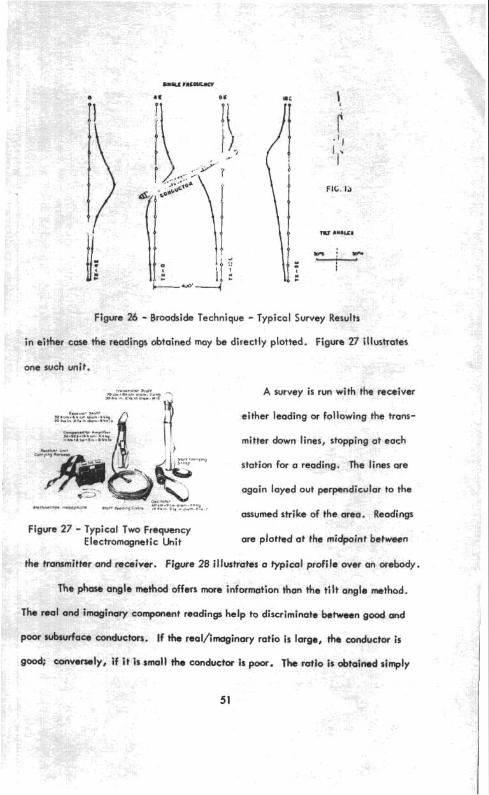
Figure 26 - Broadside Technique - Typical Survey Results
i n either case the readings obtained may be directly plotted. Figure 27 illustrates
one such unit.
m<E;:;'.;:;,:,w < W W . " z,, "earn . b
A survey i s run with the receiver
I*."..*,.* .a* a.q n r . * r ~ . * a , - v - v 1 either leading or following the trans-
-u **vlr..r P ?".* ...- I -..", .I .-. mitter down lines, stopping at each
.111,<11*1111 $L station for a revding. The lines are
"v again layed out perpendicular to the .= .'.ha-* -pn u .,rr st
"'- Y -. ..lP "I. . r *",
assumed strike of the area. Readings
Figure 27 - Typical Two Frequency Electromagnetic Unit are plotted at the midpoint between
the transmitter and receiver. Figure 28 illustrates a typical profile over an orebody.
The phase angle method o f f n mom information than the tilt angle method.
The real and irnaglnary component readin* help to discriminate batween good and
poor subsurface conductors. If the raal/irnaginary ratio i s large, the conductor is
g d ; converrsly, if i t is small the canductor is pow. The ratio is obtained simply
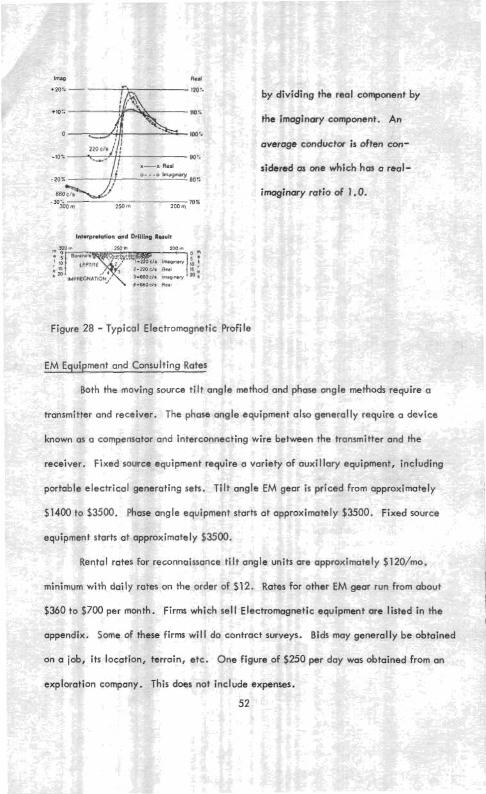
by dividing the real component by
the imaginary component. An
overage cenductw is often con-
sidered os m e which has a real-
imaginary ratio of 1.0,
Figure 28 - Typical Electromagnetic Profile
EM Equipment and Consulting Rates
Both the moving source t i l t angle method arid phase angle methods require a
transmitter and receiver, The phase angle equipment also generally require a device
known as a compensator and interconnecting wire between the transmitter and the
receiver. Fixed source equipment require a variety of auxiliary equipment, including
portable electrical generating sets. Tilt angle EM gear is priced from approximately
$1400 to $3500. Phase angle equipment starts at approximately $3500. Fixed source
equipment starts at approximately $3500.
Rental rates for reconnaissance t i l t angle units are approximately $120/mo.
I minimum with doily rates on the order of $12. Rates for other EM gear run from about I
1 $360 to $700 per month. Firms which sell Electromagnetic equipment are listed in the
I
I
appendix. Some of these firms wi l l do contract surveys. Bids may generally be obtained I
on a job, its location, terrain, etc. One figure of $250 per day was obtained from an 1 I
exploration company. This does not include expenses.
52
GRAVITY METHODS
lntr -
. .
is a
bea
oduction
The grc
per sec. (6
>city i s knc
lvity method can provide valuable infwmcrtion for mineral prospecting,
but due to the high cost of this equipment and the cost and time required for making
gravity surveys, their use is usually limited to detailed exploration work. This method
Iso vsed quite extemively by the petroleum industry i n exploration for deep oi l
ring formations.
If an object is allowed to fall towards the earth, it wi l l ottoin o velocity of
about 980 centimeters per second (32 ft./sec.) after falling for one second, and 1960
after falling for two seconds. This time rate of change of
itational acceleration; near the earth the acceleration due
to gravity i s about 980 ern/sec.2 (32 ft./sec.2). Gravitational acceleration (g) i s
due to the force of attraction that exists between any two objects between the earth
and the sun, between a person and the earth, and between two balls on a billiard
dist
Car
--
4 ft./sec.)
bwn as grav
lgnitude of this force depends on the masses of the objects and the
ance Detween them. I f you could weigh yourself very accurately f in t over the
rm and the n wer Fat Knox, you would find that you weighed slightly
,,,,, ,..,,, ,.dr Fort Knox (neglecting latitude, elevation factors and rock density).
This i s because the mass (the density) of the material beneath you i s greater and
In grm
aured. Thi
therefore exerts a greater fwce on you. I
rity surveying the acceleration due to gravity is the quantity that i s I is i s known as the gal (0) and i s the distance in centimeten an abject
53
would fa l l from rest i n one second. Since the acceleration due to gravity is about
980 cm/sec.*, this i s then equal to 980 According to Resnick and Halliday, 1960,
"g" varies i n a systematic manner from 978.039 gal at the equator to 983.217 gal at
the poles and at 45O latitude, the variation of "g" with altitude i s from 980.6 gal at
sea level to 959.8 gal at 100,000 meters.
The gravity method involves the systematic meusurements of "g". This is not
very difficult, although precision instrumenk for this purpose are very expensive.
The difficulty with gravity surveying lies with the amount of asociated data and the
number of corrections that need to be made to the raw reading in order to make the
gravity measurements meaningful. As seen from the above discussion of gravity, g
varies with altitude and latitude as well as with the density of the material beneath
where g i s being measured. For these reasons, the gravity method is not generally
employed for reconnaissance prospecting; i t is sometimes applied as a method for the
detailed examination of a property. One instance where the gravity method is of
value would be to determine whether an electromagnetic anomaly is caused by a
massive sulfide deposit or by a thin sulfide vein or a graphite zone.
As was stated earlier, the cost of gravity equipment is very high, generally
beyond the means of an average prospector, and unless a great deal of work were to
be done, such an investment would not be iustified by even a fair ly large company.
With this consideration in mind, this handbook wi l l not go much further into the
subject of the gravity method except to introduce some of the terminology, the major
uses of the gravity meter, and present the c a t of some of this equipment and rentol
Field Work
Most gravity work in mineral exploration i s involved with the detailed
tmination of a property; for this reason, most surveys ore carried out over a fairly
"tight1' grid pattern, that is, the grid points are relatively close together - usually
about 100 feet or lea. For most surveys a base station i s chosen, away from the
influence of the ore body, and readings are taken at this station at 1-2 hour inter-
vals, much in the same manner as magnetic surveys. This i s required because of the
drift inherent to al l gravity instruments.
Each field reading must be corrected before the data can be mapped; these
correctiom arc
2. Elt dif
: 0 s follows
titude corre !ction. Gravity increases with latitude,
?vation or free-air correction. This compensates for the 'ference between the station elevation and base elevation.
J. aouguer correction. The elevation correction does not account for the material between the elevation of the station and the base but only for their differences in distance from the canter of the earth; the Bouguer correction accounts for the extra gravitational attraction due to the material between these two elevations.
:tion. This correction i s necessary to account for any e or absence below the level of the station where a
ldlng IS taken. This higher material (w absence below) will, in effect, produce a negative reading, that is, i t wil l detract from the attraction of the material beneath the station and therefore must be corrected for.
As can
uired of an
bet
I b t seen from the corrections listed above, a great deal of information is
area that i s to be examined by the gravity method.
all corrections have been applied to the raw readings, the differences
m and base are usually plotted on a suitable map grid and isoanmaly
contours are drawn.
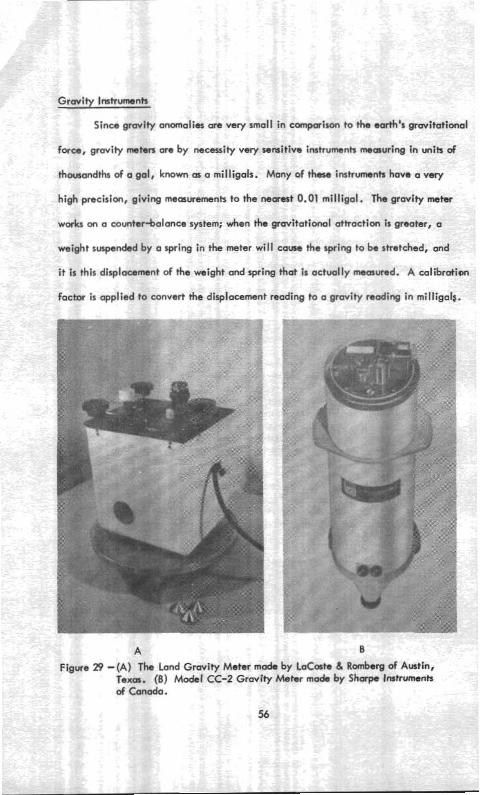
Gravity Instrunmnts
Since gravity anomalies a m very small in compmison to the earth's gravitcrtional
force, gravity nmters are by necessity very ~ r a i t i v e instruments measuring in units of
thousandths of a gal, known m a rnilligals. Many of these imtruments have a very
high precision, giving measurements to the nearest 0.01 miltigal. The gravity m h r
w w b on o counter-balonce system; when the gravitational attraction i s greahr, 0
weight suspended by a spring in the meter wi l l cause the spring to be smtched, ond
i t is this displacement of the weight and spring that is actually measured. A colibrotion
factor i s applied to convert the displacement mading to a gravity reading in rnilligal~.
A 6
Figure 29 -(A) The Land Gravity Meter made by LaCoste & Rornberg of Austin, Texas. ( 6 ) Model CC-2 Gravity Meter mode by Shmpe Imtrumenk of Canada.
ins trumenb arc
mwsmsnts
rmmercially available gravity meters are shown in Figure 29; these
B very accurate and surprisingly durable when the sensitivity d
is considered.
lraviiy meters cost from about $6000 to $10,000 depending upon the
sen the instrument; this equipment is available from Geophysical Instrument
and Supply Co., LaCate & Romberg, Sharp Instruments of Canada, and Texas
Imtwmnts Inc. Lnta l r me available through Huntec Ltd., Scintrex Ltd., and
Tam Instrumnts, LaCoste md Rornberg and Radar Exploration Cornpony.
RADIOMETRIC METHODS
Introduction
The radiometric method is one of the most restricted of the gsophysical methods
in that i t is useful in the search fw only a very few minerals. This method i s quite
emy to perform and equipment is relatively inexpensive; but generally speaking,
this method is useful only in search of minerals containing uranium and thorium.
Some minerals contain elemenk which undergo a natural process known a
radioactive decay. These elemnts break down into other more stable elements by
emitting subatomic particles (alpha and beta porticles)'ond electromagnetic radiation
called gamma rays. Alpha particles are quite weak, that is, they wi l l not penetrate
more than a very small thickness of matter and wi l l not even penetrate the human skin.
Beta particles wi l l t rwel further, but still a relatively small distance through solid
material. Gamma rays, like x-rays, wi l l penetrote quite far through most materials
and an almost infinite distance in air, but even these will be weakened beyond the
detection level by about twenty inches of solid rock ond a somewhat greater thickness
of soil. As can be seen, in general, a radioactive source mut be expaed to be
detected or i t must at lemt be very close to the surfacc,
There are several naturally-occuring radioactive elements, but most of the
radioacfivity encountered is caused by the disintegration of uranium, thorium, or
potassium. There i s always some radiation at any point, this is the normal 'background1'
level of radiation caused by cosmic rays and the smoll mounts of radioactive material
found in most rocks.
Field Rwocedure
In using radiation counters in the fkld, the common p r o d m fr to walk w r
the 0 tea, usually on some sort of a grid pattern so that madinp can be located on a
map, and continuously monitor the radiation counts. An area of interest should give
readings at least 2 to 3 times greater than the normal background count. Radiwctive
ore deposits often produce reading 10 to 100 ti- background. Since a radioactive
deposit i s cosily obscured by overburden, i t i s often a good practice to take reading
close to the ground and to remove some of the surface material to see how this affects
the counter readings.
There or e two types of instruments commonly used to detect radiation. These
causi
rnole~
ng i t to bet
cule is ther
sitive. I t c
Th- --:-
are the geiger counter and the scintillation counter. The geiger counter has a tube
filled with a gas, such QS helium or argon, which i s normally not an electrical conductor,
with a high voltage wire extending through the center of the tube. When a gamma ray
or a beta particle passes through the tube, i t wil l sometimes hit one of the gas molecules
come ionized, that is, to become an electrical conductor. This charged
I attracted to the wire and causes an electrienl pulse. These electrical
pulses are amplified and appear either m dial readings of some number of counts (pulses)
per minute, as a flmhing light, or as a sound in earphones. The problem with a geiger
counter i s that only about one in every hundred gamma rays which p a through the
tube wi l l hi t a molecule and cause a pulse, therefore, the geiger counter is somawhat
:annot, for instance, be used for airborne work.
.b.Bntillation counter uses certain crystals which emit a flosh of light (scin-
tillate) when a gamma ray pwes through them. The scintillatiom ore detected by a
59
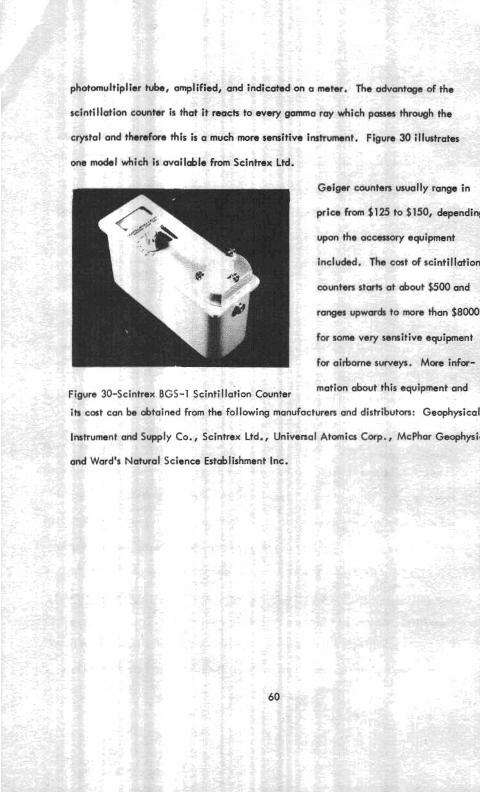
photomultiplier tube, amplified, and indicated on a meter. The advantage of the
scintillation counter is that i t reacts to every gamma ray which p-es through the
cryxtal and therefore this is a much mom a e ~ i t i v e inshumant. Figure 30 illustrates
one medal which is ovuilable from Scintrex Ltd.
Geiger countem usually range in
price from $125 to $150, dependity
upon the accmsory equipment
included. The cost of scintillation
counten starts at &out $500 and
ranges upwuds to mom than $8000
for some very sensitive equipment
for airborne surveys. More infor-
Figure 30-Scintrex BGS-1 Scintillation Counter mation about this equipment and
its c a t can be obtained from the following monufacturen and distributm: Geophysical
Instrument and Supply Co., Scintrex Ltd., Univenal Atomiu Corp., McPhar Goophysic
and Ward's Natural Science Establishment Inc.
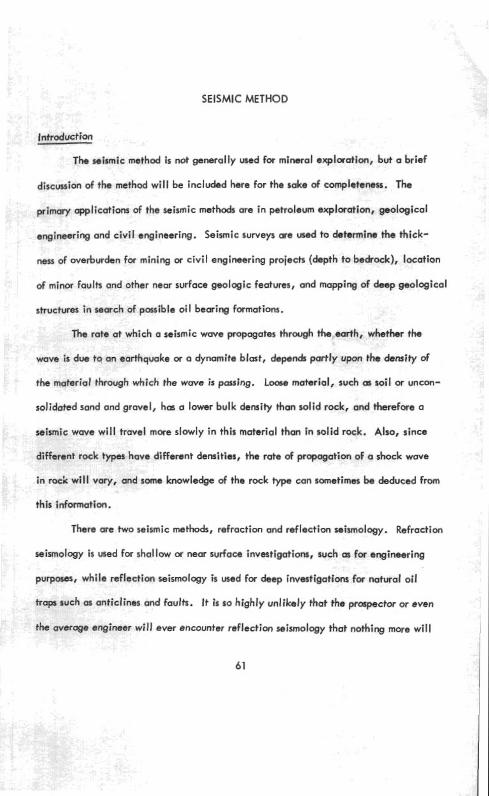
SEISMIC METHOD
IntroductiWI
The seismic method is not generally wed for mineral exploration, but a brief
discusion of the method wi l l be included here for the sake of completeness. The
primary applications of the seismic methods are in petroleum exploration, geological
engineering and civil engineering. Seismic surveys are wed to determine the thick-
ness of overburden for mining or civi l engineering projects (depth to bedrock), location
of minor faults and other near surface geologic features, and mapping of dssp geological
structures in search of possible oi l bearing formations.
The rate at which a seismic wave propagates through the earth, whether the
wavc IS due to on earthquake or a dynamite blast, dependr purtly upon the density of
the moterial through which the wave is passing. Lme material, such or roil or uncon-
solidated sand and gravel, hca a lower bulk density than solid rock, and therefare a
seismic wavc wi l l travel mae slowly in this material than in solid rock. Also, since
rack will vc
difforent rock f y p s have different densities, the rate of propagation of a shock wave
ne knowledge of the rock type can sometimes be deduced from
I information.
There are two seismic methods, refraction and reflection seismology. Refraction
seismology i s used for shallow or near surface invmtigatiom, such as for engineering
purposes, while reflection seismology i s used for deep investigations f w natural o i l
t rap such as anticlines and faults. I t is so highly unlikely that the prospector w even
~gineer wi l l ever encounter reFlectlon seismology that nothing more wi l l the average er
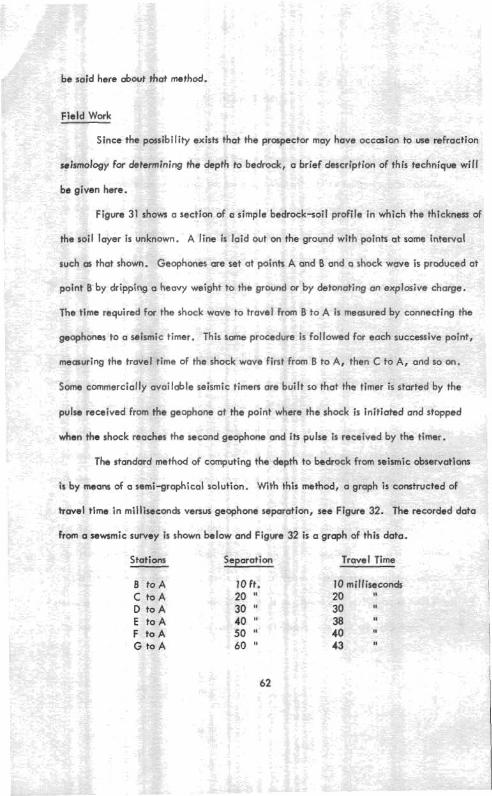
be said here about that method.
Field Wark
Since the possibility exists that the prospector may have occasion to use refraction
seismology for determining the depth to bedrock, a brief description of this technique wi l l
be given here.
Figure 31 s h o ~ l a section of a simple bedrock-soil profile in which the thickness of
the soil layer i s unknown. A line i s laid out on the ground with points at some interval
such a that shown. Geophones are set at points A and B and o shock wave is produced at
paint B by dripping a heavy weight to the wound or by detonating an explosive charge.
The time required for the shock wave to travel from 6 to A i s measured by connecting the
geophones to a seismic timer. This same procedure i s followed for each successive point,
meauring the travel time of the shack wave first from B to A, then C to A, and so on.
Some commercially available seismic timers are built so thot the timer i s started by the
pulse received from the geophone at the point where the shock is initiated and stopped
when the shock reaches the second geophone and ik pulse i s received by the timer.
The standard method of computing the depth to bedrbck from seismic observations
is by means of a semi-graphical solution. With this method, a graph i s constructed of
hovel rime in milliseconds versus geephone separation, see Figure 32. The recorded data
from a sewmic survey i s shown below and Figure 32 i s a graph of this data. I
Stations Separation Travel Time
8 t o A 10 ft. 10 rni~~ireconck C t o A 20 " 20 " D t o A 30 " 30 " E t o A 40 " 38 "
F t o A 50 " 40 " C to A 60 " 43 "
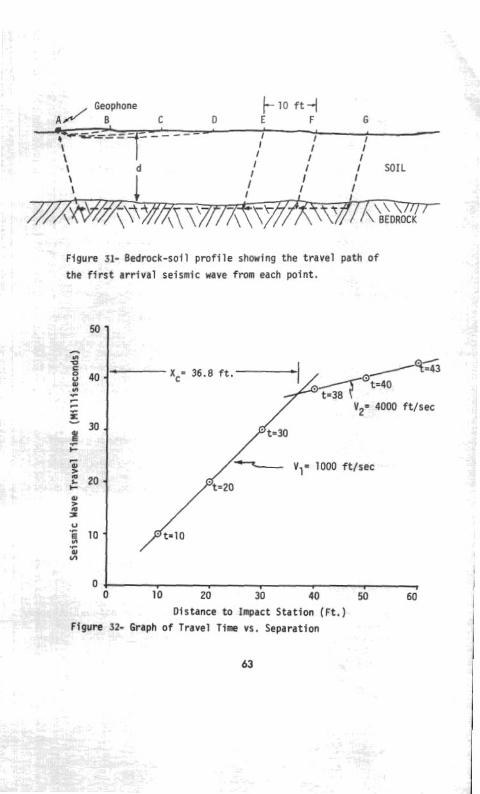
A / Ge;,phOne
t - 1 0 ft4 C D E F G
-z:-Lf - - - - - ' I I - \ I
I I
I I
\ I \ I
I I
1" I S O I L
\ I I I \ I I I
WYA?Y&TT~[/~.\TY~~~~ \\ / A \?,/I\ ~skic'l" Figure 31- Bedrock-soil p r o f i l e showing the t rave l path of
the f i r s t a r r i v a l seismic wave from each po int .
I I 0 10 20 30 40 50 60
Distance to Impact S ta t ion ( F t . ) Figure 32- Graph of Travel Time vs. Separation
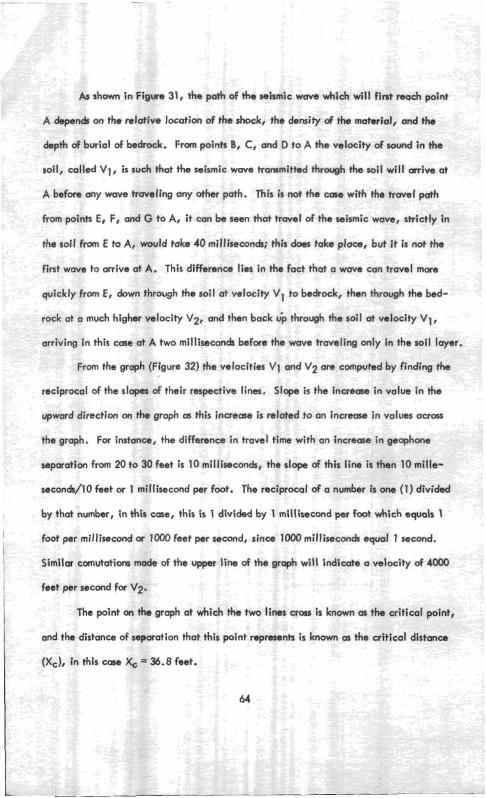
As shown i n Figure 31, the poth of h e wfsmic wave which will first reach point
, A depndr on the relative location of the shock, h e density of the material, and tha
depth of burial of bedrock. From points B, C, and D to A the velocity of sound in the
soil, called V1, is such that the seismic wwe transmitted through the soil wi l l m i v e at
A before any wave traveling any other path. This is not the cise with the travel path
from points E, F, and G to A, i t can be seen that trcwel of the seismic wave, strictly in
the soil from E to A, would toke 40 milliseconds; this doas take place, but i t is not the
first wave to arrive at A. This difference lies in the fact that a wave can travel more
quickly from E, b w n through the soil at velocity V, to bedrock, then through the bed-
rock at a much higher velocity V2, and then back ip through the soil at velocity V1,
arriving in this case at A two millisecondr b e f m the wave traveling only in the soil layer.
From the graph (Figure 32) the velocities V1 and Vq are computed by finding the
reciprocal of the slope of their rsrpt t lve lines. Slope is the increase in value in the
*ward direction on the graph a this increme is related to on increeae in values across
the graph. For instance, the difference in travel time with an increose i n geophone
separation from 20 to 30 feet is 10 milliseconds, the slope af this line is then 10 mille-
secon&/lO feet or 1 millisecond per foot. The reciprocal of a number is one (I) divided
I by that number, i n this case, this i s 1 divfded by 1 m i l l i w c ~ d per foot which equals 1
' foot per millisecond or 1000 feat per second, sinm 1000 milliwconds equal 1 second.
Similar cmuta t im made of the upper line of h e graph wi l l indicate a velocity of 4000
feet per second for V2.
The point on the graph at which the two lines cross is known m the critical point,
and the distance of separation that this point represents is known as the critical distance
(X,), in this ccae Xc = 36.8 feet.
44
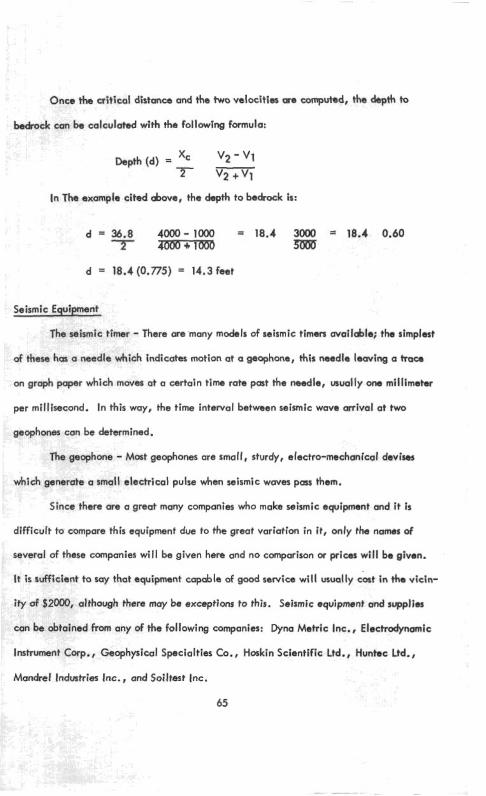
Once the n i t ica l dfstmee and thcr two velwitiss are eompubd, the &pth to
bdrock can be calculated wlth the following formula:
b p t h (d) = Xc "2 - "1
T- %Ti In The example cited above, the depth to bdrock is:
d 36.8 4000- 1000 = 18.4 3000 18.4 0.60 7 4000*1000 rn
d = 18.4 (0.775) 14.3 feet
Seismic Equipment
The seismic tfmer - There are many models of seismic timers uvoilabla; the simplest
of these has a needle which indicates motion at a geophone, this needle leaving a tmca
on graph paper which moves at a certain time rota part the needle, mually o m rnill1mehr
per millisecond. In this way, the time interval between seismic wcwe clrrival at two
geophones can be determined.
The geophone - Most geophones are small, sturdy, electro-mechanical davfms
mall electrical pulse when seismic waves pars them. which g,
Since there are a great many companies who make seismic equipment and It is
difficult to compare this equipment due to the great variation in it, only the names of
several of these companies wi l l be given here and no comparison or prices wi l l be given.
I t is sufficient to say that equipment capable of gcod service wi l l usually cost i n the viein- I
ity of $2000, although there may be excepHons to this. Seismic equipment ond svpplim
from any of the following companies: Dyna Metric Inc., Electrodynamic
n r ~orp . , Eeophysicol Specialties Co., Hakin Scientific Ltd., Hunkc Ltd.,
Mandrel Industries Inc, , and Soiltest Inc.
can be (
Instruma
Gecdcience Incorporated and Mandrel Industries Incorporated rent seismic
equipment. Geoscience Incorporated also offen contract crew for refraction seismic
for mining and engineering applications.
AIRBORNE GEOPHYSICS
Applicatians and Types
The principal ebjective of airborne geophysia i s the separation of armm which
-par to be barren from those which appear to hold promise of ore. In addition, a
7siderable amount of regional structural information can be obtained from airborne
muremenk. Airborne work permits rapid accumulation of data over very large areas.
Therefore, the costs of airborne surveys per line mile are many times smaller than the
costs of corresponding ground surveys, provided that the area being surveyed i s large.
Fixed costs of airborne surveys usually rule them out for use in small areas. Aerial
work can be carried out over areas covered with allwium, lakes, glcicicrs, swamps,
etc., to which access may be difficult for ground parties.
Costs of airborne surveys depend upon a number of factors:
1. Size of the proiect.
2. Logistics.
3. Instrumentation.
4. Type of aircraft.
5. Topography.
Airborne geophysical .methods may be classified as magnetic, electromagnetic,
and radiometric. There are available on the market a great many variatiom to each of
these methods. Only the basic approach for the general methods w i l l be discussed.
gnetic Metl
Magne
bods - tic instrumenk measure variations in the local geomagnetic field which
67
are produced by differences in the intensity of magnetization in various rock formations.
The magnetic method i s a valuable tool, therefore, for regional geological mapping.
Comcted data are plotted on map, and the maps are evaluated, often resulting in
good "guesses" a to the regional geology of the area being flown. Ground geologic
mapping programs are greotly assisted when airborne magnetic maps are available.
Canada has published an enormous number of magnetic maps through the office
of the Geological Survey of Canada. These maps outnumber those produced by all
other countries of the free world.
Electromagnetic Methods
Al l electromagnetic systems detect the presence of electrically conductive
material by memuring the change that takes place in the mutual coupling between
two coils when they art brought near conductive material. A variety of oirborne
electromagnetic system ore available, differing i n the aircraft employed, frequencies,
coil separations, flight height and so on.
Electromagnetic systems employ 0 transmitting and receiving coil; i f the trans-
mitting coil i s carrying an alternating current, i t wi l l create an electromagnetic field
which induces a voltage in the receiving coil proportional to the mutual coupling
between coils. This coupling i s inductive; the induced voltage must, therefore, be
in phme with the electromagnetic field and the current in the transmitting coil.
I f conductive material i s brought into the vicinity of the coil sptem, i t wi l l
introduce additional coupling between the coils. The additional voltage induced in
the receiver coil produces components both i n phme and cpadrature (9W out of phase). I
Both of these components are used as the "detector" in many electromagnetic systems. I
Graphite, ~yrrhotite, pyrite, chalcopyrite, galena and magnetite are good 1 I
conductors of electricity, while hematite, zinc blende, braunite and chromite are
almost insulators (Parasnis, 1968). Ores not directly suited to electromagnetic detection
found with this method, i f suitable quantities of an accessory mineral having good
,,,,,. ,<a1 conductivity are contained i n the deposit.
False anomalies may result due to beds, faults, fractures in the bedrock,
zones of crushed rock, fissures bearing conductive water, etc. These anomalies may, in
aes, have an indirect connection with ore deposits.
Deeth ~enetration of slectromcgnetic methods i s limited. There is considerable
controv rning the actual depths which may be reached by the various airborne
systems. L v l , ~ u s n n y the depth is less than 500 feet; probably 200 to 300 feet i s more
. . 'ersy conce:
re-'-:- 1,
realisti
The ultimate result of an airborne electromagnetic survey is, of course, the map,
which 1 r mineral exploration.
Radioactive Methods
Scintillation counters have been developed which differentiate counts due to
radiation from different elements. It is, therefore, possible to obtain individual counts
for pot( nium and t l
. . 0
rorium. These counts art mapper s high i n any
of the tnrea emments srana out as anomalies. Radioactive mstnom are also helpful for
geologic mapping. A l l rock, igneous cs well as sedimentary, contain traces of radio-
ucrlve
radioac
elements. I f the different rocks, strata and facies h w e significcmtly different
:tivity, the
led Method:
Each airbo
y can be distinguished and mopped.
I I
,me method wi l l produce an anomaly map. By combining magnetic,
69
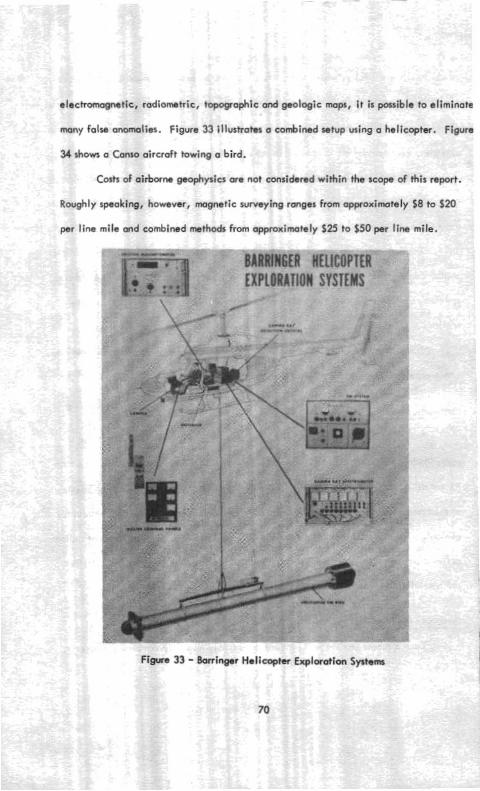
electromagnetic, radiometric, topographic and geologic maps, i t i s possible to eliminate
many false anomalies. Figure 33 illustrates a combined setup using 0 helicopter. Figure
34 shows a Canso aircraft towing a bird.
Costs of airborne geophysics are not considered within the scope of this report.
Roughly speaking, however, magnetic surveying ranges from approximately $8 to $20
per line mile and combined methods from apptoximtely $25 to $50 per line mile.
Figure 33 - Barringer Helicoptsr Exploration Systems
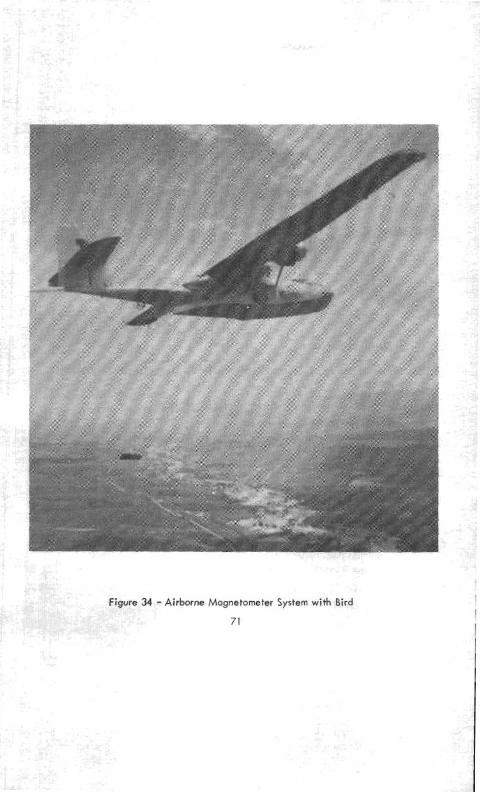
Figure 34 -Airborne Magnetometer System with Bird
71
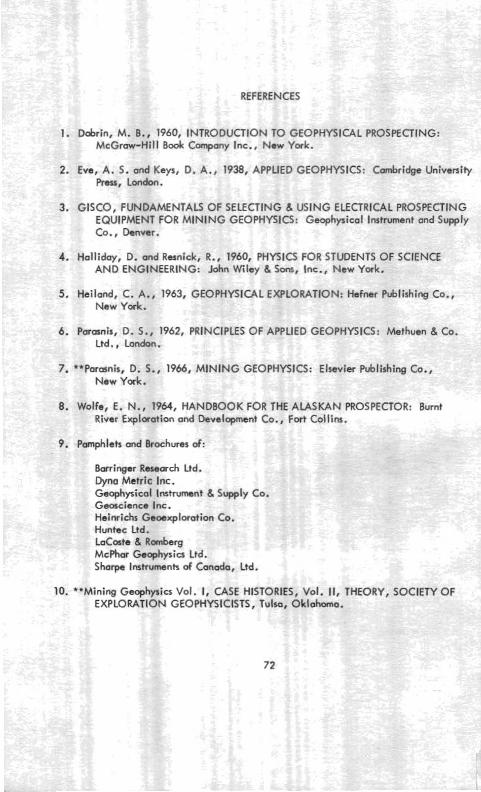
REFERENCES
1. Dobrin, M. B., 1960, INTRODUCTION TO GEOPHYSICAL PROSPECTING: McGraw-Hill Book Company Inc., New York,
2. Eve, A. 5. and Keys, D. A., 1938, APPLIED GEOPHYSICS: Cambridge University Press, London.
3. GISCO, FUNDAMENTALS OF S f LECTING & USING ELECTRICAL PROSPECTING EQUIPMENT FOR MINING GEOPHYSICS: Geophysical Instrument and Supply Co., Denver.
4. Hollidoy, 0. and Resnick, R., 1960, PHYSICS FOR STUDENTS OF SCIENCE AND ENGINEERING: John Wiley &Sons, Inc., New York.
5 , Heiland, C. A* , 1963, GEOPHYSICAL EXPLORATION: Hefner Publishing Co., New Yotk.
6. Paranis, D. S., 1962, PRINCIPLES OF APPLIED GEOPHYSICS: Methuen 8 Co. Ltd. , London.
7. **Paramis, D, S., 1966, MINING GEOPHYSICS: Elsevier Publishing Co., New York.
8. Wolfe, E. N., 196.4, HANDBOOK FOR THE ALASKAN PROSPECTOR: Burnt River Exploration and Development Co., Fort Collins.
9. Pamphlets and Brochures of:
Barringer Research Ltd. Dyna Metric Inc. Geophysical Instrument & Supply Co. Geoscience Inc. Heinrichs Geoexplorotion Co. Huntec Ltd. LaCoste & Romberg McPhar Geophysics Ltd. Sharps Instrument% of Canada, Ltd.
10. **Mining Geophysics Vol. I, CASE HISTORIES, Vol. II, THEORY, SOCIETY OF EXPLORATION GEOPHYSICISTS, Tulsa, Oklahoma.
Ludwig, C. S., and Henson, H. K., THEORETICAL INDUCED POLARIZATION AND RESISTIVITY RESPONSE CURVES FOR THE DUAL FREQUENCY SYSTEM, COLLINEAR DIPOLE-DIPOLE ARRAY, Heinrichs Geoexplorbtion Co., Tucson, Arizona.
""Very highly recommended to those who desire a thorough undentcmding of the explwotion techniques.
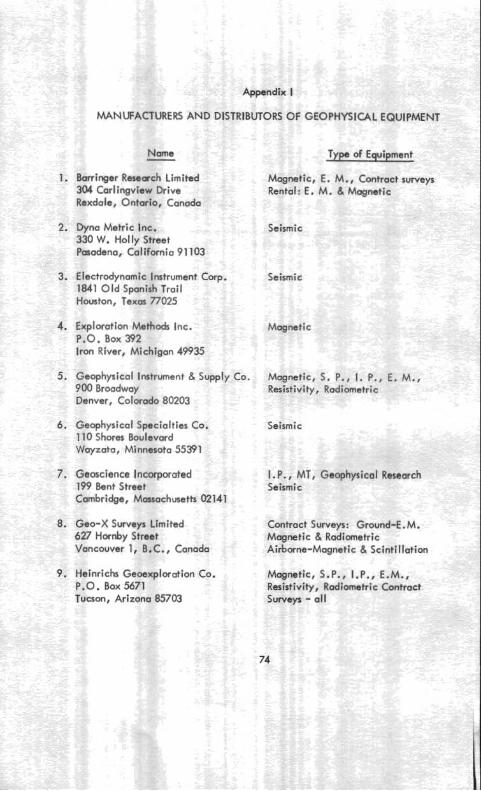
Appendix I
MANUFACTURERS AND DISTRIBUTORS OF GEOPHYSICAL EQUIPMENT
1. Barringer Resemch Limited 304 Carlingview Drive Rexdale, Ontario, Canada
2. Dyna Metric Inc. 330 W. Holly Street Pasadena, California 91 103
3. Electrodynamic Instrument Corp. 1841 O ld Spanish Trail Houston, Texas 77025
4. Exploration Methods Inc. P.O. Box 392 Iron River, Michigan 49935
5. Geophysical Instrument 8 Supply Co. 900 Broadway Denver, Colorado 80203
6. Geophysical Specialties Co. 110 Shores Boulevard Wayrata, Minnesota 55391
7. Geoscience Incorporated 199 Bent Street Cambridge, Massachusetts 02141
8. Geo-X Surveys Limited 627 Hornby Street Vancouver 1, B.C., Canada
9. Heinrichs Geoexploration Co. P.O. Box 5671 Tucson, Arizona 85703
Type of Equipment
Magnetic, E. M., Contract surveys Rental: E. M. 8 Magnetic
Seismic
Seismic
Magnetic
Magnetic, S. P., I. P., E. M., Resistivity, Radiometric
Seismic
I. P., MT, Geophysical Research Seismic
Contract Surveys: Ground-E. M. Magnetic & Radiometric Airborne-Magnetic B Scintillation
Magnetic, S.P., I.P., E.M., Resistivity, Radiometric Contract Surveys - a11
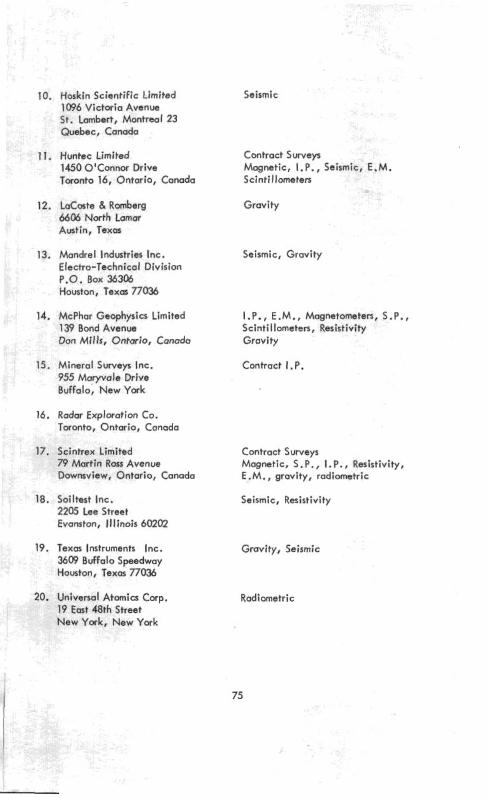
10. Hoskin Scientific Limited 1096 Victoria Avenue St. Lambert, Montreal 23 Quebec, Canada
11. Huntec Limited 1450 O'Connor Drive Toronto 16, Ontario, Canada
12. LaCoste 8 Romberg 6606 North Lamar Austin, Texas
13, Mandrel Industries Inc. Electro-Technical Division P.O. Box 36306 Houston, Texm 77036
14. McPhar Geophysics Limited 139 Bond Avenue Don Mills, Onturlo, Canodrr
15, Mineral Surveys Inc. 955 Maryvale Drive ~uffalo, New York
16. Radar Exploration Co. Toronto, Ontario, Canada
17. Scintrex Limited 79 Martin Ross Avenue Downsview, Ontario, Canada
Soiltest Inc. 2205 Lee Street Evonston, ll linois 60202
19. Texas Instruments Inc. 3609 Buffalo Speedway Houston, Texas 77036
Universal Atomics Corp. 19 East 48th Street New York, New York
Seismic
Contract Surveys Magnetic, I. P., Seismic, E.M. Scintillometers
Gravity
Seismic, Gravity
I. P., E .M., Magnetometers, 5 . P., Scintillometers, Resistivity Gravity
Contract I. P.
Contract Surveys Magnetic, S .P., I. P., Resistivity, E .M., gravity, radiometric
Seismic, Resistivity
Gravity, Seismic
Radiometric
75
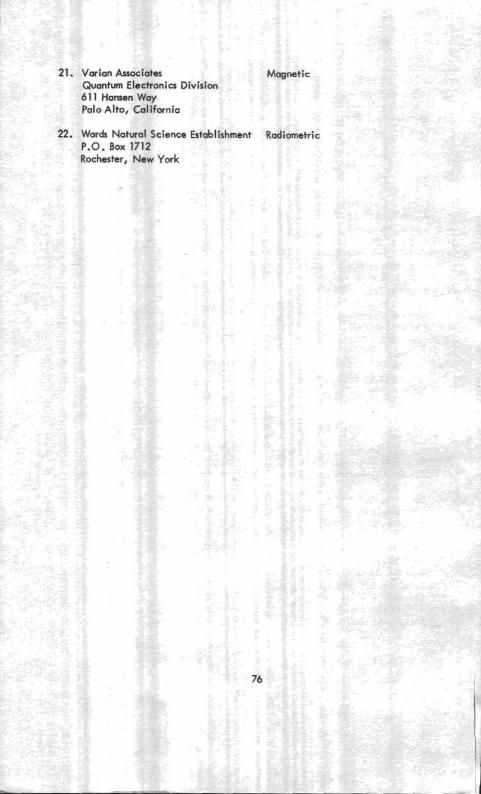
21. Varian Associates Magnetic Quantum Elachoniu Division 61 1 Hansen Way Palo Alto, California
22. War& Natural Science Establishment Radiometric P.O. Box 1712 Rochester, New York
Appendix I I
TERMS AND GENERAL APPLICATION
INDUCED POLARIZATION - Generally used to locate disseminated sulfide ores.
SP - SELF POTENTIAL - Used in the search for subsurface sulfide mineralization.
RESISTIVITY - Mtasums resistivity of subsurface rocks. Often u ~ d in conjunction with SP and IP.
MAGNETIC - Methods employ a magnetometer. A general purpose tool for most mineral surveys.
EM - ELECTROMAGNETIC - Generally used to locate subsurfc~ce massive sulfides.
GRAVITY - Helpful in o i l prospecting. Can be useful in mineral property evaluation.
RADIOMETRIC - b f u l in the search for radioactive ores.
iMIC - Most common application i s in the petroleum indusky.