Embed Size (px)
Citation preview
Of Donor Coordination, Free-Riding, Darlings, and Orphans: The Dependence of Bilateral Aid
on Other Bilateral Giving
Ronald B. Davies Stephan Klasen
CESIFO WORKING PAPER NO. 4177 CATEGORY 7: MONETARY POLICY AND INTERNATIONAL FINANCE
MARCH 2013
An electronic version of the paper may be downloaded • from the SSRN website: www.SSRN.com • from the RePEc website: www.RePEc.org
• from the CESifo website: Twww.CESifo-group.org/wp T
CESifo Working Paper No. 4177
Of Donor Coordination, Free-Riding, Darlings, and Orphans: The Dependence of Bilateral Aid
on Other Bilateral Giving
Abstract Using data from 1988 to 2007, we examine to what extent bilateral aid flows of an individual donor to a country depend on aid flows from all other bilateral and multilateral donors to that country. We thereby want to assess to what extent donor coordination, free-riding, selectivity, specialization, and common donor motivations drive bilateral aid allocation as these determinants would point to different dependence structures. Using approaches from spatial econometrics and controlling for endogeneity, we find that other bilateral flows lead to a significant increase in aid flows from a particular donor. The effects are particularly pronounced for recipients in Africa and the Middle East and so-called donor ‘orphans’ who seem to be collectively shunned by bilateral aid donors. The positive dependence also seems be related to donors following the lead of the largest donors. Over time, the positive dependence has become smaller. Overall the results suggest that donor coordination and free-riding are quantitatively less important than common donor interests and selectivity.
JEL-Code: F350, F420.
Keywords: aid, donor coordination, aid darlings, aid orphans.
Ronald B. Davies University College Dublin
Ireland [email protected]
Stephan Klasen University of Göttingen
Germany [email protected]
March, 2013 We would like to thank Axel Dreher, Paul Collier, Michael Grimm, Anke Hoeffler, participants at workshops in Oxford, Namur, Marburg, Dublin, Berlin, and The Hague for helpful comments on earlier versions of this paper.
2
1. Introduction Foreign aid continues to be the most important form of capital flow to a large number of poor
countries, particularly in Africa; for many more, it remains a significant flow, although FDI and
debt flows have increased substantially recently. Foreign aid is given by an increasing pool of
donors, often allowing countries to choose from (or, as the case may be, be forced to deal with)
hundreds of potential donors to fund their budgets, programs, and projects (World Bank, 1998);
in fact, the number of donors has dramatically increased in past decades, with new entrants
including several new regional development banks, new bilateral donors, global funds, large
philanthropic foundations, and a myriad of NGOs of all sizes (Fuchs, Dreher, and Nunnenkamp,
forthcoming); as a result, there is increasingly less of a “cartel of good intentions” (Easterly
2002) and instead a highly fragmented aid landscape which is increasingly difficult to negotiate
for both donors as well as recipients (Harford, Hadjimichael, and Klein, 2010).
Without effective coordination, such fragmentation can have a range of negative effects.
First, it may lead to situations where recipients will be favoured by most donors and become so-
called donor “darlings” while others are largely deserted by the international community and are
therefore aid “orphans” (Levine and Dollar, 2005, Rogersen and Steenson, 2009; Ansoms,
Cassimon, and Marysee, 2007; Utz, 2009). The recent focus on selectivity to improve aid
effectiveness could increase this problem of ‘darlings’ and ‘orphans’ as some of the findings
suggest that for aid to be effective it should be focused on those countries with particular
characteristics, such as the combination of high poverty and a good policy environment, better
institutions, or poor MDG achievement levels (Burnside and Dollar, 2000; Collier and Dollar
2001, 2002, Wood, 2008).2 In fact, donors are now being ranked for their policy selectivity (e.g.
2 Note that there is a large literature suggesting that the findings from Burnside and Dollar are not robust. But several of those papers suggest other ways of how more selective aid could be more effective. For a discussion, see Easterly, Levine and Roodman (2003), Roodman (2007) or Nowak-Lehmann et al. (2012).
3
Knack et al. 2011), thereby providing explicit incentives to focus aid on ‘darlings’ with good
policies and neglect ‘orphans’.
Second, uncoordinated fragmented aid could lead to substantial aid volatility for recipient
countries which has been found to be growth-reducing in recipient countries in a number of
studies which have carefully investigated the issue and studied various transmission mechanisms
through which volatile aid reduces growth in recipient countries (e.g. Bulir and Hamman, 2008;
Arrellano et al. 2009; Kathavathe and Mallik, 2012).3
Third, fragmented aid can cause massive transactions costs on all sides, tax the capacity of
recipient governments, and lead to a loss of qualified staff to donor agencies to manage these
many projects. This problem has been described in detail for years (e.g. World Bank 1998).
Knack and Rahman (2008) have shown that such fragmentation indeed lowers bureaucratic
quality in recipient countries and Kimura et al. (2012) have shown that a proliferation of donors
in a country is leading to lower growth.4
Of course, all of these problems would be much less severe if this aid coming from so many
donors was well-coordinated, predictable, and used joint approaches and country systems to
reduce the management burden. Recognizing the potential damage of fragmented and volatile
aid flows, the 2005 Paris Declaration on Aid Effectiveness and the 2008 Accra Plan of Action
called on donors to better coordinate their aid, make aid flows more predictable, pool aid flows
in country-led programs, and use country systems for aid management. To facilitate this process
of alignment and harmonization, donors were encouraged to specialize by concentrating their aid
on fewer countries, and fewer sectors within countries, in line with their comparative advantage.
For example, among bilateral donors organized in the OECD-DAC, lead donors have been
3 See Chauvet and Guillamont (2008) for a different view that suggests that some aid volatility might actually be desirable and that volatile aid is particularly problematic if it is pro-cyclical with respect to other capital flows. 4 See also Dreher et al. (2012) on this issue with related findings.
4
appointed for particular sectors in countries that should coordinate the aid, and the number of
actors in each sector should be reduced (OECD, 2009).
Most observers find that these goals still remains largely elusive. Aldasoro, Nunnenkamp,
and Thiele (2011) find that, at least up until 2006, there was little progress on donor coordination
and specialization (reducing the proliferation of donors at the country level). Bulir and Hamann
(2008) find that aid has become more volatile in the late 1990s and early 2000s when the first
initiatives to improve donor coordination and increase its predictability were already under-way.
Donor rankings based on the 2007 data also suggest that much work remains to be done here
(Knack et al. 2011). At the same time, Angeles et al (2008) have found that the direction of
change has been in the direction of greater selectivity, certainly with respect to a poverty focus
but also with respect to institutional quality.5
All of these developments take place against the backdrop of the now well-known findings
on aid allocation showing that (bilateral) aid is (and has long been) granted not only for
economic and altruistic motives, but that past colonial ties, strategic alliances, and trade
relationships affect aid flows (e.g. Alesina and Dollar, 2001; Hoeffler and Outram, 2008).6 The
interaction between donors in their aid allocation decision was not investigated in these studies.
In all these research and policy debates, the question of whether and to what extent aid from
a given donor depends on the allocation decisions of other donors is a critical but little
researched question. The way donors interact in their aid allocation decision will, however,
critically affect aid allocation, the nature and motives behind aid fragmentation, as well as the
interest of donors to take donor coordination, alignment, and specialization seriously. If donors
5 Greater selectivity of course could well go hand in hand with low coordination, fragmentation, little specialization, and high volatility so that these findings do not contradict each other. 6 See also Martinez-Zarzoso et al (2009) and Nowak-Lehmann et al. (2009) on the impact of bilateral aid on exports from the donor country, showing the relevance of aid to promote a trade relationship.
5
largely pursue donor-specific interests, we would expect little dependence; if they take
coordination and specialization seriously (or want to free ride on other donor giving), we would
expect a negative dependence between the given of individual donors. If selectivity is a
dominant motivation, there would be a positive dependence leading to the above-described
phenomenon of darlings and orphans. Thus the new agenda for aid effectiveness and associated
donor rankings, which emphasize selectivity as well as coordination and specialization, would
generate opposite effects on the dependence of bilateral giving. But whether these initiatives are
successful and will have the desired effects, will depend on a substantial degree on the motives
that shape the interaction between the giving of bilateral donors.
Despite the important of this issue for aid effectiveness, there exists remarkably little analysis
on how in actual fact aid allocation to particular countries is affected by aid flows from other
donors. While there are a large set of studies, following the pioneering work by Alesina and
Dollar (2001), examining bilateral aid allocation in general, only a study by Mascarenhas and
Sandler (2006) which examines to what extent the total aid flows of a donor and aid flows to
regions by a donor depend on giving by other donors, is similar in spirit to what we are doing
here. It finds that donors view giving by others largely as complementary which the authors
interpret to mean that it follows common underlying motivations (which are not controlled for in
the analysis). While the paper sets out a nice theoretical framework and provides an interesting
analysis of direct bilateral flows and bilateral contributions to multilateral aid, there are some
issues with the empirical analysis. First, it stops at the regional level and does not consider
country-level allocations; second, no other covariates from the aid allocation literature are
considered so that it is impossible to distinguish between common underlying drivers of aid
allocation and pure complementarity effects of giving; third, endogeneity is only cursorily
6
tackled, and all is estimated using a static model. Our study differs by first looking at country
allocations rather than overall or regional aid flows using a spatial econometric framework
(modelling the interaction of donors as a ‘spatial lag’), by examining a later time period (1988-
2007), by specifying a much more complete model of aid allocation using insights from the
literature, by using GMM procedures to deal with endogeneity, by also estimating a dynamic
model, and by providing a full set of robustness tests.
There is also a more recent study by Frot and Santiso (2011) which use measures from the
‘herding’ literature in finance to study whether there is herding in aid allocation. Their measure
of herding is to simply investigate the proportion of increases or (decreases) in aid allocations to
a country in comparison to average increases (decreases) to all countries. Using this approach
and only programmable aid (excluding humanitarian aid, debt relief and food aid), they find
substantial herding (though smaller than observed in financial markets). They then also control
for covariates that might affect increases or decreases in aid (such as conflict onset or end,
democratization, growth, foreign intervention, etc.) and find that these matter but do not affect
herding much, i.e. that herding remains nearly as strong as in the unconditional model. While
these findings are suggestive, there are a range of issues that remain unanswered. First, this
analysis only tackles directions of change without considering the magnitude of flows or aid
increases and decreases. It does not study how ‘herding’ changes over time in response to the
various policy initiatives discussed above, it does not control for the usual determinants of aid
allocation levels, and does not examine in more detail which donors are ‘leaders’ or ‘followers’
and how this herding differs among recipients.7 Our study differs from this paper by explicitly
controlling for the usual determinants of aid allocation, by considering different time periods, by
7 There are some studies that examine whether individual donors tie their allocation, in a form of bandwagon effect, on the giving of others. See Tarp et al. (1998) and Tezanos (2008) for examples. Our study differs by taking a much broader view on studying the dependence of bilateral aid in a much more general framework.
7
examining different recipient groups (esp. distinguishing between ‘darlings’ and ‘orphans’), and
by studying which donors seem to have a particularly strong effect on giving by others.
We find that there is a significant and rather robust (but relatively small) positive effect of
giving by others on the giving by bilateral donors. A 1% increase in aid by another donor leads
to about 0. 3% increase in own aid. The effect is particularly strong prior to 2000 and has
become weaker recently, suggesting some success in specialization and donor coordination. The
positive dependence of aid allocation is particularly large in Sub-Saharan Africa and the Middle
East, and is actually stronger and significant only for aid ‘orphans’ suggesting that donors are
jointly avoiding them. When using different weighting structures, we find that the positive
dependence is comparable with GDP and Population weights (rather than equal weights), with all
donors particularly following the allocation decisions of the 5 largest donors.
The paper is organized as follows. The next section discusses a theoretical framework,
section 3 presents the estimation strategy and the data, section 4 has the results, and section 5
concludes.
2. Theoretical Framework
In this study we focus on the dependence of bilateral aid giving on giving by others. This
does not cover the entire spectrum of aid flows, but focuses on one aspect. There are several
reasons for this choice. First, bilateral aid continues to be the by far the most important aid flow
to developing countries. While multilateral development banks (such as the World Bank and
regional development banks) also transfer substantial amounts of resources, much of that is in
the form of loans that are granted with near-market terms and conditions and thus do not qualify
as aid using the official OECD-DAC definition (where the resource transfer must contain at least
8
a 25% grant element). Further, country aid allocation using the soft loan windows of these
institutions (which does qualify as aid such as World Bank’ IDA loans) are driven by allocation
formulas (such as World Bank’s IDA allocation formula) that leave rather little room for
multilateral donor discretion. In contrast, donors have a great deal of discretion over the amount
and destination of their bilateral flows.8 The literature on aid allocation, starting with Alesina
and Dollar (2001), shows that the discretion is sizable, and differs among bilateral donors. We
will, however, consider whether multilateral aid to a country affects bilateral giving to that
country.
When examining the dependence of bilateral flows on other donor flows, one should first
distinguish between motivations by donors and motivations by recipients. Actual aid flows are
the outcome of a process of interaction between donors and recipients where both donor and
recipient interests play a role, with the actual outcome dependent on a range of factors that
include the bargaining strength of the two partners and the commonality or divergence of
interests.9
Starting with recipient interests, recipient governments, on the one hand, want to be as little
constrained as possible in their dealing with donors. Thus they would in principle prefer the
option to choose from a sizable number of donors to identify those that suit their needs; the
larger the potential donor set, the more likely they will be able to negotiate away undesirable and
onerous conditions. Thus the optimal number of donors for a recipient is likely to be
substantially larger than 1; at the same time, it is likely to be not very large due to the large
8 Non-governmental donors are generally too small to plausibly affect bilateral flows, although this might be changing currently as some of the large philanthropic funds are now drastically increasing their flows. Interestingly, NGO aid does not greatly differ in the allocation procedures and in fact appears to follow the aid allocation process of the donor country they are located in. See Dreher, Koch, Nunnenkamp, and Thiele (2008) for a discussion. 9 See Mosley, Harrington and Toye (1995) for a discussion of these issues in the context of structural adjustment policies.
9
bureaucratic costs of engaging with many donors that administer tiny aid programs in a large
number of countries.10
Regarding the dependence of bilateral aid flows on other bilateral giving, two potential
hypotheses are plausible. To the extent that recipient are interested in maximizing the
effectiveness of aid flows on development objectives, they would clearly prefer more donor
coordination, specialization, and low volatility of aid flows, i.e. these motivations would imply a
negative dependence of bilateral giving on the giving of others. The roles played by recipient
governments pushing for the Paris Declaration and the Accra Agenda clearly reflect these
interests.
On the other hand, to the extent that corrupt recipient governments are able to benefit from
unpredictable and volatile aid flows by diverting larger sums of donor aid to suit their own
needs, such governments might prefer more unpredictable aid flows (Kangoye, 2011). In those
cases, a positive dependence could be in the interest of such recipient governments.
On the donor side, the dependence on other bilateral giving will greatly depend on the overall
motivation of the donor to provide aid in the first place. Different motivations would imply a
different dependence structure.
A first approach, also discussed by Mascarenhas and Sandler (2006), is to consider
bilateral aid giving as a global public good. If it helps to promote the Millennium Development
Goals or raises incomes in recipient countries, all donor countries benefit as they all committed
themselves to promoting the MDGs and higher incomes in recipient countries will promote trade,
reduce migration flows from these countries, and generate similar desirable effects. In such a
setting, free-riding is clearly an issue. In fact, such free-riding would generate suboptimal total
aid flows. This is well-recognized and there are several approaches to the problem: the 10See also Dreher, Michaelowa, and Spörri (2012) for a related discussion.
10
multilateral organizations resort to contribution formulas to address the problem11, and the goal-
setting of bilateral flows (aimed to reach 0.7% of GDP of donor countries as reaffirmed in the
MDGs) is another (much less successful) attempt to circumvent the problem. Free-riding could
not only affect total aid flows, but also affect aid flows to particular recipient countries. The
more other donors give, the more one can free-ride on these contributions. One would thus
expect that free-riding would cause crowding out, or a negative relation of other donor flows on
one’s own aid commitment.
Donors may, however, pursue donor-specific motivations that go beyond the provision of
a global public good. Colonial ties, strategic and political interests, trade interests, and a donor’s
domestic political economy all may affect the priorities of aid allocation to particular recipients.
To the extent that these motivations vis-à-vis a recipient differ among donors, we would expect
then little dependence of aid flows on each other. A clear example would be colonial history
where each donor will have different aid allocation priorities with respect to a particular recipient
country based on its own history. To the extent the motivations such as strategic, political, and
commercial interests are similar across donors, however, and not well captured by our covariates
below, we might actually find a positive relationship of each other’s giving, or some crowding
in.12
Such crowing-in could also occur as a result of the increasing selectivity focus of donors
on countries with ‘good policies’ or those in high need. To the extent that these factors are not
captured in our covariates, we would expect donors to converge in their selection strategy on the
11 This is for example how the soft loan window of the World Bank, IDA, raises its funds from bilateral donors. 12 Of course, even if donor-specific interests predominate, donors might want to partly free ride on other country’s flows which would counteract such crowding in. But one might argue that free-riding is much less likely if these motivations dominate. For example, guilt associated with colonial history can hardly be reduced by aid flows from other donors; furthering bilateral trade or strategic interests will likely be jeopardized rather than helped by other bilateral flows (e.g. Martinez-Zarzoso et al. 2009); and even altruistic, humanitarian, or ideological motives cannot depend on other donor flows, particularly if the ‘warm glow’ of giving is an important aspect of this motivation.
11
same set of countries. This would, as discussed above, lead to both the phenomenon of
“darlings” and “orphans” as well as to a crowding-in of bilateral donors.13 As selectivity has
become an increasing focus of development cooperation in recent years, we would expect a
crowding-in to be particularly pronounced in more recent years, compared to earlier periods.
While the need and effectiveness arguments might be important drivers for selectivity,
selectivity might also be driven by a desire to associate one’s aid flows with positive
developments in poor countries. Countries with successful economic policies might attract more
aid to associate that success with these aid flows. This could strengthen a crowding-in in ‘donor
darlings’, and a collective flight from ‘donor orphans’ where difficult aid environments make aid
that much harder to achieve (Levine and Dollar, 2005).
Crowding-in could also be the result if donors compete with each other for attention of
more successful or politically or economically powerful countries. As other donors increase
their allocation, one might want to follow suit to maintain ties to these countries.14
Lastly, the Paris and Accra agendas on donor coordination, predictability and
specialization, if taken seriously, should affect the dependence of bilateral flows on each other.
As donors specialize, coordinate their aid and make it more predictable, higher flows from one
donor should lead to reduced flows from others, implying a negative relation between the flows
of an individual donor and those of all others.
Thus these theoretical considerations point to different plausible effects. While recipient
interests for predictability and the public good argument and the donor coordination argument
point to a negative relation between donors’ giving, the donor motivation and selectivity
13 Easterly’s (2002) suggestion of a cartel of good intentions would similarly lead to such a positive dependence on aid flows as donors act as a cartel to reward some recipients and shun others. 14 This might be of particular relevance as it has been shown that aid can promote exports from the donor while bilateral aid from other donors might reduce own exports (see Martinez-Zarzoso et al. 2009 and Nowak-Lehmann et al. forthcoming).
12
argument might generate a positive relationship. The relative importance of these effects might
also vary over time so that it becomes largely an empirical question to inquire which effects
dominate for different time periods and regions.
3. Estimation Strategy and Data
In this section, we describe our empirical methodology and our data.
3.1 Estimation Strategy
Our baseline specification estimates total foreign aid (or in some specifications, per-
capita aid) from donor d to recipient r in year t as a function of donor characteristics Donord,t,
recipient characteristics Recipientr,t, donor-recipient variables Paird,r,t and a time trend:
, , 0 1 , 2 , 3 , , , ,d r t d t r t d r t t d r tAid Donor Recipient Pair Trend (1)
where , ,d r t is the error term. Our control variables are drawn from the existing literature and are
described below. We then modify this by including the aid from other donors to country r in year
t, a variable known in the spatial econometrics literature as the spatial lag. Specifically, with N
donors, we estimate:
, , 0 , , , , 1 , 2 , 3 , , , ,d r t d i t i r t d t r t d r t t d r ti d
Aid w Aid Donor Recipient Pair Trend
(2)
where , , , ,d i t i r ti d
w Aid is a weighted average of ODA by other countries.15 In the baseline
specification, we assume that all donors receive equal weights so that , , 1/ 20d i tw for all i,t. In
robustness checks, we experiment with a range of different weighting structures. Clearly, if aid
from i impacts country d and vice versa, the spatial lag is endogenous. In addition, endogeneity
can arise due to an uncontrolled for factor that appears in the error term which affects aid to a
recipient by all donors. To deal with this endogeneity, we use two stage least squares 15 When using equal weights, we could alternatively have used the sum of ODA by other donors, the results of which would be the same as scaling up the coefficient ρ by 20, the number of donors in our sample minus one.
13
instrumental variables estimation. Following standard spatial econometric procedure, for our
instruments we use ,i ti d
Donor and , ,i r t
i d
Pair that is, the average of the other donor’s
characteristics and the average of their pair-wise characteristics with the recipient in question.
The intuition behind these variables is that for a given donor i, donor and pair variables directly
impact aid by i and are unaffected by aid from d, and affect aid allocation of donor i only through
the endogenous variable.16 Therefore they are correlated with the endogenous variable but are
themselves exogenous, making them suitable instruments. Note that this instrumentation
strategy also has another important advantage for our analysis. It may well be the case that
donors respond collectively to unmeasured positive or negative features of a particular recipient
country in a given year (e.g. a new political leader, evidence of some corrupt practices, sudden
strategic attention or inattention of the recipient country in question) which would lead to a
positive dependence of bilateral aid that was driven by these unmeasured factors. By
instrumenting the spatial lag, we get rid of the influence of these unmeasured factors that could
bias upwards our coefficient on the spatial lag.
A second potential spatial issue is correlation across the error terms for a given recipient-
year. To this end, we cluster our error terms by recipient-year. Given our equal weights in the
baseline specification, this amounts to correcting for spatially correlated errors.
This baseline specification is modified in several ways, including a dynamic version of
the model, alternative weighting schemes in the spatial lag, period dummies, and different donor
and recipient categories, to explore the robustness of our findings. The specifics of these
modifications are described below.
16 To take an example, the exclusion restriction implies that the aid allocation of France to country i and period t is only influenced by the amount of funds given by other donors, not the average pair-wise determinants of giving those funds, such as the average distance of all other donors to that country.
14
2.2 Data
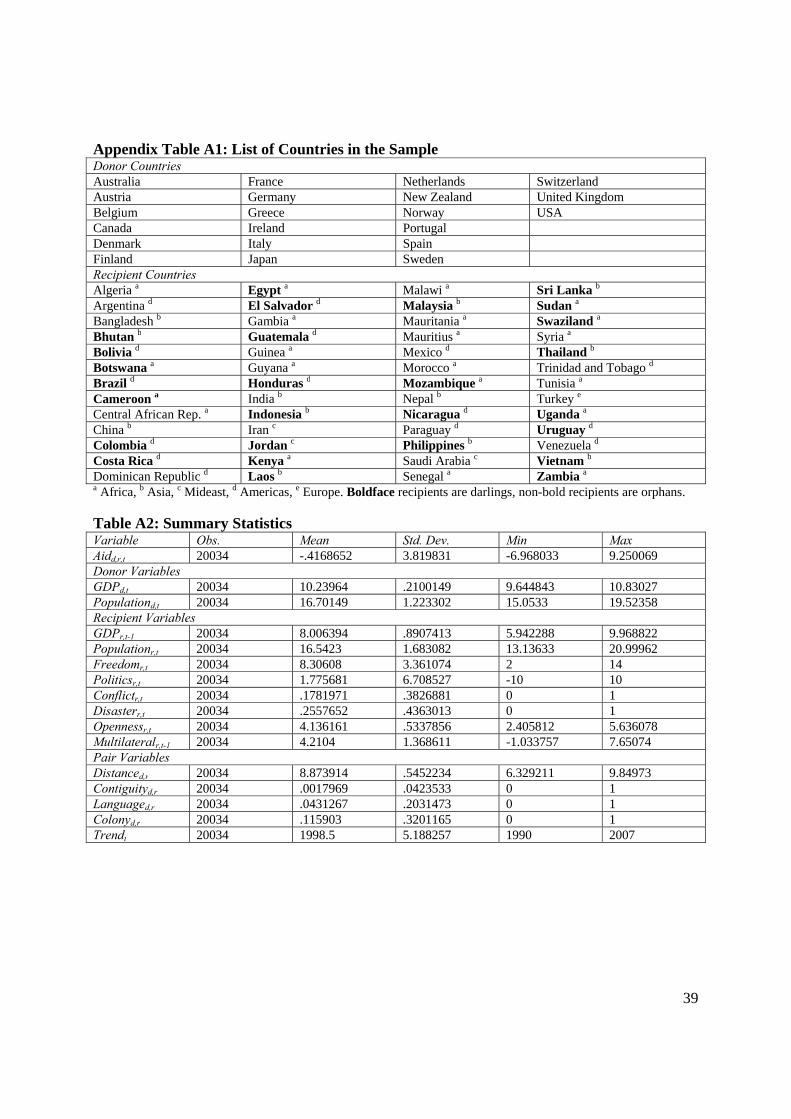
Our data are a panel of 21 donors and 52 recipients that runs from 1988 to 2007.17 The
list of donors and recipients are found in Table A1 of the Appendix.
Our dependent variable Aidd,r,t is the log of bilateral gross Official Development
Assistance disbursements from country d to r in t, as reported in the OECD DAC database, using
the official DAC definition of aid (i.e. flows that have a grant component of at least 25%).18 It is
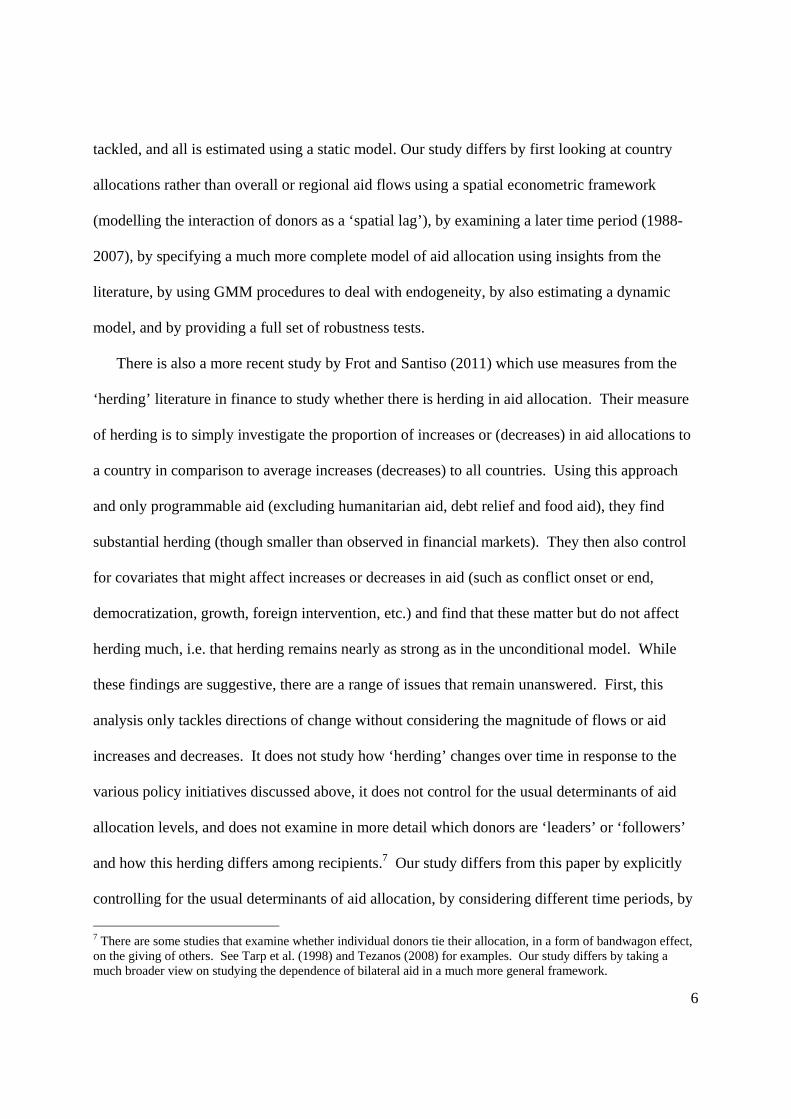
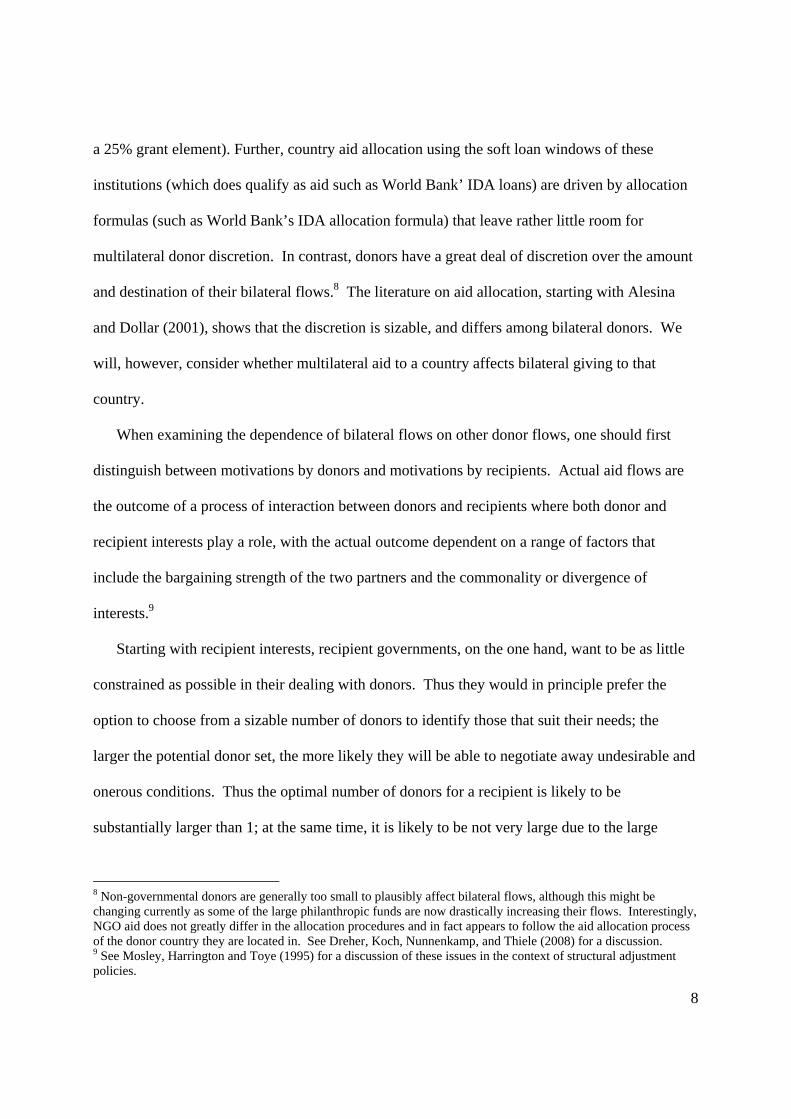
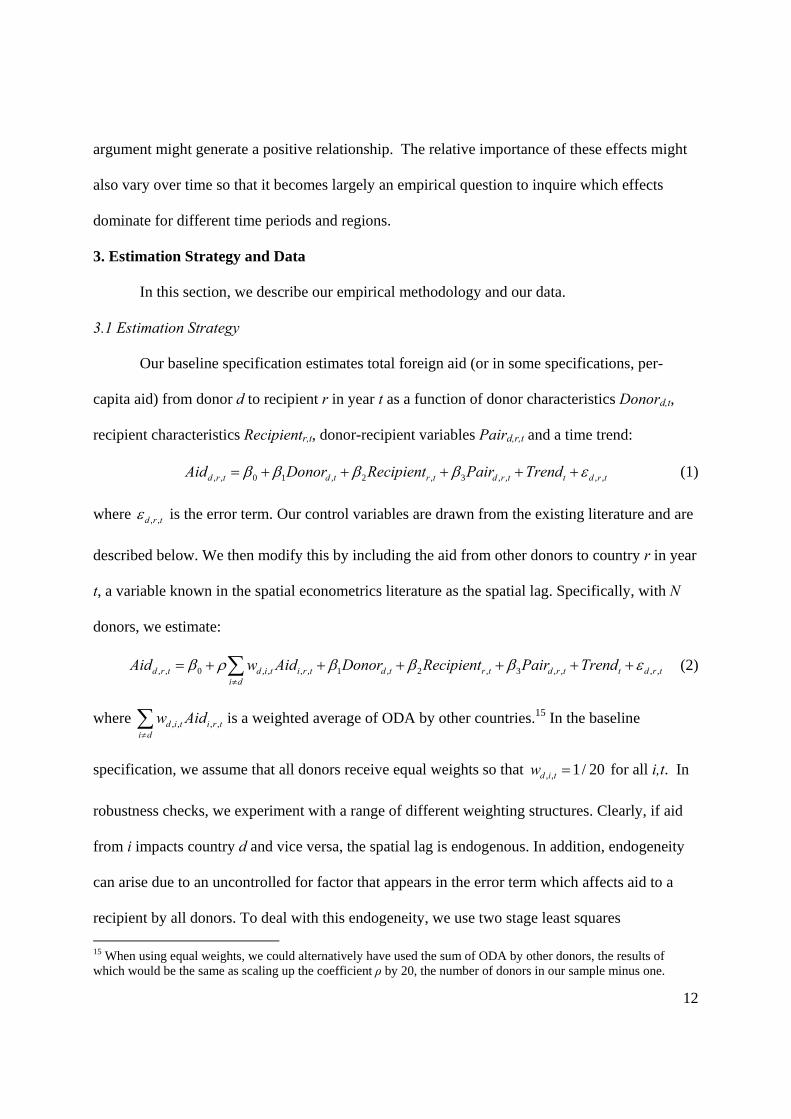
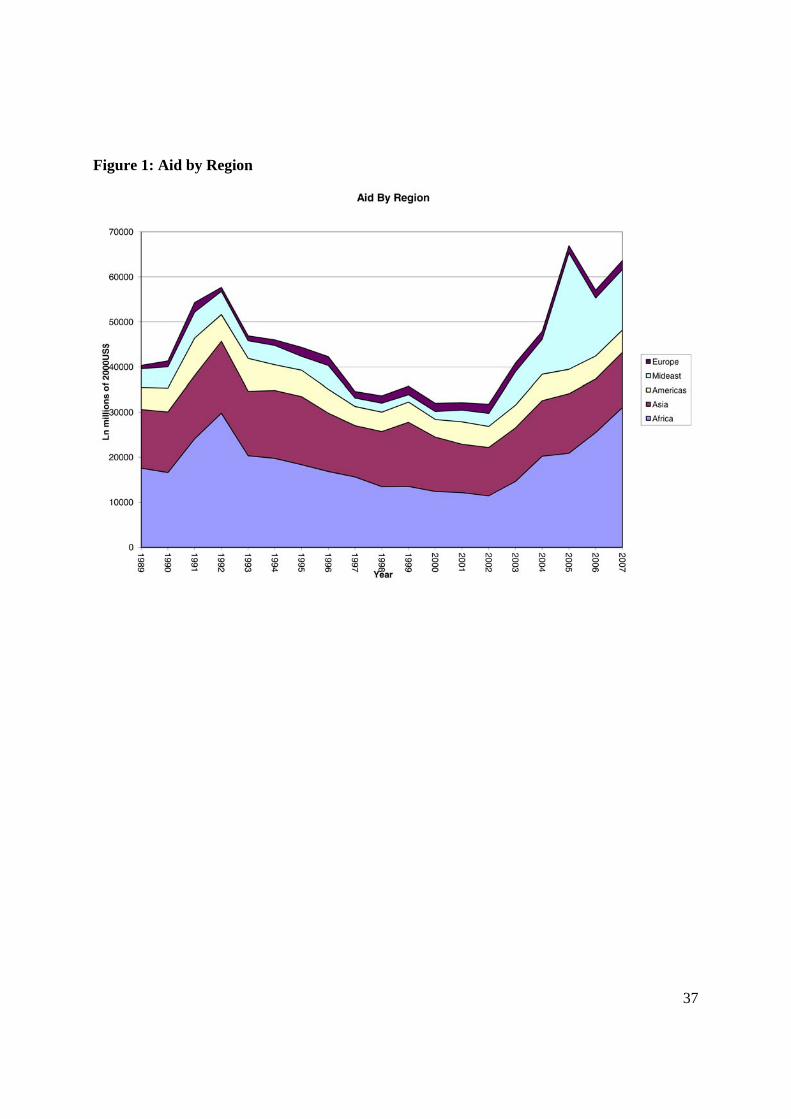
measured in millions of constant 2005 US dollars.19 Figure 1 indicates how total aid flows have
varied over time and across regions. As can be seen, the bulk of flows go to Africa followed by
Asia. Over time, there was a substantial decline in the real value of bilateral aid flows during the
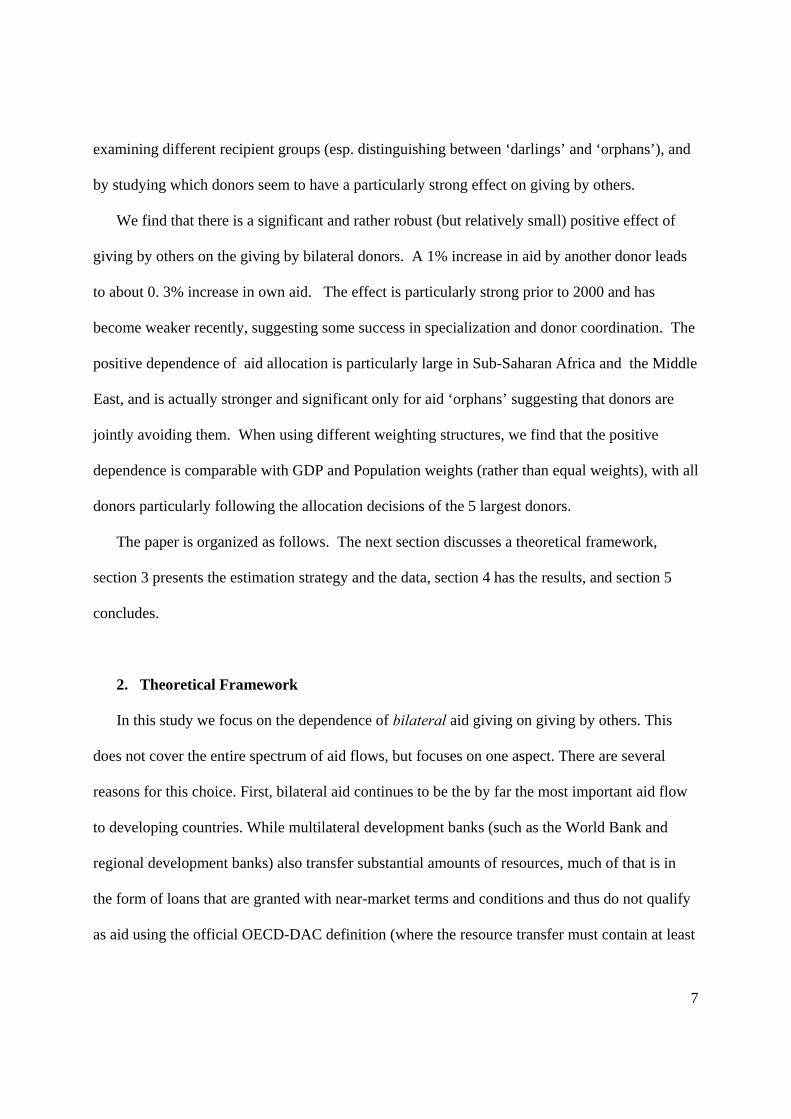
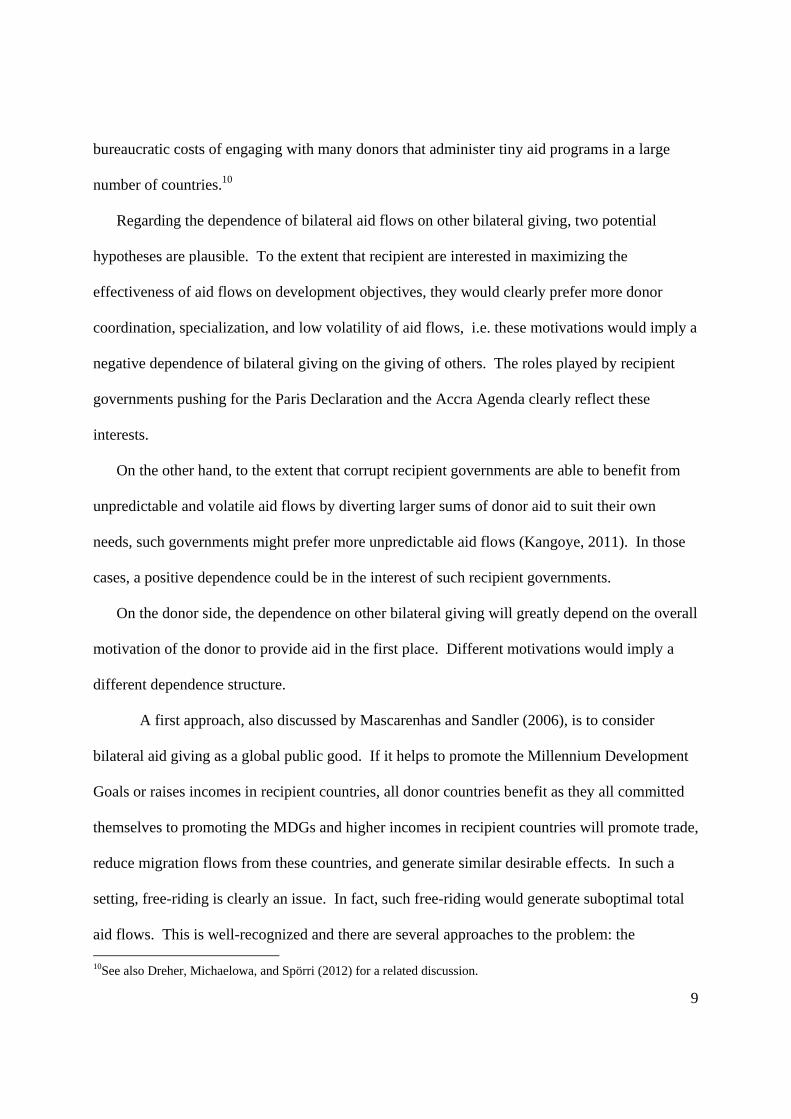
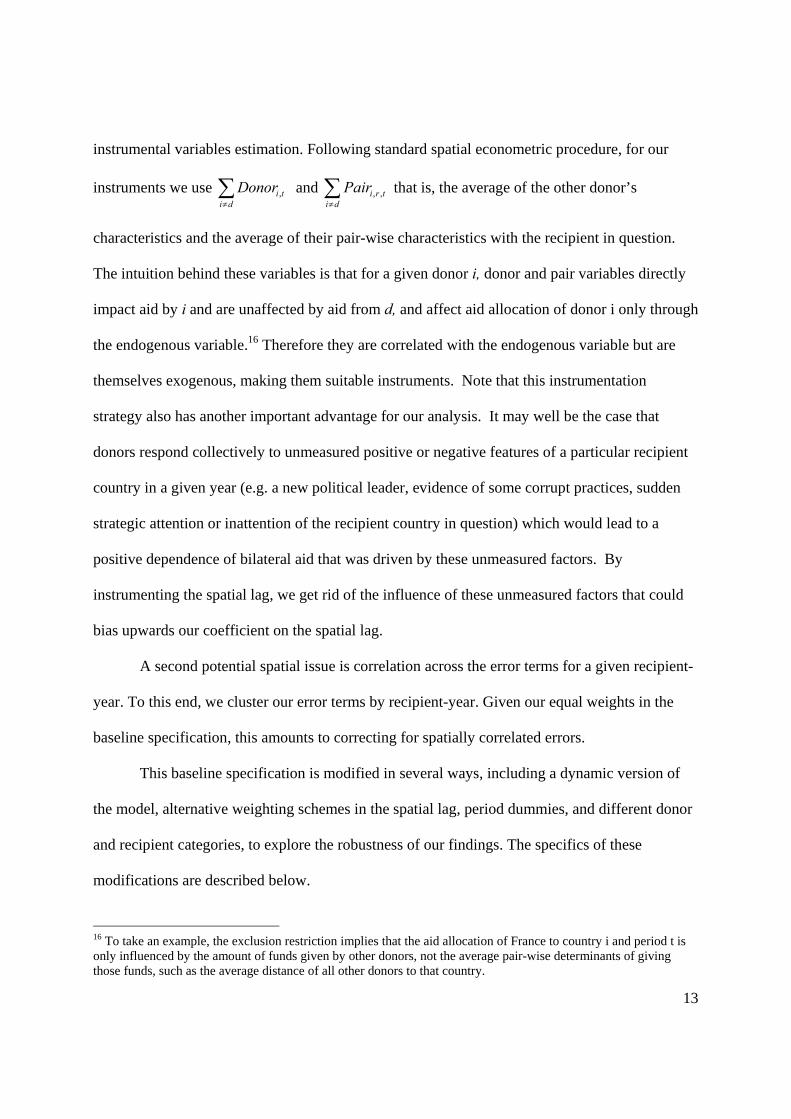
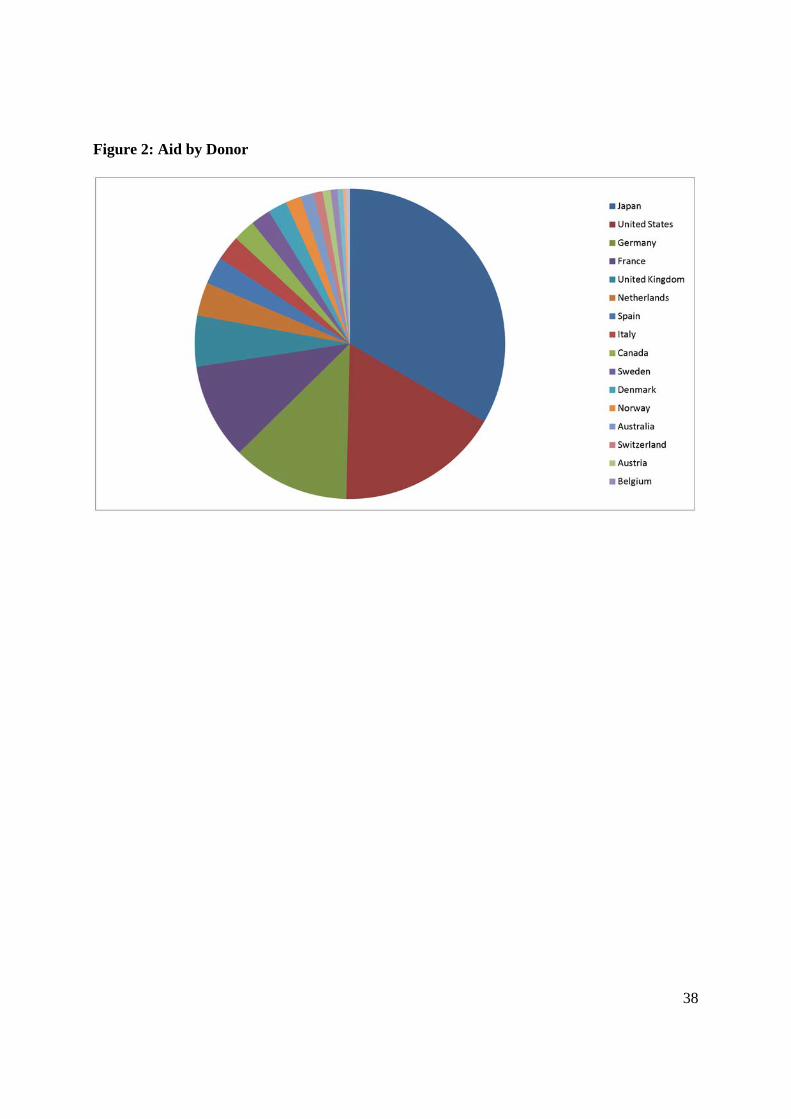
1990s, a trend which reversed itself during the 2000s. Figure 2 breaks down the average total
donations by donor. Japan leads the way with roughly 33% of ODA. This is followed by the US,
Germany and France, who jointly make up another 39% of flows. Note that these are only the
bilateral ODAs and do not include what donor countries provide to multilateral assistance
programs (the lag of which is a control variable).20
To control for the size of the donor country Donord,t includes GDPd,t and Populationd,t,
which are the log of real value of donor GDP and the log of donor population. Note that, as these
are logs, one can also interpret one of these as per-capita donor GDP. As with aid flows, GDP is
measured in real PPP-adjusted 2005 millions of US dollars. Consistent with the existing
17 In addition to these 52 recipients, we have data on a further 66 recipient nations. Here, we present results only for the strongly balanced sample where we have full data for each donor-recipient-year combination. One implication is that this eliminates countries which did not exist for the full sample. The cost of this is that we lose 13902 observations. The benefit is that it eliminates concerns that the results are driven by recipients/donors entering or leaving the sample. Nevertheless, the results from the full sample are comparable to those presented here and are available on request. 18 For values of reported aid that were missing or less than or equal to zero, we added .001 prior to taking the log. This represented 3777 observations of which three were zeros. 19 We utilized the consumer price deflator from the Economic Report to the President (2009). 20 In unreported results, we excluded potentially different recipients such as China, India, Mexico, and Saudi Arabia. This did not qualitatively affect the results.
15
literature (e.g. Fuchs, Dreher, Nunnenkamp, 2012) which finds that larger, wealthier economies
donate more, we generally anticipate positive coefficients for these variables. These data (and
their recipient counterparts) come from the World Bank’s World Development Indicators
database.
For the recipient country, we similarly include per capita GDPr,t-1 and Populationr,t, to
control for wealth and size. Following previous findings, we expect that more ODA goes to
larger but poorer countries; in per-capita terms, we would expect, however, that smaller countries
receive more aid/capita (e.g. Alesina and Dollar, 2001). Note that we lag recipient GDP to
reduce endogeneity. In addition to recipient size, we include several additional variables.21 Three
of these are intended to control for the nation’s political situation. Freedomr,t is the sum of the
political liberty and civil liberty scores from the Freedom House Index. Politicsr,t is the
difference between the democracy and autocracy scores from the Polity 4 Databank. Both
Freedomr,t and Politicsr,t are coded so that higher values mean less political freedom. Conflictr,t
is a dummy variable equal to one if the nation experienced a conflict within its borders that
resulted in at least 25 deaths during year t. Given that in nations with better institutions less ODA
may be diverted due to corruption, increasing the benefit from aid, we expect negative
coefficients on these variables. To deal with the likelihood that nations that have experienced a
natural disaster may receive more aid, we include a dummy variable Disasterr,t which takes on a
value of 1 if the recipient has experienced a disaster during the year that resulted in deaths of at
least 100 or of at least 0.1% of the population. These data come from the EMDAT database. In
addition, we control for Opennessr,t measured as the log of the sum of exports and imports
divided by GDP, obtained again from the WDI. In order to control for the influence of
21 When we omit these additional variables but include lagged ODA and recipient dummies, we find results for the spatial lag that are qualitatively comparable to the reported results, although the magnitude of the estimated coefficient varies.
16
multilateral aid flows to a recipient on its bilateral flows, we include Multilateralr,t-1 which is the
logged value of the multilateral aid received by recipient r in year t-1.22 These data come from
the OECD database.
We include several variables specific to a donor-recipient pair, all of which come from
the CEPII.23 Distanced,r is the great circle distance between the two capital cities (measured in
kilometres). We expect this to be negatively correlated with aid as donors focus on proximate
nations. In a similar vein, Contiguityd,r is a dummy variable equal to one if the two countries are
geographically contiguous. Languaged,r is a dummy variable equal to one if the two nations share
the same official language, a trait we expect to be positively correlated with aid flows. Finally,
Colonyd,r is a dummy variable equal to one if the two countries were ever part of the same
colonial empire. Since we expect donors to be particularly sensitive to the plight of nations with
which they share a history, we anticipate a positive coefficient for this variable, as has been
found in the literature (e.g. World Bank, 1998; Alesina and Dollar, 2001). Note that as these
latter three variables typically equal one for at most one donor for each recipient, we do not use
them to construct weighted averages for use as spatial instruments.
Finally, except as noted, we include both donor and recipient dummy variables to control
for donor or recipient specific, time-invariant characteristics in all regressions. Summary
statistics are found in Table A2 of the Appendix.
4. Results
4.1 Baseline Results
22 We use the lagged value to deal with potential endogeneity. When using the contemporaneous value of multilateral aid instead, similar results were found. 23 These data can be found at http://www.cepii.fr/CEPII/en/welcome.asp.
17
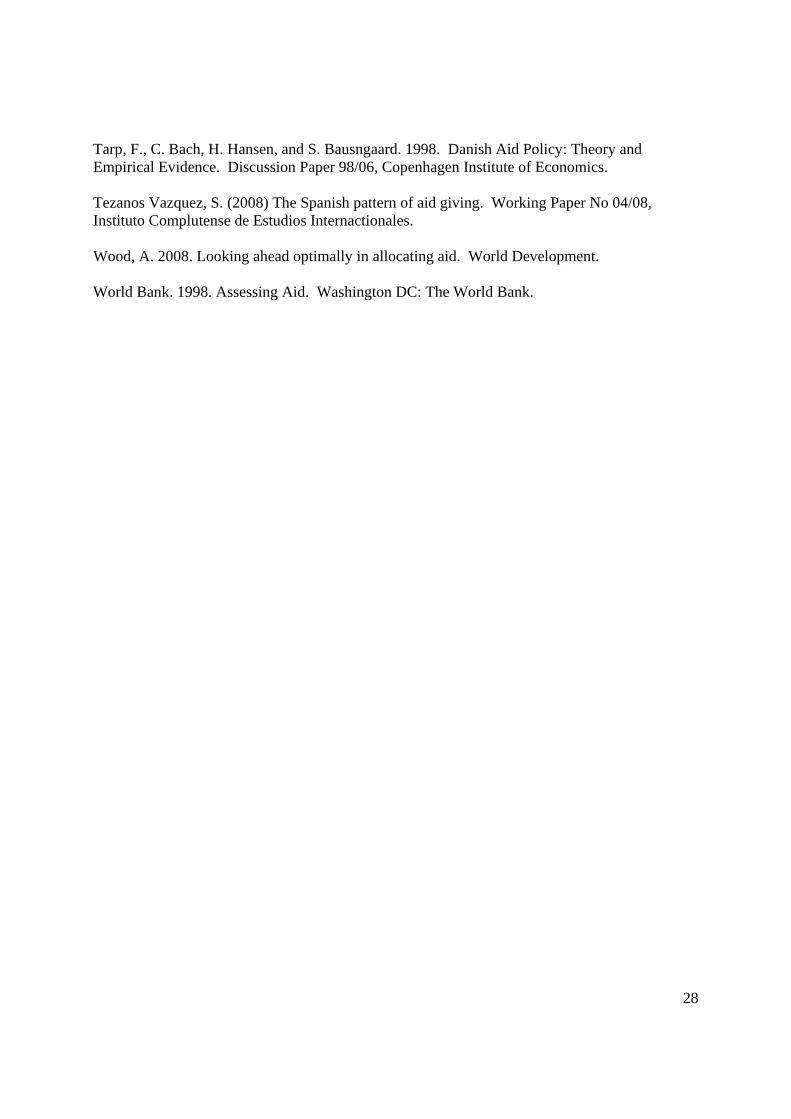
Table 1 presents our baseline results. Column 1 excludes the recipient dummies (but
includes donor dummies). Column 2 includes both donor and recipient dummies; the difference
should capture a range of unmeasured time-invariant recipient-specific effects that could affect
aid allocations. The coefficients suggest that more aid comes from larger donors both in terms of
GDP and population, a result very consistent across specifications. When not controlling for
recipient-specific fixed effects, more ODA goes to recipients with lower GDP and larger
populations (i.e. poorer countries). However, after controlling for recipient specific, time-
invariant effects, only the population effect holds. Likewise, although the institutional variables
are all matter in column (1), including recipient dummies eliminates their significance. As
expected, countries that have experienced a disaster receive more aid. In addition, more ODA
goes to recipients with greater multilateral aid flows although this effect becomes much smaller
once recipient-specific effects are controlled for. Turning to the pair variables, we find that more
aid occurs between donors and recipients that are proximate, share a common official language,
and have a common colonial tie. The qualitative nature of these estimates mirror those found
elsewhere in the literature (e..g Alesina and Dollar, 2001; Hoeffler and Outram, 2008).
In column 3, we introduce a lagged dependent variable which, unsurprisingly, is
significantly positive. Doing so eliminates the significance of some variables, such as recipient
population but improves that for others such as Freedom (where as in column (1) better
institutions are correlated with more aid). As this improves the fit of the model considerably, we
use a lagged dependent variable in the rest of the analysis. It is also worth noting that, using the
Fisher-type test, we reject the null of unit roots at the 1% level (Choi, 2001).
In column 4, we introduce the spatial lag which we instrument using the average of other
donors’ GDPs, population, and distance to the recipient. As reported at the bottom of Table 1,
18
our instruments easily pass the Kleibergen-Paap test for under-identification. Unfortunately, the
instruments do not satisfy the Hasen J test for overidentification. This latter problem plagues
many of our specifications. Nevertheless, it is worth noting that when we use a single instrument
(either the weighted average of other donors’ GDPs or their populations), thus exactly
identifying our specification, the qualitative results discussed below do not change.
With that caveat in mind, we now consider the changes including the (instrumented)
spatial lag causes. First, doing so returns recipient GDP and population to significance where
again the coefficients suggest that more aid goes to more populous, poorer countries. In addition,
more aid goes to more free countries, those more open to trade, those closer to the donor, and
those that share a common language or colonial history with the donor. In addition, when
including the spatial lag, the coefficient on multilateral aid becomes significantly negative,
suggesting some crowding out between multilateral aid and individual donor aid. Turning to the
spatial lag itself, we find a coefficient of 0.362 that is highly significant, suggesting that this
interaction is an important factor affecting bilateral aid allocation, a point not considered to date
in the standard aid allocation literature. To interpret this, recall that the spatial lag is the average
of other donors’ ODA to the recipient. Thus, if the average rises by 1%, the predicted ODA by
donor d would rise by 0.36%, a sizable effect.24 Alternatively, with 21 donors, this indicates that
if a single other nation increases its ODA by 1%, then donor d would increase its by .3/(21-1) =
.018%.
Finally, column 5 utilizes ODA per-capita rather than total ODA. As can be seen the
results are largely comparable with a highly significant spatial lag estimated at .358. This
suggests that the finding that aid by donor d rises by about .3% when average ODA by others
increases holds both in national totals as well as per person. 24 Note that the spatial lag is the sum of logs, not the log of sums, hence the elasticity interpretation.
19
Taken as a whole, these estimates reject crowding-out. If anything, they suggest a sizable
(but not very large) crowding-in effect. 25 This suggests that, overall, the selectivity, joint
interests, or cartel issues are more relevant empirically than free-riding in the provision of a
global public good or true donor coordination, predictability, and specialization following the
Paris Declaration.
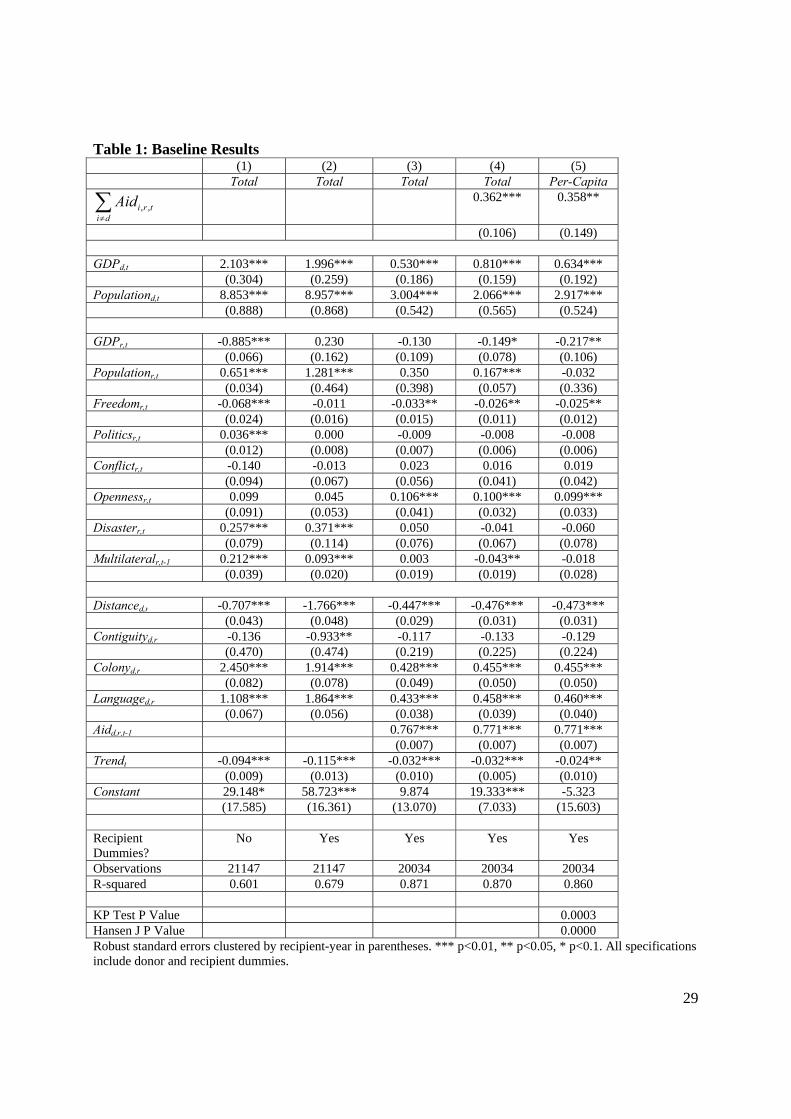
4.2 Alternative Weighting Schemes
In the baseline, we assume equal weights, that is, all donor countries have the same
impact on each other. Alternatively, it may be the case that some donors are more influential than
others. In Table 2, we explore this by using three alternative weighting schemes. In column (1)
we use GDP weights, i.e. ,, ,
,
i td i t
j tj d
GDPw
GDP
. In this case, while the weights a donor d assigns to
other nations still sum to one, larger nations receive more weight. In column (2), we instead
weight by population so that ,, ,
,
i td i t
j tj d
Popw
Pop
. In column (3), we use “Political Similarity”. This
is constructed using the 3 category “Affinity of Nations” data with interpolated values for the
missing observations.26 These data attempt to capture the similarity of state preferences based on
voting positions of pairs of countries (dyads) in the United Nations General Assembly. We then
standardize these so that the two donors with the least similar voting have a “political similarity”
of zero and construct weights according to ,, ,
,
__
i td i t
j tj d
Political similarityw
Political similarity
so that more donors
25 Our findings of positive dependence is also consistent with the findings from Mascarenas and Sandler (2006) and Frot and Santiso (2011) although we want to emphasize that our methods differ substantially and we control for many more factors affecting aid allocation which should therefore have lowered the positive dependence of aid flows. The positive dependence we still find is therefore substantially more robust than the findings in those papers. 26 Specifically, we use “s3un4608i”. These data, along with a full description of their construction is available at http://dss.ucsd.edu/~egartzke/htmlpages/data.html.
20
with more similar voting patterns receive greater weight. Unfortunately, as discussed by Anselin
(1988), there is no test for which is the “correct” weighting matrix. Thus, these alternatives are
presented as robustness checks of our results.
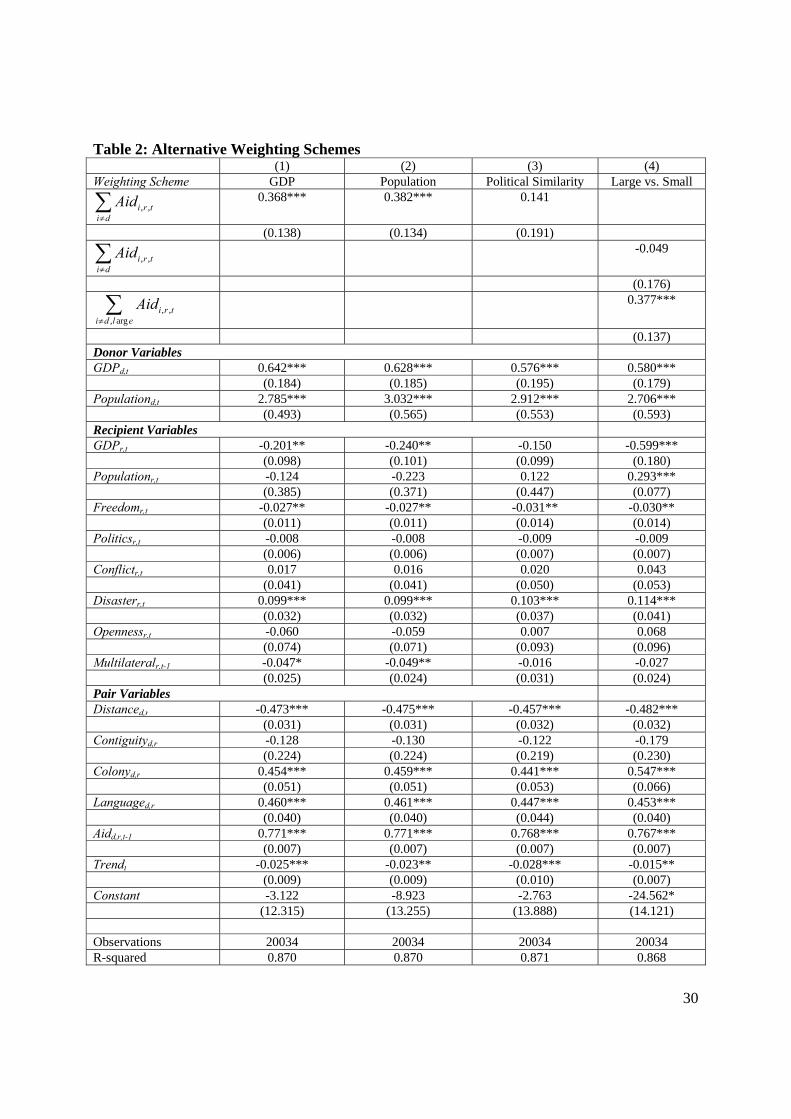
As shown in Table 3, when using GDP or population weights, we find results comparable
to those with equal weights. In particular, the spatial lag remains significantly positive, with
results of .368 and .382 respectively. The baseline finding, however, does not hold when using
Political Similarity weights. There, although the coefficient remains positive, it is no longer
significant. It should be noted, however, that this insignificance indicates that there is no
significant interdependence of Political Similarity weighted ODA, not that there no
interdependence at all, i.e. that it may be that this weighting scheme is not capturing the relevant
factors affecting allocation decisions. To the extent that this weighting scheme is correct, it
would suggest that aid from politically similar donors does not have a positive dependence. This
could mean that the effects of common donor interests and selectivity (leading to a positive
dependence) are in politically similar countries countered by more donor coordination and
specialization (leading to a negative dependence), so that the net effect is insignificantly different
from zero.
Nevertheless, for these alternative weighting schemes, we still finding no evidence for
crowding out. Note that for the GDP and Population weights, we again find a significantly
negative coefficient for multilateral aid, again giving rise to some concern for crowding out in
that dimension.
We further investigate the dependence issue by considering different donor categories.
We examined particular categories (including regional donor categories and splitting out
Scandinavian donors plus Holland who are generally seen as generous and particularly poverty-
21
oriented in their allocations) and find that one particularly strong dependence is that donors
particularly follow the lead of the 5 largest donors (Japan, USA, France, Germany, and the UK)
in their aid allocation. This is shown in column (4) of Table 2 which shows that the giving by
this group matters while the giving by the other groups is unimportant in aid allocation
decisions.27 Whether donors free-ride on the signal provided by the generosity of these top 5
donors to a particular country or whether strategic motives drive this positive dependence (e.g.
that other donors compete with the big donors for attention and good-will of these favoured
recipients), is an interesting subject of investigation in further research.
To ease discussion, in what follows, we utilized our baseline of equal weights except as
noted. Full results with the alternatives are available on request, however here we merely note
that, particularly for the GDP and Population weights and the important role of the large donors,
these additional results are comparable to those presented.
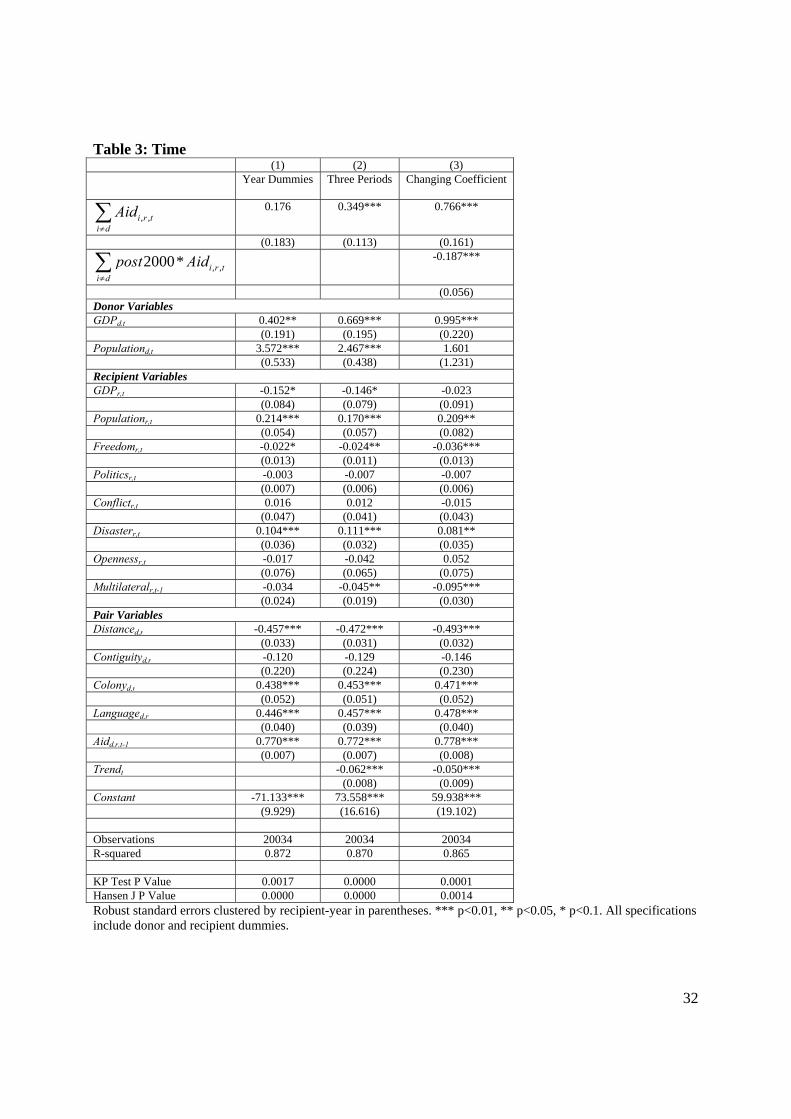
4.3 Time Issues
In Table 3, we investigate two aspects of the sensitivity of our results to time. First, rather
than using a time trend, column 1 includes year dummies. In spatial econometrics, this often
results in insignificant spatial lags. This is due to the fact that, when moving between the
observations for, say donations from Germany and France to Ghana within a year, the average
ODA by other countries differs by 1/20 of the difference in the individual aid levels (recall that
with 21 donors, there are 20 other countries used in constructing the average). As a result, the
spatial lag does not vary much across donors within a year. With this in mind, it is of little
surprise that the estimated coefficient on the spatial lag becomes insignificant. Nevertheless, it
remains positive and again argues against crowding-out.28
27 For the other groupings, we did not find significant dependence results. 28 We also used time and time square which did not materially change the results.
22
As a partial step towards using year dummies, column 3 utilizes our baseline
specification with equal weights but includes 3 period dummies equally splitting the sample and
a time trend. This allows for a different average within each three year period as well as a trend
between them. As can be seen, this results in a somewhat smaller spatial lag than the baseline’s
estimate of .301 and one that is slightly less significant.29 Thus, this provides some reassurance
that our results are not entirely driven by spurious time issues.
To test whether the size of the spatial lag varies over time, column 4 introduces a second
spatial lag, one that is interacted with a dummy variable Post2000t which is equal to one for year
2000 and later. Looking at the first row, we find that before 2000, the estimated spatial lag is
.766 and significantly positive as before. After 2000, however, the estimated impact falls to .766-
.187 = .579 (which is still significantly greater than zero at the 1% level). This suggests that the
extent of interrelation in ODA to a given recipient has fallen since 2000. This would be
consistent with the claim that donors have actually made some progress in reducing herding and
improving specialization, donor coordination and the predictability of aid. But the relationship is
significantly positive still after 2000 suggesting that much more needs to be done here. 4.4
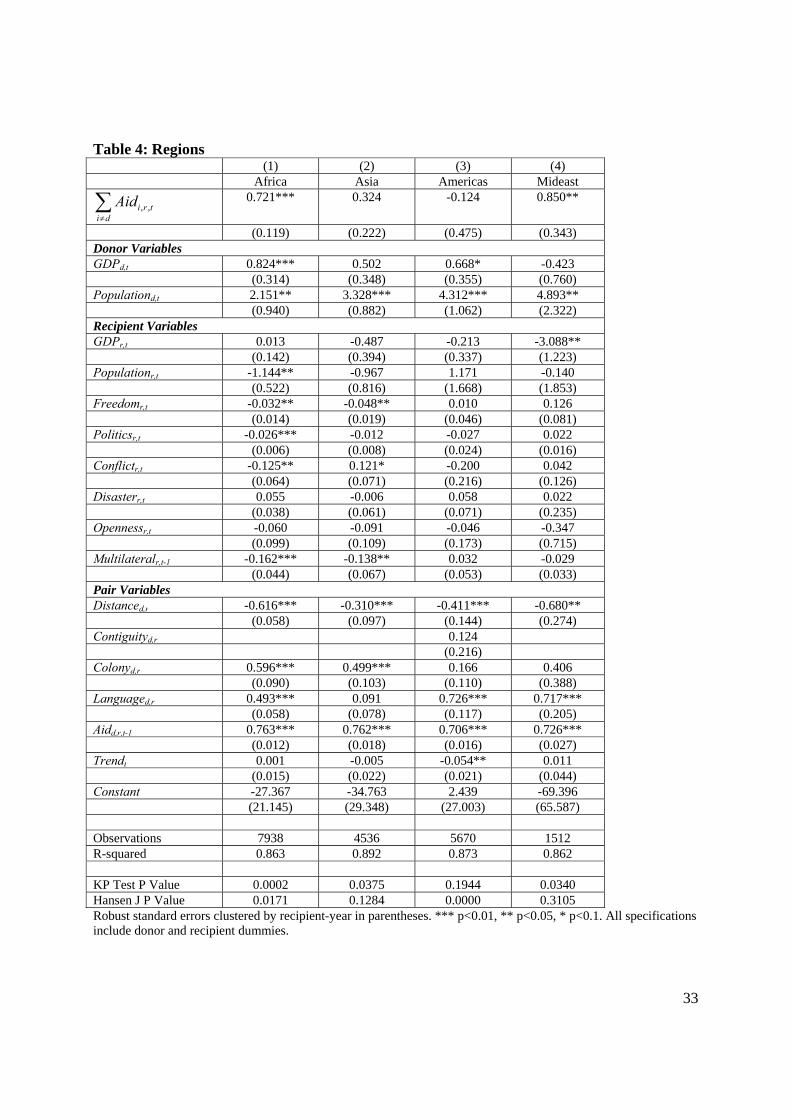
Regions
Table 4 separates our data into five regions.30 Across regions, the control variables are
generally similar in terms of sign although with the drop in the number of observations
significance is often lower. Focussing on the spatial lag, excepting the Americas, we find a
positive point estimate in each case. However, this is only significant for Africa, and the Middle
29 When using 2 year periods, we find a positive albeit insignificant spatial lag similar to the results in Table 3, column (1). 30 Details on which countries are in which category can be found in Table A1 of the appendix.
23
East. 31 Thus, to the extent that crowding-in occurs, the data indicates that it tends to happen
most often in those regions. Relating this to our potential mechanisms described above, it
suggests that selectivity issues as well as wanting to be associated with development successes
(and avoid development failures) could be the driving force for the positive dependence in those
two regions. Conversely, it appears somewhat less likely that competition for commercial or
political interests is driving the positive dependence, particularly in Africa (although this might
play a role in the Middle East).
Furthermore, in no region do we find evidence indicating crowding-out in bilateral aid.
For Africa and Asia, however, note that we find a significantly negative effect on multilateral
aid. This suggests that multilateral assistance to those nations may be replacing bilateral aid.
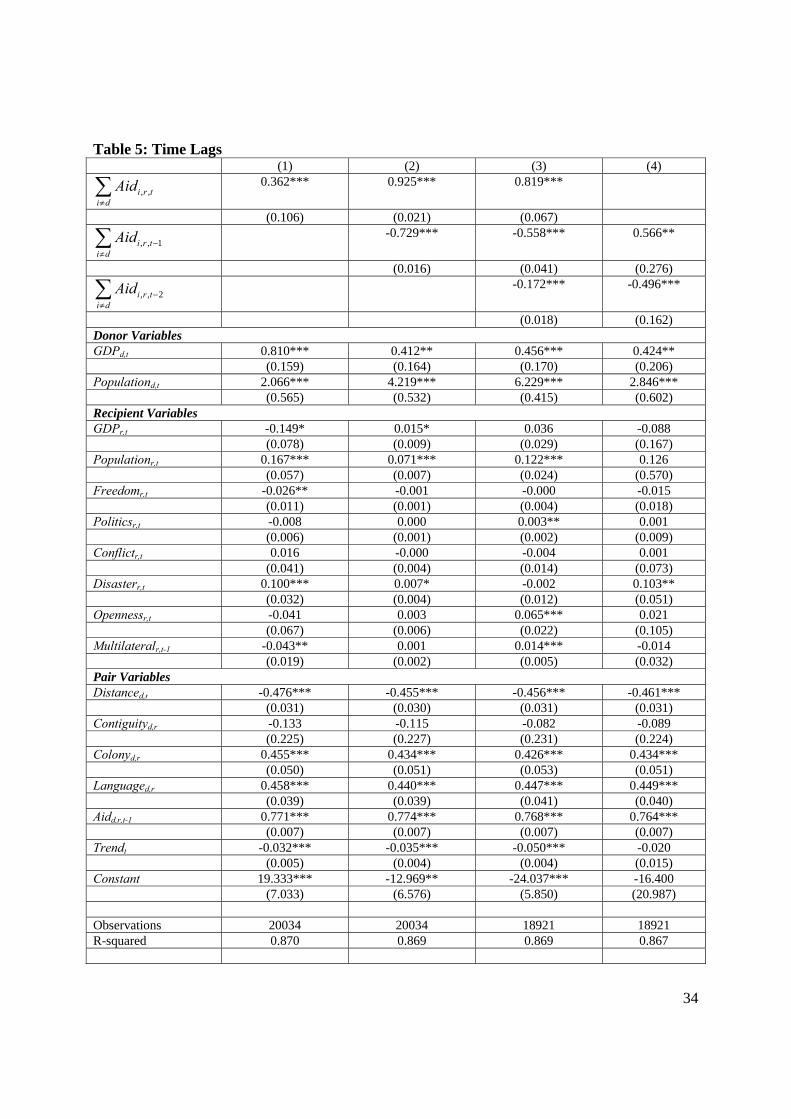
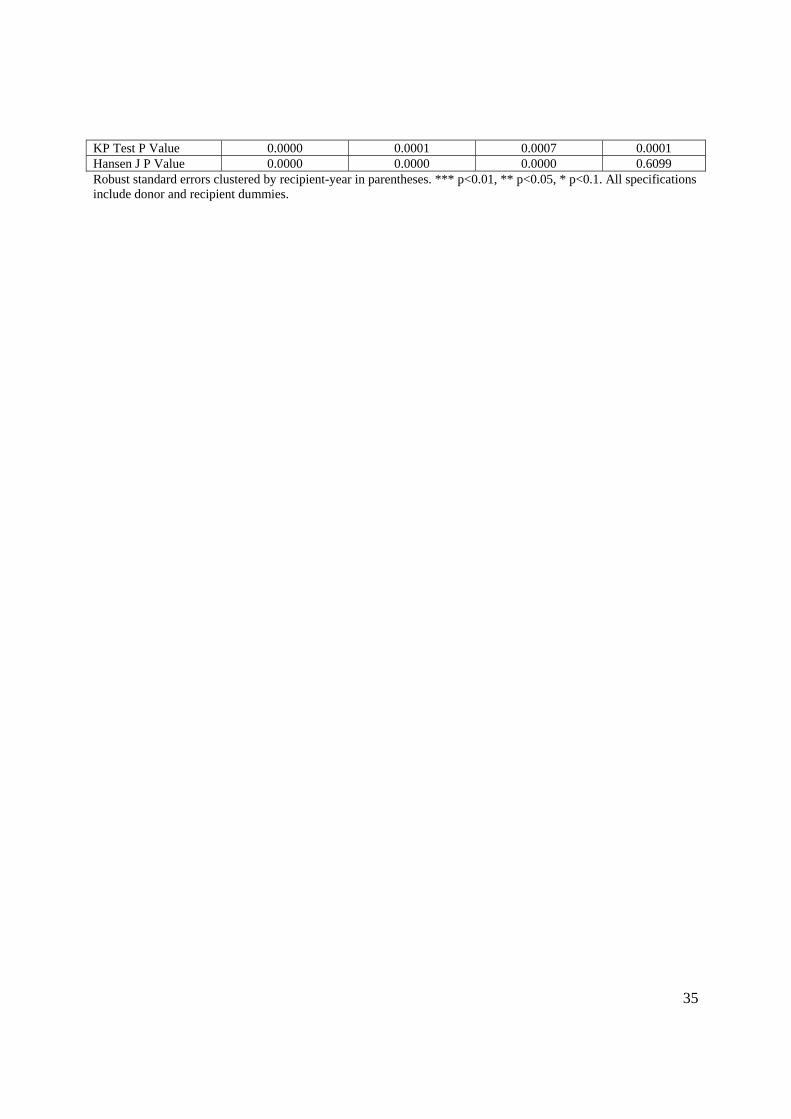
4.5 Time Lags of Bilateral Aid by Others
Table 5 modifies the baseline specification by including time lags of , ,i r ti d
Aid .32 We do
this to investigate whether there is evidence of crowding out over time. In particular, if ODA
from the rest of the world were unexpectedly large in year t-1, one might be concerned that a
given country would revise its ODA in year t downwards. Column 1 repeats the preferred
specification for ease of comparison. Column 2 adds , , 1i r ti d
Aid while column 3 also introduces
, , 2i r ti d
Aid .33 As can be seen, the past values of ODA by other countries are significantly and
negatively correlated with ODA in the current year. This does suggest some downward revision
by country d in response to past increases by other nations. Nevertheless, the net effect from 31 The results for Europe also suggest a significant positive dependence but there is only one country (Turkey) in our balanced sample. In results using additional European countries for which data was not available during the entire sample, we found a positive but insignificant spatial lag for Europe. Results are available on request. 32 As with Aidd,r,t-1 we take these as exogenous in year t. In unreported results using constructed versions of these, similar results were found. 33 In unreported results, we extended the time lags of the spatial lag back to t-5. These were not significant and did not overly effect the estimates of the reported time lags.
24
adding the coefficients on the spatial lag are significantly positive as in each case we can firmly
reject the null hypothesis that the net effect is less than or equal to zero.34 However, the
estimated response is noticeably smaller. In column 2, the net effect is .196 while in column 3 it
is .089. Another notable change is that, when included lagged values of the spatial lag, we no
longer find a negative coefficient for multilateral aid. In fact, in column 3 we find a small
positive impact for multilateral aid, suggesting there is a rather complex temporal interaction
between multilateral and bilateral aid.
In column 4, we instead use the t-1 and t-2 spatial lags to consider the possibility that a
donor responds only to past donations by others. Here, we find a comparable pattern of
coefficients as we do in column 2 where we use t and t-1 spatial lags. However, in column 4 we
cannot reject the hypothesis that the net effect is zero.35
4.6 Recipient Categories
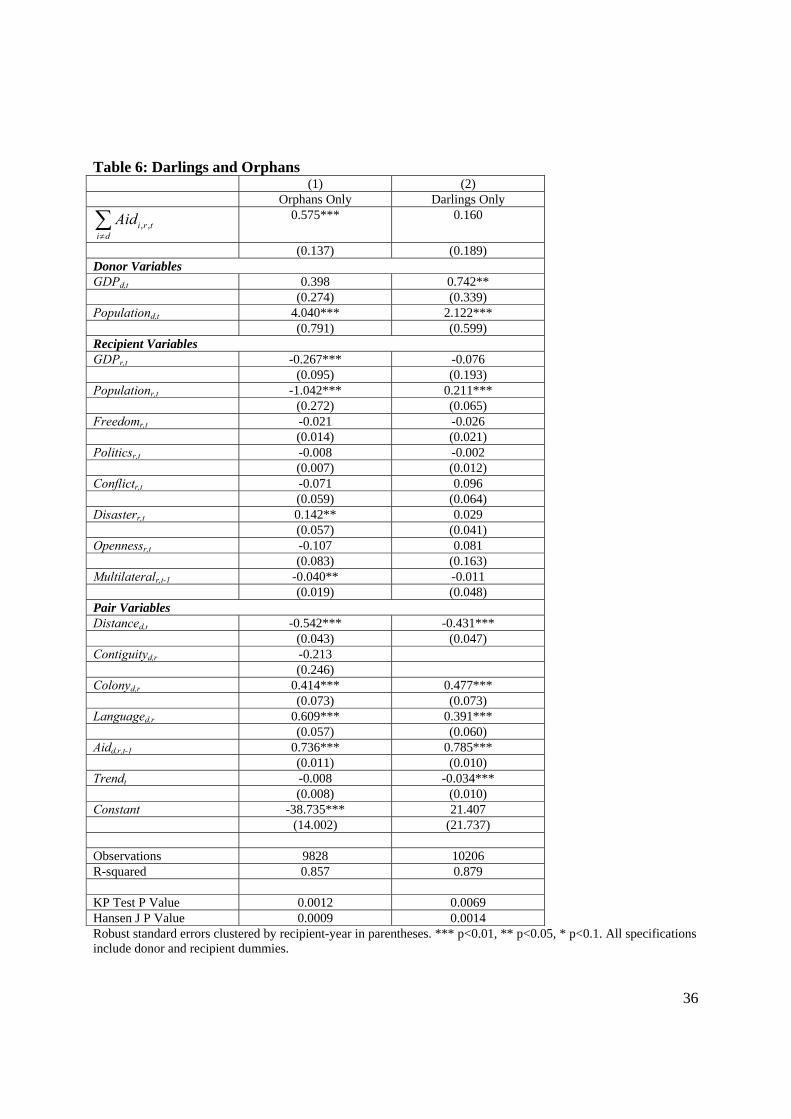
Finally, Table 6 attempts to examine whether there is a difference between nations that
tend to receive higher ODA (‘darlings’) and those that tend to receive smaller ODA (‘orphans’).
To categorize countries, we took the estimates from Table 1, column 1 and calculated residuals.
Countries where the mean residual was positive, i.e. those which tend to get more ODA than
predicted, were then classified as darlings while those with negative mean residuals were
classified as orphans.36 Table A1 of the appendix indicates which nations fell into which
categories. Column 1 uses only the orphan countries. As can be seen, the results are largely
similar to the preferred specification’s pooled results, with the exception that the estimated 34 The χ2 for column 2 was 310.27 while that for column 3 was 15.86. 35 The χ2 on this test was .21. 36 In unreported results, we classified darlings as those in the top quartile of mean residuals and orphans as those in the lowest quartile. Qualitatively similar results were found. A second check on our approach utilized column 2 of Table 1 (i.e. also using recipient fixed effects) to construct residuals. A third utilized only the recipient’s GDP per capita and population when predicting aid whereas a fourth simply took those with above and below average ODA per capita to define the darlings and orphans. Finally, in a fifth, we utilized the entire sample, not just those for which we had data in all years. In each case, we found qualitatively similar results.
25
response to an increase in average donations is roughly twice as large. Column 2 uses only the
darlings. Here, the point estimate of the spatial lag, although positive, is much smaller in
magnitude and insignificant. Thus, once again, we find no evidence of crowding out, even
among those countries that tend to receive smaller ODAs that the data would predict.
Conversely, it seems more that specifically among orphans, selectivity has some bite, leading
donors to collectively abandon them. This is also consistent with our regional story which found
the results to be stronger in Africa and the Middle East. It seems to suggest that donors are
particularly unwilling to give money to countries that other donors have abandoned, possibly for
fear of the reputational effects this might involve. Another notable difference is that it is only
within the orphans that we find a significant crowding out effect of multilateral aid.
4. Conclusion
The goal of this paper has been to investigate whether there is evidence of crowding-out
or crowding-in in bilateral ODA flows. There are several arguments that point to both effects and
their respective strength is an empirical question. Using panel data from 21 donors to 52
recipients over a twenty year period, we find no evidence of crowding-out, that is that increased
donations by other countries to a given recipient tends to lower donations by a given donor to
that recipient. Instead, we find evidence for crowding in, with a 1% increase in the ODA by all
other countries being associated with approximately a .3% increase in ODA by the country in
question. It suggests that selectivity and/or donor cartels based on joint interests are more
important factors in aid allocation than donor coordination, specialization, or free-riding. The
results appear particularly driven by donors following the lead of the largest donors. The falling
positive association over time suggests a declining role of cartels and a rising role of aid
coordination and specialization, pointing to modest success of the Paris and Accra agenda. For
26
Africa, and Middle East and aid ‘orphans’, the dependence of aid flows is particularly strong,
making their problem of unpredictable swings in donor flows particularly severe.
References Angeles, L, C. Azemar, F. Noorbakhsh. 2008. Selectivity and foreign allocation: Is there an improvement? Mimeographed, UN, New York. Anselin, Luc., 1988. Spatial Econometrics: Methods and Models, Kluwer Academic Publishers, Boston, MA. Arellano, C. A. Bulir, T. Lane, and L. Lipschitz. 2009. The dynamic implications of foreign aid and its variability. Journal of Development Economics 88: 87-102. Aldasoro, I. P. Nunnenkamp, and R. Thiele. 2011. Less aid proliferation and more donor coordination? The wide gap between words and deeds. Journal of International Development 22(7), 920-940. Alesina, A. and D. Dollar. 2001. Who gives foreign aid to whom and why. Journal of Economic Growth Bulir, A. and A.J. Hamann. 2008. Volatility of Development Aid: From the Frying Pan into the Fire? World Development 36(10): 2048-2066. Burnside, G. and D. Dollar. 2000. Aid, policies and growth. American Economic Review 90:847-868. Chauvet, L. and P. Guillaumont. 2009. Aid, Volatility, and Growth Again. Review of Development Economics. Choi, I. 2001. Unit root tests for panel data. Journal of International Money and Finance 20: 249-272. Collier, P. and D. Dollar. 2002. Aid allocation and poverty reduction. European Economic Review 46: 1475-1500. Dreher, A. K. Michaelowa, and F. Spörri. (2012). Aid fragmentation, measurement, and incentives for effective development cooperation. Mimeographed, University of Heidelberg. Easterly, W. 2002. The Cartel of Good Intentions. Foreign Policy
27
Easterly, W., R. Levine, and D.M. Roodman (2004) Aid, policies, and growth: Comment. American Economic Review 94: 774-780. Frot, E. and J. Santiso (2011). Herding in Aid Allocation. Kyklos 64(1): 54-74. Fuchs, A., A. Dreher, and P. Nunnenkamp. (forthcoming) New Donors, Social Interactions. Hoeffler, A. and V. Outram. 2008. Need, Merit, or Self-Interest: What determines the allocation of aid? CSAE Oxford. Hudson, J. and P. Mosley. 2008. Aid Volatility, Policy and Development. World Development 36(10): 2082-2102. Kangoye, T. 2011. Aid and governance. Mimeographed, CSAE, Oxford. Kathavate, J. and G. Mallik. 2012. The theory of the interaction between institutional quality and aid volatility on growth: theory and evidence. Economic Modelling 29: 716-724. Kimura, H. Y. Mori, and Y. Sawada. 2012. Aid Proliferation and Economic Growth: A Cross-Country Analysis. World Development 40(1): 1-10. Knack, S. and A. Rahman (2007): Donor fragmentation and bureaucractiv quality in aid recipients. Journal of Development Economics 83: 176-197. Knack, S., F. H. Rogers, and N. Eubank. (2010) Aid Quality and Donor Rankings. World Bank Policy Research Working Paper 5270, Washington DC: The World Bank.
Levin, V, and D. Dollar. (2005) The forgotten states: aid volumes and volatility in difficult partnership countries (1992-2002), Mimeographed, Paris, OECD. Martinez-Zarzoso, S. Klasen, F. Nowak-Lehmann, and M. Larch. 2009. Does German bilateral aid promote exports from Germany? German Economic Review. Marysse, S. A. Ansoms, and D. Cassimon. 2007. The Aid Darlings and Orphans of the Great Lakes Region. European Journal of Development Research 19: 433-458. Mascarenhas, R. and T. Sandler. 2006. Do donors cooperatively fund foreign aid? Review of International Organizations. Nowak-Lehmann, F., A. Cardozo, D. Herzer, S. Klasen, and I. Marzinez-Zarzoso. (forthcoming) Donor aid and recipient exports. Review of World Economics (forthcoming). OECD. 2009. International Good Practice Principles for Country-Led Division of Labour and Complementarity. Paris: OECD.
28
Tarp, F., C. Bach, H. Hansen, and S. Bausngaard. 1998. Danish Aid Policy: Theory and Empirical Evidence. Discussion Paper 98/06, Copenhagen Institute of Economics. Tezanos Vazquez, S. (2008) The Spanish pattern of aid giving. Working Paper No 04/08, Instituto Complutense de Estudios Internactionales. Wood, A. 2008. Looking ahead optimally in allocating aid. World Development. World Bank. 1998. Assessing Aid. Washington DC: The World Bank.
29
Table 1: Baseline Results (1) (2) (3) (4) (5) Total Total Total Total Per-Capita
, ,i r ti d
Aid 0.362*** 0.358**
(0.106) (0.149)
GDPd,t 2.103*** 1.996*** 0.530*** 0.810*** 0.634*** (0.304) (0.259) (0.186) (0.159) (0.192) Populationd,t 8.853*** 8.957*** 3.004*** 2.066*** 2.917*** (0.888) (0.868) (0.542) (0.565) (0.524)
GDPr,t -0.885*** 0.230 -0.130 -0.149* -0.217** (0.066) (0.162) (0.109) (0.078) (0.106) Populationr,t 0.651*** 1.281*** 0.350 0.167*** -0.032 (0.034) (0.464) (0.398) (0.057) (0.336) Freedomr,t -0.068*** -0.011 -0.033** -0.026** -0.025** (0.024) (0.016) (0.015) (0.011) (0.012) Politicsr,t 0.036*** 0.000 -0.009 -0.008 -0.008 (0.012) (0.008) (0.007) (0.006) (0.006) Conflictr,t -0.140 -0.013 0.023 0.016 0.019 (0.094) (0.067) (0.056) (0.041) (0.042) Opennessr,t 0.099 0.045 0.106*** 0.100*** 0.099*** (0.091) (0.053) (0.041) (0.032) (0.033) Disasterr,t 0.257*** 0.371*** 0.050 -0.041 -0.060 (0.079) (0.114) (0.076) (0.067) (0.078) Multilateralr,t-1 0.212*** 0.093*** 0.003 -0.043** -0.018 (0.039) (0.020) (0.019) (0.019) (0.028)
Distanced,r -0.707*** -1.766*** -0.447*** -0.476*** -0.473*** (0.043) (0.048) (0.029) (0.031) (0.031) Contiguityd,r -0.136 -0.933** -0.117 -0.133 -0.129 (0.470) (0.474) (0.219) (0.225) (0.224) Colonyd,r 2.450*** 1.914*** 0.428*** 0.455*** 0.455*** (0.082) (0.078) (0.049) (0.050) (0.050) Languaged,r 1.108*** 1.864*** 0.433*** 0.458*** 0.460*** (0.067) (0.056) (0.038) (0.039) (0.040) Aidd,r,t-1 0.767*** 0.771*** 0.771*** (0.007) (0.007) (0.007) Trendt -0.094*** -0.115*** -0.032*** -0.032*** -0.024** (0.009) (0.013) (0.010) (0.005) (0.010) Constant 29.148* 58.723*** 9.874 19.333*** -5.323 (17.585) (16.361) (13.070) (7.033) (15.603) Recipient Dummies?
No Yes Yes Yes Yes
Observations 21147 21147 20034 20034 20034 R-squared 0.601 0.679 0.871 0.870 0.860 KP Test P Value 0.0003 Hansen J P Value 0.0000 Robust standard errors clustered by recipient-year in parentheses. *** p<0.01, ** p<0.05, * p<0.1. All specifications include donor and recipient dummies.
30
Table 2: Alternative Weighting Schemes (1) (2) (3) (4) Weighting Scheme GDP Population Political Similarity Large vs. Small
, ,i r ti d
Aid 0.368*** 0.382*** 0.141
(0.138) (0.134) (0.191)
, ,i r ti d
Aid -0.049
(0.176)
, ,, arg
i r ti d l e
Aid 0.377***
(0.137) Donor Variables GDPd,t 0.642*** 0.628*** 0.576*** 0.580*** (0.184) (0.185) (0.195) (0.179) Populationd,t 2.785*** 3.032*** 2.912*** 2.706*** (0.493) (0.565) (0.553) (0.593) Recipient Variables GDPr,t -0.201** -0.240** -0.150 -0.599*** (0.098) (0.101) (0.099) (0.180) Populationr,t -0.124 -0.223 0.122 0.293*** (0.385) (0.371) (0.447) (0.077) Freedomr,t -0.027** -0.027** -0.031** -0.030** (0.011) (0.011) (0.014) (0.014) Politicsr,t -0.008 -0.008 -0.009 -0.009 (0.006) (0.006) (0.007) (0.007) Conflictr,t 0.017 0.016 0.020 0.043 (0.041) (0.041) (0.050) (0.053) Disasterr,t 0.099*** 0.099*** 0.103*** 0.114*** (0.032) (0.032) (0.037) (0.041) Opennessr,t -0.060 -0.059 0.007 0.068 (0.074) (0.071) (0.093) (0.096) Multilateralr,t-1 -0.047* -0.049** -0.016 -0.027 (0.025) (0.024) (0.031) (0.024) Pair Variables Distanced,r -0.473*** -0.475*** -0.457*** -0.482*** (0.031) (0.031) (0.032) (0.032) Contiguityd,r -0.128 -0.130 -0.122 -0.179 (0.224) (0.224) (0.219) (0.230) Colonyd,r 0.454*** 0.459*** 0.441*** 0.547*** (0.051) (0.051) (0.053) (0.066) Languaged,r 0.460*** 0.461*** 0.447*** 0.453*** (0.040) (0.040) (0.044) (0.040) Aidd,r,t-1 0.771*** 0.771*** 0.768*** 0.767*** (0.007) (0.007) (0.007) (0.007) Trendt -0.025*** -0.023** -0.028*** -0.015** (0.009) (0.009) (0.010) (0.007) Constant -3.122 -8.923 -2.763 -24.562* (12.315) (13.255) (13.888) (14.121) Observations 20034 20034 20034 20034 R-squared 0.870 0.870 0.871 0.868
31
KP Test P Value 0.0003 0.0002 0.0002 0.0000 Hansen J P Value 0.0000 0.0000 0.0348 0.0000 Robust standard errors clustered by recipient-year in parentheses. *** p<0.01, ** p<0.05, * p<0.1. All specifications include donor and recipient dummies.
32
Table 3: Time (1) (2) (3) Year Dummies
Three Periods Changing Coefficient
, ,i r ti d
Aid 0.176 0.349*** 0.766***
(0.183) (0.113) (0.161)
, ,2000* i r ti d
post Aid -0.187***
(0.056) Donor Variables GDPd,t 0.402** 0.669*** 0.995*** (0.191) (0.195) (0.220) Populationd,t 3.572*** 2.467*** 1.601 (0.533) (0.438) (1.231) Recipient Variables GDPr,t -0.152* -0.146* -0.023 (0.084) (0.079) (0.091) Populationr,t 0.214*** 0.170*** 0.209** (0.054) (0.057) (0.082) Freedomr,t -0.022* -0.024** -0.036*** (0.013) (0.011) (0.013) Politicsr,t -0.003 -0.007 -0.007 (0.007) (0.006) (0.006) Conflictr,t 0.016 0.012 -0.015 (0.047) (0.041) (0.043) Disasterr,t 0.104*** 0.111*** 0.081** (0.036) (0.032) (0.035) Opennessr,t -0.017 -0.042 0.052 (0.076) (0.065) (0.075) Multilateralr,t-1 -0.034 -0.045** -0.095*** (0.024) (0.019) (0.030) Pair Variables Distanced,r -0.457*** -0.472*** -0.493*** (0.033) (0.031) (0.032) Contiguityd,r -0.120 -0.129 -0.146 (0.220) (0.224) (0.230) Colonyd,r 0.438*** 0.453*** 0.471*** (0.052) (0.051) (0.052) Languaged,r 0.446*** 0.457*** 0.478*** (0.040) (0.039) (0.040) Aidd,r,t-1 0.770*** 0.772*** 0.778*** (0.007) (0.007) (0.008) Trendt -0.062*** -0.050*** (0.008) (0.009) Constant -71.133*** 73.558*** 59.938*** (9.929) (16.616) (19.102) Observations 20034 20034 20034 R-squared 0.872 0.870 0.865 KP Test P Value 0.0017 0.0000 0.0001 Hansen J P Value 0.0000 0.0000 0.0014 Robust standard errors clustered by recipient-year in parentheses. *** p<0.01, ** p<0.05, * p<0.1. All specifications include donor and recipient dummies.
33
Table 4: Regions (1) (2) (3) (4) Africa Asia Americas Mideast
, ,i r ti d
Aid 0.721*** 0.324 -0.124 0.850**
(0.119) (0.222) (0.475) (0.343) Donor Variables GDPd,t 0.824*** 0.502 0.668* -0.423 (0.314) (0.348) (0.355) (0.760) Populationd,t 2.151** 3.328*** 4.312*** 4.893** (0.940) (0.882) (1.062) (2.322) Recipient Variables GDPr,t 0.013 -0.487 -0.213 -3.088** (0.142) (0.394) (0.337) (1.223) Populationr,t -1.144** -0.967 1.171 -0.140 (0.522) (0.816) (1.668) (1.853) Freedomr,t -0.032** -0.048** 0.010 0.126 (0.014) (0.019) (0.046) (0.081) Politicsr,t -0.026*** -0.012 -0.027 0.022 (0.006) (0.008) (0.024) (0.016) Conflictr,t -0.125** 0.121* -0.200 0.042 (0.064) (0.071) (0.216) (0.126) Disasterr,t 0.055 -0.006 0.058 0.022 (0.038) (0.061) (0.071) (0.235) Opennessr,t -0.060 -0.091 -0.046 -0.347 (0.099) (0.109) (0.173) (0.715) Multilateralr,t-1 -0.162*** -0.138** 0.032 -0.029 (0.044) (0.067) (0.053) (0.033) Pair Variables Distanced,r -0.616*** -0.310*** -0.411*** -0.680** (0.058) (0.097) (0.144) (0.274) Contiguityd,r 0.124 (0.216) Colonyd,r 0.596*** 0.499*** 0.166 0.406 (0.090) (0.103) (0.110) (0.388) Languaged,r 0.493*** 0.091 0.726*** 0.717*** (0.058) (0.078) (0.117) (0.205) Aidd,r,t-1 0.763*** 0.762*** 0.706*** 0.726*** (0.012) (0.018) (0.016) (0.027) Trendt 0.001 -0.005 -0.054** 0.011 (0.015) (0.022) (0.021) (0.044) Constant -27.367 -34.763 2.439 -69.396 (21.145) (29.348) (27.003) (65.587) Observations 7938 4536 5670 1512 R-squared 0.863 0.892 0.873 0.862 KP Test P Value 0.0002 0.0375 0.1944 0.0340 Hansen J P Value 0.0171 0.1284 0.0000 0.3105 Robust standard errors clustered by recipient-year in parentheses. *** p<0.01, ** p<0.05, * p<0.1. All specifications include donor and recipient dummies.
34
Table 5: Time Lags (1) (2) (3) (4)
, ,i r ti d
Aid 0.362*** 0.925*** 0.819***
(0.106) (0.021) (0.067)
, , 1i r ti d
Aid -0.729*** -0.558*** 0.566**
(0.016) (0.041) (0.276)
, , 2i r ti d
Aid -0.172*** -0.496***
(0.018) (0.162) Donor Variables GDPd,t 0.810*** 0.412** 0.456*** 0.424** (0.159) (0.164) (0.170) (0.206) Populationd,t 2.066*** 4.219*** 6.229*** 2.846*** (0.565) (0.532) (0.415) (0.602) Recipient Variables GDPr,t -0.149* 0.015* 0.036 -0.088 (0.078) (0.009) (0.029) (0.167) Populationr,t 0.167*** 0.071*** 0.122*** 0.126 (0.057) (0.007) (0.024) (0.570) Freedomr,t -0.026** -0.001 -0.000 -0.015 (0.011) (0.001) (0.004) (0.018) Politicsr,t -0.008 0.000 0.003** 0.001 (0.006) (0.001) (0.002) (0.009) Conflictr,t 0.016 -0.000 -0.004 0.001 (0.041) (0.004) (0.014) (0.073) Disasterr,t 0.100*** 0.007* -0.002 0.103** (0.032) (0.004) (0.012) (0.051) Opennessr,t -0.041 0.003 0.065*** 0.021 (0.067) (0.006) (0.022) (0.105) Multilateralr,t-1 -0.043** 0.001 0.014*** -0.014 (0.019) (0.002) (0.005) (0.032) Pair Variables Distanced,r -0.476*** -0.455*** -0.456*** -0.461*** (0.031) (0.030) (0.031) (0.031) Contiguityd,r -0.133 -0.115 -0.082 -0.089 (0.225) (0.227) (0.231) (0.224) Colonyd,r 0.455*** 0.434*** 0.426*** 0.434*** (0.050) (0.051) (0.053) (0.051) Languaged,r 0.458*** 0.440*** 0.447*** 0.449*** (0.039) (0.039) (0.041) (0.040) Aidd,r,t-1 0.771*** 0.774*** 0.768*** 0.764*** (0.007) (0.007) (0.007) (0.007) Trendt -0.032*** -0.035*** -0.050*** -0.020 (0.005) (0.004) (0.004) (0.015) Constant 19.333*** -12.969** -24.037*** -16.400 (7.033) (6.576) (5.850) (20.987) Observations 20034 20034 18921 18921 R-squared 0.870 0.869 0.869 0.867
35
KP Test P Value 0.0000 0.0001 0.0007 0.0001 Hansen J P Value 0.0000 0.0000 0.0000 0.6099 Robust standard errors clustered by recipient-year in parentheses. *** p<0.01, ** p<0.05, * p<0.1. All specifications include donor and recipient dummies.
36
Table 6: Darlings and Orphans (1) (2) Orphans Only Darlings Only
, ,i r ti d
Aid 0.575*** 0.160
(0.137) (0.189) Donor Variables GDPd,t 0.398 0.742** (0.274) (0.339) Populationd,t 4.040*** 2.122*** (0.791) (0.599) Recipient Variables GDPr,t -0.267*** -0.076 (0.095) (0.193) Populationr,t -1.042*** 0.211*** (0.272) (0.065) Freedomr,t -0.021 -0.026 (0.014) (0.021) Politicsr,t -0.008 -0.002 (0.007) (0.012) Conflictr,t -0.071 0.096 (0.059) (0.064) Disasterr,t 0.142** 0.029 (0.057) (0.041) Opennessr,t -0.107 0.081 (0.083) (0.163) Multilateralr,t-1 -0.040** -0.011 (0.019) (0.048) Pair Variables Distanced,r -0.542*** -0.431*** (0.043) (0.047) Contiguityd,r -0.213 (0.246) Colonyd,r 0.414*** 0.477*** (0.073) (0.073) Languaged,r 0.609*** 0.391*** (0.057) (0.060) Aidd,r,t-1 0.736*** 0.785*** (0.011) (0.010) Trendt -0.008 -0.034*** (0.008) (0.010) Constant -38.735*** 21.407 (14.002) (21.737) Observations 9828 10206 R-squared 0.857 0.879 KP Test P Value 0.0012 0.0069 Hansen J P Value 0.0009 0.0014 Robust standard errors clustered by recipient-year in parentheses. *** p<0.01, ** p<0.05, * p<0.1. All specifications include donor and recipient dummies.
37
Figure 1: Aid by Region
38
Figure 2: Aid by Donor
39
Appendix Table A1: List of Countries in the Sample Donor Countries Australia France Netherlands Switzerland Austria Germany New Zealand United Kingdom Belgium Greece Norway USA Canada Ireland Portugal Denmark Italy Spain Finland Japan Sweden Recipient Countries Algeria a Egypt a Malawi a Sri Lanka b
Argentina d El Salvador d Malaysia b Sudan a
Bangladesh b Gambia a Mauritania a Swaziland a
Bhutan b Guatemala d Mauritius a Syria a
Bolivia d Guinea a Mexico d Thailand b
Botswana a Guyana a Morocco a Trinidad and Tobago d
Brazil d Honduras d Mozambique a Tunisia a
Cameroon a India b Nepal b Turkey e
Central African Rep. a Indonesia b Nicaragua d Uganda a
China b Iran c Paraguay d Uruguay d
Colombia d Jordan c Philippines b Venezuela d
Costa Rica d Kenya a Saudi Arabia c Vietnam b
Dominican Republic d Laos b Senegal a Zambia a
a Africa, b Asia, c Mideast, d Americas, e Europe. Boldface recipients are darlings, non-bold recipients are orphans. Table A2: Summary Statistics Variable Obs. Mean Std. Dev. Min Max Aidd,r,t 20034 -.4168652 3.819831 -6.968033 9.250069 Donor Variables GDPd,t 20034 10.23964 .2100149 9.644843 10.83027 Populationd,t 20034 16.70149 1.223302 15.0533 19.52358 Recipient Variables GDPr,t-1 20034 8.006394 .8907413 5.942288 9.968822 Populationr,t 20034 16.5423 1.683082 13.13633 20.99962 Freedomr,t 20034 8.30608 3.361074 2 14 Politicsr,t 20034 1.775681 6.708527 -10 10 Conflictr,t 20034 .1781971 .3826881 0 1 Disasterr,t 20034 .2557652 .4363013 0 1 Opennessr,t 20034 4.136161 .5337856 2.405812 5.636078 Multilateralr,t-1 20034 4.2104 1.368611 -1.033757 7.65074 Pair Variables Distanced,r 20034 8.873914 .5452234 6.329211 9.84973 Contiguityd,r 20034 .0017969 .0423533 0 1 Languaged,r 20034 .0431267 .2031473 0 1 Colonyd,r 20034 .115903 .3201165 0 1 Trendt 20034 1998.5 5.188257 1990 2007