Embed Size (px)
Citation preview
OECD/NEA Multi-Physics Benchmarks for Traditional and Novel Coupled Codes
J. Hou, M. Avramova, and K. Ivanov
Workshop on Multiphysics Model ValidationNCSU, Raleigh
June 27-29, 2017
Introduction
2
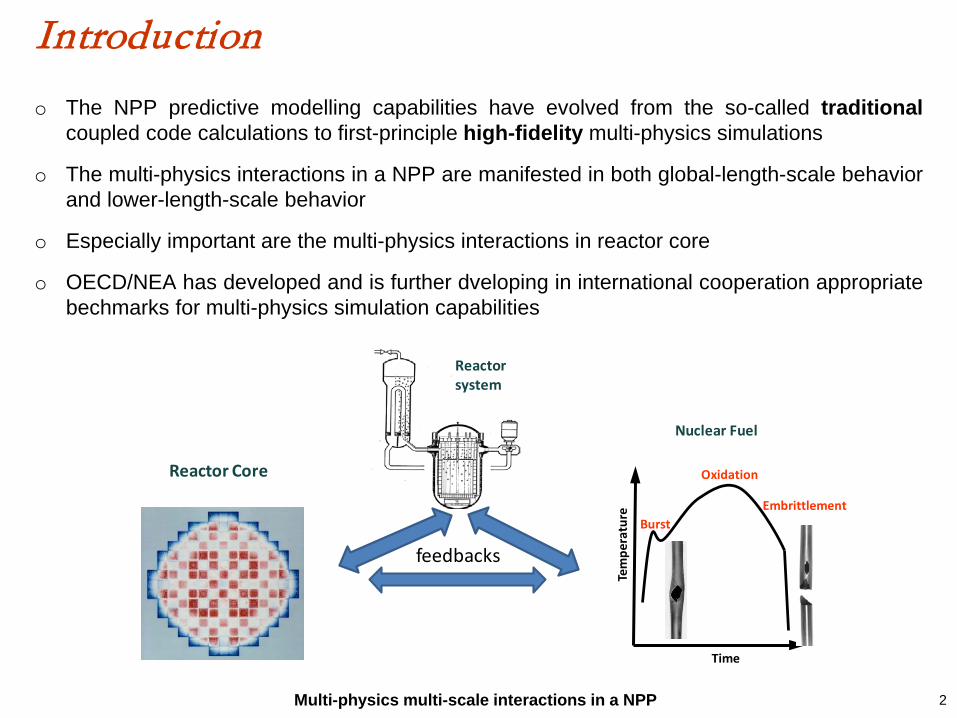
o The NPP predictive modelling capabilities have evolved from the so-called traditionalcoupled code calculations to first-principle high-fidelity multi-physics simulations
o The multi-physics interactions in a NPP are manifested in both global-length-scale behaviorand lower-length-scale behavior
o Especially important are the multi-physics interactions in reactor core
o OECD/NEA has developed and is further dveloping in international cooperation appropriatebechmarks for multi-physics simulation capabilities
Multi-physics multi-scale interactions in a NPP
EmbrittlementBurst
Oxidation
Time
Tem
pera
ture
Reactor Core
Reactor system
Nuclear Fuel
feedbacks
Multi-physics simulation tools can be classified in two groups (categories)
3
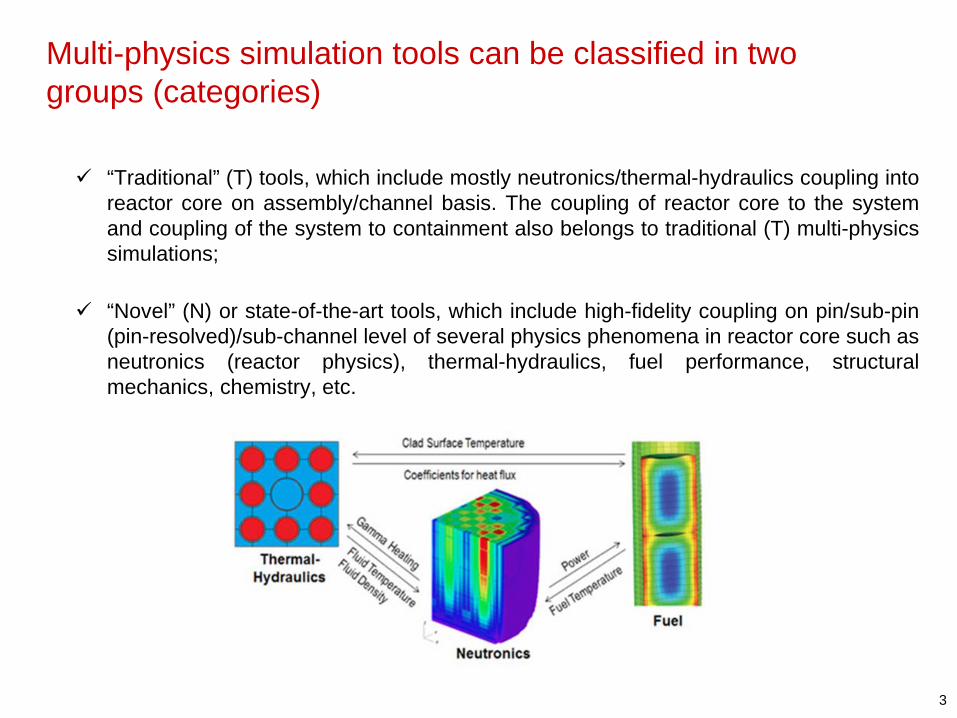
“Traditional” (T) tools, which include mostly neutronics/thermal-hydraulics coupling intoreactor core on assembly/channel basis. The coupling of reactor core to the systemand coupling of the system to containment also belongs to traditional (T) multi-physicssimulations;
“Novel” (N) or state-of-the-art tools, which include high-fidelity coupling on pin/sub-pin(pin-resolved)/sub-channel level of several physics phenomena in reactor core such asneutronics (reactor physics), thermal-hydraulics, fuel performance, structuralmechanics, chemistry, etc.
Outline
o Introduction
o OECD/NEA Benchmarks for Validation of Traditional Coupled Codes
o OECD/NEA Benchmarks for Validation of Novel Multi-Physics Tools
o Conclusions
5
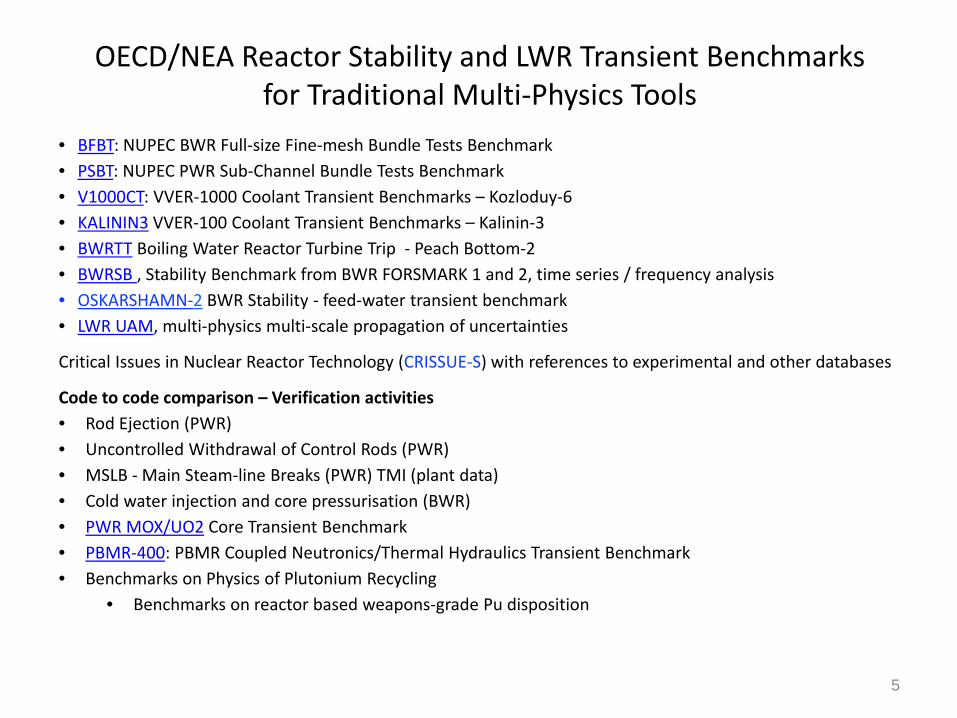
• BFBT: NUPEC BWR Full-size Fine-mesh Bundle Tests Benchmark• PSBT: NUPEC PWR Sub-Channel Bundle Tests Benchmark• V1000CT: VVER-1000 Coolant Transient Benchmarks – Kozloduy-6• KALININ3 VVER-100 Coolant Transient Benchmarks – Kalinin-3• BWRTT Boiling Water Reactor Turbine Trip - Peach Bottom-2• BWRSB , Stability Benchmark from BWR FORSMARK 1 and 2, time series / frequency analysis• OSKARSHAMN-2 BWR Stability - feed-water transient benchmark• LWR UAM, multi-physics multi-scale propagation of uncertainties
Critical Issues in Nuclear Reactor Technology (CRISSUE-S) with references to experimental and other databases
Code to code comparison – Verification activities• Rod Ejection (PWR)• Uncontrolled Withdrawal of Control Rods (PWR)• MSLB - Main Steam-line Breaks (PWR) TMI (plant data)• Cold water injection and core pressurisation (BWR)• PWR MOX/UO2 Core Transient Benchmark• PBMR-400: PBMR Coupled Neutronics/Thermal Hydraulics Transient Benchmark• Benchmarks on Physics of Plutonium Recycling
• Benchmarks on reactor based weapons-grade Pu disposition
OECD/NEA Reactor Stability and LWR Transient Benchmarks for Traditional Multi-Physics Tools
Traditional coupling
6
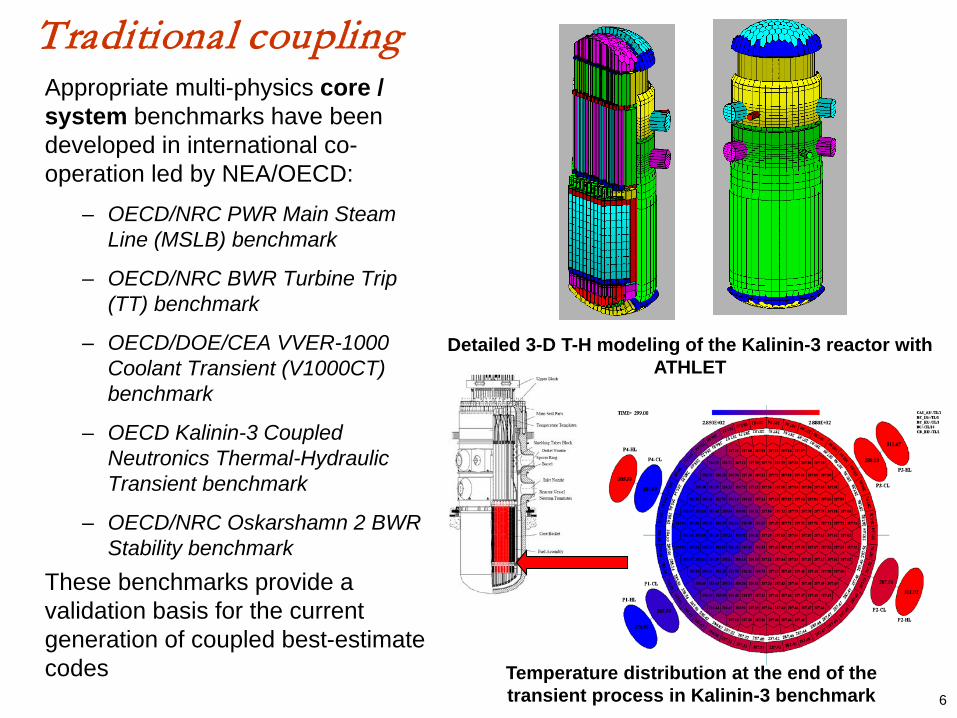
Appropriate multi-physics core / system benchmarks have been developed in international co-operation led by NEA/OECD:
– OECD/NRC PWR Main Steam Line (MSLB) benchmark
– OECD/NRC BWR Turbine Trip (TT) benchmark
– OECD/DOE/CEA VVER-1000 Coolant Transient (V1000CT) benchmark
– OECD Kalinin-3 Coupled Neutronics Thermal-Hydraulic Transient benchmark
– OECD/NRC Oskarshamn 2 BWR Stability benchmark
These benchmarks provide a validation basis for the current generation of coupled best-estimate codes
Detailed 3-D T-H modeling of the Kalinin-3 reactor with ATHLET
Temperature distribution at the end of the transient process in Kalinin-3 benchmark
7
o These are complex benchmarks, which use different Phases, Exercises andScenarios to validate different models and the coupling between them
o The developed systematic validation approach includes comparisons on differentmodelling levels – point kinetics and 3D kinetics; neutronics with and withoutthermal-hydraulic feedback; and core boundary conditions models and core-plantcoupling
o The available measured data is utilized in combination with detail code-to-codecomparisons
o The cross-section libraries are generated by the benchmark team, which removesthe uncertainties introduced by using different cross-section generation andmodelling procedures
o This approach allowed to develop a more in-depth knowledge of the capabilities ofthe current generation best estimate coupled thermal-hydraulic system codes
o Professional community of experts has been established, which advanced thestate-of the art in the area of coupling research
Traditional Multi-Physics Benchmarks
8
o Simulated Main Steam Line Break (MSLB) for TMI-1:
Break occurs in one steam line upstream of the cross-connect
Control rod with highest worth is assumed stuck out
o Event is featured with significant space-time effects in the core due to the asymmetric cooling;
o Conservative assumptions utilized to maximize RCS cool-down;
o Major concern: possible return-to-power and criticality.
OECD/NRC PWR MSLB Benchmark
9
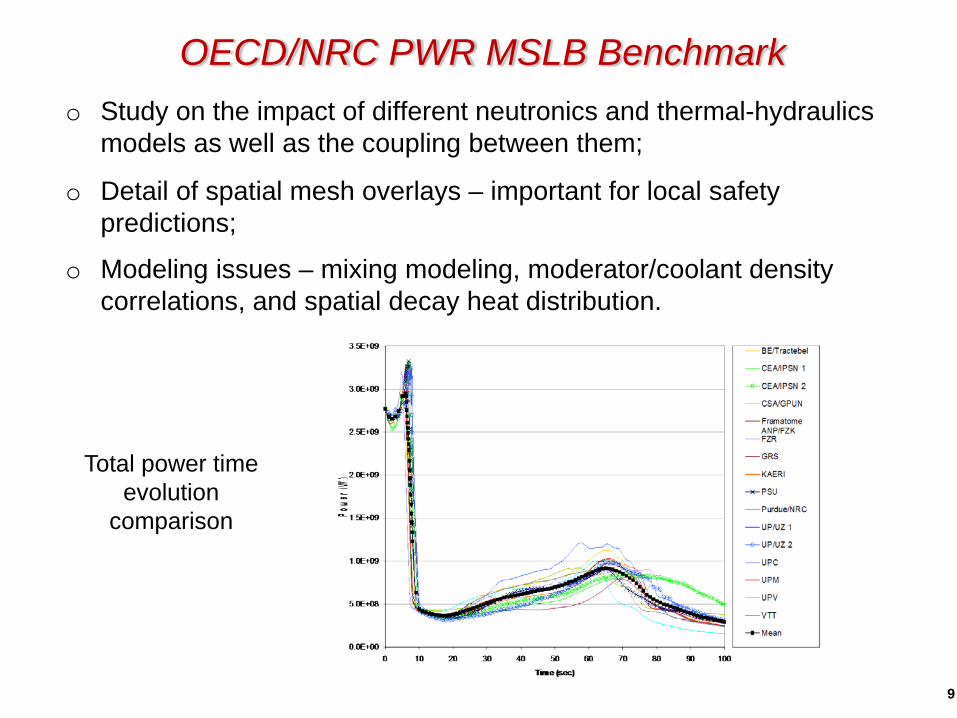
o Study on the impact of different neutronics and thermal-hydraulics models as well as the coupling between them;
o Detail of spatial mesh overlays – important for local safety predictions;
o Modeling issues – mixing modeling, moderator/coolant density correlations, and spatial decay heat distribution.
OECD/NRC PWR MSLB Benchmark
Total power time evolution
comparison
10
OECD/NRC PWR MSLB Benchmark
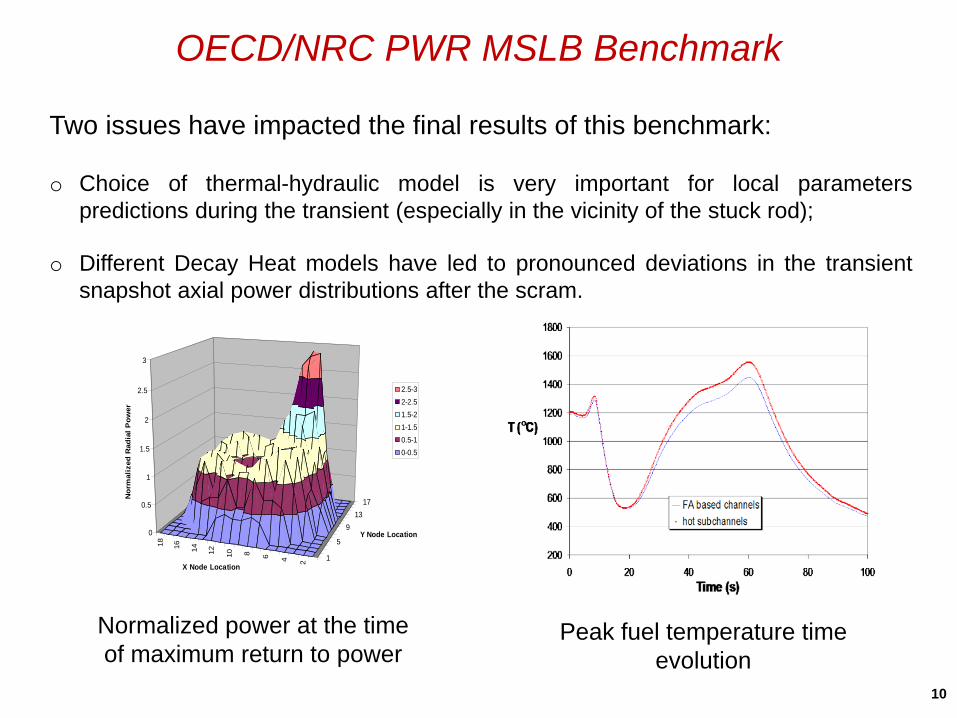
Two issues have impacted the final results of this benchmark:
o Choice of thermal-hydraulic model is very important for local parameterspredictions during the transient (especially in the vicinity of the stuck rod);
o Different Decay Heat models have led to pronounced deviations in the transientsnapshot axial power distributions after the scram.
18 16 14 12 10 8 6 4 2 1
5
913
17
0
0.5
1
1.5
2
2.5
3
Nor
mal
ized
Rad
ial P
ower
X Node Location
Y Node Location
2.5-32-2.51.5-21-1.50.5-10-0.5
Normalized power at the time of maximum return to power
Peak fuel temperature time evolution
11
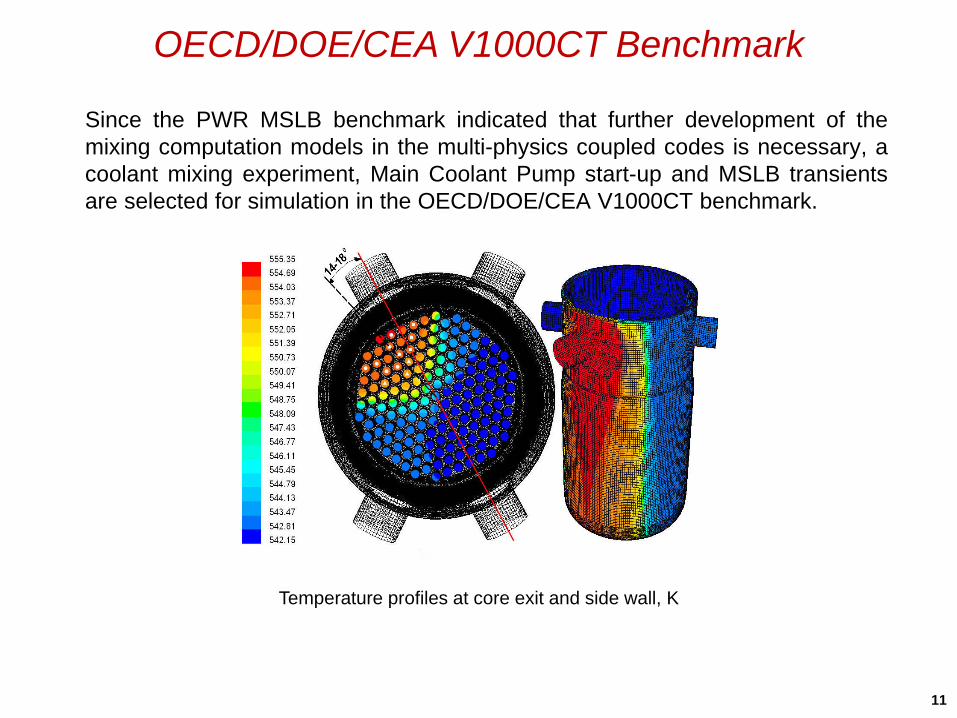
Since the PWR MSLB benchmark indicated that further development of themixing computation models in the multi-physics coupled codes is necessary, acoolant mixing experiment, Main Coolant Pump start-up and MSLB transientsare selected for simulation in the OECD/DOE/CEA V1000CT benchmark.
OECD/DOE/CEA V1000CT Benchmark
Temperature profiles at core exit and side wall, K
12
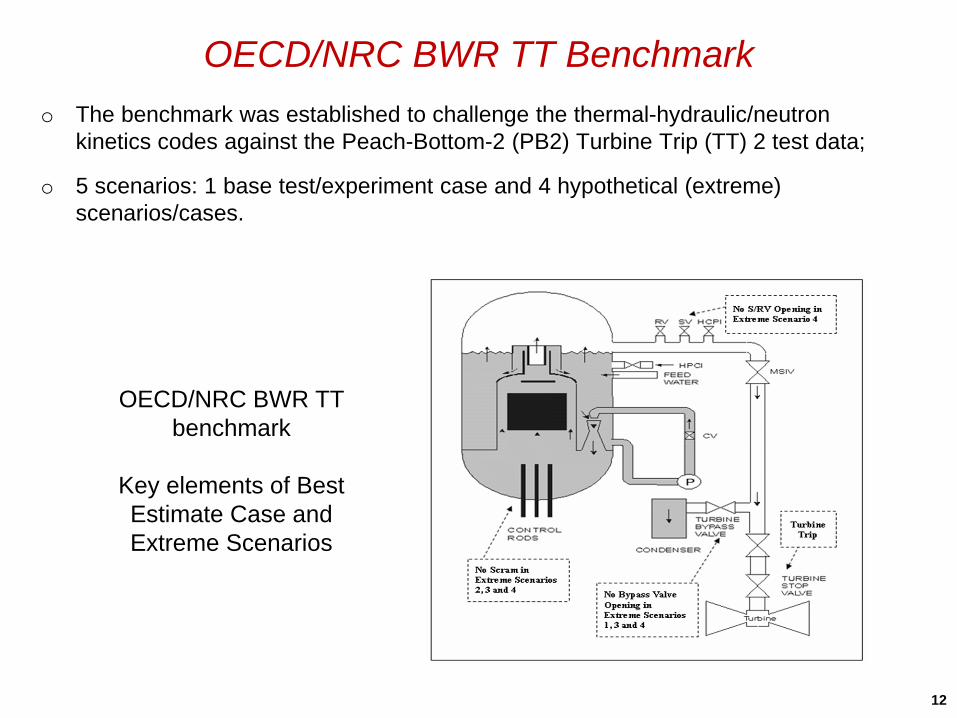
o The benchmark was established to challenge the thermal-hydraulic/neutron kinetics codes against the Peach-Bottom-2 (PB2) Turbine Trip (TT) 2 test data;
o 5 scenarios: 1 base test/experiment case and 4 hypothetical (extreme) scenarios/cases.
OECD/NRC BWR TT Benchmark
OECD/NRC BWR TT benchmark
Key elements of Best Estimate Case and Extreme Scenarios
13
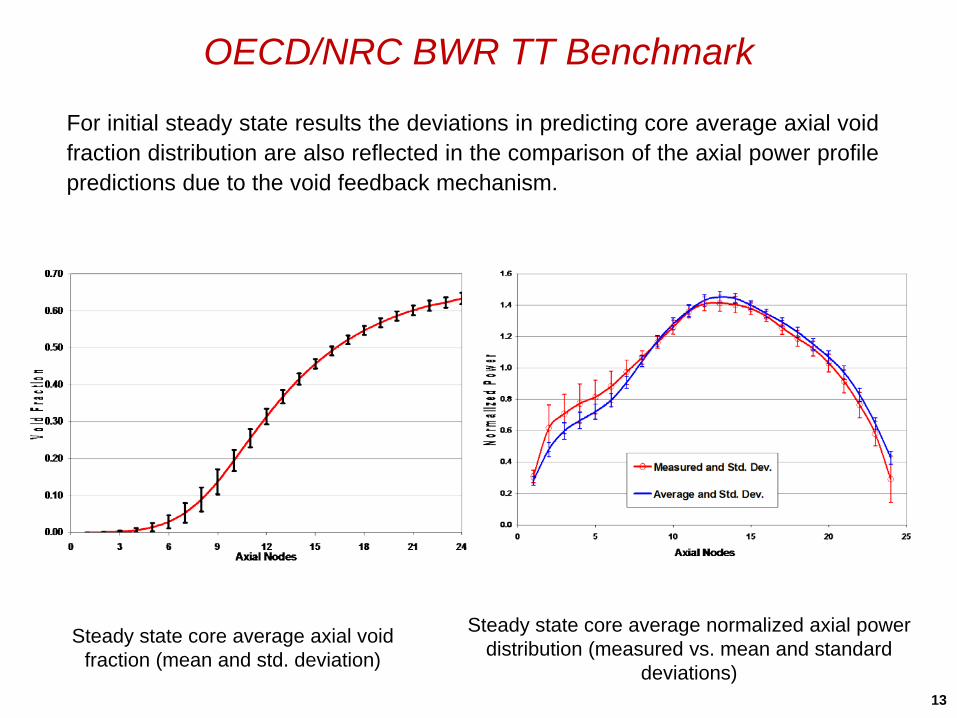
Steady state core average axial void fraction (mean and std. deviation)
Steady state core average normalized axial power distribution (measured vs. mean and standard
deviations)
OECD/NRC BWR TT Benchmark
For initial steady state results the deviations in predicting core average axial voidfraction distribution are also reflected in the comparison of the axial power profilepredictions due to the void feedback mechanism.
14
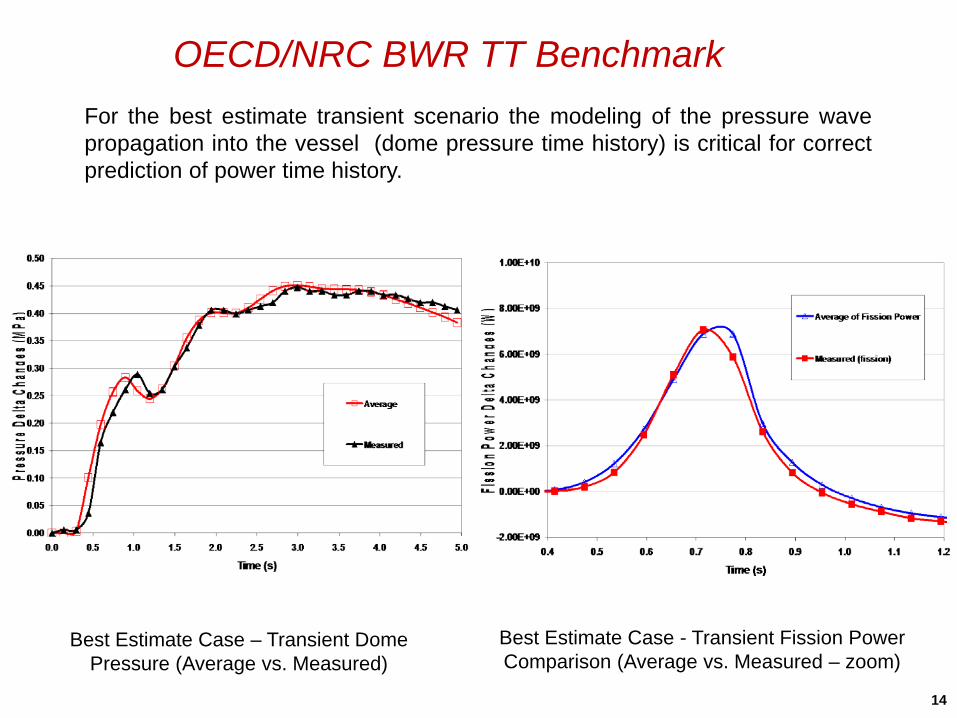
Best Estimate Case – Transient Dome Pressure (Average vs. Measured)
Best Estimate Case - Transient Fission Power Comparison (Average vs. Measured – zoom)
OECD/NRC BWR TT BenchmarkFor the best estimate transient scenario the modeling of the pressure wavepropagation into the vessel (dome pressure time history) is critical for correctprediction of power time history.
15
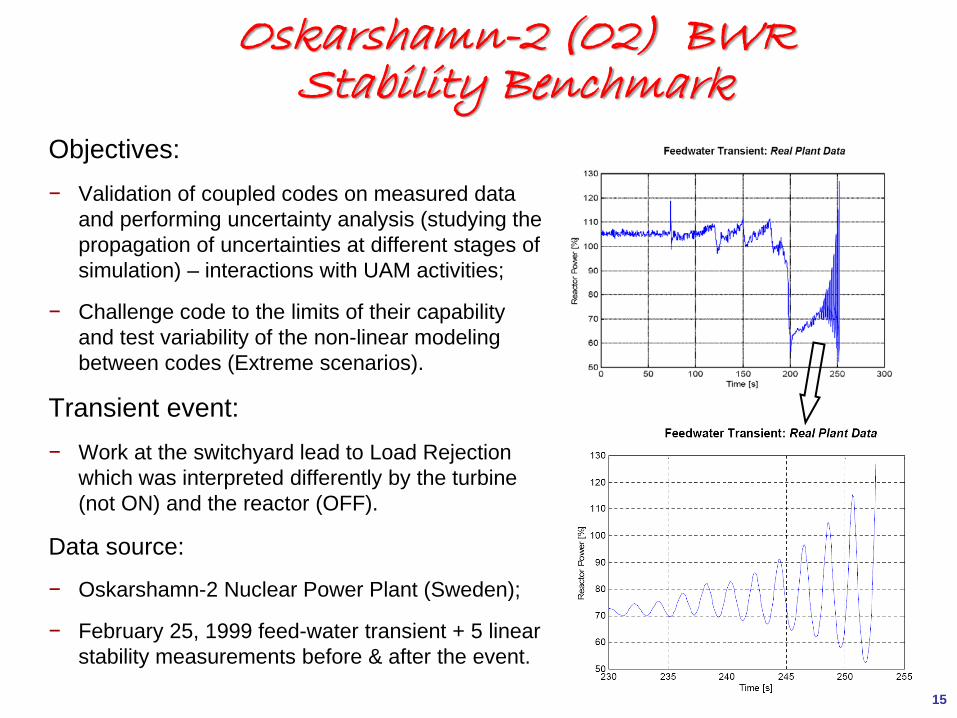
Oskarshamn-2 (O2) BWR Stability Benchmark
Objectives: − Validation of coupled codes on measured data
and performing uncertainty analysis (studying the propagation of uncertainties at different stages of simulation) – interactions with UAM activities;
− Challenge code to the limits of their capability and test variability of the non-linear modeling between codes (Extreme scenarios).
Transient event: − Work at the switchyard lead to Load Rejection
which was interpreted differently by the turbine (not ON) and the reactor (OFF).
Data source:
− Oskarshamn-2 Nuclear Power Plant (Sweden);
− February 25, 1999 feed-water transient + 5 linear stability measurements before & after the event.
)
16
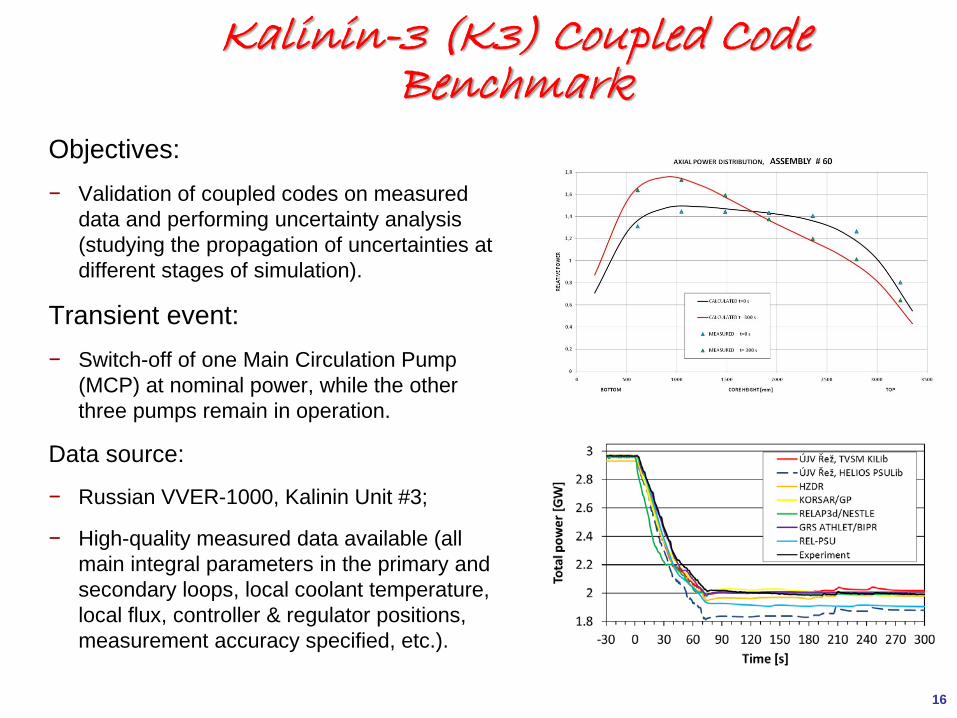
Kalinin-3 (K3) Coupled Code Benchmark
Objectives: − Validation of coupled codes on measured
data and performing uncertainty analysis (studying the propagation of uncertainties at different stages of simulation).
Transient event: − Switch-off of one Main Circulation Pump
(MCP) at nominal power, while the other three pumps remain in operation.
Data source:
− Russian VVER-1000, Kalinin Unit #3;
− High-quality measured data available (all main integral parameters in the primary and secondary loops, local coolant temperature, local flux, controller & regulator positions, measurement accuracy specified, etc.).
)
17
NEA/OECD Benchmarks for Novel Multi-Physics Tools
These benchmarks provide a framework to address the current trends in the development of LWR multi-physics and multi-scale modeling and simulation.
The benchmarks include the following common features:
o Utilization of high-quality experimental data;
o Refined local scale modeling in addition to global predictions;
o More detailed comparisons and analysis;
o Including uncertainty and sensitivity analysis of modeling predictions.
These benchmarks include:
o CASL Watts Bar Unit 1 Cycle 1 benchmark;
o Rostov-2 VVER-1000 benchmark;
o C5G7-TD benchmark.
18
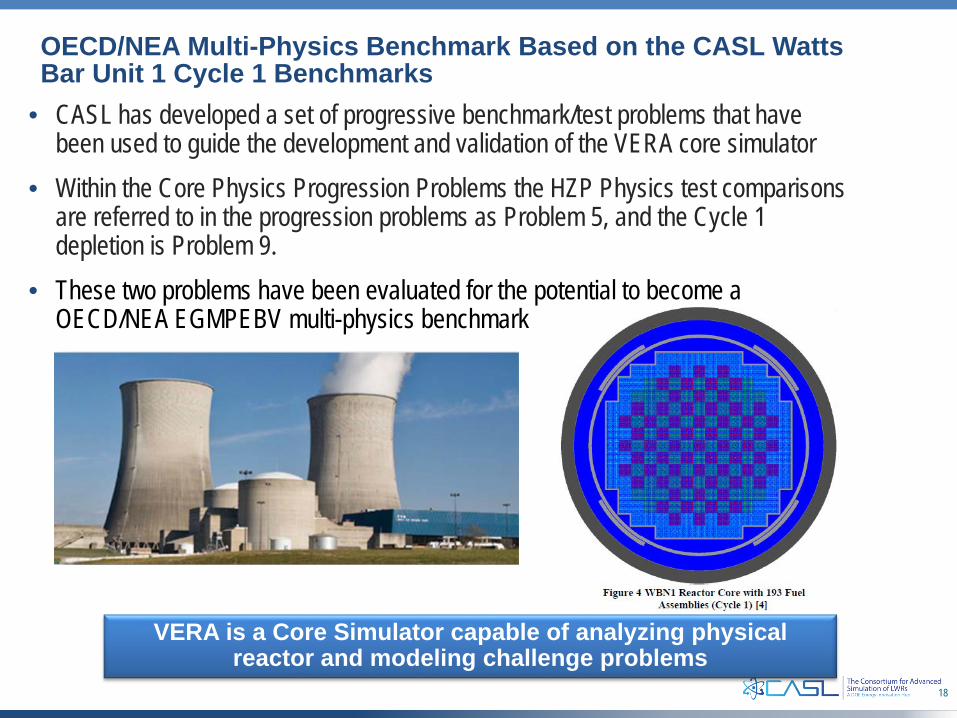
OECD/NEA Multi-Physics Benchmark Based on the CASL Watts Bar Unit 1 Cycle 1 Benchmarks
• CASL has developed a set of progressive benchmark/test problems that have been used to guide the development and validation of the VERA core simulator
• Within the Core Physics Progression Problems the HZP Physics test comparisons are referred to in the progression problems as Problem 5, and the Cycle 1 depletion is Problem 9.
• These two problems have been evaluated for the potential to become a OECD/NEA EGMPEBV multi-physics benchmark
VERA is a Core Simulator capable of analyzing physical reactor and modeling challenge problems
19
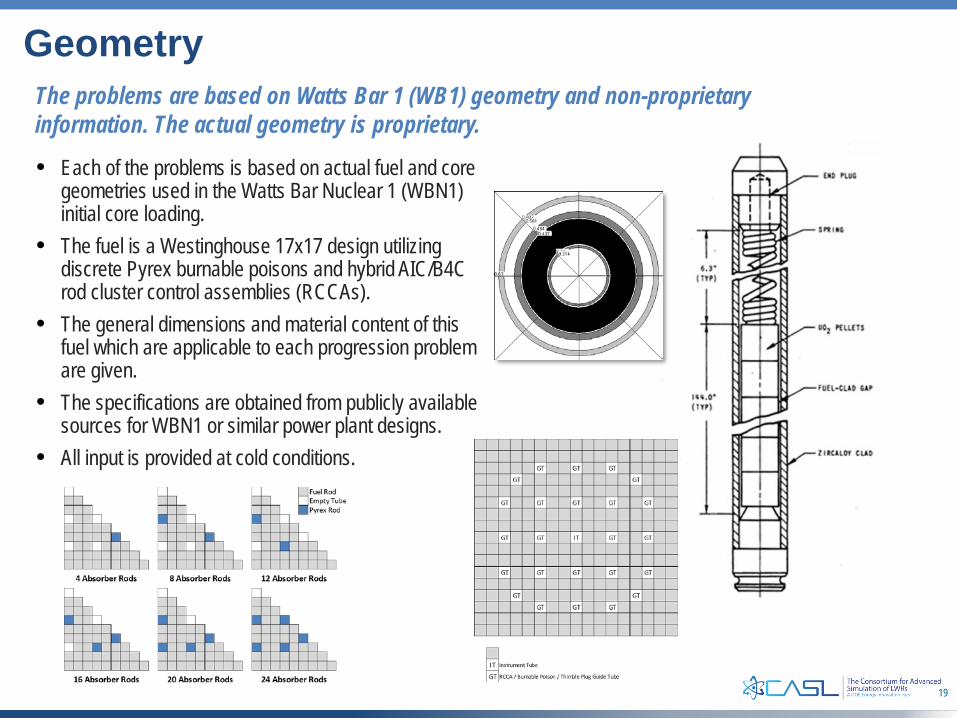
The problems are based on Watts Bar 1 (WB1) geometry and non-proprietary information. The actual geometry is proprietary.
• Each of the problems is based on actual fuel and core geometries used in the Watts Bar Nuclear 1 (WBN1) initial core loading.
• The fuel is a Westinghouse 17x17 design utilizing discrete Pyrex burnable poisons and hybrid AIC/B4C rod cluster control assemblies (RCCAs).
• The general dimensions and material content of this fuel which are applicable to each progression problem are given.
• The specifications are obtained from publicly available sources for WBN1 or similar power plant designs.
• All input is provided at cold conditions.
Geometry
20
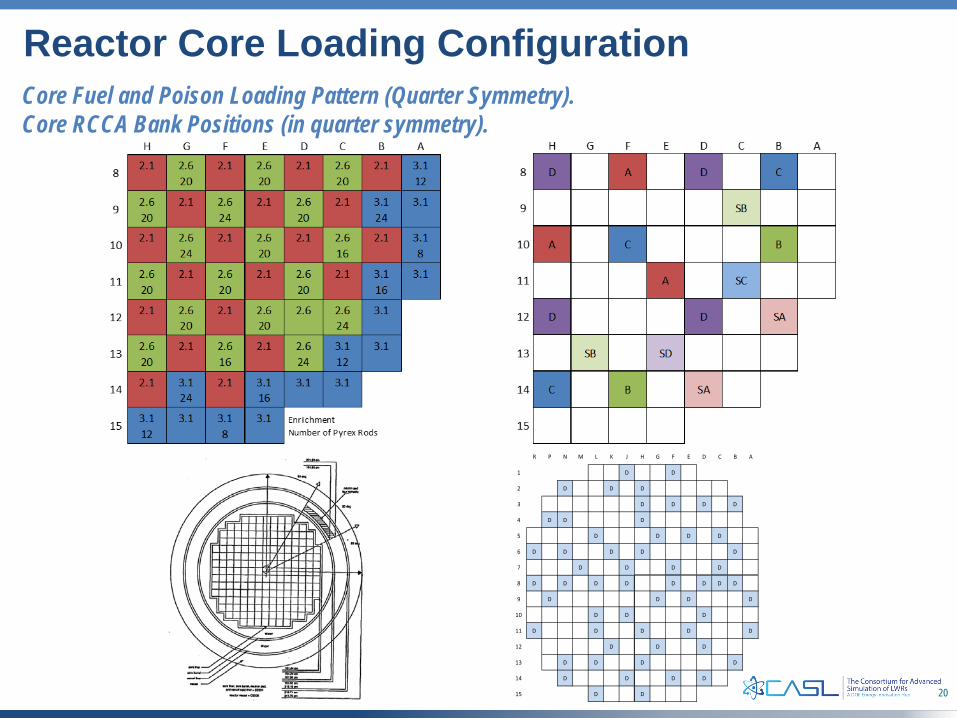
Core Fuel and Poison Loading Pattern (Quarter Symmetry).Core RCCA Bank Positions (in quarter symmetry).
Reactor Core Loading Configuration
R P N M L K J H G F E D C B A
1 D D
2 D D D
3 D D D D
4 D D D
5 D D D D
6 D D D D D
7 D D D D
8 D D D D D D D D
9 D D D D
10 D D D
11 D D D D D
12 D D D
13 D D D D
14 D D D D
15 D D
21
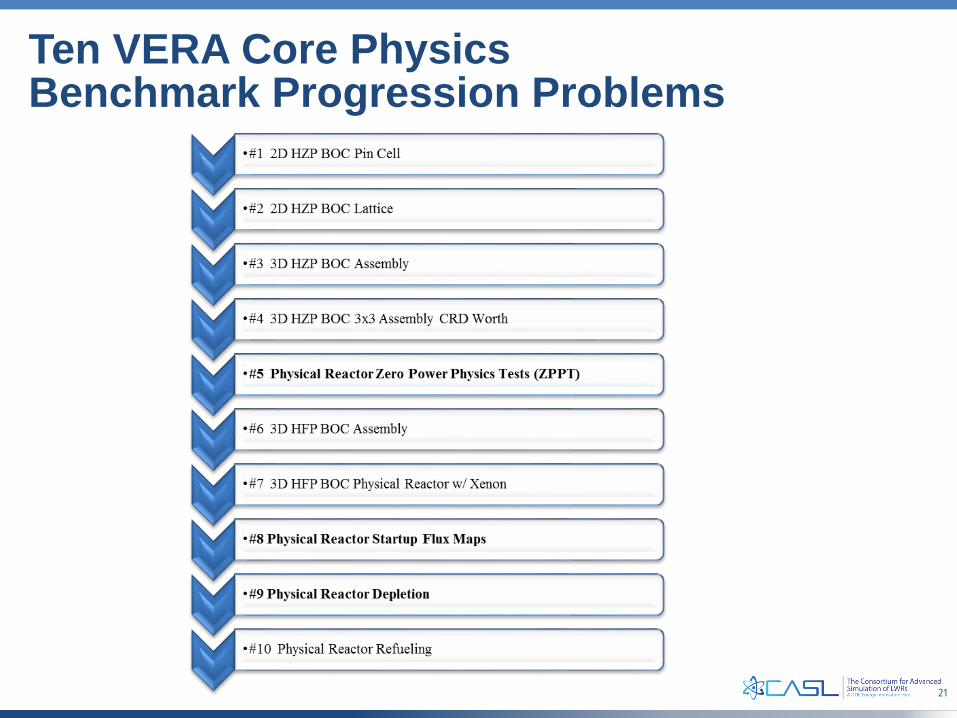
Ten VERA Core Physics Benchmark Progression Problems
22
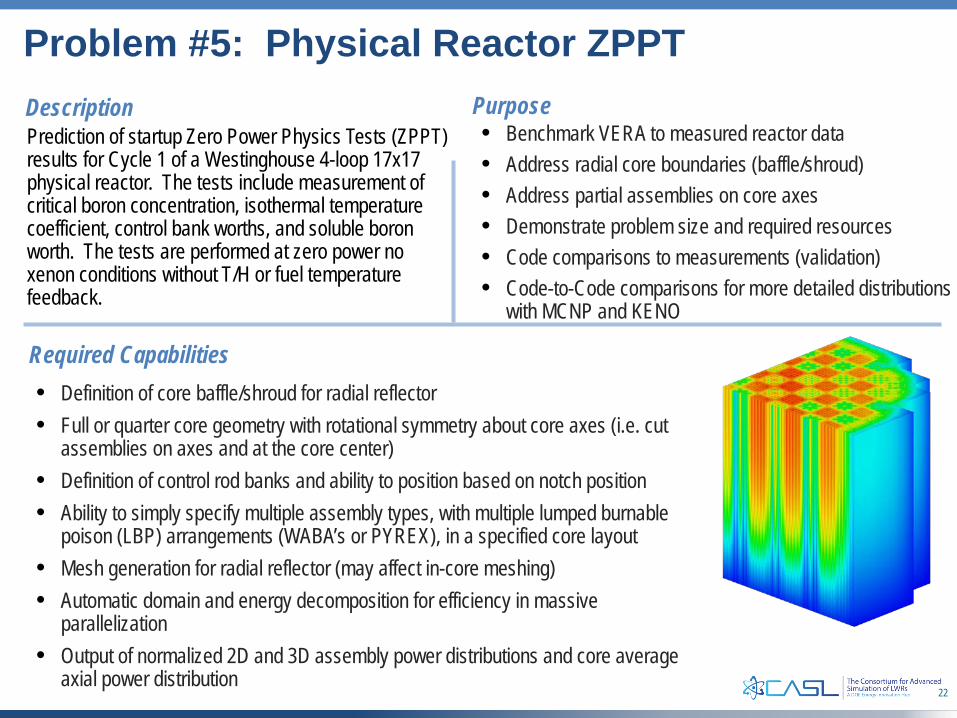
Required Capabilities• Definition of core baffle/shroud for radial reflector• Full or quarter core geometry with rotational symmetry about core axes (i.e. cut
assemblies on axes and at the core center)• Definition of control rod banks and ability to position based on notch position• Ability to simply specify multiple assembly types, with multiple lumped burnable
poison (LBP) arrangements (WABA’s or PYREX), in a specified core layout• Mesh generation for radial reflector (may affect in-core meshing)• Automatic domain and energy decomposition for efficiency in massive
parallelization• Output of normalized 2D and 3D assembly power distributions and core average
axial power distribution
DescriptionPrediction of startup Zero Power Physics Tests (ZPPT) results for Cycle 1 of a Westinghouse 4-loop 17x17 physical reactor. The tests include measurement of critical boron concentration, isothermal temperature coefficient, control bank worths, and soluble boron worth. The tests are performed at zero power no xenon conditions without T/H or fuel temperature feedback.
Problem #5: Physical Reactor ZPPTPurpose• Benchmark VERA to measured reactor data• Address radial core boundaries (baffle/shroud)• Address partial assemblies on core axes• Demonstrate problem size and required resources• Code comparisons to measurements (validation)• Code-to-Code comparisons for more detailed distributions
with MCNP and KENO
23
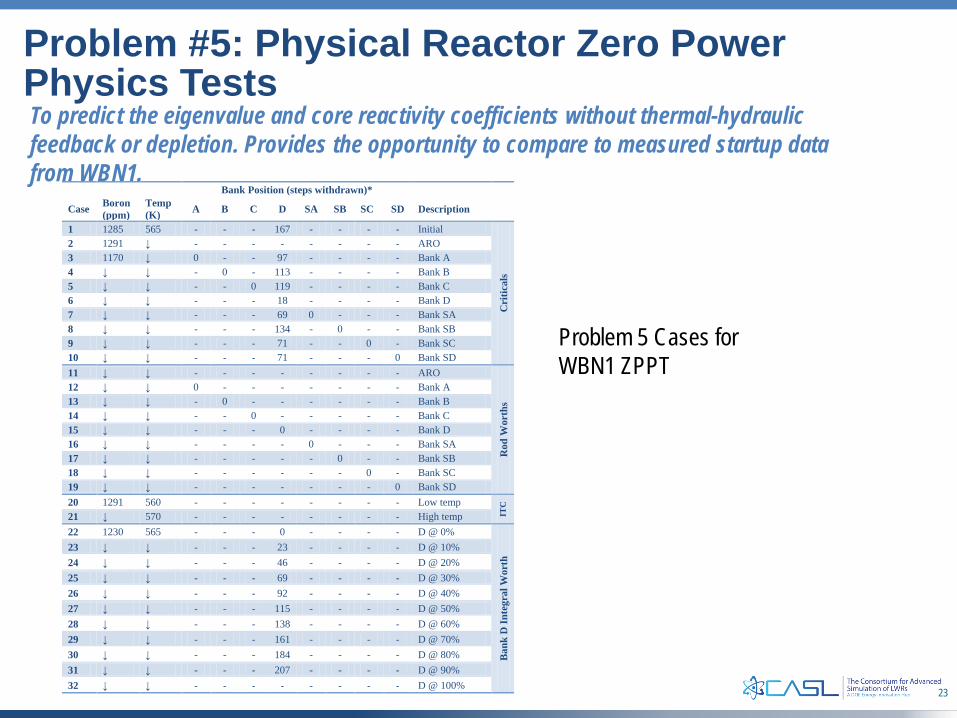
To predict the eigenvalue and core reactivity coefficients without thermal-hydraulic feedback or depletion. Provides the opportunity to compare to measured startup data from WBN1.
Problem #5: Physical Reactor Zero Power Physics Tests
Bank Position (steps withdrawn)*
Case Boron (ppm)
Temp (K) A B C D SA SB SC SD Description
1 1285 565 - - - 167 - - - - Initial
Cri
tical
s
2 1291 ↓ - - - - - - - - ARO 3 1170 ↓ 0 - - 97 - - - - Bank A 4 ↓ ↓ - 0 - 113 - - - - Bank B 5 ↓ ↓ - - 0 119 - - - - Bank C 6 ↓ ↓ - - - 18 - - - - Bank D 7 ↓ ↓ - - - 69 0 - - - Bank SA 8 ↓ ↓ - - - 134 - 0 - - Bank SB 9 ↓ ↓ - - - 71 - - 0 - Bank SC 10 ↓ ↓ - - - 71 - - - 0 Bank SD 11 ↓ ↓ - - - - - - - - ARO
Rod
Wor
ths
12 ↓ ↓ 0 - - - - - - - Bank A 13 ↓ ↓ - 0 - - - - - - Bank B 14 ↓ ↓ - - 0 - - - - - Bank C 15 ↓ ↓ - - - 0 - - - - Bank D 16 ↓ ↓ - - - - 0 - - - Bank SA 17 ↓ ↓ - - - - - 0 - - Bank SB 18 ↓ ↓ - - - - - - 0 - Bank SC 19 ↓ ↓ - - - - - - - 0 Bank SD 20 1291 560 - - - - - - - - Low temp
ITC
21 ↓ 570 - - - - - - - - High temp 22 1230 565 - - - 0 - - - - D @ 0%
Ban
k D
Inte
gral
Wor
th 23 ↓ ↓ - - - 23 - - - - D @ 10%
24 ↓ ↓ - - - 46 - - - - D @ 20% 25 ↓ ↓ - - - 69 - - - - D @ 30% 26 ↓ ↓ - - - 92 - - - - D @ 40% 27 ↓ ↓ - - - 115 - - - - D @ 50% 28 ↓ ↓ - - - 138 - - - - D @ 60% 29 ↓ ↓ - - - 161 - - - - D @ 70% 30 ↓ ↓ - - - 184 - - - - D @ 80% 31 ↓ ↓ - - - 207 - - - - D @ 90% 32 ↓ ↓ - - - - - - - - D @ 100%
Problem 5 Cases for WBN1 ZPPT
24
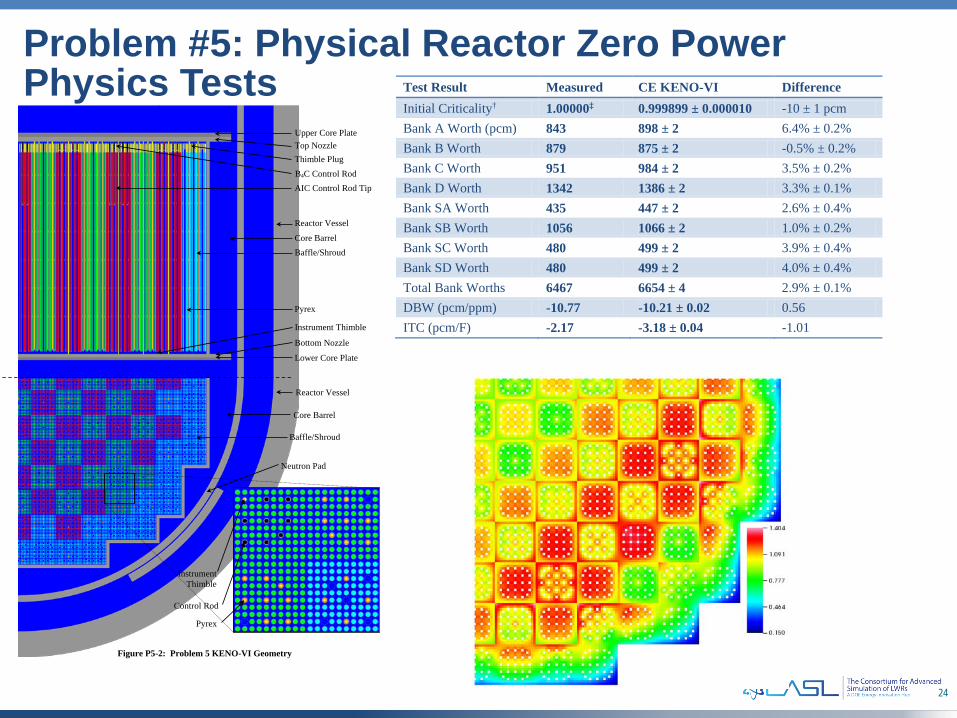
Problem #5: Physical Reactor Zero Power Physics Tests
Figure P5-2: Problem 5 KENO-VI Geometry
AIC Control Rod Tip B4C Control Rod Thimble Plug Top Nozzle Upper Core Plate
Reactor Vessel
Core Barrel Baffle/Shroud
Pyrex
Instrument Thimble
Bottom Nozzle
Lower Core Plate
Reactor Vessel
Core Barrel
Baffle/Shroud
Neutron Pad
Instrument Thimble
Control Rod
Pyrex
Test Result Measured CE KENO-VI Difference Initial Criticality† 1.00000‡ 0.999899 ± 0.000010 -10 ± 1 pcm Bank A Worth (pcm) 843 898 ± 2 6.4% ± 0.2% Bank B Worth 879 875 ± 2 -0.5% ± 0.2% Bank C Worth 951 984 ± 2 3.5% ± 0.2% Bank D Worth 1342 1386 ± 2 3.3% ± 0.1% Bank SA Worth 435 447 ± 2 2.6% ± 0.4% Bank SB Worth 1056 1066 ± 2 1.0% ± 0.2% Bank SC Worth 480 499 ± 2 3.9% ± 0.4% Bank SD Worth 480 499 ± 2 4.0% ± 0.4% Total Bank Worths 6467 6654 ± 4 2.9% ± 0.1% DBW (pcm/ppm) -10.77 -10.21 ± 0.02 0.56 ITC (pcm/F) -2.17 -3.18 ± 0.04 -1.01
26
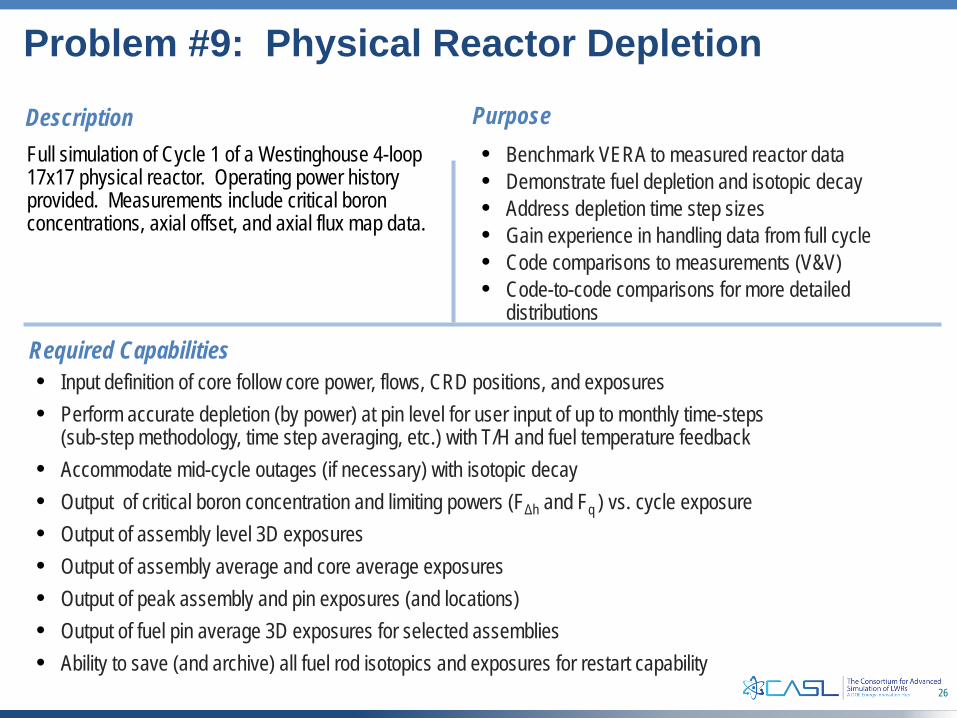
Required Capabilities• Input definition of core follow core power, flows, CRD positions, and exposures• Perform accurate depletion (by power) at pin level for user input of up to monthly time-steps
(sub-step methodology, time step averaging, etc.) with T/H and fuel temperature feedback• Accommodate mid-cycle outages (if necessary) with isotopic decay• Output of critical boron concentration and limiting powers (FΔh and Fq ) vs. cycle exposure• Output of assembly level 3D exposures• Output of assembly average and core average exposures• Output of peak assembly and pin exposures (and locations)• Output of fuel pin average 3D exposures for selected assemblies• Ability to save (and archive) all fuel rod isotopics and exposures for restart capability
DescriptionFull simulation of Cycle 1 of a Westinghouse 4-loop 17x17 physical reactor. Operating power history provided. Measurements include critical boron concentrations, axial offset, and axial flux map data.
Problem #9: Physical Reactor Depletion
Purpose• Benchmark VERA to measured reactor data• Demonstrate fuel depletion and isotopic decay• Address depletion time step sizes• Gain experience in handling data from full cycle• Code comparisons to measurements (V&V)• Code-to-code comparisons for more detailed
distributions
28
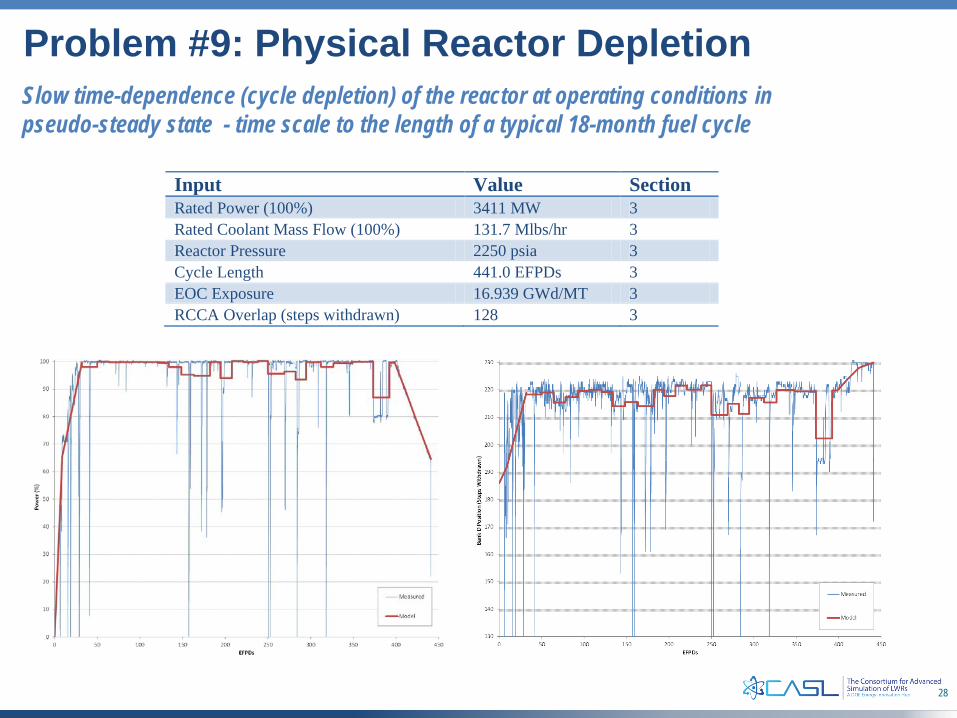
Slow time-dependence (cycle depletion) of the reactor at operating conditions in pseudo-steady state - time scale to the length of a typical 18-month fuel cycle
Problem #9: Physical Reactor Depletion
Input Value Section Rated Power (100%) 3411 MW 3 Rated Coolant Mass Flow (100%) 131.7 Mlbs/hr 3 Reactor Pressure 2250 psia 3 Cycle Length 441.0 EFPDs 3 EOC Exposure 16.939 GWd/MT 3 RCCA Overlap (steps withdrawn) 128 3
29
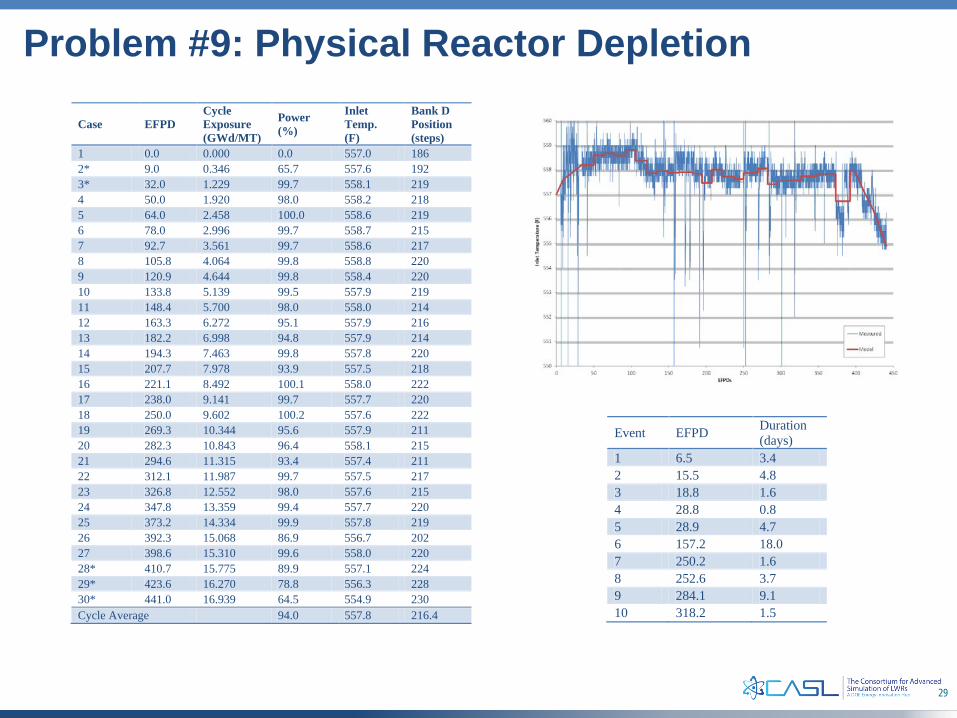
Problem #9: Physical Reactor Depletion
Case EFPD Cycle Exposure (GWd/MT)
Power (%)
Inlet Temp. (F)
Bank D Position (steps)
1 0.0 0.000 0.0 557.0 186 2* 9.0 0.346 65.7 557.6 192 3* 32.0 1.229 99.7 558.1 219 4 50.0 1.920 98.0 558.2 218 5 64.0 2.458 100.0 558.6 219 6 78.0 2.996 99.7 558.7 215 7 92.7 3.561 99.7 558.6 217 8 105.8 4.064 99.8 558.8 220 9 120.9 4.644 99.8 558.4 220 10 133.8 5.139 99.5 557.9 219 11 148.4 5.700 98.0 558.0 214 12 163.3 6.272 95.1 557.9 216 13 182.2 6.998 94.8 557.9 214 14 194.3 7.463 99.8 557.8 220 15 207.7 7.978 93.9 557.5 218 16 221.1 8.492 100.1 558.0 222 17 238.0 9.141 99.7 557.7 220 18 250.0 9.602 100.2 557.6 222 19 269.3 10.344 95.6 557.9 211 20 282.3 10.843 96.4 558.1 215 21 294.6 11.315 93.4 557.4 211 22 312.1 11.987 99.7 557.5 217 23 326.8 12.552 98.0 557.6 215 24 347.8 13.359 99.4 557.7 220 25 373.2 14.334 99.9 557.8 219 26 392.3 15.068 86.9 556.7 202 27 398.6 15.310 99.6 558.0 220 28* 410.7 15.775 89.9 557.1 224 29* 423.6 16.270 78.8 556.3 228 30* 441.0 16.939 64.5 554.9 230 Cycle Average 94.0 557.8 216.4
Event EFPD Duration (days)
1 6.5 3.4 2 15.5 4.8 3 18.8 1.6 4 28.8 0.8 5 28.9 4.7 6 157.2 18.0 7 250.2 1.6 8 252.6 3.7 9 284.1 9.1 10 318.2 1.5
30
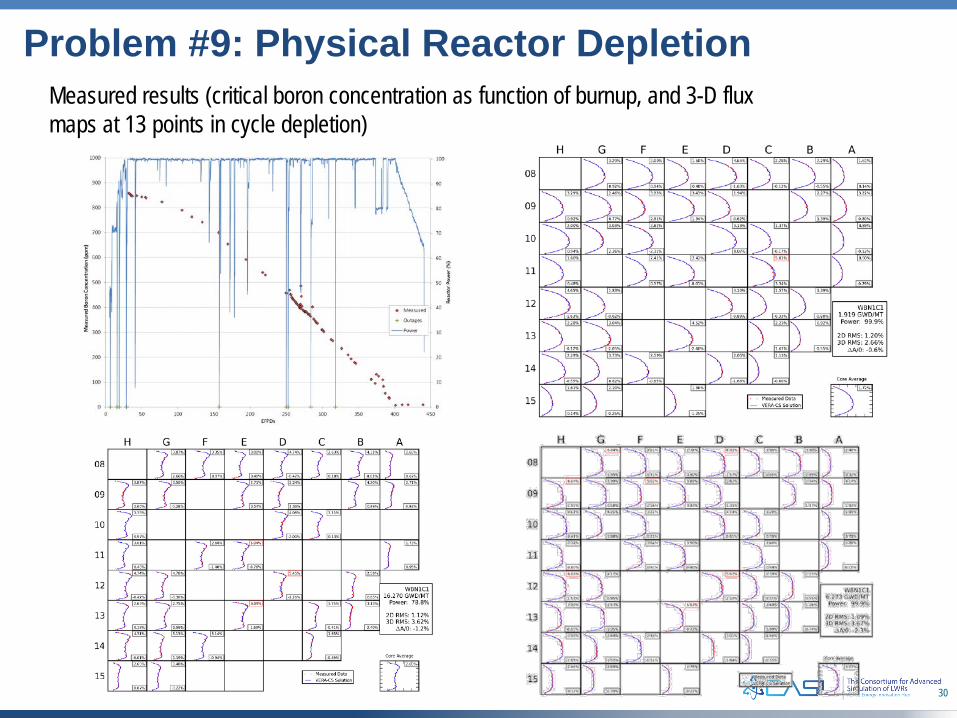
Problem #9: Physical Reactor Depletion Measured results (critical boron concentration as function of burnup, and 3-D flux maps at 13 points in cycle depletion)
31
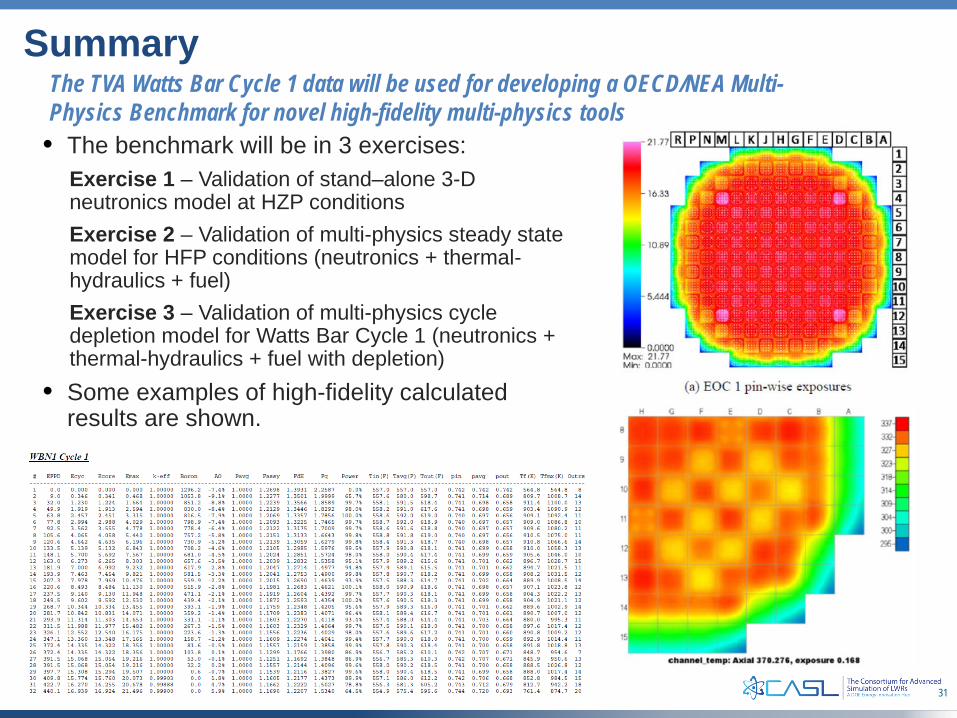
The TVA Watts Bar Cycle 1 data will be used for developing a OECD/NEA Multi-Physics Benchmark for novel high-fidelity multi-physics tools• The benchmark will be in 3 exercises:
Exercise 1 – Validation of stand–alone 3-D neutronics model at HZP conditions Exercise 2 – Validation of multi-physics steady state model for HFP conditions (neutronics + thermal-hydraulics + fuel)Exercise 3 – Validation of multi-physics cycle depletion model for Watts Bar Cycle 1 (neutronics + thermal-hydraulics + fuel with depletion)
• Some examples of high-fidelity calculated results are shown.
Summary

OECD/NEA Rostov-2 Multi-Physics Benchmarko A large number of tests with a multitude of well-documented neutron-physics
and thermal-hydraulics measurements data have been performed at Rostov -Unit 2 NPP.
o Integral (plant) data and local measured data (core) were collected during the test, which will be used for the validation of both traditional and novel multi-physics codes.
o The measurement and recording of parameters was performed by the standard means available at NPP and by a special system of experimental control (SEC).
o As a result, the specification of the “Phase 1” for the first OECD/NEA EGMPEBV multi-physics benchmark is being developed, based on Rostov-2 NPP experimental, operation and measured data.
o The reactor type is VVER-1000 with new modern fuel assemblies TBC-2M which enable an 18-month fuel cycle length.
Introduction
o The benchmark team selected a test (transient), which will allow validation of novel multi-physics codes developed last years in the frame of different national and international projects.
o The difference in comparison with all previous NEA/OECD Benchmarks for coupled code validation is the implementation of high fidelity multi-physics simulation codes that could predict pin-by-pin power distributions and flow mixing in the primary loop, in the reactor pressure vessel including its active core part.
o The reference benchmark problem chosen for simulation and comparison with the measured data is based on a test characterized with the following scenario –
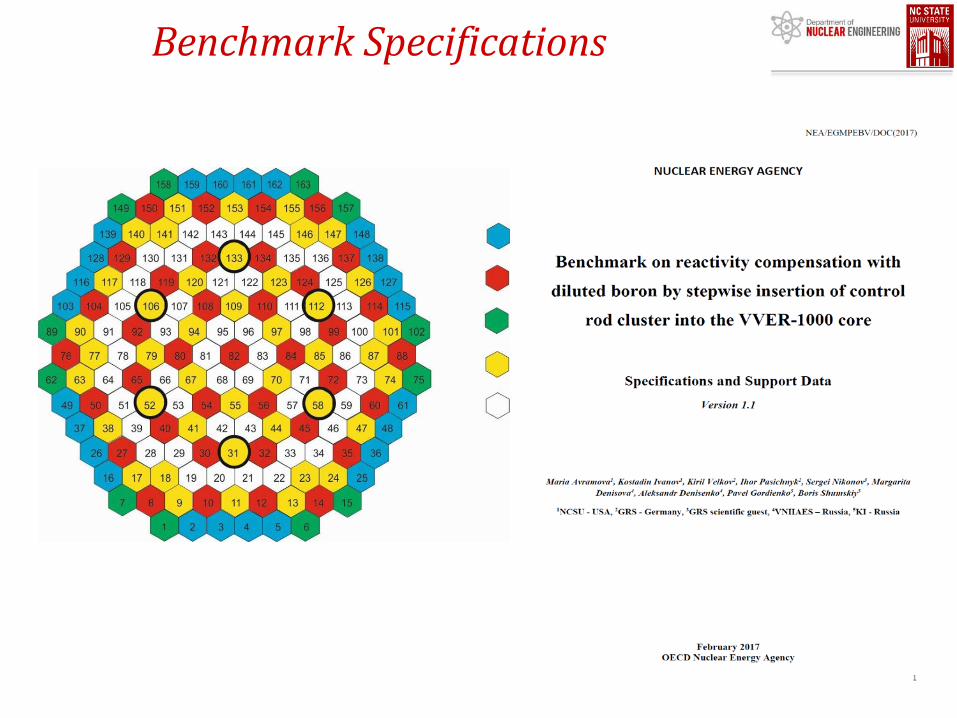
“Reactivity compensation with diluted boron by stepwise insertion of control rod cluster into the VVER core”
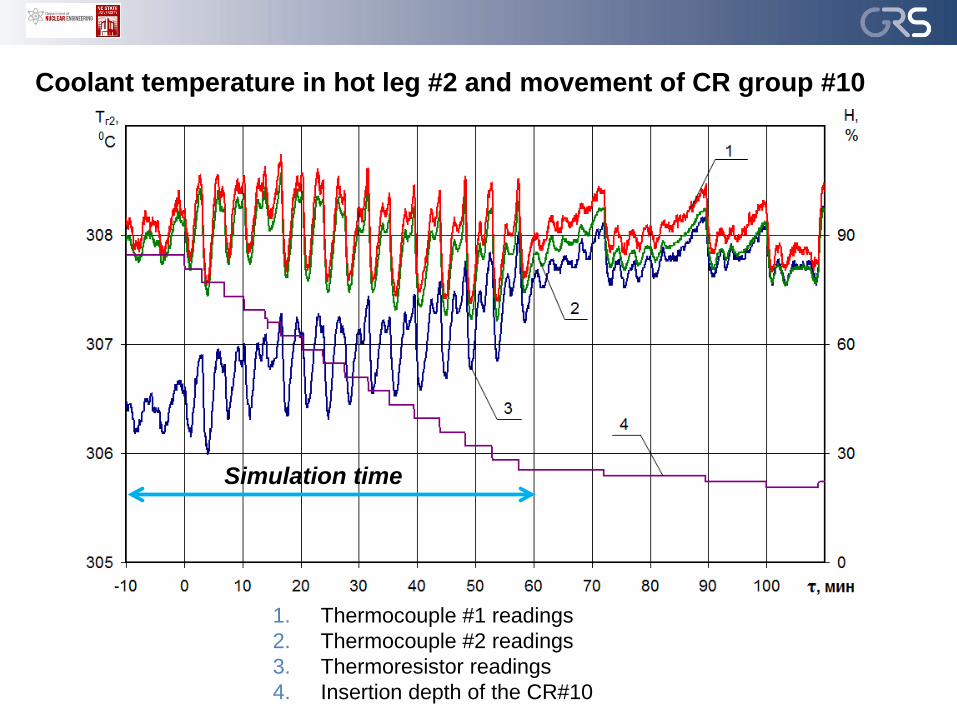
Coolant temperature in hot leg #2 and movement of CR group #10
1. Thermocouple #1 readings2. Thermocouple #2 readings3. Thermoresistor readings4. Insertion depth of the CR#10
Simulation time
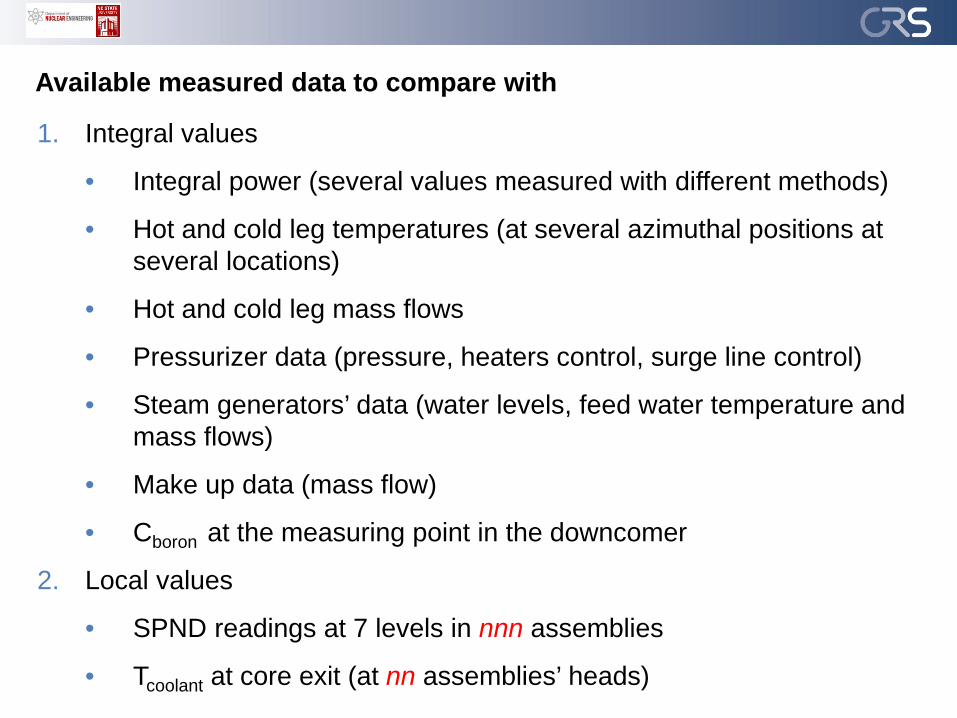
Available measured data to compare with
1. Integral values
• Integral power (several values measured with different methods)
• Hot and cold leg temperatures (at several azimuthal positions at several locations)
• Hot and cold leg mass flows
• Pressurizer data (pressure, heaters control, surge line control)
• Steam generators’ data (water levels, feed water temperature and mass flows)
• Make up data (mass flow)
• Cboron at the measuring point in the downcomer
2. Local values
• SPND readings at 7 levels in nnn assemblies
• Tcoolant at core exit (at nn assemblies’ heads)
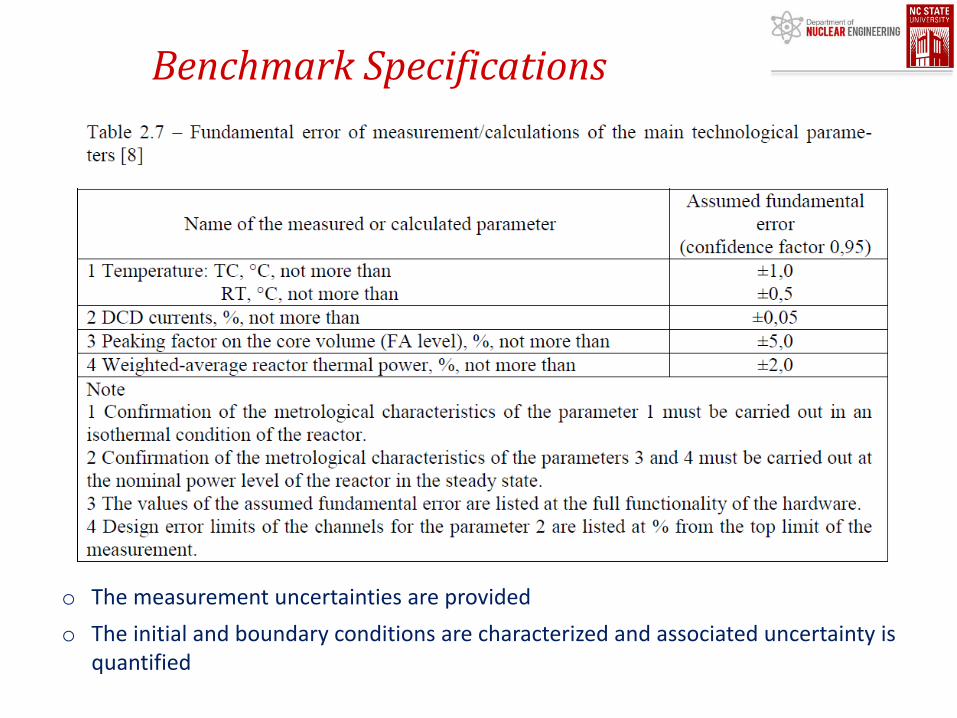
Benchmark Specifications
o The measurement uncertainties are provided o The initial and boundary conditions are characterized and associated uncertainty is
quantified
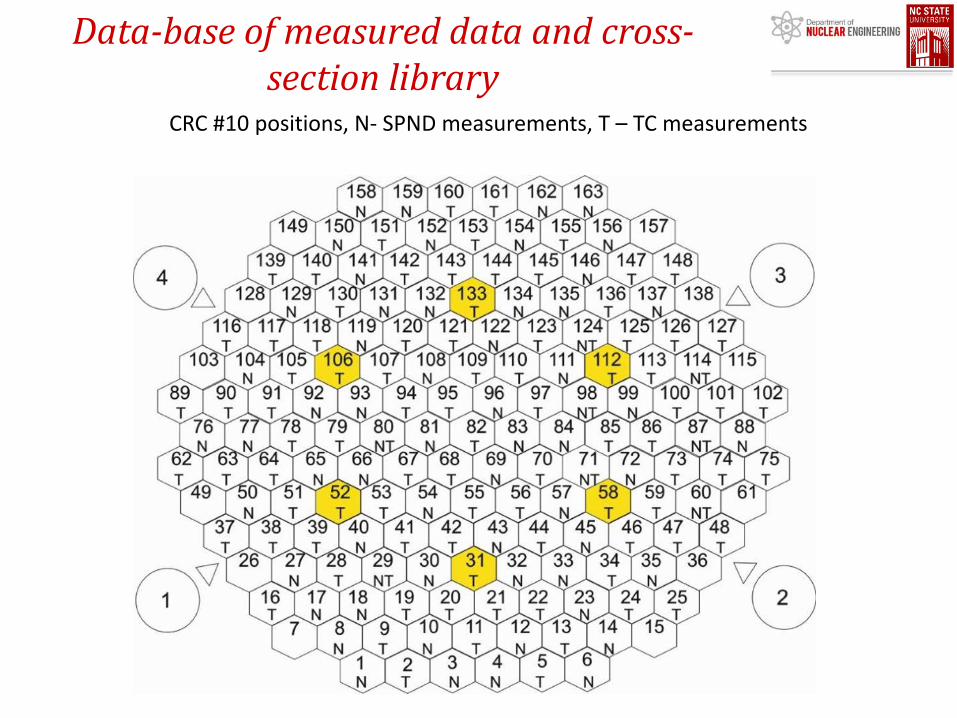
Data-base of measured data and cross-section library
CRC #10 positions, N- SPND measurements, T – TC measurements
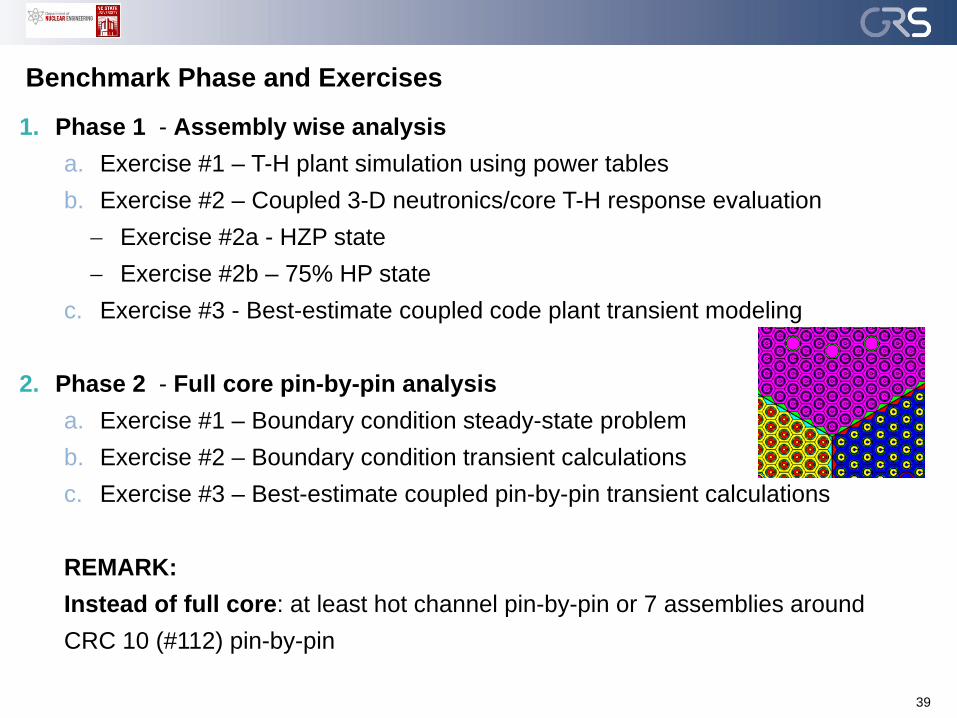
Benchmark Phase and Exercises
1. Phase 1 - Assembly wise analysisa. Exercise #1 – T-H plant simulation using power tablesb. Exercise #2 – Coupled 3-D neutronics/core T-H response evaluation− Exercise #2a - HZP state− Exercise #2b – 75% HP state
c. Exercise #3 - Best-estimate coupled code plant transient modeling
2. Phase 2 - Full core pin-by-pin analysisa. Exercise #1 – Boundary condition steady-state problemb. Exercise #2 – Boundary condition transient calculationsc. Exercise #3 – Best-estimate coupled pin-by-pin transient calculations
REMARK: Instead of full core: at least hot channel pin-by-pin or 7 assemblies around CRC 10 (#112) pin-by-pin
39
40
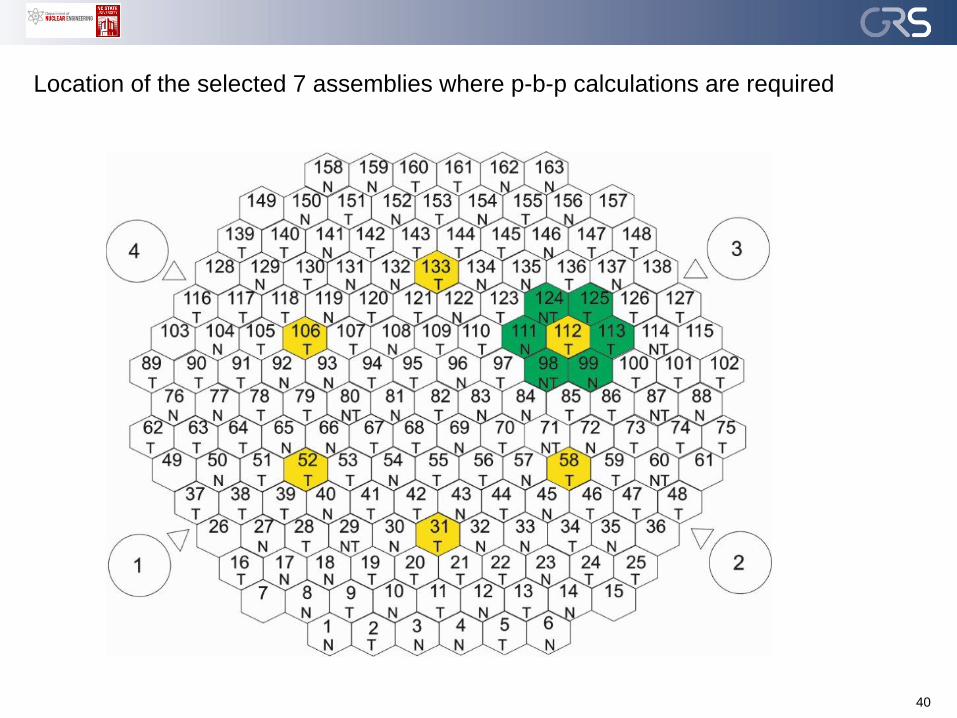
Location of the selected 7 assemblies where p-b-p calculations are required
41
OECD/NEA deterministic time-dependent neutron transport benchmark (C5G7-TD)
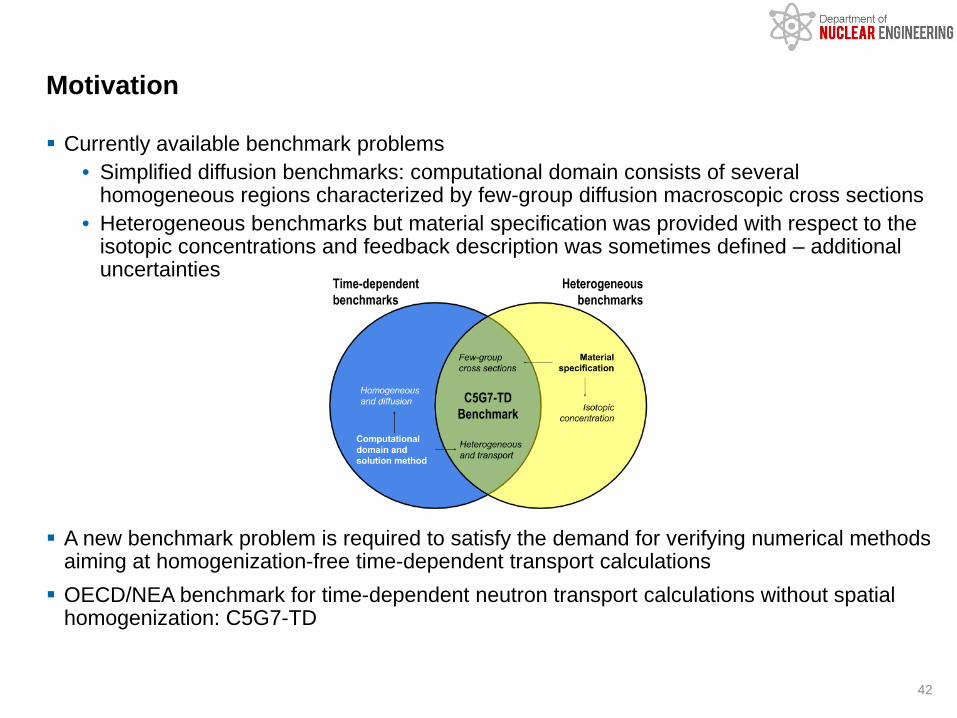
Currently available benchmark problems• Simplified diffusion benchmarks: computational domain consists of several
homogeneous regions characterized by few-group diffusion macroscopic cross sections• Heterogeneous benchmarks but material specification was provided with respect to the
isotopic concentrations and feedback description was sometimes defined – additional uncertainties
A new benchmark problem is required to satisfy the demand for verifying numerical methods aiming at homogenization-free time-dependent transport calculations OECD/NEA benchmark for time-dependent neutron transport calculations without spatial
homogenization: C5G7-TD
Motivation
42
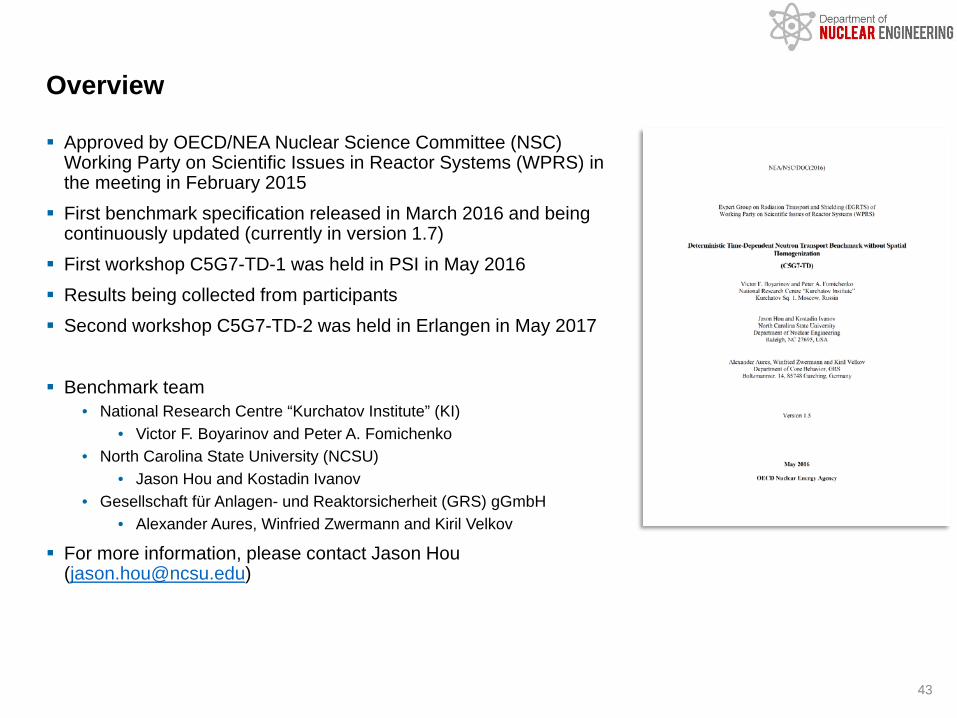
Approved by OECD/NEA Nuclear Science Committee (NSC) Working Party on Scientific Issues in Reactor Systems (WPRS) in the meeting in February 2015
First benchmark specification released in March 2016 and being continuously updated (currently in version 1.7)
First workshop C5G7-TD-1 was held in PSI in May 2016 Results being collected from participants Second workshop C5G7-TD-2 was held in Erlangen in May 2017
Benchmark team• National Research Centre “Kurchatov Institute” (KI)
• Victor F. Boyarinov and Peter A. Fomichenko• North Carolina State University (NCSU)
• Jason Hou and Kostadin Ivanov• Gesellschaft für Anlagen- und Reaktorsicherheit (GRS) gGmbH
• Alexander Aures, Winfried Zwermann and Kiril Velkov
For more information, please contact Jason Hou ([email protected])
Overview
43

Phase I: Kinetics Phase• Verification of methods/codes for heterogeneous time-dependent neutron transport
calculations without feedback• Currently in progress: collecting results and performing comparative analysis
Phase II: Dynamics Phase• Verification of methods/codes for heterogeneous time-dependent neutron transport
calculations with feedback• Currently in progress: draft specification released
Phase III: High-fidelity Phase• Uncertainty propagation in high-fidelity multi-physics calculations• Future: starting from 2018
C5G7-TD benchmark: schedule
44
Based on well-known steady-state Benchmark on Deterministic Transport Calculations Without Spatial Homogenization (C5G7 benchmark)
• Originally a 2D benchmark• Extended version is a 3D model and it contains control rod characteristics
Miniature LWR core with quarter-core symmetry and with given seven-group cross-sections Core consists of 8 MOX and 8 UO2 assemblies surrounded by moderator No uncertainties in initial data
• 7-group cross sections and kinetics data prepared by benchmark teams• All possible differences in results will be caused only by methodical errors and
differences of applied codes Accurate model specification of the C5G7 benchmark is available
C5G7-TD benchmark: background
45
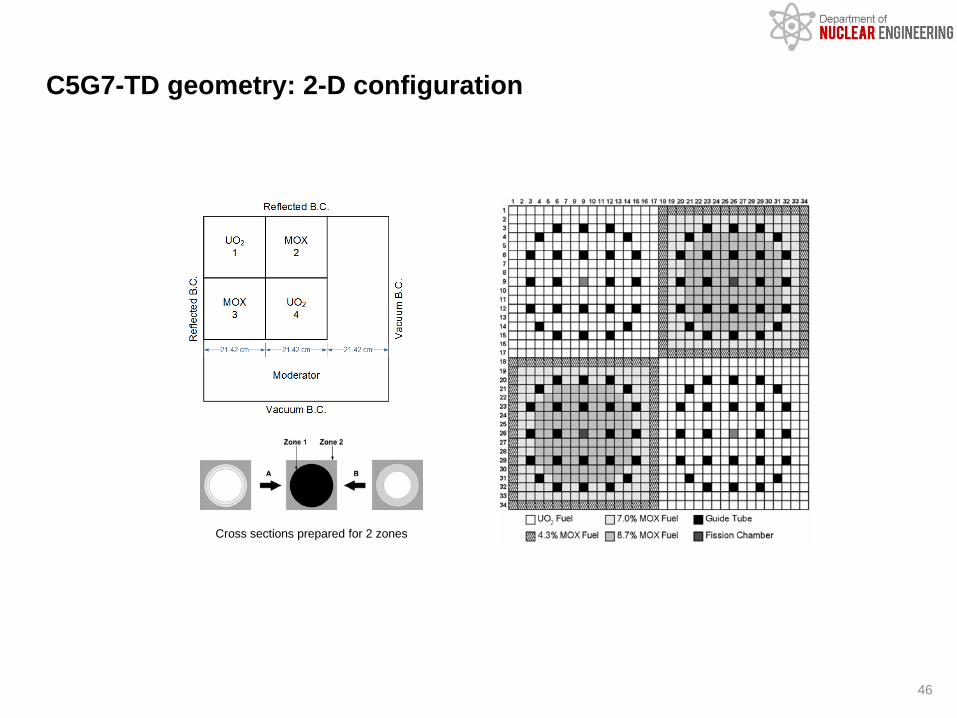
C5G7-TD geometry: 2-D configuration
46
Cross sections prepared for 2 zones

C5G7-TD geometry: 3-D configuration
47
Top water reflector
Fission chambers and control rods present in axial reflector region should be modelled
Extended height
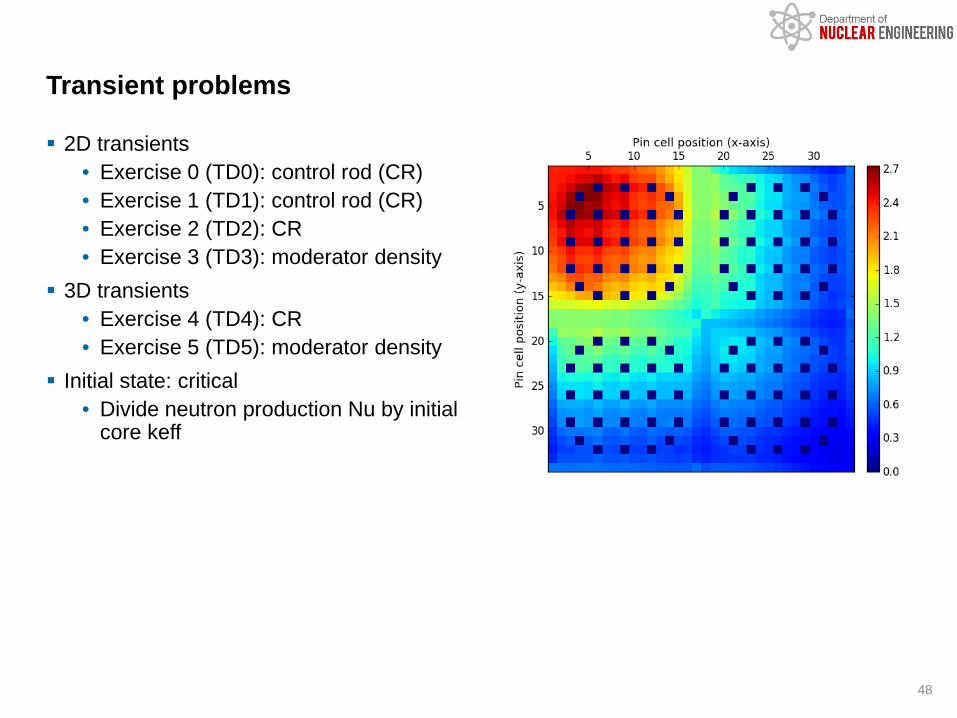
2D transients• Exercise 0 (TD0): control rod (CR)• Exercise 1 (TD1): control rod (CR)• Exercise 2 (TD2): CR• Exercise 3 (TD3): moderator density
3D transients• Exercise 4 (TD4): CR• Exercise 5 (TD5): moderator density
Initial state: critical • Divide neutron production Nu by initial
core keff
Transient problems
48
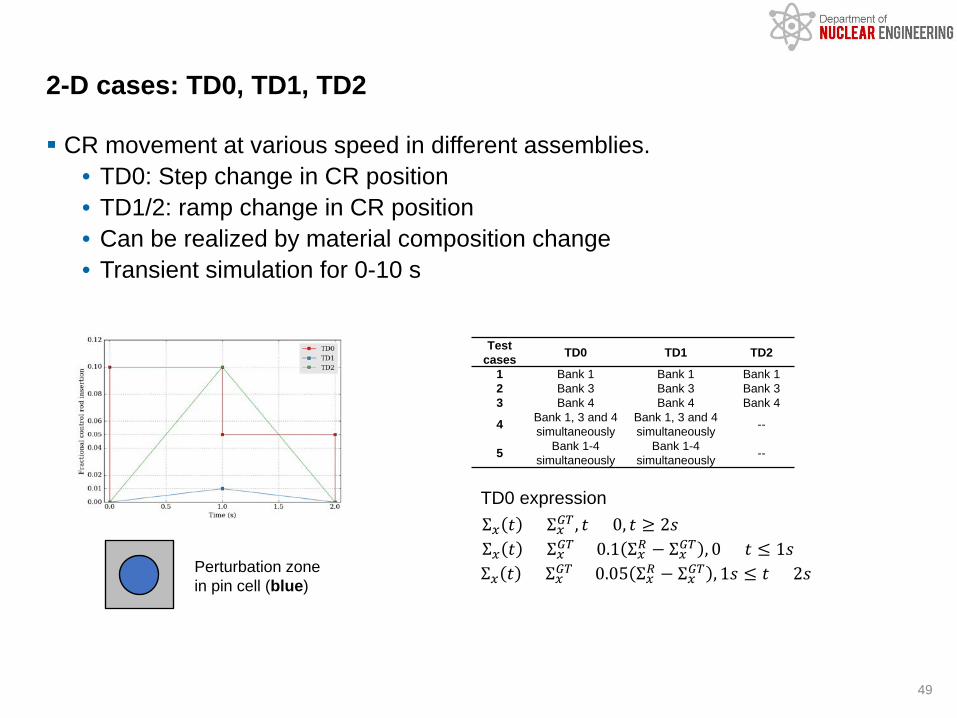
CR movement at various speed in different assemblies. • TD0: Step change in CR position• TD1/2: ramp change in CR position• Can be realized by material composition change• Transient simulation for 0-10 s
2-D cases: TD0, TD1, TD2
49
Perturbation zonein pin cell (blue)
Test cases TD0 TD1 TD2
1 Bank 1 Bank 1 Bank 12 Bank 3 Bank 3 Bank 33 Bank 4 Bank 4 Bank 4
4 Bank 1, 3 and 4 simultaneously
Bank 1, 3 and 4 simultaneously --
5 Bank 1-4 simultaneously
Bank 1-4 simultaneously --
Σ𝑥𝑥 𝑡𝑡 = Σ𝑥𝑥𝐺𝐺𝐺𝐺 , 𝑡𝑡 = 0, 𝑡𝑡 ≥ 2𝑠𝑠Σ𝑥𝑥 𝑡𝑡 = Σ𝑥𝑥𝐺𝐺𝐺𝐺 + 0.1 Σ𝑥𝑥𝑅𝑅 − Σ𝑥𝑥𝐺𝐺𝐺𝐺 , 0 < 𝑡𝑡 ≤ 1𝑠𝑠Σ𝑥𝑥 𝑡𝑡 = Σ𝑥𝑥𝐺𝐺𝐺𝐺 + 0.05 Σ𝑥𝑥𝑅𝑅 − Σ𝑥𝑥𝐺𝐺𝐺𝐺 , 1𝑠𝑠 ≤ 𝑡𝑡 < 2𝑠𝑠
TD0 expression

Moderator density changes uniformly across the core • Perturbation is approximated by linearly decreasing moderator cross section in
all energy groups during density decrease • Then perturbation continues by linearly increasing these cross sections to
initial values during density increase• Speed of change varies for test problems• 4 test problems: transient simulation for 0-10 s
2-D cases: TD3
50
Perturbation zonein pin cell (grey)
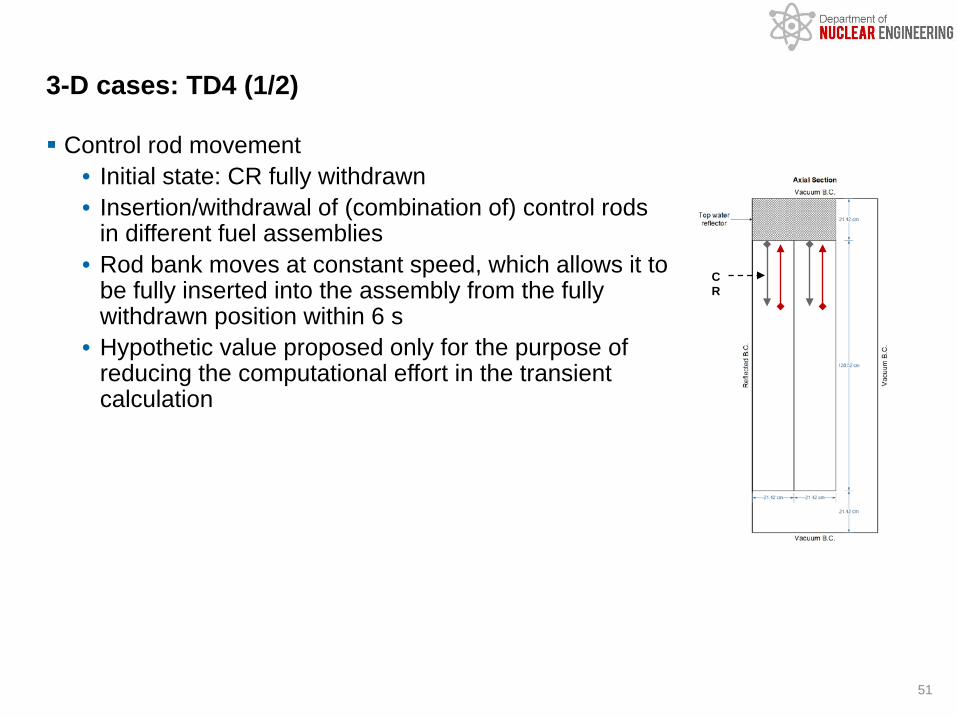
Control rod movement• Initial state: CR fully withdrawn• Insertion/withdrawal of (combination of) control rods
in different fuel assemblies• Rod bank moves at constant speed, which allows it to
be fully inserted into the assembly from the fully withdrawn position within 6 s
• Hypothetic value proposed only for the purpose of reducing the computational effort in the transient calculation
3-D cases: TD4 (1/2)
51
CR
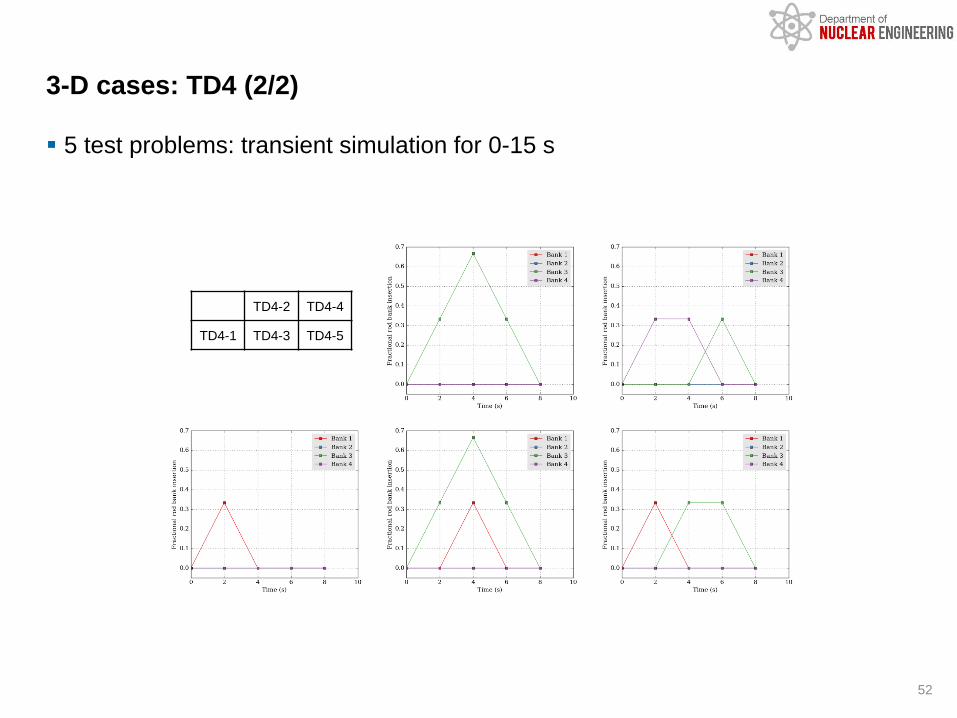
5 test problems: transient simulation for 0-15 s
3-D cases: TD4 (2/2)
52
TD4-2 TD4-4
TD4-1 TD4-3 TD4-5
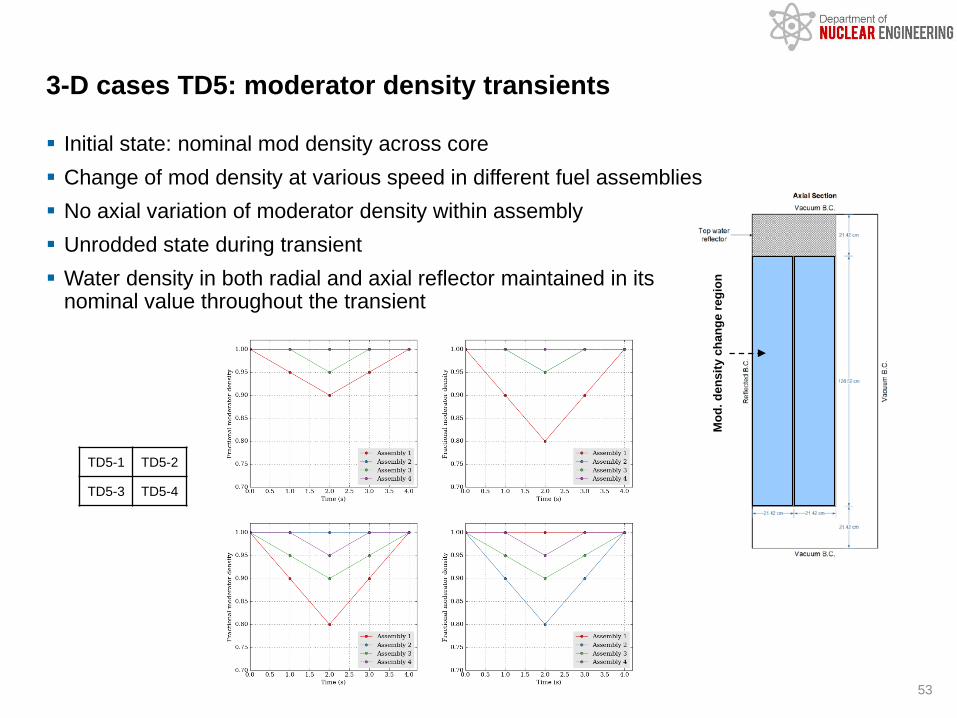
Initial state: nominal mod density across core Change of mod density at various speed in different fuel assemblies No axial variation of moderator density within assembly Unrodded state during transient Water density in both radial and axial reflector maintained in its
nominal value throughout the transient
3-D cases TD5: moderator density transients
53
Mod
. den
sity
cha
nge
regi
on
TD5-1 TD5-2
TD5-3 TD5-4

Submitted results for Phase I
54
Participants Code TD0 TD1 TD2 TD3 TD4 TD5
Idaho National Laboratory (INL) Rattlesnake* x x x
IQS x x o
National Research Centre Kurchatov Institute (KI) SUHAM-TD x x x x
Paul Sherrer Institut (PSI) nTRACER x x x x x x
Seoul National University (SNU) nTRACER x x x x x
Tsinghua University (THU) RMC x x x x x x
University of Michigan (UM) MPACT x x x
Xi’an Jiaotong University (XJTU) NECP-X x x x x
* Diffusion and diffusion w/ Improved Quasistatic Solution (IQS)
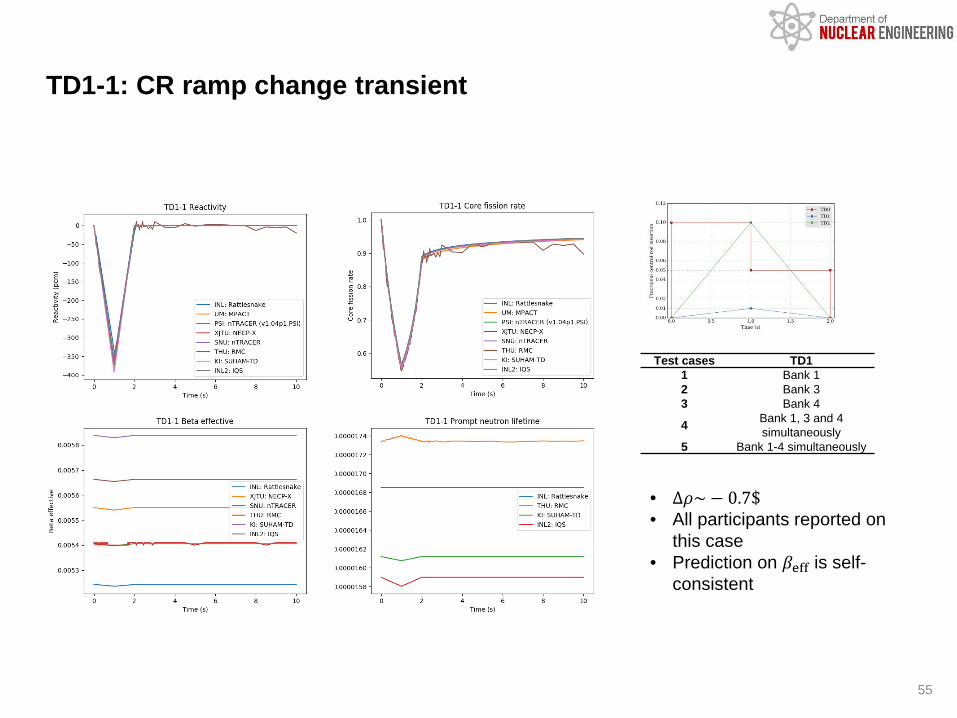
TD1-1: CR ramp change transient
55
Test cases TD11 Bank 12 Bank 33 Bank 4
4 Bank 1, 3 and 4 simultaneously
5 Bank 1-4 simultaneously
• Δ𝜌𝜌~ − 0.7$• All participants reported on
this case• Prediction on 𝛽𝛽eff is self-
consistent
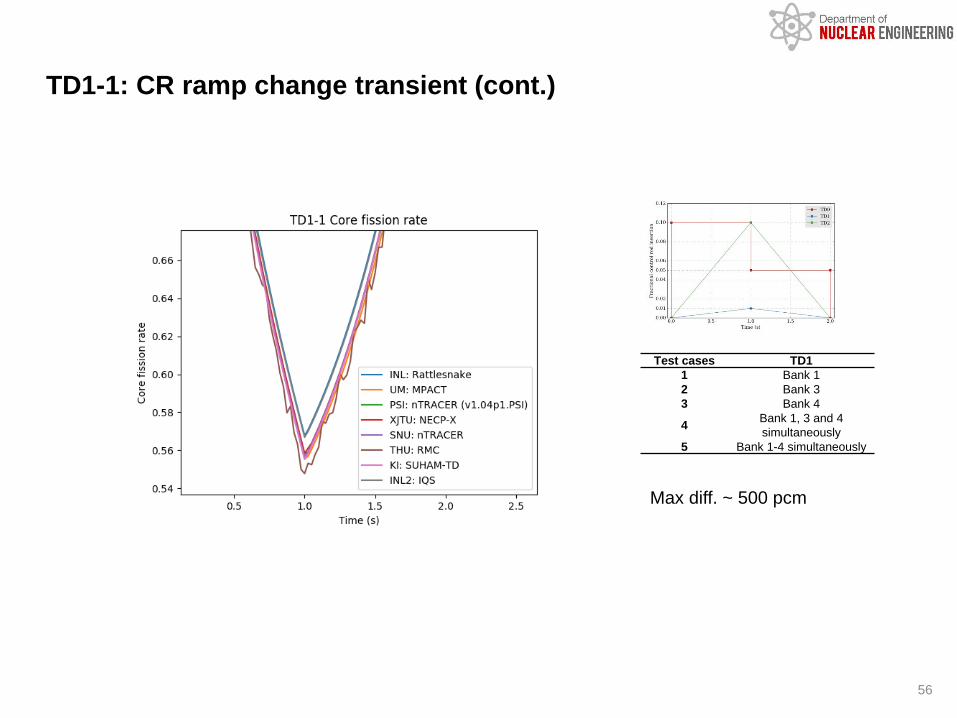
TD1-1: CR ramp change transient (cont.)
56
Test cases TD11 Bank 12 Bank 33 Bank 4
4 Bank 1, 3 and 4 simultaneously
5 Bank 1-4 simultaneously
Max diff. ~ 500 pcm
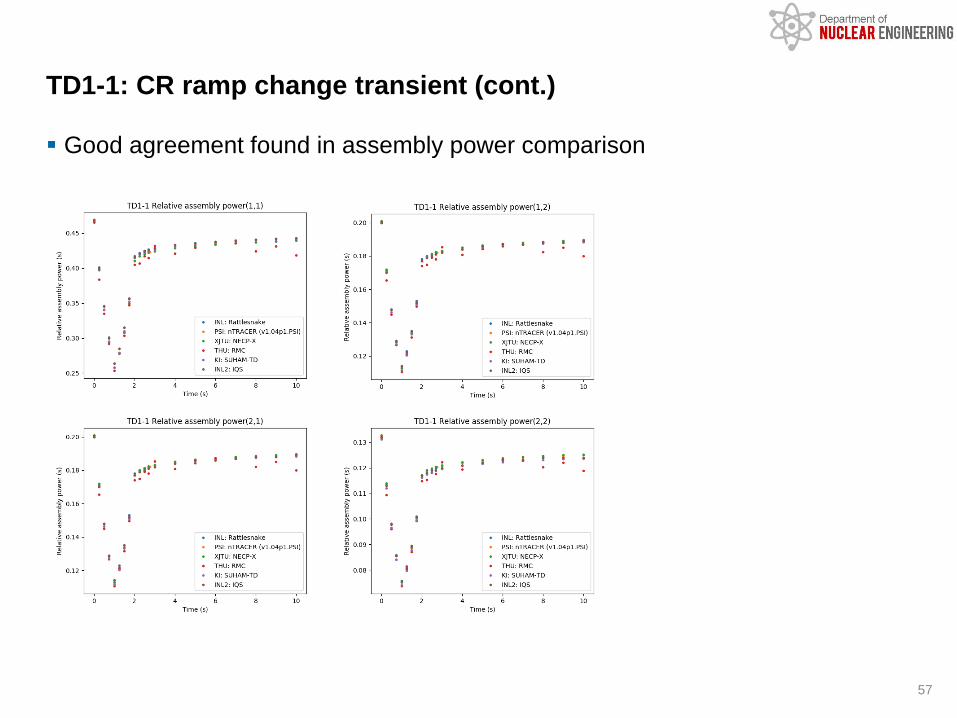
Good agreement found in assembly power comparison
TD1-1: CR ramp change transient (cont.)
57
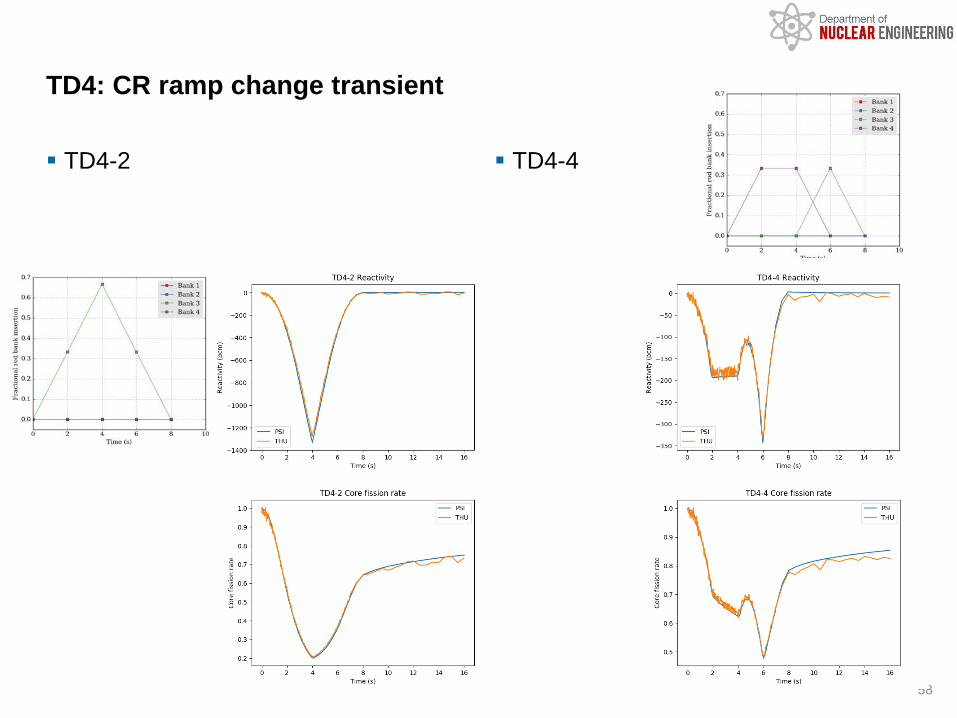
TD4-2 TD4-4
TD4: CR ramp change transient
58
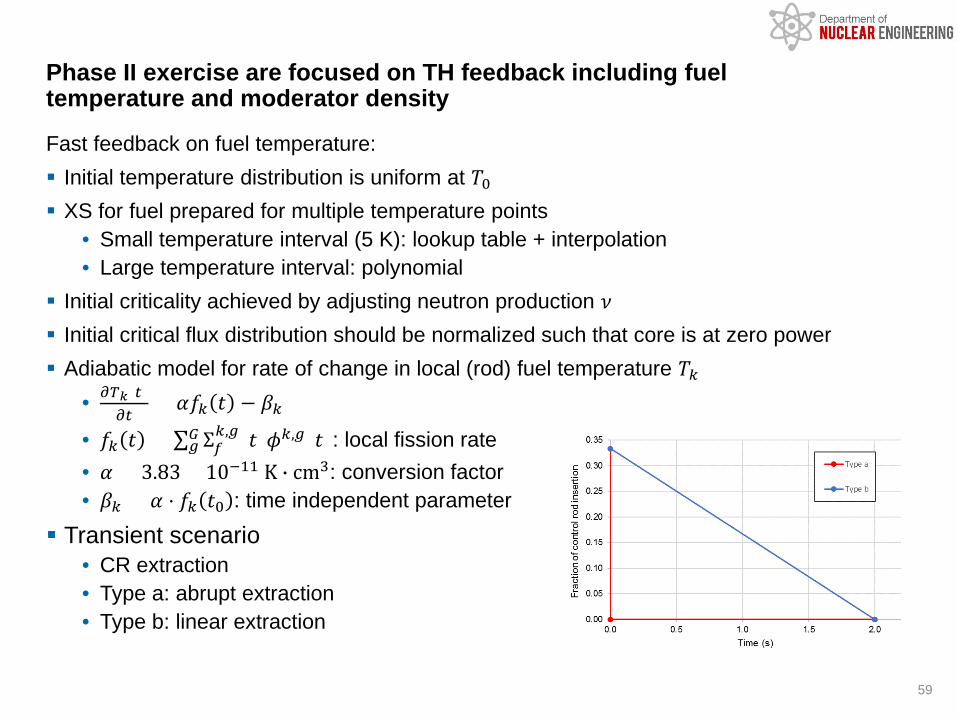
Fast feedback on fuel temperature: Initial temperature distribution is uniform at 𝑇𝑇0 XS for fuel prepared for multiple temperature points
• Small temperature interval (5 K): lookup table + interpolation• Large temperature interval: polynomial
Initial criticality achieved by adjusting neutron production 𝜈𝜈 Initial critical flux distribution should be normalized such that core is at zero power Adiabatic model for rate of change in local (rod) fuel temperature 𝑇𝑇𝑘𝑘
• 𝜕𝜕𝐺𝐺𝑘𝑘(𝑡𝑡)𝜕𝜕𝑡𝑡
= 𝛼𝛼𝑓𝑓𝑘𝑘 𝑡𝑡 − 𝛽𝛽𝑘𝑘• 𝑓𝑓𝑘𝑘 𝑡𝑡 = ∑𝑔𝑔𝐺𝐺 Σ𝑓𝑓
𝑘𝑘,𝑔𝑔(𝑡𝑡)𝜙𝜙𝑘𝑘,𝑔𝑔(𝑡𝑡): local fission rate• 𝛼𝛼 = 3.83 × 10⁻¹¹ K � cm3: conversion factor• 𝛽𝛽𝑘𝑘 = 𝛼𝛼 ⋅ 𝑓𝑓𝑘𝑘 𝑡𝑡0 : time independent parameter
Transient scenario• CR extraction• Type a: abrupt extraction• Type b: linear extraction
Phase II exercise are focused on TH feedback including fuel temperature and moderator density
59

This presentation summaries two sets of NEA/OECD multi-physics benchmarks For Traditional Multi-Physics Tools
• OECD/NRC PWR Main Steam Line (MSLB) benchmark• OECD/NRC BWR Turbine Trip (TT) benchmark • OECD/DOE/CEA VVER-1000 Coolant Transient (V1000CT) benchmark • OECD Kalinin-3 Coupled Neutronics Thermal-Hydraulic Transient benchmark • OECD/NRC Oskarshamn 2 BWR Stability benchmark
For Novel Multi-Physics Tools• CASL Watts Bar Unit 1 Cycle 1 benchmark• Rostov-2 VVER-1000 benchmark• C5G7-TD benchmark
Conclusions
60