Embed Size (px)
DESCRIPTION
OECD/NBS Workshop on national accounts 27-31 October 2008 Paris. Towards measuring the volume of health and education services Draft OECD Handbook Paul Schreyer, OECD/STD. Contents. Background General concepts Education Health Way forward. Background: OECD Project. - PowerPoint PPT Presentation
Citation preview
OECD/NBS Workshop on national accounts
27-31 October 2008Paris
Towards measuring the volume of health and education services
Draft OECD Handbook
Paul Schreyer, OECD/STD
Contents
• Background
• General concepts
• Education
• Health
• Way forward
Background: OECD Project
• Strong and continued demand for output measures of education and health by policy-makers
• European Regulation• Project started in 2005, endorsement by CSTAT• Builds on previous work: Eurostat Handbook on
Volume and Prices, Atkinson Report, country experiences
• Workshops in London (2006) and Paris (2007)• Objectives:
– OECD Handbook– Data development
Background: An old question – what is new?
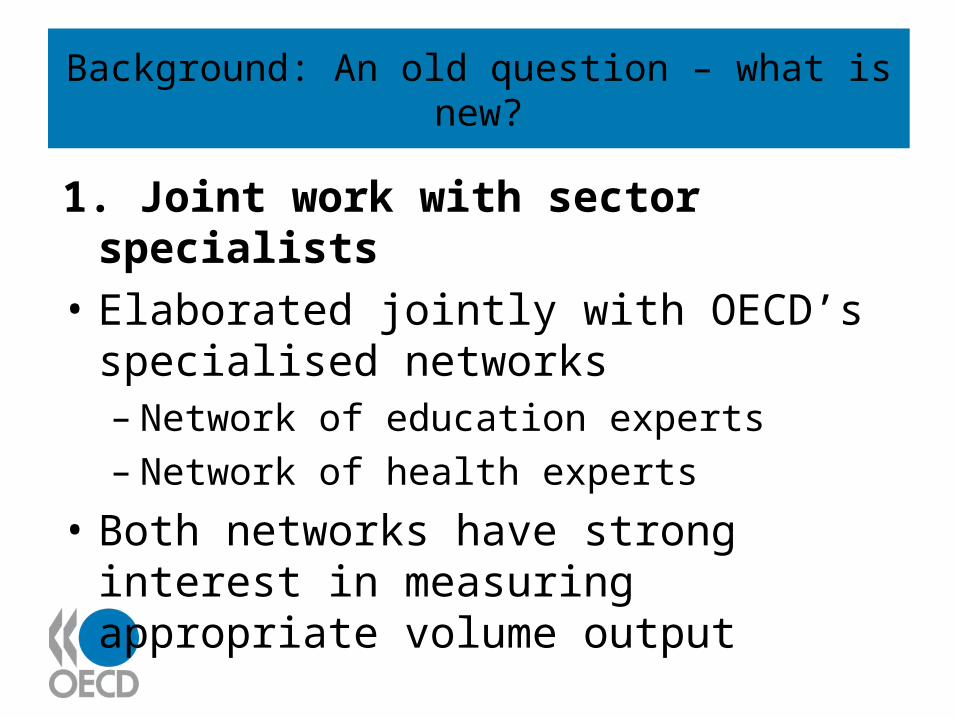
1. Joint work with sector specialists
• Elaborated jointly with OECD’s specialised networks– Network of education experts– Network of health experts
• Both networks have strong interest in measuring appropriate volume output
Background: An old question – what is new?
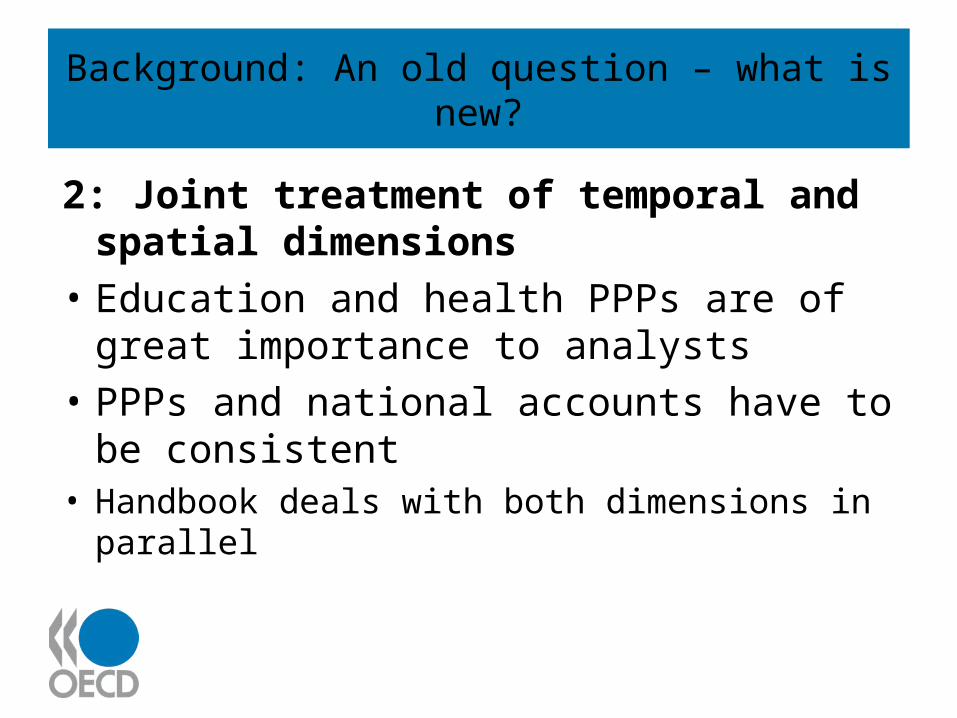
2: Joint treatment of temporal and spatial dimensions
• Education and health PPPs are of great importance to analysts
• PPPs and national accounts have to be consistent
• Handbook deals with both dimensions in parallel
Concepts and terminology
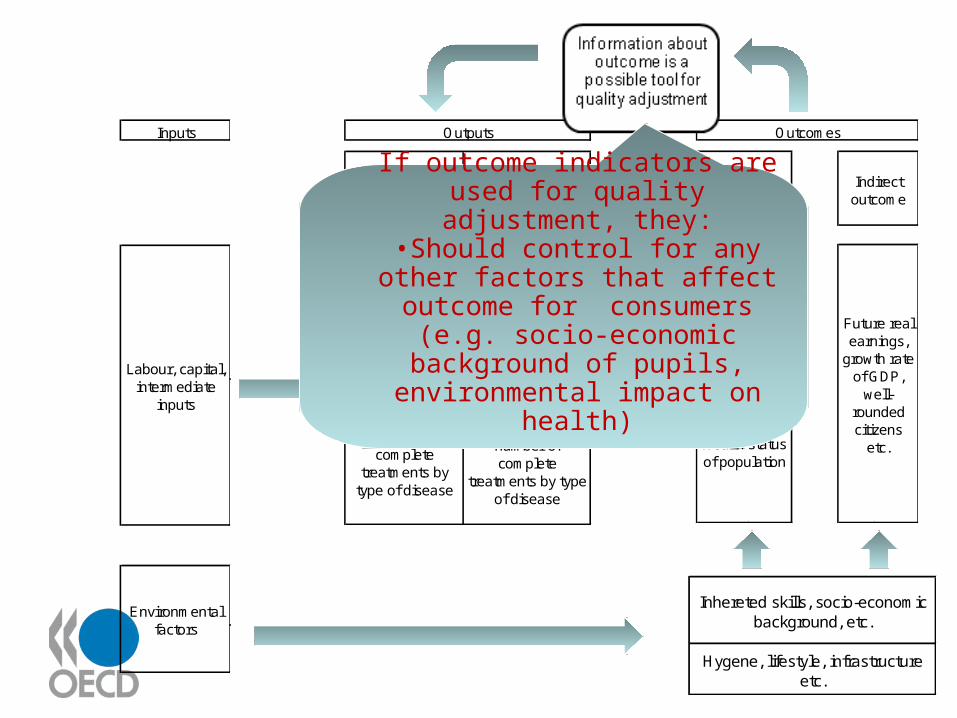
• Distinction must be made between inputs, outputs, outcomes -
• Best explained by way of a graph
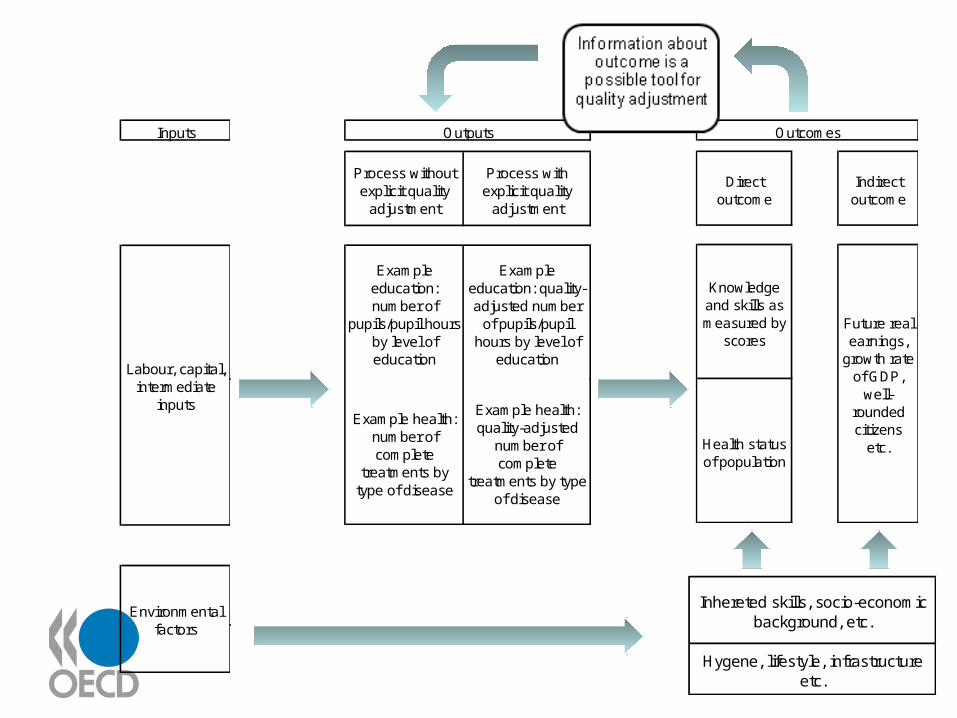
Inputs
Labour, capital, intermediate
inputs
Environmental factors
Information about outcome is a
possible tool for quality adjustment
Process without explicit quality
adjustment
Process with explicit quality
adjustment
Example education: number of
pupils/pupil hours by level of education
Example education: quality-adjusted number
of pupils/pupil hours by level of
education
Example health: number of complete
treatments by type of disease
Example health: quality-adjusted
number of complete
treatments by type of disease
Outputs
Information about outcome is a
possible tool for quality adjustment
Direct outcome
Indirect outcome
Knowledge and skills as measured by
scores
Health status of population
Future real earnings,
growth rate of GDP,
well-rounded citizens
etc.
Outcomes
Inhereted skills, socio-economic background, etc.
Hygene, lifestyle, infrastructure etc.
If outcome indicators are used for quality adjustment, they:
•Should control for any other factors that affect outcome for
consumers (e.g. socio-economic background of pupils,
environmental impact on health)
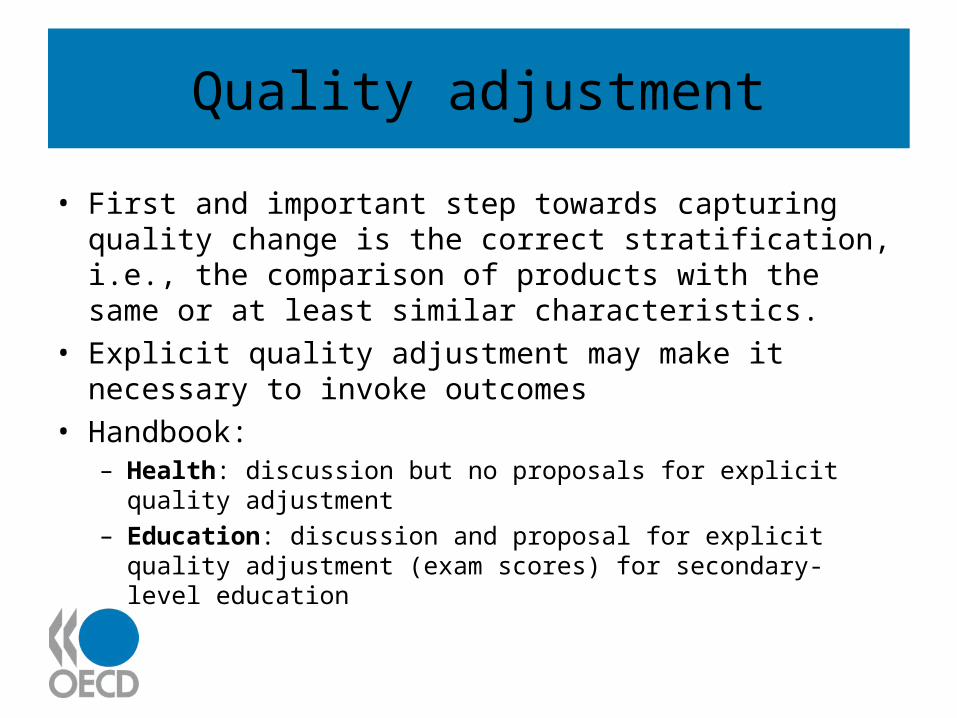
Quality adjustment
• First and important step towards capturing quality change is the correct stratification, i.e., the comparison of products with the same or at least similar characteristics.
• Explicit quality adjustment may make it necessary to invoke outcomes
• Handbook:– Health: discussion but no proposals for explicit quality
adjustment – Education: discussion and proposal for explicit quality
adjustment (exam scores) for secondary-level education
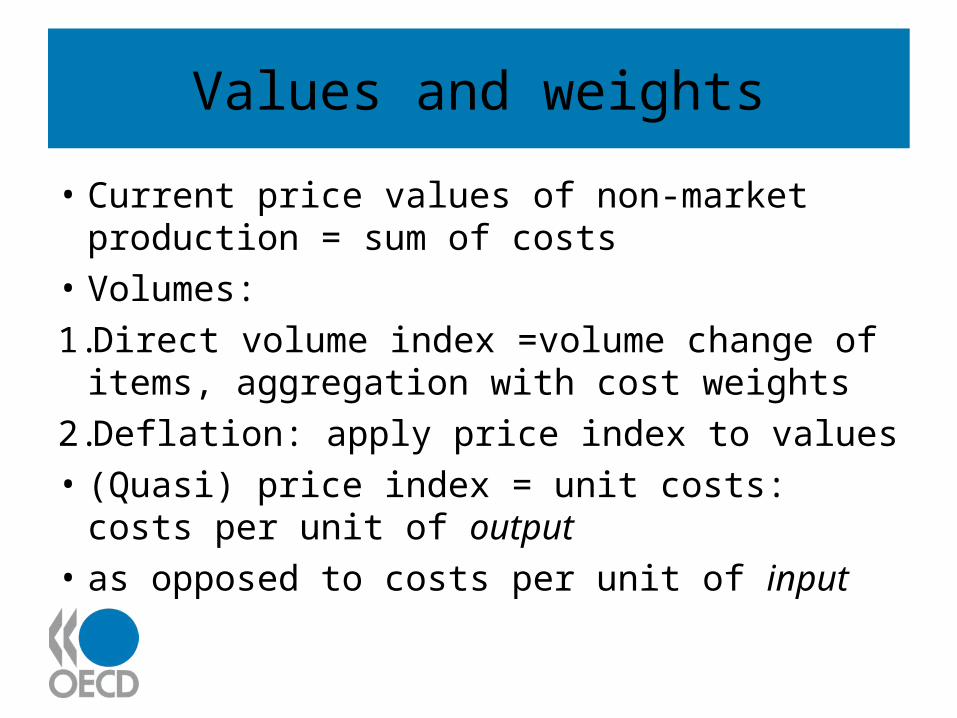
Values and weights
• Current price values of non-market production = sum of costs
• Volumes:
1.Direct volume index =volume change of items, aggregation with cost weights
2.Deflation: apply price index to values• (Quasi) price index = unit costs: costs per unit
of output • as opposed to costs per unit of input
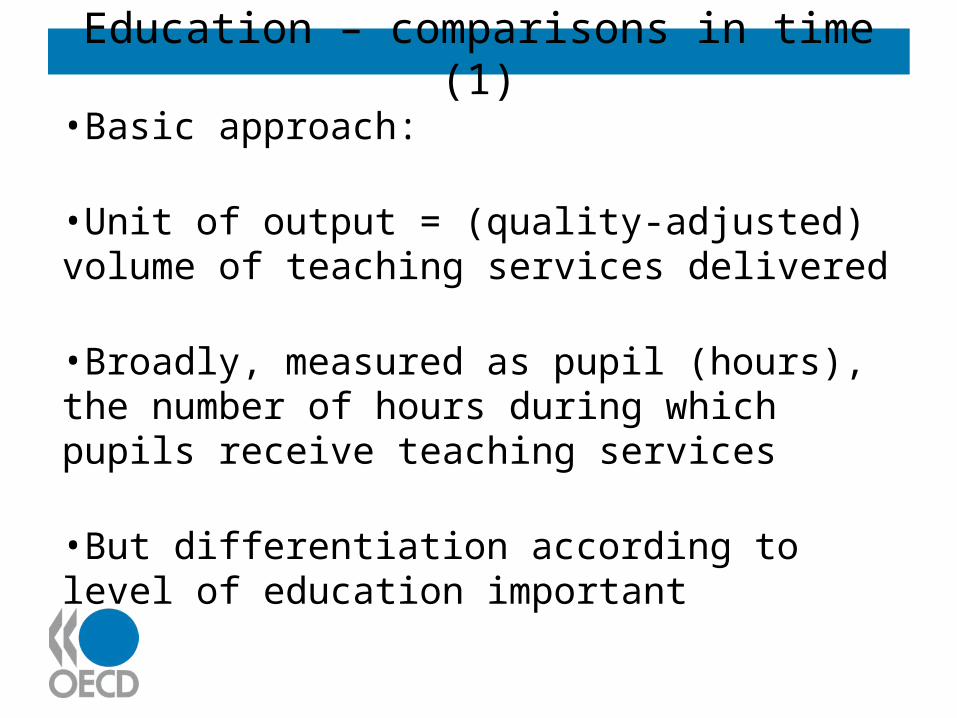
Education – comparisons in time (1)
•Basic approach:
•Unit of output = (quality-adjusted) volume of teaching services delivered
•Broadly, measured as pupil (hours), the number of hours during which pupils receive teaching services
•But differentiation according to level of education important
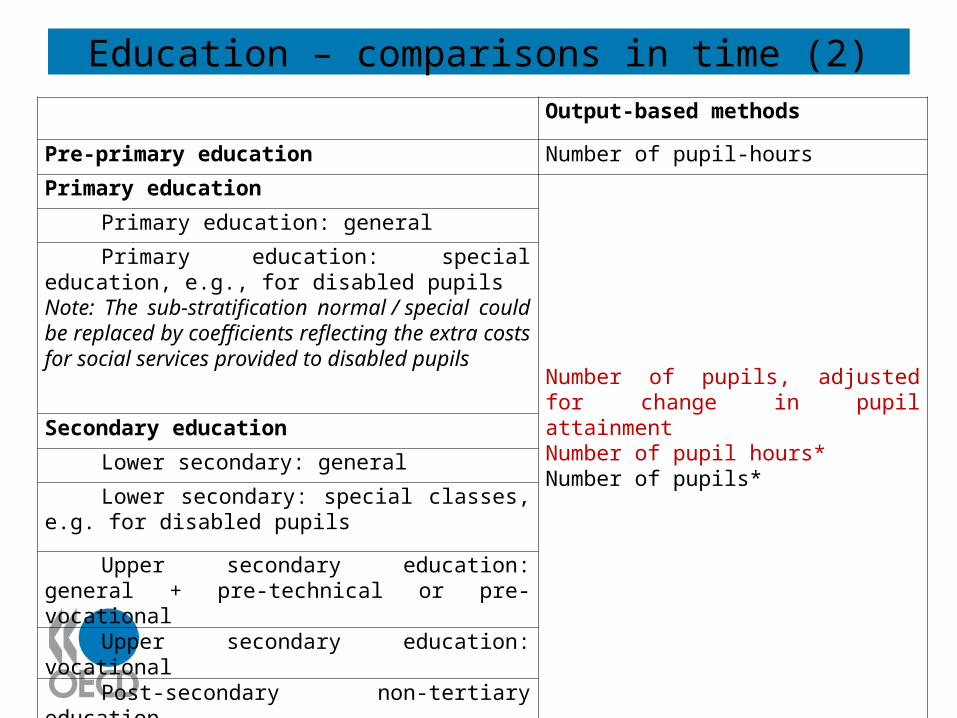
Education – comparisons in time (2)Output-based methods
Pre-primary education Number of pupil-hours
Primary education
Number of pupils, adjusted for change in pupil attainmentNumber of pupil hours*Number of pupils*
Primary education: general
Primary education: special education, e.g., for disabled pupilsNote: The sub-stratification normal / special could be replaced by coefficients reflecting the extra costs for social services provided to disabled pupils
Secondary education
Lower secondary: general
Lower secondary: special classes, e.g. for disabled pupils
Upper secondary education: general + pre-technical or pre-vocational
Upper secondary education: vocational
Post-secondary non-tertiary education
Education – comparisons in time (3)
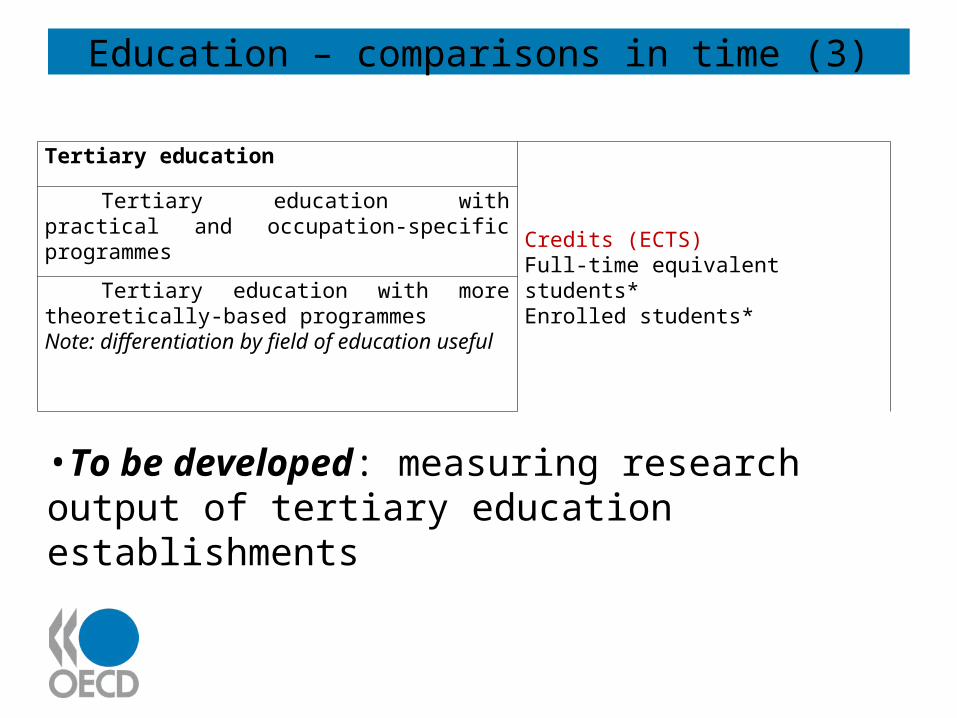
Tertiary education
Credits (ECTS) Full-time equivalent students*Enrolled students*
Tertiary education with practical and occupation-specific programmes
Tertiary education with more theoretically-based programmes Note: differentiation by field of education useful
•To be developed: measuring research output of tertiary education establishments
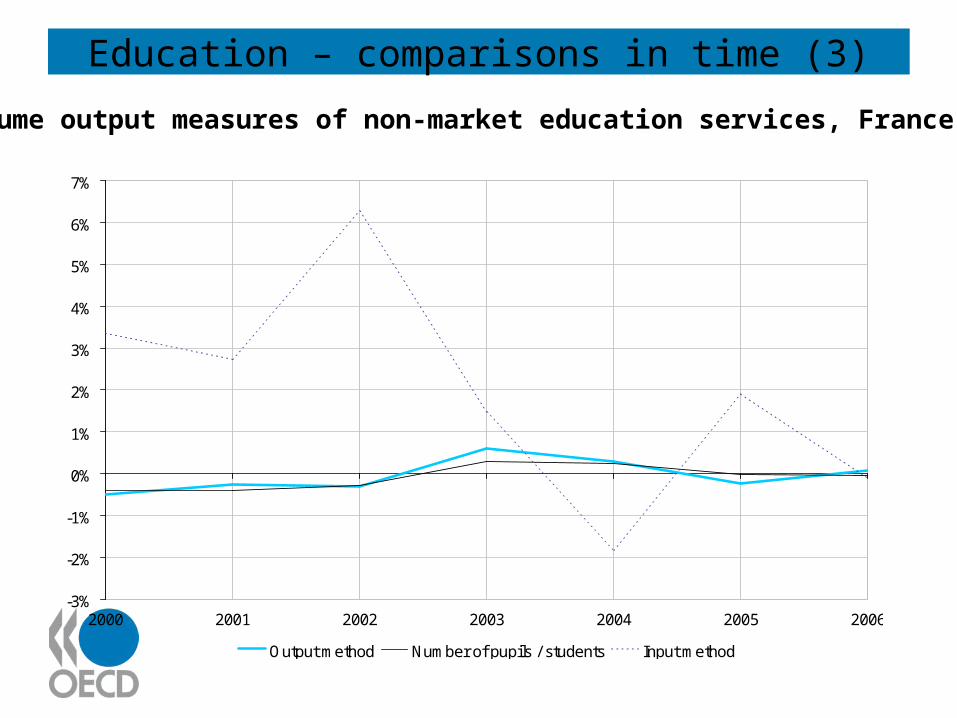
Education – comparisons in time (3)
Volume output measures of non-market education services, France
-3%
-2%
-1%
0%
1%
2%
3%
4%
5%
6%
7%
2000 2001 2002 2003 2004 2005 2006
Output method Number of pupils / students Input method
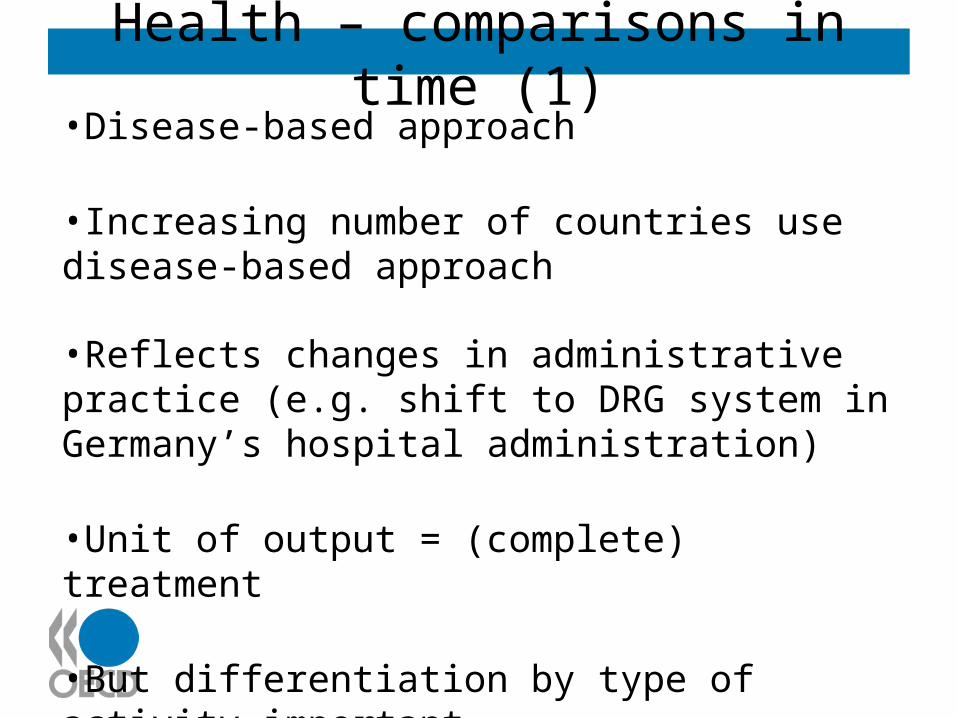
Health – comparisons in time (1)•Disease-based approach
•Increasing number of countries use disease-based approach
•Reflects changes in administrative practice (e.g. shift to DRG system in Germany’s hospital administration)
•Unit of output = (complete) treatment
•But differentiation by type of activity important•Unit of output may vary between activities
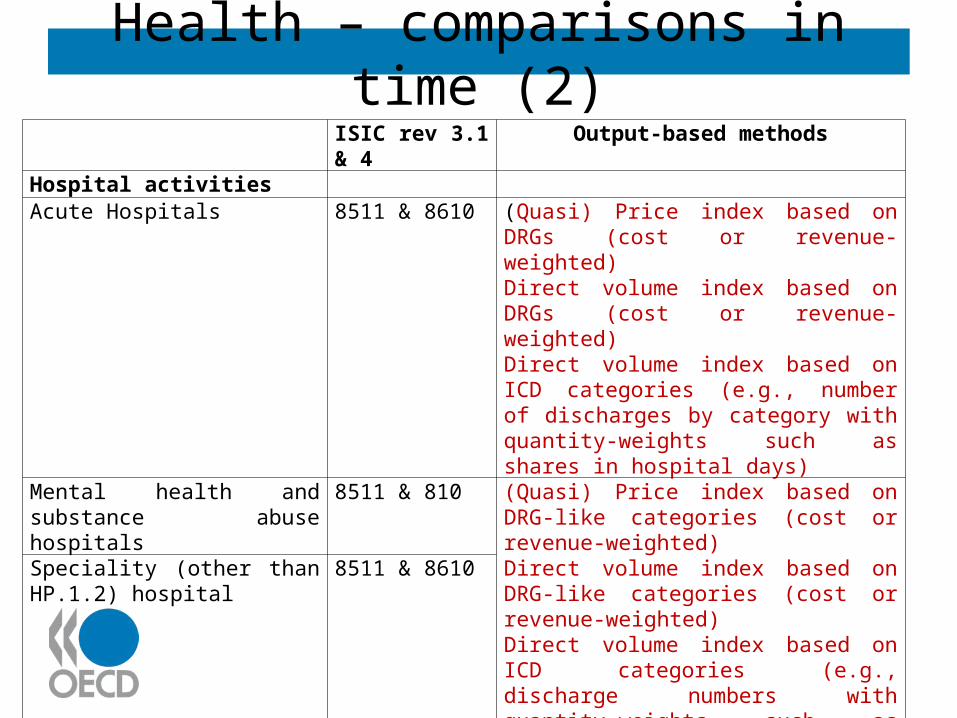
Health – comparisons in time (2)ISIC rev 3.1 & 4 Output-based methods
Hospital activitiesAcute Hospitals 8511 & 8610 (Quasi) Price index based on DRGs (cost or
revenue-weighted)Direct volume index based on DRGs (cost or revenue-weighted)Direct volume index based on ICD categories (e.g., number of discharges by category with quantity-weights such as shares in hospital days)
Mental health and substance abuse hospitals
8511 & 810 (Quasi) Price index based on DRG-like categories (cost or revenue-weighted)Direct volume index based on DRG-like categories (cost or revenue-weighted)Direct volume index based on ICD categories (e.g., discharge numbers with quantity-weights such as shares in day care days)Number of discharges*Number of days of care*
Speciality (other than HP.1.2) hospital
8511 & 8610
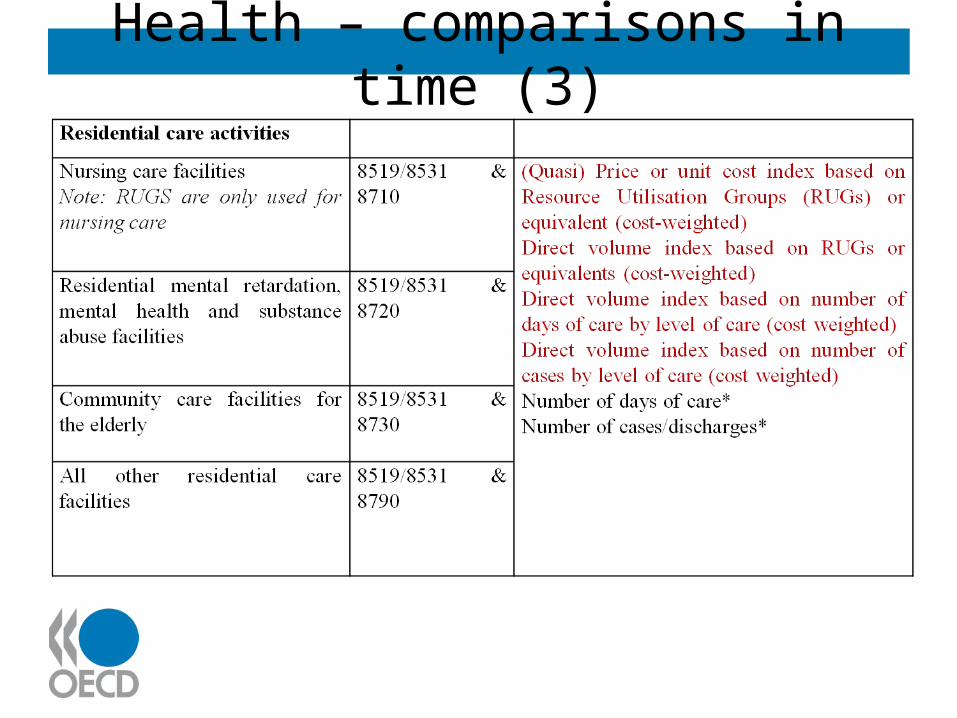
Health – comparisons in time (3)
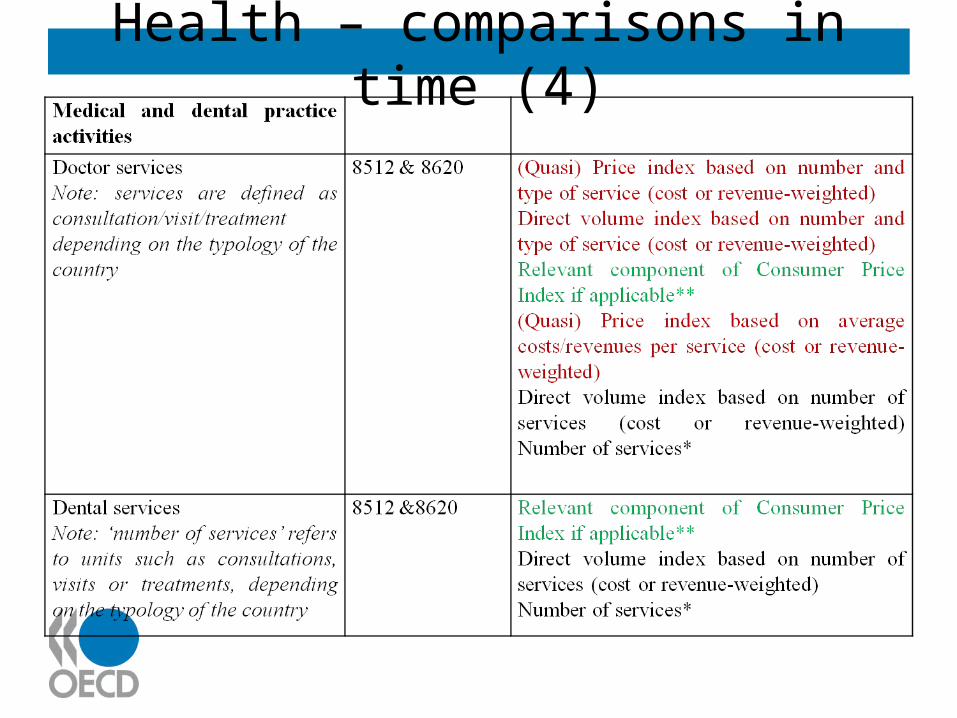
Health – comparisons in time (4)
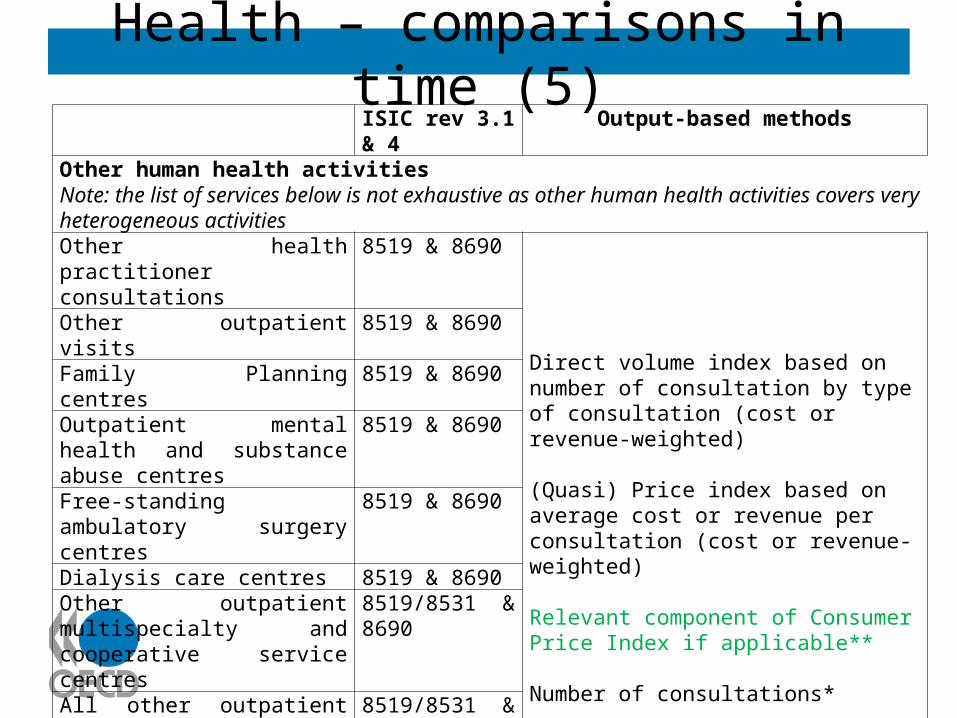
Health – comparisons in time (5)ISIC rev 3.1 & 4 Output-based methods
Other human health activitiesNote: the list of services below is not exhaustive as other human health activities covers very heterogeneous activities Other health practitioner consultations
8519 & 8690
Direct volume index based on number of consultation by type of consultation (cost or revenue-weighted)
(Quasi) Price index based on average cost or revenue per consultation (cost or revenue-weighted)
Relevant component of Consumer Price Index if applicable**
Number of consultations*
Number of tests performed*
Number of cases treated*
Other outpatient visits 8519 & 8690Family Planning centres 8519 & 8690Outpatient mental health and substance abuse centres
8519 & 8690
Free-standing ambulatory surgery centres
8519 & 8690
Dialysis care centres 8519 & 8690Other outpatient multispecialty and cooperative service centres
8519/8531 & 8690
All other outpatient care centres 8519/8531 & 8690
Medical and diagnostic laboratories
8519 & 8690
Home health care services 8519/8531 & 8690
All other ambulatory health care services
8519 & 8690
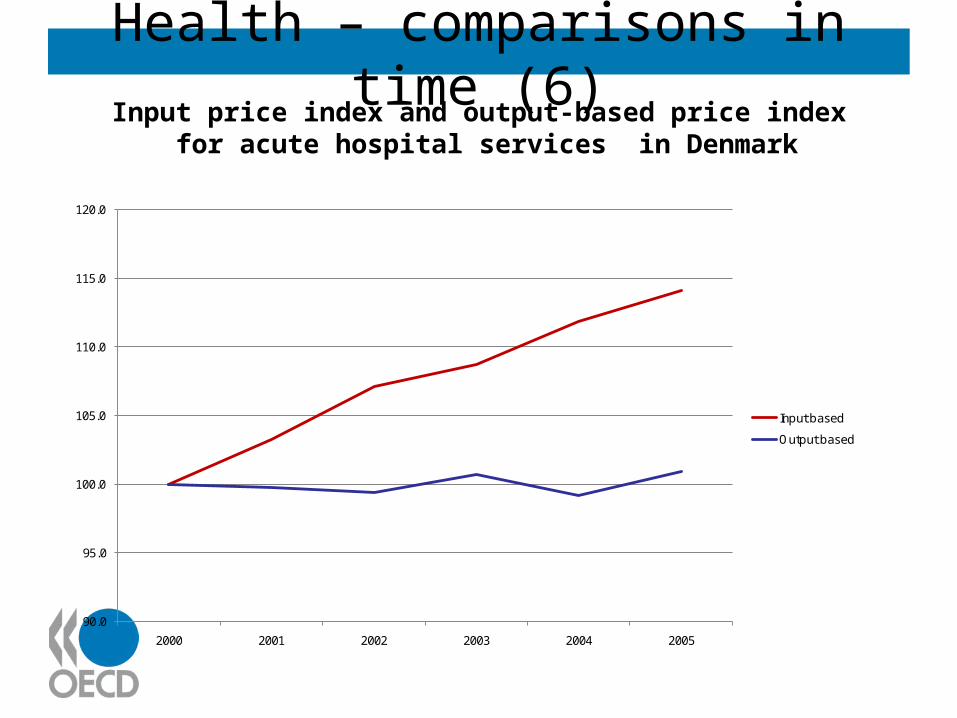
Health – comparisons in time (6)Input price index and output-based price index
for acute hospital services in Denmark
90.0
95.0
100.0
105.0
110.0
115.0
120.0
2000 2001 2002 2003 2004 2005
Input based
Output based
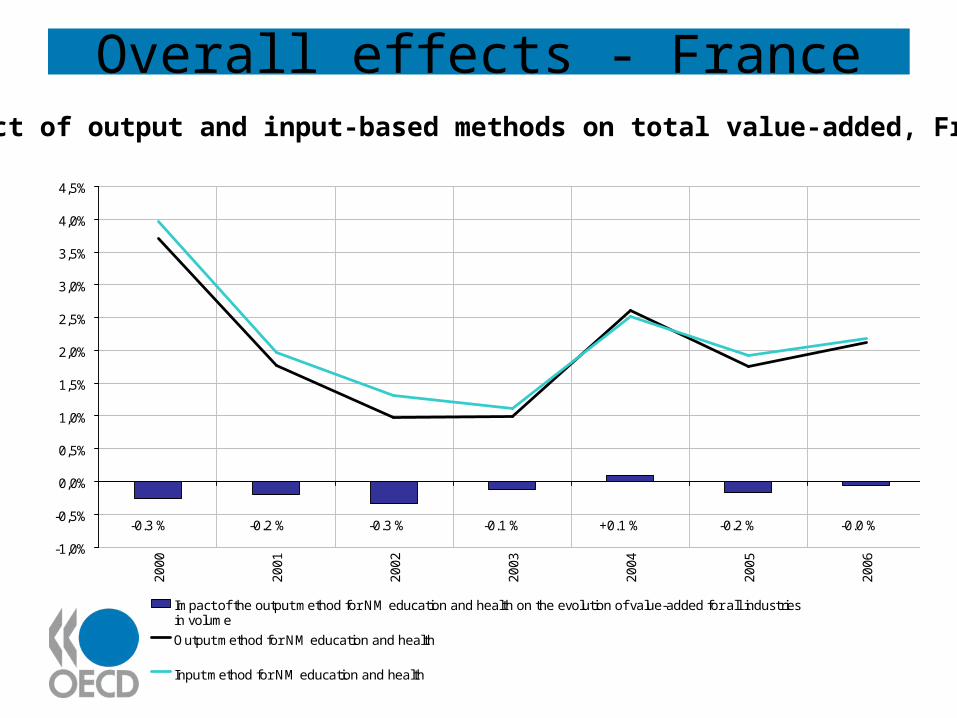
Overall effects - FranceImpact of output and input-based methods on total value-added, France
-1,0%
-0,5%
0,0%
0,5%
1,0%
1,5%
2,0%
2,5%
3,0%
3,5%
4,0%
4,5%
200
0
200
1
200
2
200
3
200
4
200
5
200
6
Impact of the output method for NM education and health on the evolution of value-added for all industriesin volume
Output method for NM education and health
Input method for NM education and health
-0.3 % -0.2 % -0.3 % -0.2 %+0.1 %-0.1 % -0.0 %
Way forward
•Health PPPs further developed in 2009•Completion of the chapter on health PPPs•Presentation of draft to health and education experts•Revision and final draft in 2009
Thank you!