Embed Size (px)
Citation preview
1
OECD-WWC-Netherlands Roundtable on Financing Water
Second meeting 13 September 2017, Tel Aviv
Background paper
Mapping financing flows: An inventory of data sources
1. Data Sources for Water Financing
1. Data on financing water security is often incomplete, disparate, or not even
recorded. What data sources do exist have specific attributes that make them suitable
for some uses, but not others. This note describes a number of data sources and how
they might be exploited for future analytical work. The sources of data described here
do not represent an exhaustive list and it is envisaged that this list will be expanded
over time, collating in one place all major, relevant sources of data.
2. The two main types of data collectors/providers are official bodies (for
instance, national statistical offices, the OECD, the World Bank, and other
development finance institutions, etc.) and commercial/industry body data providers.
Data can be further categorised according to the level of aggregation, namely whether
data relate to projects/transactions, firms, cities, countries, or some other grouping.
Table 1.1 lists a number of databases made available by official bodies, while Table
1.2 outlines major commercial databases, and Table 1.3 lists non-financing flow
databases that might be usefully combined with others. Descriptive information about
each database is provided from Table 1.4 through to Table 1.18.
2
Table 1.1. Official Data Sources
Source Level of Aggregation/Type of Information
World Bank Private Participation in Infrastructure Database Project/Transaction National Statistical Offices Project/Transaction/Aggregate OECD Creditor Reporting System Project/Transaction/Aggregate
Table 1.2. Commercial and Industry Body Data Sources
Source Level of Aggregation/Type of Information
IJGlobal Project and Infrastructure Financing Database Project/Transaction Global Infrastructure Hub Project Pipeline Project/Transaction Thomson Reuters (ONE) Project/Transaction Dealogic Project/Transaction Bloomberg New Energy Finance Project/Transaction FACTIVA Project/Transaction
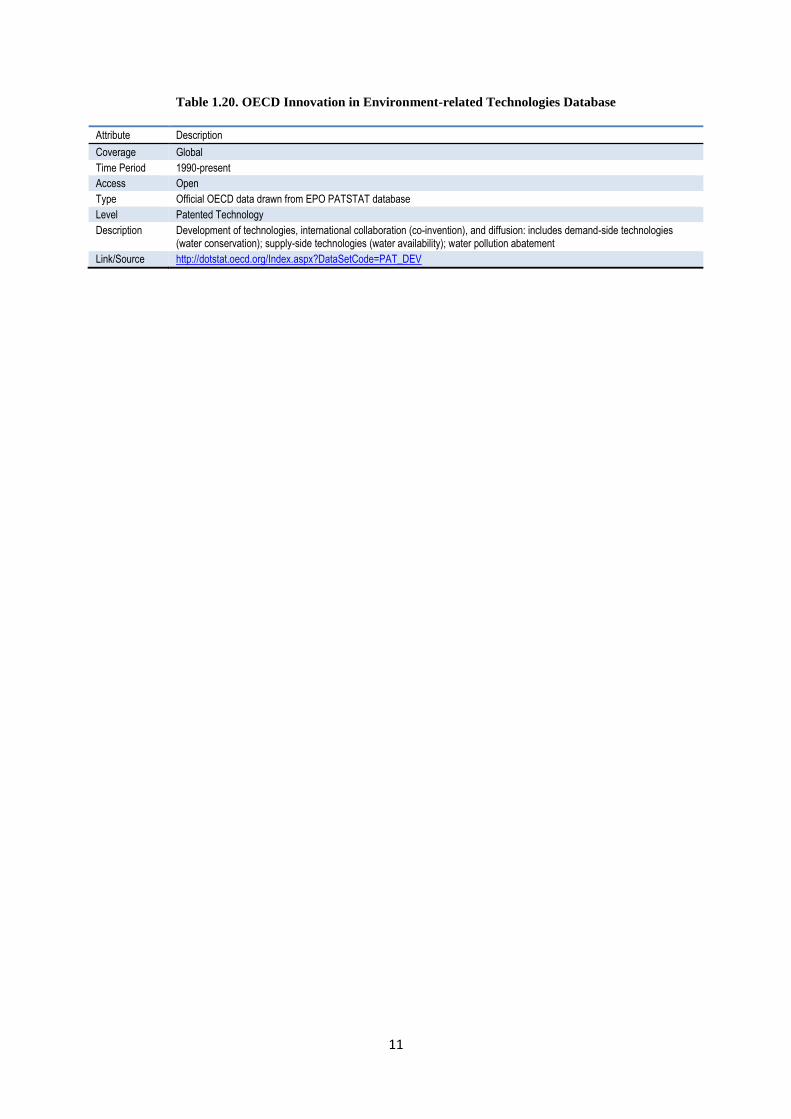
Global Water Intelligence Project/Transaction Bluefield Research Sector/Transaction/Firm
Firms in the Industry (e.g. Suez, Veolia) Firm Orbis Firm Osiris Firm Standard & Poor’s (SNL/Capital IQ) Firm International Water Association Water Statistics Aggregate/City
Table 1.3. Potentially Useful Non-Financing Flow Data Sources
OECD Policy Instruments for the Environment Database Policy OECD Innovation in Environment-related Technologies Database Patented Technology
1.1. Official Data Sources
1.1.1. Private Participation in Infrastructure Database
3. The World Bank’s Private Participation in Infrastructure (PPI) database
contains information about global infrastructure projects with a mix of public and
private funding in low and middle income countries. For the water and sewerage
sector, the database contains information about approximately 1 000 active, closed, or
cancelled projects across 63 countries since 1993. The database relies on publicly
available information and some projects (such as those involving local and small scale
operators) tend to be omitted, as they are typically not reported in the major sources of
information on which the dataset relies. Data include important project dates, project
type (brownfield, greenfield, divesture, et cetera), contract type (for example, lease,
build-operate-transfer, or build-own-operate), contract length, nature of government
support (guarantees, credits, direct financial support, and so forth), private sector
investors and quantum, sources of revenue, information about the bidding process, and
support from multi- or bi-lateral agencies. The PPI database is updated with last year’s
data six months after year-end.

3
Table 1.4. Private Participation in Infrastructure Database
Attribute Description
Coverage 139 Low and Middle Countries
Time Period 1990-present
Access Open
Type Official World Bank Data
Level Project/Transaction
Description Project-level data on 6 400 infrastructure projects (country, IDA status, financial closure date, investment year, type of PPI, % private, total investment, capacity, multi-lateral support, bilateral support, etc.)
Link/Source: https://ppi.worldbank.org/
1.1.2. National Statistical Offices
4. National Statistical Offices produce data on spending on local and central
government functions according to the Classification of the Functions of Government
(COFOG) system, including water supply (code 6.3) and wastewater management
(5.2). There is an additional class covering pollution abatement (5.3), which includes
groundwater protection,1 and a class for environmental protection not elsewhere
classified (5.6), which can include some aspects of water administration and
management. These data provide standardised, aggregate-level information in
accordance with the UN System of National Accounts (SNA), as further detailed in the
System of Environmental-Economic Accounting for Water (SEEA-Water). SEEA-
Water provides a framework for reporting water-specific national financial accounts
alongside hydrological information.
5. The Classification of Environmental Protection Activities (CEPA), another
international standard for measuring government spending, also provides a number of
categories relating to water. Classes of note are wastewater management (code CEPA
2) and protection and remediation of soil, groundwater, and surface water (CEPA 4).
An additional class that may be applicable in some cases is protection of biodiversity
and landscapes (CEPA 6).
6. The availability of data following the CEPA classification varies by country
and fiscal year, generally forming part of reporting on environmental protection
expenditure accounts (EPEA). EPEA have been developed to align with the SNA and
are required to be reported by Eurostat in accordance with EU regulations.
7. The Classification of Resource Management Activities (CReMA) is closely
linked to CEPA, focusing on expenditures and transactions whose primary purpose is
resource management, as opposed to environmental protection. CReMA comprises a
number of classes, including management of waters (CReMA 10), which relates to:
reductions in water use through process modifications; reductions in losses, leaks, and
reuse; replenishment of water stocks; measurements and laboratories pertaining to
water resources; and regulation, administration, and information activities relating to
water.
8. CReMA excludes expenditure already covered in CEPA, notably preservation
and/or restoration of water quality. Given the practical difficulties of separating water
management expenses by intended purpose per the definitions of the various classes,
especially when water agencies are tasked with multiple remits, Eurostat considers this
CReMA class a “low priority domain” (Eurostat, 2014[1]).
9. Some countries provide separate reporting on specific sectors or projects, often
where dedicated government agencies are responsible for aspects of water
1 As well as abatement of air, noise, radiation, and other pollution.
4
management, for instance, national infrastructure, development finance, or
environmental bodies.
10. The above classifications refer to government services provided collectively.
Private provision of water-related services are classified in national accounts
according to the International Standard Industrial Classification of All Economic
Activities (ISIC), notably ISIC 36 and 37 for water collection, treatment, and supply,
and sewerage, respectively.
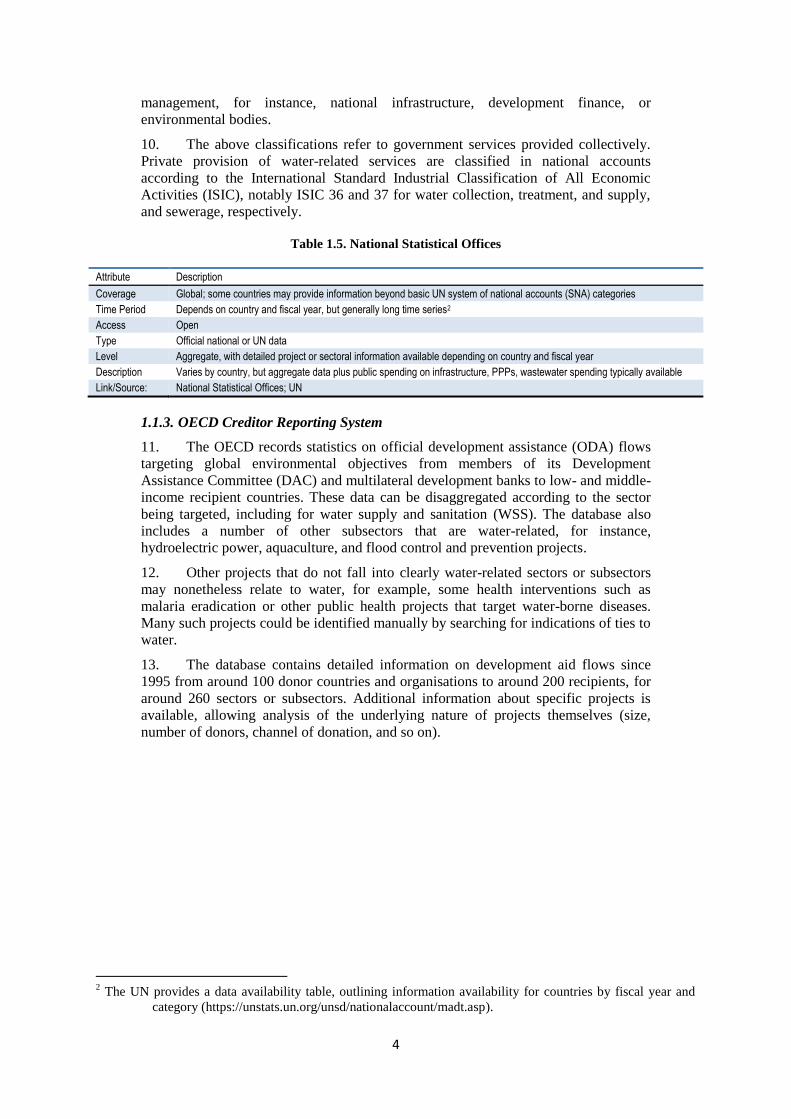
Table 1.5. National Statistical Offices
Attribute Description
Coverage Global; some countries may provide information beyond basic UN system of national accounts (SNA) categories
Time Period Depends on country and fiscal year, but generally long time series2
Access Open
Type Official national or UN data
Level Aggregate, with detailed project or sectoral information available depending on country and fiscal year
Description Varies by country, but aggregate data plus public spending on infrastructure, PPPs, wastewater spending typically available
Link/Source: National Statistical Offices; UN
1.1.3. OECD Creditor Reporting System
11. The OECD records statistics on official development assistance (ODA) flows
targeting global environmental objectives from members of its Development
Assistance Committee (DAC) and multilateral development banks to low- and middle-
income recipient countries. These data can be disaggregated according to the sector
being targeted, including for water supply and sanitation (WSS). The database also
includes a number of other subsectors that are water-related, for instance,
hydroelectric power, aquaculture, and flood control and prevention projects.
12. Other projects that do not fall into clearly water-related sectors or subsectors
may nonetheless relate to water, for example, some health interventions such as
malaria eradication or other public health projects that target water-borne diseases.
Many such projects could be identified manually by searching for indications of ties to
water.
13. The database contains detailed information on development aid flows since
1995 from around 100 donor countries and organisations to around 200 recipients, for
around 260 sectors or subsectors. Additional information about specific projects is
available, allowing analysis of the underlying nature of projects themselves (size,
number of donors, channel of donation, and so on).
2 The UN provides a data availability table, outlining information availability for countries by fiscal year and
category (https://unstats.un.org/unsd/nationalaccount/madt.asp).

5
Table 1.6. OECD Creditor Reporting System
Attribute Description
Coverage Global coverage of flows from OECD Development Co-operation Directorate member countries and Multilateral Development Banks to developing countries
Time Period 1995-present
Access Open
Type Official OECD data
Level Donor-recipient flows by project, sector, type of assistance
Description Bilateral and multilateral development finance flows. Includes data for water supply and sanitation (can be broken down by sub-sectors) and a number of other water-related categories.
Link/Source https://stats.oecd.org/Index.aspx?DataSetCode=CRS1#
1.2. Commercial and Industry Data Sources3
1.2.1. IJ Global
14. The Project Finance and Infrastructure Journal’s (IJGlobal) database contains
information relating to over 12 000 infrastructure transactions and 10 000 projects.
The database aims to cover transactions with private sector participation from around
the world in many sectors, including water (with desalination, distribution, and
treatment as subsectors). The data are collated at a project level, with information
relating to the type of project/transaction, its contractual structure, value, debt-equity
ratio, sponsors, debt providers, important dates, among other information.
15. Of the more than 10 000 projects, about 500 are in the water sector. The
relatively low number reflects the fact that much water infrastructure globally is
entirely publically funded. The average value of a project across the 55 countries in
the data set is USD 414 million.
Table 1.7. IJ Global
Attribute Description
Coverage Global
Time Period 2000-present
Access Subscription
Type Commercial
Level Project/Transaction
Description Project-level data on 10 000 infrastructure projects, including data on finance (type, amount) and financiers. Asset data includes water as a primary sector.
Link/Source https://ijglobal.com/data
1.2.2. Global Infrastructure Hub Project Pipeline
16. The Global Infrastructure Hub (GI Hub) was founded by the G20 in 2014 to
increase support for, and data about, infrastructure projects around the world. This
followed from recognition of a scarcity of comprehensive data relating to
infrastructure projects, which hinders empirical analysis seeking to improve policies to
improve infrastructure investment. However, GI Hub remains a work in progress, with
only a handful of projects in a limited number of countries identified as occurring in
the water sector.
3 There is likely to be significant overlap between projects included in the various commercial databases listed
below. If the projects from various databases were to be compiled, they would need to be reconciled
(manually) to eliminate potential duplication.

6
Table 1.8. Global Infrastructure Hub Project Pipeline
Attribute Description
Coverage Global
Time Period Active/’live’ projects
Access Open
Type Not-for-profit
Level Project/Transaction
Description Global database of infrastructure projects. Currently under development, with few water-related projects.
Link/Source https://pipeline.gihub.org
1.2.3. Thomson Reuters
17. Thomson Reuters is a major supplier of data about a range of financial
markets, including project finance, as well as equity and fixed income. In the Thomson
ONE project finance database, information available about water projects covers
project name, country, sponsor, status, and value. Since 2000, nearly 800 projects have
been identified in 95 countries, with a mean value of around USD 370 million.
Table 1.9. Thomson Reuters
Attribute Description
Coverage Global
Time Period 1970-present
Access Subscription
Type Commercial
Level Project/Transaction
Description Project finance data (country, sector, cost, financing status, etc.)
Link/Source https://financial.thomsonreuters.com/en/products/data-analytics/financial-news-feed/project-finance-international.html
1.2.4. Dealogic
18. Dealogic provides financial data on fixed income and equity capital markets,
mergers and acquisitions, and other information about financial institutions and their
portfolios. Dealogic also has project-level information for a range of sectors.
Information is gathered from companies involved in the transactions, including banks
and advisors.
Table 1.10. Dealogic
Attribute Description
Coverage Global
Time Period Depends on dataset; good project coverage from at least 1994-present, with earlier coverage for issues of financial instruments
Access Subscription
Type Commercial
Level Project/Transaction
Description Information about capital markets transactions (fixed income and equities), mergers and acquisitions
Link/Source http://www.dealogic.com/content/
1.2.5. Bloomberg New Energy Finance
19. The Bloomberg New Energy Finance (BNEF) database contains information
relating to global projects in renewable energy, energy smart technologies, clean
transport, and carbon markets. The project information focuses primarily on renewable
energy with installed capacity greater than 1MW. However, projects classed as “large
hydro” (projects of more than 50MW) are not included in the dataset, so any empirical
work relating to hydroelectric power would need to use additional data sources. Due to
7
confidentiality requirements, not all transactions have a monetary value associated
with them.
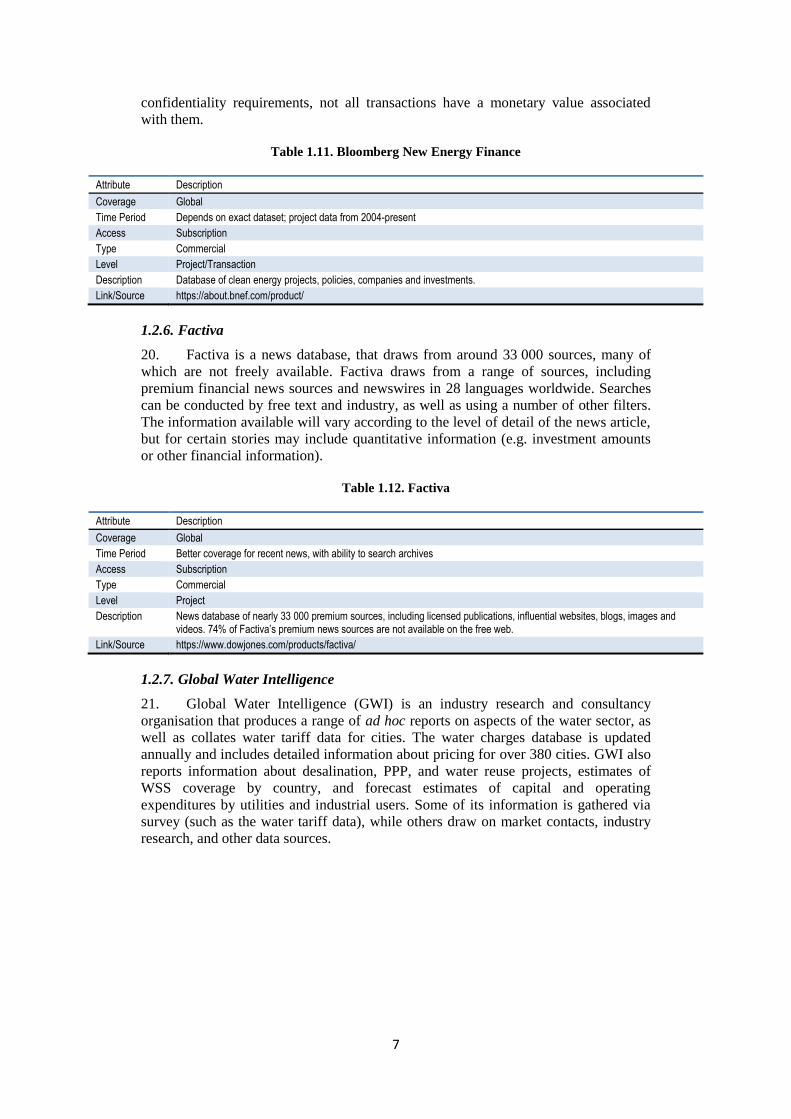
Table 1.11. Bloomberg New Energy Finance
Attribute Description
Coverage Global
Time Period Depends on exact dataset; project data from 2004-present
Access Subscription
Type Commercial
Level Project/Transaction
Description Database of clean energy projects, policies, companies and investments.
Link/Source https://about.bnef.com/product/
1.2.6. Factiva
20. Factiva is a news database, that draws from around 33 000 sources, many of
which are not freely available. Factiva draws from a range of sources, including
premium financial news sources and newswires in 28 languages worldwide. Searches
can be conducted by free text and industry, as well as using a number of other filters.
The information available will vary according to the level of detail of the news article,
but for certain stories may include quantitative information (e.g. investment amounts
or other financial information).
Table 1.12. Factiva
Attribute Description
Coverage Global
Time Period Better coverage for recent news, with ability to search archives
Access Subscription
Type Commercial
Level Project
Description News database of nearly 33 000 premium sources, including licensed publications, influential websites, blogs, images and videos. 74% of Factiva’s premium news sources are not available on the free web.
Link/Source https://www.dowjones.com/products/factiva/
1.2.7. Global Water Intelligence
21. Global Water Intelligence (GWI) is an industry research and consultancy
organisation that produces a range of ad hoc reports on aspects of the water sector, as
well as collates water tariff data for cities. The water charges database is updated
annually and includes detailed information about pricing for over 380 cities. GWI also
reports information about desalination, PPP, and water reuse projects, estimates of
WSS coverage by country, and forecast estimates of capital and operating
expenditures by utilities and industrial users. Some of its information is gathered via
survey (such as the water tariff data), while others draw on market contacts, industry
research, and other data sources.

8
Table 1.13. Global Water Intelligence
Attribute Description
Coverage Global
Time Period Depends on dataset
Access Subscription
Type Commercial
Level Project/Transaction
Description General water sector intelligence, pricing/tariff information, other ad hoc data
Link/Source https://www.globalwaterintel.com/
1.2.8. Bluefield Research
22. Bluefield Research is a commercial provider of water sector data and market
analysis. Their datasets include information about global merger and acquisition
transactions, the US hydraulic fracturing and power generation sectors, the global
mining industry, as well as US and Canadian municipal data on water supply and
sewerage tariffs, forecasts of required capital expenditure by European, US, and
Canadian municipalities, and a number of other bespoke datasets. Bluefield uses
various data sources and collection methods to collate the data it uses in its research.
Table 1.14. Bluefield Research
Attribute Description
Coverage Global
Time Period Depends on dataset
Access Subscription
Type Commercial
Level Project/Transaction
Description Industrial and municipal data, plus general market intelligence and ad hoc information
Link/Source http://www.bluefieldresearch.com/global-industrial-water/
1.2.9. Orbis
23. Orbis, a database owned by Bureau Van Dijk, a privately owned research and
data company, contains financial information about 220 million private companies
(and a small number of major public companies) around the world. The data include
company identity, industry, actual and projected financials, credit risk indicators,
ownership, peer comparisons, and other information, not normally available in the
public domain. It is possible to search by sector, so water-related companies can
generally be identified.
Table 1.15. Orbis
Attribute Description
Coverage Global
Time Period 10 years of historical data, with additional archival subscription service (up to 20 years)
Access Subscription
Type Commercial
Level Firm
Description Commercial database of private company information
Link/Source https://www.bvdinfo.com/en-gb/our-products/company-information/international-products/orbis
1.2.10. Osiris
24. Osiris is the public company counterpart to Bureau van Dijk’s Orbis dataset.
Osiris contains detailed financial information on around 70 000 publicly listed
companies (and some major private ones). Data include financial accounts, corporate
9
structures, stock prices, brokers’ estimates and reports, credit ratings, news, and other
company filings. Osiris presents standardised financial information, to allow
comparisons between companies with different accounting standards.
Table 1.16. Osiris
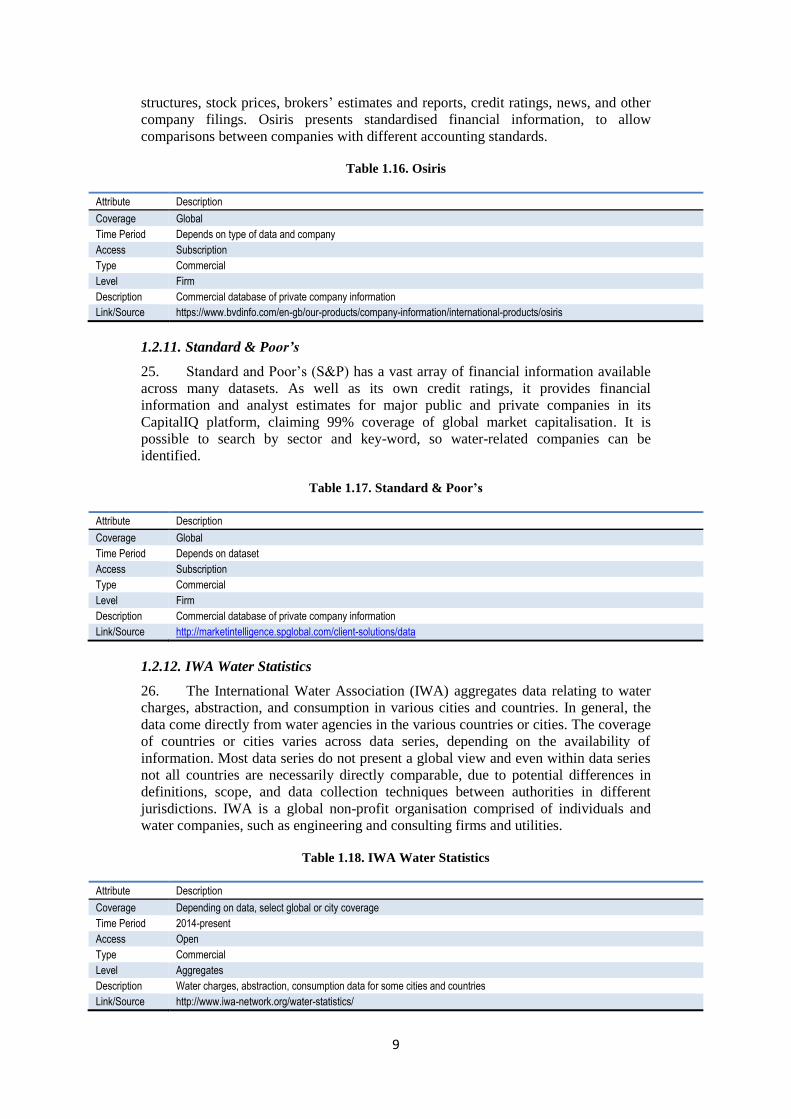
Attribute Description
Coverage Global
Time Period Depends on type of data and company
Access Subscription
Type Commercial
Level Firm
Description Commercial database of private company information
Link/Source https://www.bvdinfo.com/en-gb/our-products/company-information/international-products/osiris
1.2.11. Standard & Poor’s
25. Standard and Poor’s (S&P) has a vast array of financial information available
across many datasets. As well as its own credit ratings, it provides financial
information and analyst estimates for major public and private companies in its
CapitalIQ platform, claiming 99% coverage of global market capitalisation. It is
possible to search by sector and key-word, so water-related companies can be
identified.
Table 1.17. Standard & Poor’s
Attribute Description
Coverage Global
Time Period Depends on dataset
Access Subscription
Type Commercial
Level Firm
Description Commercial database of private company information
Link/Source http://marketintelligence.spglobal.com/client-solutions/data
1.2.12. IWA Water Statistics
26. The International Water Association (IWA) aggregates data relating to water
charges, abstraction, and consumption in various cities and countries. In general, the
data come directly from water agencies in the various countries or cities. The coverage
of countries or cities varies across data series, depending on the availability of
information. Most data series do not present a global view and even within data series
not all countries are necessarily directly comparable, due to potential differences in
definitions, scope, and data collection techniques between authorities in different
jurisdictions. IWA is a global non-profit organisation comprised of individuals and
water companies, such as engineering and consulting firms and utilities.
Table 1.18. IWA Water Statistics
Attribute Description
Coverage Depending on data, select global or city coverage
Time Period 2014-present
Access Open
Type Commercial
Level Aggregates
Description Water charges, abstraction, consumption data for some cities and countries
Link/Source http://www.iwa-network.org/water-statistics/
10
1.2.13. Firms
27. Another potential source of data is directly from firms involved in the water
sector. This could entail either construction firms, engineers, operators of water
infrastructure, financiers, consultants, or other professional firms sharing available
data. The exact nature of data availability would depend on the firms providing it.
1.3. Non-Financing Flows Databases
1.3.1. OECD Database on Policy Instruments for the Environment
28. The OECD’s Policy Instruments for the Environment (PINE) database collates
information on environmentally related taxes, fees and charges, tradable permits,
deposit-refund systems, environmentally motivated subsidies and voluntary
approaches used for environmental policy and natural resource management. Although
the primary focus is OECD member and accession candidate countries, there is some
information available for certain other nations, bringing the total number of countries
covered to about 60. Information on policy instruments may be either at national or
sub-national level. The scale of relevant instruments and extent of coverage varies
considerably among countries.
29. The PINE database contains quantitative and qualitative information about
policy instruments at a country level. These can be grouped by environmental domain,
including water pollution, waste management, and biodiversity.
Table 1.19. OECD Database on Policy Instruments for the Environment
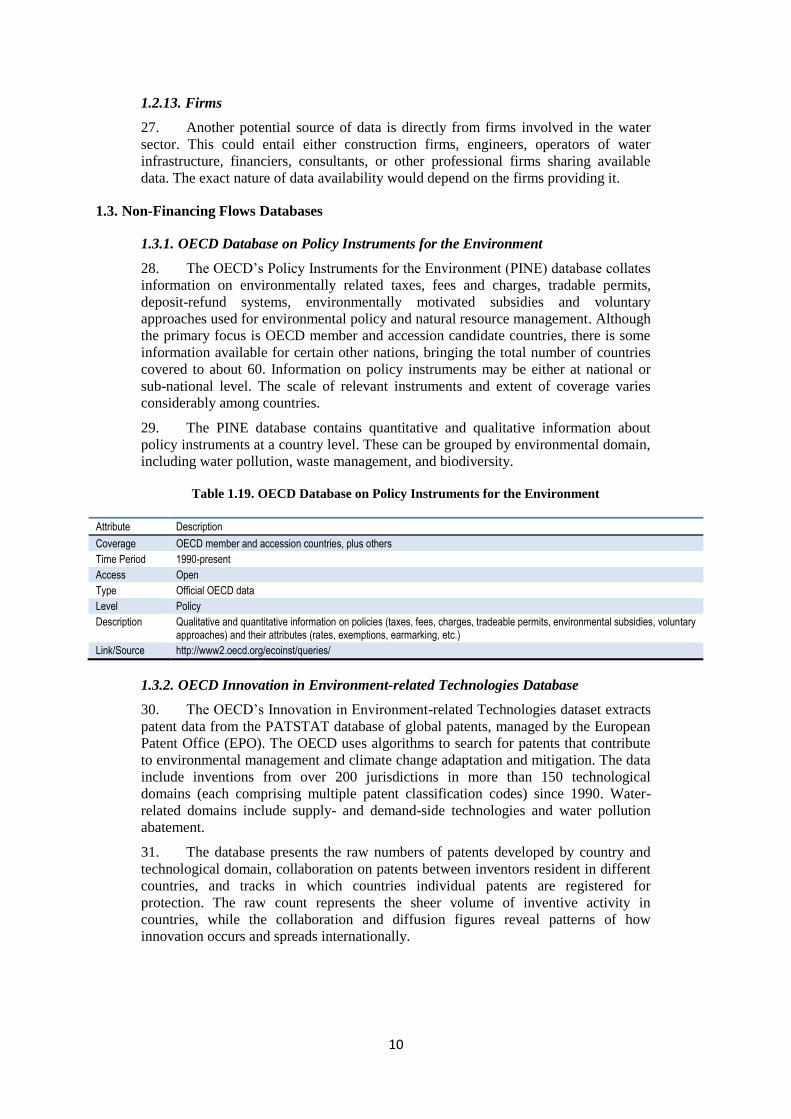
Attribute Description
Coverage OECD member and accession countries, plus others
Time Period 1990-present
Access Open
Type Official OECD data
Level Policy
Description Qualitative and quantitative information on policies (taxes, fees, charges, tradeable permits, environmental subsidies, voluntary approaches) and their attributes (rates, exemptions, earmarking, etc.)
Link/Source http://www2.oecd.org/ecoinst/queries/
1.3.2. OECD Innovation in Environment-related Technologies Database
30. The OECD’s Innovation in Environment-related Technologies dataset extracts
patent data from the PATSTAT database of global patents, managed by the European
Patent Office (EPO). The OECD uses algorithms to search for patents that contribute
to environmental management and climate change adaptation and mitigation. The data
include inventions from over 200 jurisdictions in more than 150 technological
domains (each comprising multiple patent classification codes) since 1990. Water-
related domains include supply- and demand-side technologies and water pollution
abatement.
31. The database presents the raw numbers of patents developed by country and
technological domain, collaboration on patents between inventors resident in different
countries, and tracks in which countries individual patents are registered for
protection. The raw count represents the sheer volume of inventive activity in
countries, while the collaboration and diffusion figures reveal patterns of how
innovation occurs and spreads internationally.
11
Table 1.20. OECD Innovation in Environment-related Technologies Database
Attribute Description
Coverage Global
Time Period 1990-present
Access Open
Type Official OECD data drawn from EPO PATSTAT database
Level Patented Technology
Description Development of technologies, international collaboration (co-invention), and diffusion: includes demand-side technologies (water conservation); supply-side technologies (water availability); water pollution abatement
Link/Source http://dotstat.oecd.org/Index.aspx?DataSetCode=PAT_DEV

12
2. Possible Uses of Data Sources
32. The data sources listed in this note could be used for undertaking in-depth
analytical work to better understand the dynamics of financing flows in the water
sector. Such a mapping would draw on several of these data sources, benefiting from
their varying coverage, while remaining aware of areas of potential overlap. This
section describes some of the benefits and limitations of using the various sources of
data.
33. Of the sources listed in this note, the project-level datasets tend to be the most
complete and benefit from a close overlap between different providers. In particular,
IJ Global appears to have good coverage of its target universe, as well as a broad range
of information relating to projects. The Thomson Reuters dataset overlaps somewhat,
but not entirely, with IJ Global, but contains far less descriptive information. The
World Bank’s PPI dataset also contains many data fields about projects, but its
geographic scope is limited to low- and middle-income countries and is not a fully
comprehensive.
34. Because no database will contain all water-related projects, it is unclear how
comprehensive each source is. One way to assess this is to analyse the degree of
overlap between different sources, with a larger overlap suggesting more
comprehensive data sources. Such a reconciliation of different sources would be a
manual task, requiring individual projects be matched based on available information,
as in general there is no unique identifier consistent across datasets.
35. Project finance datasets could also be complemented by looking at public
information about projects, especially as they tend to omit fully public projects. By
combining these sources of data, a more comprehensive picture of water-related
projects can be built, albeit with varying levels of detail in the financial information.
At a minimum, the data available permits analyses of the aggregate value of
investments, and the information from IJ Global and PPI would allow deeper
exploration of the characteristics of public and private projects, including capital
structure and the role of public and private finance. The best course of action in terms
of combining multiple databases will depend on the underlying research questions and
entail a trade-off between coverage and the reconciliation required between data sets.
36. Individual firms are likely to be able to provide a range of detailed information
about financing water-related investments, be they financiers, utilities, engineers, or
others companies, although commercial sensitivity may limit the extent of disclosure
possible. Further, obtaining global coverage would require receiving information from
many firms, which might pose difficulty. On the other hand, where specific firms have
large market shares, by region or by sector, it would only take a handful of firms for a
sufficient level of coverage to inform insightful analytical work. In some cases, data
could be anonymised or provided as aggregates, to avoid potential commerciality or
privacy concerns.
37. Firm-level financial data is also available in a range of databases, notably from
S&P and Bureau van Dijk. These would be suited for company-level analysis, given
their generally high level of data quality and extensive coverage. For example,
analysis could focus on what types of firms are active in various water sectors, by size,
region, capital structure etc. It would also be possible to assess the financial
performance of firms, to understand their profitability and gauge/benchmark the health
of companies involved in the water sector. Despite generally strong coverage, these
datasets are not guaranteed to cover all firms, especially closely held, privately owned
ones. Another possible drawback is that typically these databases report information at

13
the level of financial statements, which may not provide the desired level of
granularity. For instance, a company with a large portfolio of water assets (be they an
investor, a utility, or a technical advisor) might not report financial data at a project or
even sector level. For research focusing on individual projects, data directly from
firms or from a project-level database are more suited, although could be usefully
complemented with firm-level information.
38. The Factiva news database offers good potential for finding information
missing from project databases. For instance, the Thomson Reuters project finance
database does not provide a large range of information about individual projects
present in other databases (e.g. IJ Global), but by analysing news sources in Factiva, it
might be possible to find missing information for some projects. This approach is
superior to using standard search engines, given three quarters of Factiva’s sources are
not available on the free web and include a range of finance-oriented news outlets.
Nonetheless, this is a potentially time-consuming manual task, as individual projects
would need to be searched and there is no guarantee that the desired information is
available.
39. The usefulness of national accounts and official data for analysing water-
related finance varies by country and fiscal year. In developed countries and in recent
years, relevant information is more likely to be available, although all countries should
report government spending according to the COFOG classifications, including on
water supply and sanitation. Nonetheless, this may not occur with the desired level of
granularity (i.e. at project-level) or cover the full range of investments in water (e.g. in
flood protection, which can belong to multiple classes4). Information at the lowest
level of granularity would need to be sought directly from national statistical offices.
Some countries also report on individual projects, be they funded by government or
FDI, especially where a government agency is tasked with managing these (such as
infrastructure or development banks). This could complement data in commercial
project-level databases, as these tend to omit entirely publically financed projects.
40. Commercial water sector research agencies have some useful data, although
the bespoke nature of consulting work can result in narrowly focused datasets. For
instance, Global Water Intelligence has a database and associated reports about
desalination technologies in particular, while Bluefield has good information on US &
Canadian municipalities, but less so for other countries. Nonetheless, some of the data
the companies sell may be useful for analysing certain aspects of the water sector and
their approach to information gathering, including their contacts within the industry,
may also prove instructive.
41. There are a number of databases of water tariffs, although they vary in their
time periods, geographic coverage, and level of aggregation. IWA collects information
about average tariffs in a number of cities, while GWI publishes an annual collection
of detailed tariffs for 380+ cities, including their structure (e.g. information about
block tariffs, fixed and volumetric charges, et cetera). The OECD has also published
data on water tariffs, although at a national level and it does not update the data
annually. This information is interesting for cross-country and cross-city comparisons,
although a more complete analysis requires data on transfers and taxes, the other two
sources of revenue for governments to pay for water services.
42. The PINE database provides a list of environmental policies in countries
around the world and could be used as a starting point to analyse the effect of
regulation on outcomes of interest. However, the database is not updated on a frequent
4 Depending on its primary purpose and the context, flood protection could be included in COFOG 4.2.1,
Agriculture, alongside a number of non-water related activities or 5.3.0, Pollution Abatement, which
includes abatement of other types of pollution, or, indeed, certain other classes.

14
basis, has some coverage gaps, and in general is not exhaustive. Combining the
information already available in the database about water policies with a new round of
specifically tailored data collection would result in a potentially powerful set of
information about water-related environmental policies. For example, combining the
output of such a data collection effort with project and other relevant databases, it
might be possible to examine the effect of environmental policies in stimulating
investment in infrastructure. Such an analysis could also arise from a broader research
agenda exploring the impact on financing flows of the investment environment in
general, placing specific policies in context alongside measures such as the World
Bank’s ease of doing business index, investment protection, and other indicators.5
43. Using PATSTAT alongside company financial databases (e.g. S&P or Orbis),
it would be possible to match up firms with their innovations. This would allow a
deeper understanding of the types of firms (by size, industry, source of finance, and so
on) that are actively innovating in the water sector.
44. There are also some aspects of financing water security that are not easily
captured by available data sources. For instance, consumer and company spending on
water-efficient appliances, such as faucets, shower heads or washing machines,
represents investment in water security, but such data is not readily captured or
possibly not even able to be captured. It may be possible to reach quantified estimates
of such spending for certain categories of products, but the robustness of any figures
would of course depend on the quality of the underlying assumptions and data used in
the process.6 In general, this type of expenditure constitutes water management
according to CReMA class 10, which may be estimated for some countries, but not all.
45. Other types of spending that might not be readily captured include some
government expenditure on infrastructure with water security-related characteristics.
For example, ecosystem rehabilitation or building public spaces that double as
emergency reservoirs/retention ponds to mitigate the impact of flooding and sewage
overflow after storms qualify as investments in water security. However, even if
information is available about the total level of investment in such infrastructure,
isolating the portion of the investment directly attributable to water security
enhancement will require the development of an analytical approach, drawing on
government spending data and making a number of assumptions and approximations.7
5 See Ang, Röttgers and Burli, (2017[1]) for analysis of the effects of policy settings and the broader investment
environment on investment in renewable power generation in OECD and G20 countries since 2000.
6 The International Energy Agency releases an annual energy efficiency report which, among other things,
attempts to estimate the level of investment in energy efficiency (International Energy
Agency, 2016[3]). Such an approach could potentially be applied to water efficiency.
7 For example, if a newly built public park contains low-lying areas to collect flood waters, the data
requirements to decompose total spending into general infrastructure (the park) and water-security
infrastructure (the low-lying areas) may prove prohibitive.

15
References
Ang, G., D. Röttgers and P. Burli (2017), “The empirics of enabling investment and
innovation in renewable energy”, OECD Environment Working
Papers, http://dx.doi.org/10.1787/67d221b8-en.
[2]
Eurostat (2014), ReMEA: draft
guidelines, http://ec.europa.eu/eurostat/documents/1798247/6191545/1-Resource-
management-expenditure-accounts---draft-guidelines-2014.pdf/.
[1]
International Energy Agency (2016), Energy Efficiency Market Report,
http://www.iea.org/eemr16/files/medium-term-energy-efficiency-2016_WEB.PDF.
[3]


![WWC Branding by Asenshal [Approved]](https://img.pdfslide.us/doc/110x75/587c8b771a28ab93568b738f/wwc-branding-by-asenshal-approved.jpg)