Embed Size (px)
Citation preview
OECD POLICY WORK ON GREEN INVESTMENTS
Nelly PetkovaOECD, Environment Directorate
Second international forum for sustainable business development 17 October 2013, Kiev, Ukraine
0
0.5
1
1.5
2
2.5
3
3.5
4
2
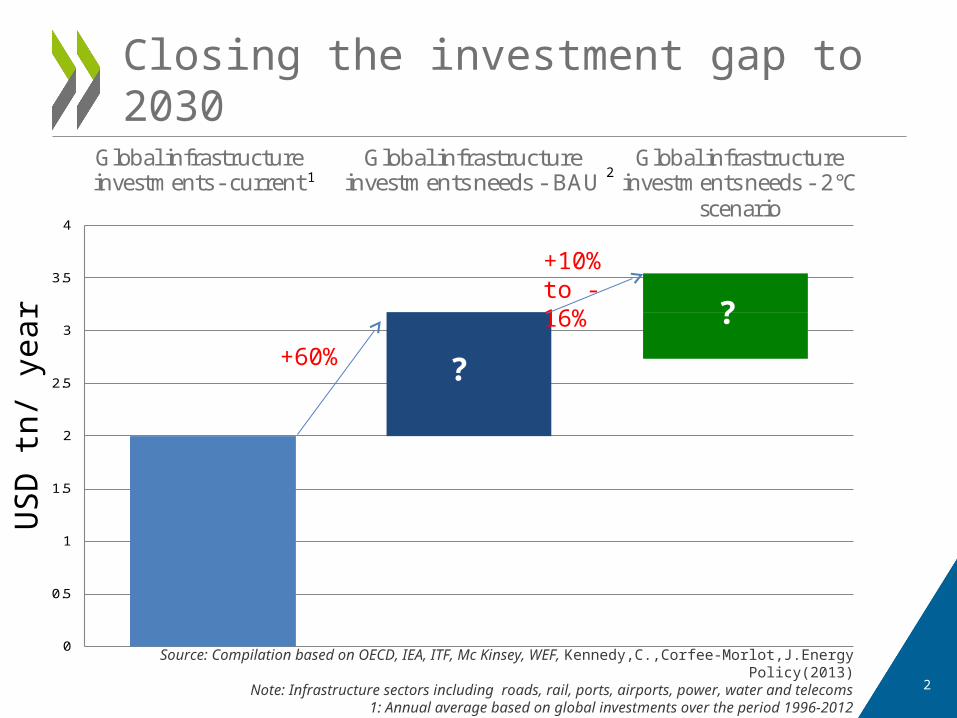
Closing the investment gap to 2030
Source: Compilation based on OECD, IEA, ITF, Mc Kinsey, WEF, Kennedy,C.,Corfee-Morlot,J.Energy Policy(2013)Note: Infrastructure sectors including roads, rail, ports, airports, power, water and telecoms
1: Annual average based on global investments over the period 1996-20122. Annual average needs for the period 2012-2030
US
D t
n/ y
ear
+60%
0
0.5
1
1.5
2
2.5
3
3.5
4
Global infrastructure investments - current
Global infrastructure investments needs - BAU
Global infrastructure investments needs - 2°C
scenario
0
0.5
1
1.5
2
2.5
3
3.5
4
Global infrastructure investments - current
Global infrastructure investments needs - BAU
Global infrastructure investments needs - 2°C
scenario
0
0.5
1
1.5
2
2.5
3
3.5
4
Global infrastructure investments - current
Global infrastructure investments needs - BAU
Global infrastructure investments needs - 2°C
scenario
1 2
?
+10% to -16%
?
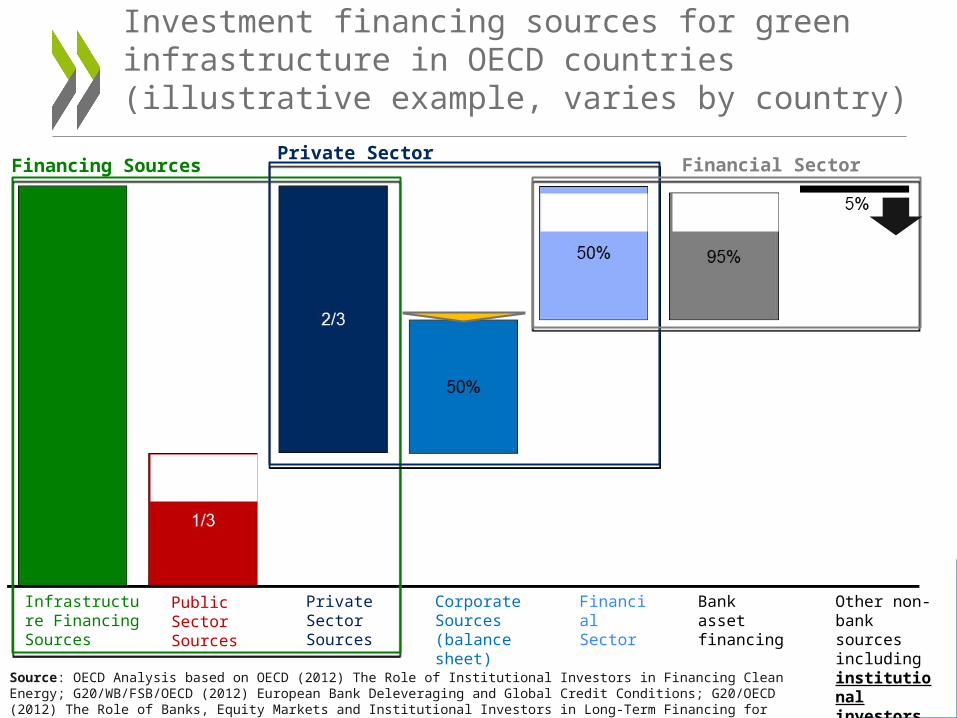
Investment financing sources for green infrastructure in OECD countries (illustrative example, varies by country)
Source: OECD Analysis based on OECD (2012) The Role of Institutional Investors in Financing Clean Energy; G20/WB/FSB/OECD (2012) European Bank Deleveraging and Global Credit Conditions; G20/OECD (2012) The Role of Banks, Equity Markets and Institutional Investors in Long-Term Financing for Growth and Development
Infrastructure Financing Sources
Private Sector Sources
Corporate Sources (balance sheet)
Financial Sector
Bank asset financing
Other non-bank sources including institutional investors
Public Sector Sources
Financing SourcesPrivate Sector
Financial Sector
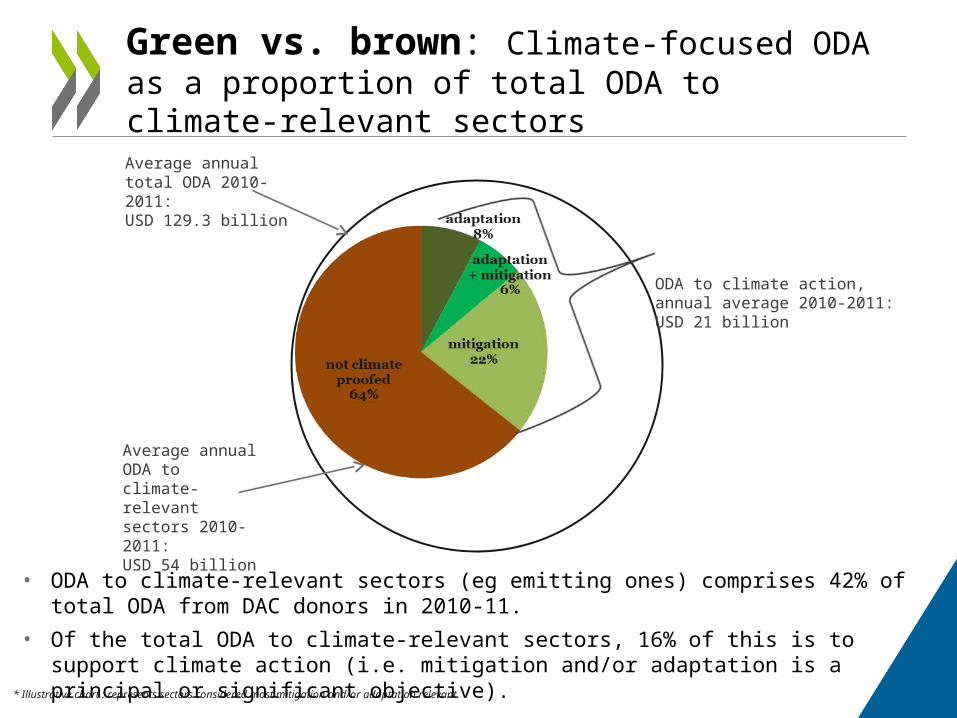
Average annual ODA to climate-relevant sectors 2010-2011: USD 54 billion
Average annual total ODA 2010-2011: USD 129.3 billion
• ODA to climate-relevant sectors (eg emitting ones) comprises 42% of total ODA from DAC donors in 2010-11.
• Of the total ODA to climate-relevant sectors, 16% of this is to support climate action (i.e. mitigation and/or adaptation is a principal or significant objective).
ODA to climate action, annual average 2010-2011: USD 21 billion
Green vs. brown: Climate-focused ODA as a proportion of total ODA to climate-relevant sectors
* Illustrative chart : represents sectors considered most mitigation and/or adaptation relevant.
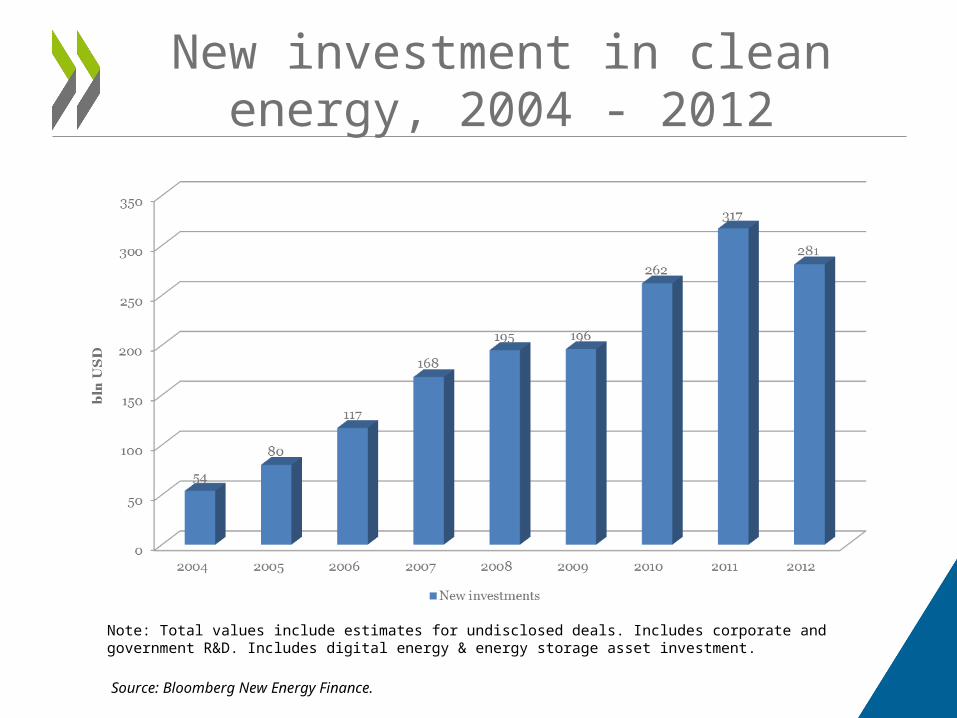
New investment in clean energy, 2004 - 2012
Source: Bloomberg New Energy Finance.
Note: Total values include estimates for undisclosed deals. Includes corporate and government R&D. Includes digital energy & energy storage asset investment.
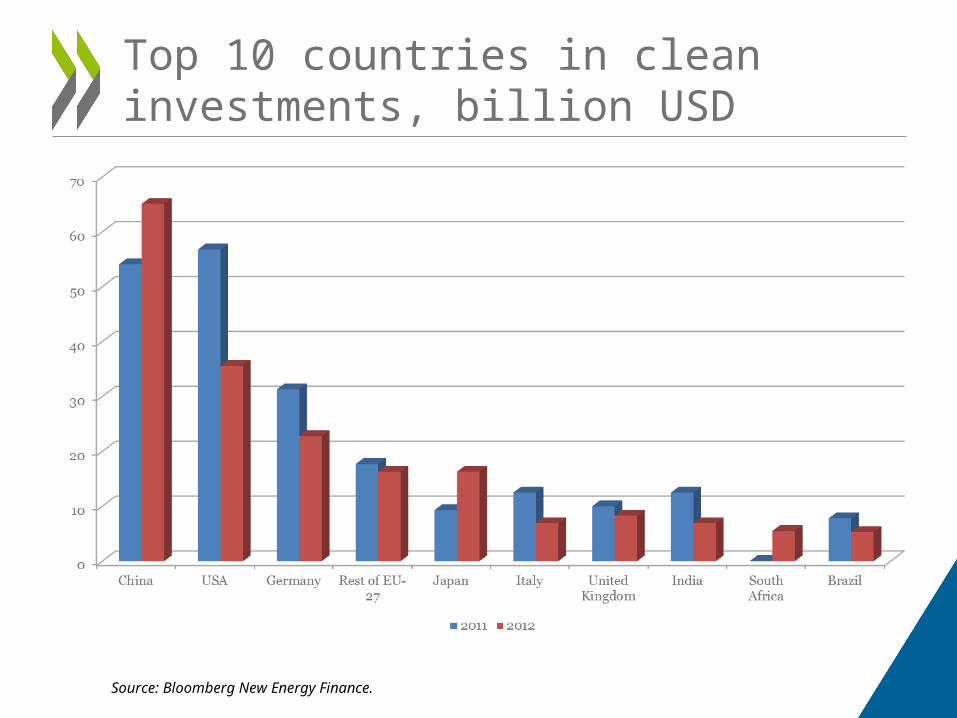
Top 10 countries in clean investments, billion USD
Source: Bloomberg New Energy Finance.
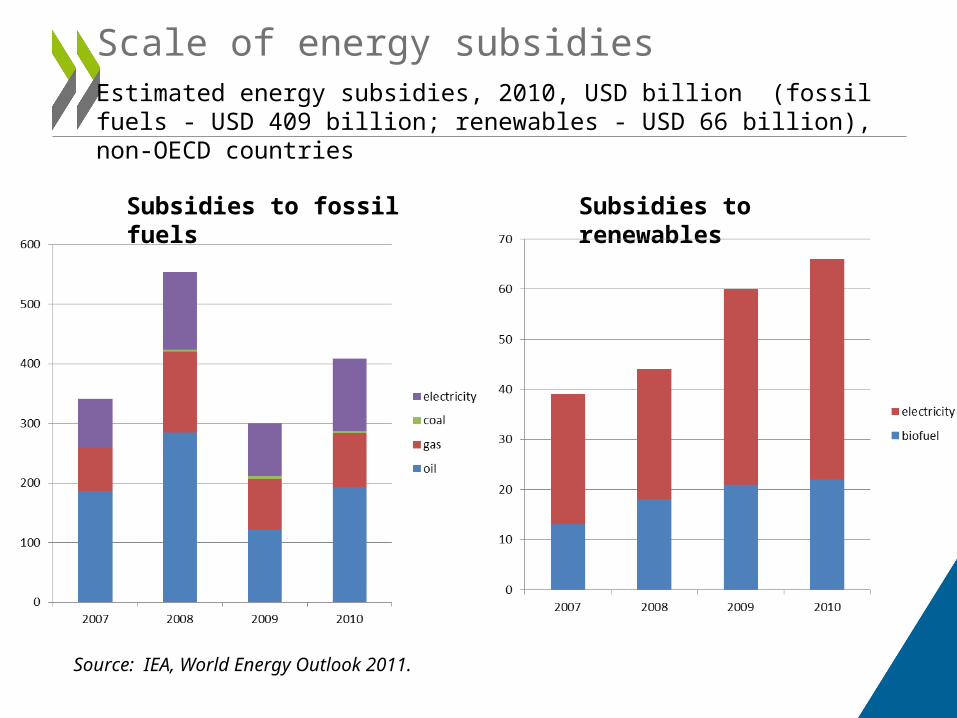
Scale of energy subsidiesEstimated energy subsidies, 2010, USD billion (fossil fuels - USD 409 billion; renewables - USD 66 billion), non-OECD countries
Source: IEA, World Energy Outlook 2011.
Subsidies to fossil fuels Subsidies to renewables
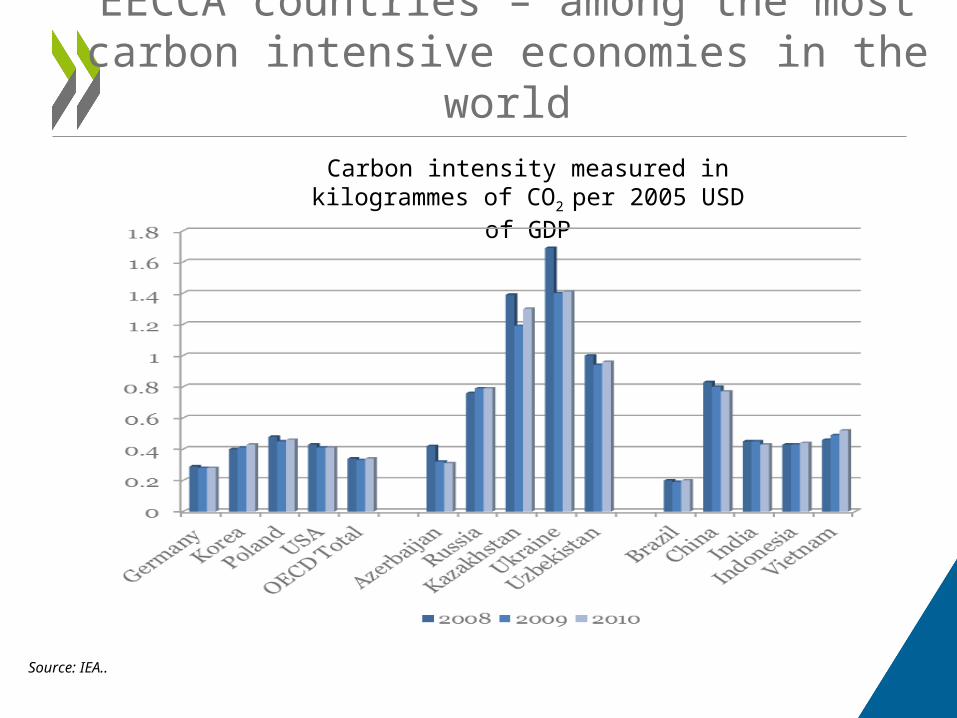
Carbon intensity measured in kilogrammes of CO2 per 2005 USD of GDP
EECCA countries – among the most carbon intensive economies in the world
Source: IEA..
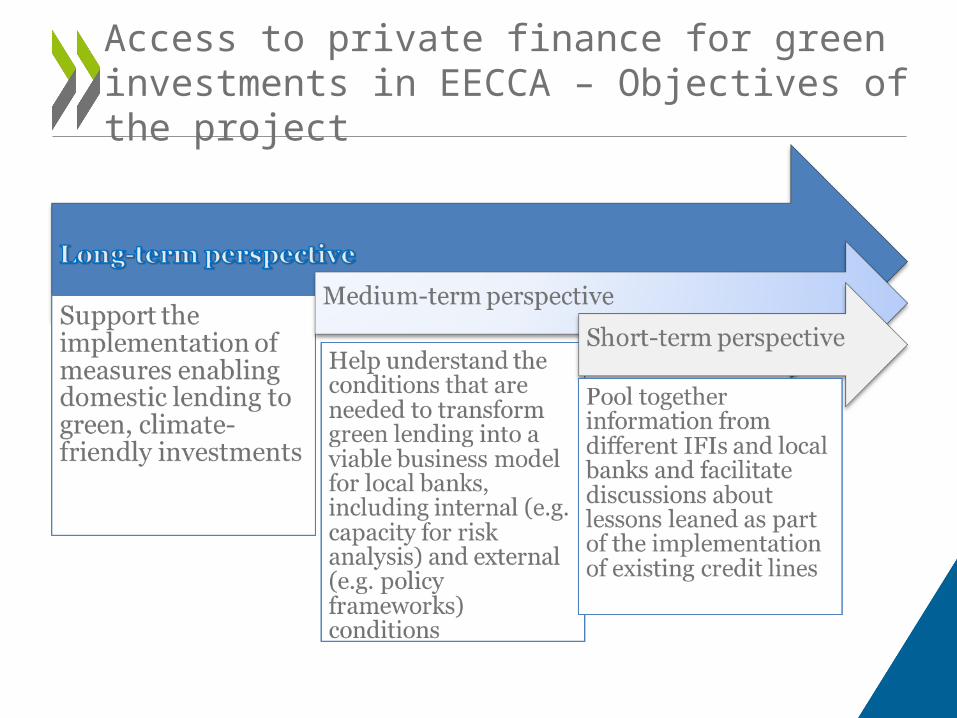
Access to private finance for green investments in EECCA – Objectives of the project
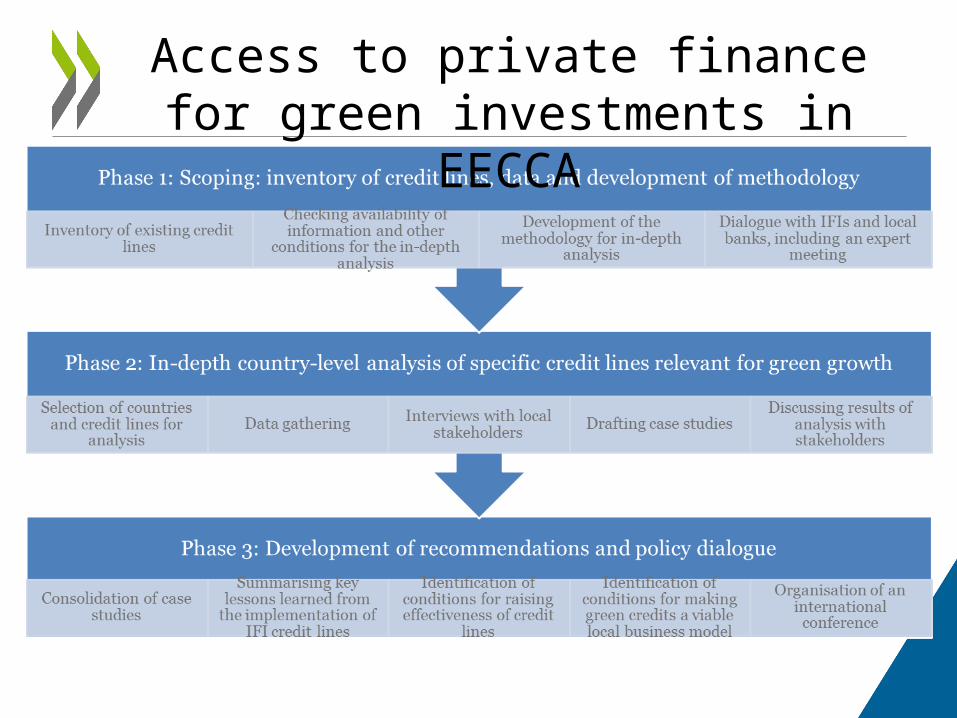
Access to private finance for green investments in EECCA
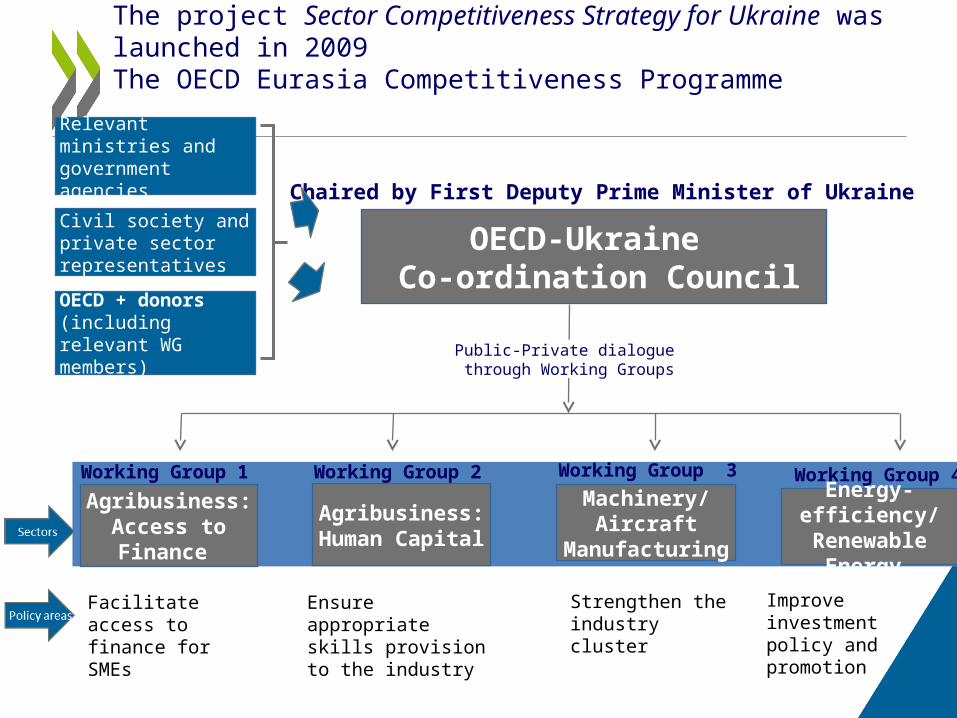
OECD-Ukraine Co-ordination Council
Agribusiness:Access to Finance
Machinery/Aircraft Manufacturing
Working Group 1 Working Group 3
Civil society and private sector representatives
Relevant ministries and government agencies
Chaired by First Deputy Prime Minister of Ukraine
OECD + donors(including relevant WG members)
The project Sector Competitiveness Strategy for Ukraine was launched in 2009The OECD Eurasia Competitiveness Programme
Energy-efficiency/ Renewable Energy
Working Group 4
Agribusiness:Human Capital
Working Group 2
Facilitate access to finance for SMEs
Improve investment policy and promotion
Strengthen the industry cluster
Ensure appropriate skills provision to the industry
Public-Private dialogue through Working Groups