Embed Size (px)
Citation preview
Please cite this paper as:
Dewbre, J. and A. Borot de Battisti (2008), “AgriculturalProgress in Cameroon, Ghana and Mali: Why It Happenedand How to Sustain It”, OECD Food, Agriculture andFisheries Working Papers, No. 9, OECD Publishing.doi: 10.1787/241275631215
OECD Food, Agriculture and FisheriesWorking Papers No. 9
Agricultural Progress inCameroon, Ghana and Mali
WHY IT HAPPENED AND HOW TO SUSTAIN IT
Joe Dewbre*, Adeline Borot de Battisti
*OECD, France
Agricultural Progress in
Cameroon, Ghana and Mali:
Why it Happened
and How to Sustain It
Joe Dewbre
and
Adeline Borot de Battisti

Foreword – 3
AGRICULTURAL PROGRESS IN CAMEROON, GHANA AND MALI: WHY IT HAPPENED AND HOW TO SUSTAIN IT
Foreword
This booklet synthesizes findings from analysis of agricultural policy and
performance in three African countries: Cameroon, Ghana and Mali. Case studies of each
of these countries were undertaken as part of the Support for African Agriculture
Project (SAAP), a project largely financed by the French Ministries of Foreign Affairs
and Agriculture and the International Fund for Agricultural Development (IFAD). The
purpose was to identify constraints to agricultural growth and poverty reduction that
might be eased through better policy, both domestically and internationally. Analysis of
agricultural performance focused on trends in output, factor use, and productivity.
Analysis of agricultural policy featured measurement of domestic and international price
distortions as well as the evolution of aid-financed public expenditures on agriculture.
This booklet is published under the responsibility of the Secretary-General of the OECD.
The views expressed herein are those of the authors and should not be construed as those
of funding partners – France and IFAD.
Acknowledgements
The financial support for the SAAP provided by France and IFAD is gratefully
acknowledged. The authors wish to express special thanks to Jean-Paul Pradère,
coordinator of the SAAP, for his contribution to the case studies, for developing the
network of country experts and for organizing multiple in-country workshops and
seminars where preliminary reports of findings were discussed.
In-country data collection and analysis was accomplished by teams of national
experts. Findings from their work were reported in numerous working papers and
presentations produced during the course of the project. Their results constituted the main
source of information used in developing this report. Thus we thank the following
individuals.
Cameroon
Dr. Rabelais Njonou Yankam (national coordinator), Mme. Jeanine Nkodo Ngono
Atanga, M. Tobie Ondoa Manga et M. Félix Bobiondo Bokagné - Ministry of Agriculture
and Rural Development.
Dr. Bouba Moumini - Ministry of Livestock, Fisheries and Animal Industries.
M. Jean-Pascal Nkou - Ministry of Economics and Finance.
Pr. Paul Tchawa - Ministry of Higher Education
M. Norbert Monkam - President Agro-PME Foundation.
4 –Foreword
AGRICULTURAL PROGRESS IN CAMEROON, GHANA AND MALI: WHY IT HAPPENED AND HOW TO SUSTAIN IT
Ghana
Mrs. Lena Esinam Otoo (national coordinator), Mrs. Zalia Egala, Mrs. Angela Dannson,
Mr. Francis Strofenyoh, Mr. Kwaku Owusu Baah and Mr. Jeremy Opoku-Agyemang -
Ministry of Food and Agriculture.
Dr. Charles Jebuni - Center for Economic Policy Analysis.
Dr. Edward O. Asante, Director Business Support and Executive Programme, Ghana
Institute of Management and Public Administration.
Mali
Adama Coulibaly (coordinator of project in Mali) – Ministry of Agriculture.
Bocar Bâ – Planning and Statistical Department.
Bouréma Cissé - Ministry of Livestock, Fisheries.
Brahima Sangaré – Food Security Commission.
We wish to thank also the following colleagues who kindly read and commented on
early drafts: Jesus Anton, Ken Ash, Jonathan Brooks, Carmel Cahill, Wayne Jones,
Andrzej Kwiecinski, Roger Martini, Catherine Moreddu and Stefan Tangermann. Thanks
as well to Florence Mauclert for statistical assistance and to Michèle Patterson, Stefanie
Milowski and Anita Lari for their help in preparing the document.
Table of Contents – 5
AGRICULTURAL PROGRESS IN CAMEROON, GHANA AND MALI: WHY IT HAPPENED AND HOW TO SUSTAIN IT
Table of contents
Executive Summary ................................................................................................................................... 7
Introduction .............................................................................................................................................. 10
Macroeconomic Context .......................................................................................................................... 11
Agricultural Policy Developments ........................................................................................................... 15
Estimated Market Price Support Rates ..................................................................................................... 18
Agricultural Development Assistance ...................................................................................................... 20
Effects of Agriculture Policies in OECD Countries ................................................................................ 23
Agricultural Performance ......................................................................................................................... 25
Farm Incomes and Rural Poverty ............................................................................................................. 29
Implications and Limitations .................................................................................................................... 34
Annex 1. Estimated Market Price Support Rates for Individual Commodities ........................................ 37
Annex 2. Estimating Cotton Processing margins for Mali ....................................................................... 54
Annex 3 The Cost of OECD Cotton Support Policies to Mali‟s Farmers ............................................... 56
References ................................................................................................................................................ 59
6 –Table of Contents
AGRICULTURAL PROGRESS IN CAMEROON, GHANA AND MALI: WHY IT HAPPENED AND HOW TO SUSTAIN IT
Tables
Table 1. Commodities for which market price support estimates were made ................................. 18
Table A1.1. Market Price Support Totals - Cameroon .................................................................... 39 Table A1.1.1. Cameroon: beef and veal .......................................................................................... 40 Table A1.1.2. Cameroon: green coffee ............................................................................................ 40 Table A1.1.3. Cameroon: cotton lint ............................................................................................... 41 Table A1.1.4. Cameroon: cocoa beans ............................................................................................ 41 Table A1.1.5. Cameroon: maize ...................................................................................................... 42 Table A1.1.6. Cameroon: millet ...................................................................................................... 42 Table A1.1.7. Cameroon: poultry .................................................................................................... 43 Table A1.1.8. Cameroon: pigmeat ................................................................................................... 43 Table A1.1.9. Cameroon: oil palm fruit ........................................................................................... 44 Table A1.1.10. Cameroon: sugar cane ............................................................................................. 44 Table a1.1.11. Cameroon: sorghum ................................................................................................. 45
Table A1.2. Market Price Support totals - Ghana ............................................................................ 46 Table A1.2.1. Ghana: cocoa beans ................................................................................................... 47 Table A1.2.2. Ghana: maize ............................................................................................................ 47 Table A1.2.3. Ghana: millet ............................................................................................................. 48 Table A1.2.4. Ghana: poultry .......................................................................................................... 48 Table A1.2.5. Ghana: paddy rice ..................................................................................................... 49 Table A1.2.6. Ghana: sorghum ........................................................................................................ 49
Table A1.3. Market Price Support Totals - Mali ............................................................................. 50 Table A1.3.1. Mali: cotton ............................................................................................................... 51 Table A1.3.2. Mali: maize ............................................................................................................... 51 Table A1.3.3. Mali: millet................................................................................................................ 52 Table A1.3.4. Mali: milk ................................................................................................................. 52 Table A1.3.5. Mali: rice ................................................................................................................... 53 Table A1.3.6. Mali: sorghum ........................................................................................................... 53
Table A2.1. Estimated cotton transport and processing margins ..................................................... 54
Table A3.1 Estimated government assistance to cotton producers in OECD countries,
1998–2004 ....................................................................................................................................... 56 Table A3.2. Estimated effects of eliminating OECD cotton support
(based on 2005 exchange rates, farm prices and production) .......................................................... 58 Table A3.3. Simulated poverty impacts of cotton price changes ..................................................... 58
Figures
Figure 1. Per capita income and inflation ........................................................................................ 12 Figure 2. Agricultural GDP and share ............................................................................................. 14
Figure 3. Estimated rates of market price support by source as % of production value. ................. 19
Figure 4. Aid disbursements to agriculture ...................................................................................... 21
Figure 5. Agricultural aid allocation, shares of total disbursements, 1990-2005 average ............... 22
Figure 6. Trends in real agricultural output for Cameroon, Ghana and Mali .................................. 26
Figure 7. Area and yield contribution to growth in cereals production,
1964-83 and 1984-2004 ................................................................................................................... 28
Figure 8. Trends in agricultural GDP per worker ............................................................................ 30
Figure 9. Poverty rates ..................................................................................................................... 31
Figure 10. Earnings versus GDP per agricultural worker in Ghana ................................................ 33
Executive Summary – 7
AGRICULTURAL PROGRESS IN CAMEROON, GHANA AND MALI: WHY IT HAPPENED AND HOW TO SUSTAIN IT
Executive Summary
The agricultural situation in Sub-Saharan Africa is often characterised as dire,
needing immediate policy action if food production is to keep up with a growing
population, famine averted and poverty reduced. The ten to twenty year record of
agricultural performance in three countries in the region: Cameroon, Ghana and Mali,
belies such bleak assessments. Since the mid-1980s food crop production in all three has
more than kept up with population growth fuelling significant increases in per capita food
availability. Ghana‟s cocoa exports have quadrupled and Mali‟s cotton exports tripled.
Cameroon‟s cocoa and cotton production have grown but there was a fall-off in
production of coffee, that country‟s other main export crop.
A frequently expressed concern is that, where it occurs, growth in African agricultural
production comes mainly from increases in the area of land cultivated - not from
increases in yields or from gains in factor productivity. Prior to the mid-1980s, growth in
food crop production in these countries was sluggish and in fact did come mainly from
cultivating an ever increasing share of the agricultural land base. Indeed, from 1964 to
1983, the annual average rate of cereal yield growth was negative in both Ghana and Mali
and only marginally positive in Cameroon. Since then, however, increased cereal
production has been sustained by a combination of increased yields and area cultivated.
Multiple factors contributed to the turnaround in agricultural performance. Growing
per capita incomes boosted domestic demand and prices paid for food crops and livestock
and generally positive trends in world prices of cocoa and cotton helped. Perhaps most
importantly however, in all three countries recovery in agriculture coincided with major
re-orientations of macroeconomic and agricultural sector policy. Ghana implemented a
phased devaluation and a gradual move to market determined exchange rates, a process
leading eventually to a free float. Cameroon and Mali together with other African
countries in the same currency zone, devalued their exchange rates but left them fixed, at
first to the French franc and subsequently to the euro. Macroeconomic policy targeted
low inflation and reductions in government and trade deficits.
Agricultural policy changed fundamentally. Most state-owned procurement and
marketing agencies were privatised, closed or lost responsibility for some of the wide
range of activities in which they were engaged prior to the reforms. Export taxes, which
in earlier years soaked up the lion‟s share of receipts from export sales of agricultural
commodities, were substantially reduced in Ghana and Mali and eliminated altogether in
Cameroon. Tariffs on agricultural imports were harmonised and reduced in accord with
terms of various regional trade agreements to which the three belong. Although no
attempt was made to formally measure causal effect, the coincidence of better agricultural
performance with the implementation of macroeconomic and sectoral policy reforms
seems too great to ignore.
Under performance of Africa‟s agriculture has frequently been blamed, at least in
part, on the lower world prices resulting from farm subsidies and trade protection OECD
8 –Executive Summary
AGRICULTURAL PROGRESS IN CAMEROON, GHANA AND MALI: WHY IT HAPPENED AND HOW TO SUSTAIN IT
governments provide their farmers. The combined impact of all kinds of OECD price
support and subsidy has been estimated to reduce farm incomes in the sub-Saharan region
that includes the three study countries by between 2 and 3%.The most widely publicised
of OECD agricultural support measures thought to harm farmers in the region are cotton
subsidies. Mali farmers receive prices for their cotton that are an estimated 5% to 20%
lower because of subsidies given cotton farmers in OECD countries, mainly in the United
States.
Partially offsetting the negative impacts of OECD agricultural trade protection and
farm subsidies are the beneficial effects of preferential tariff treatment and agricultural
development assistance OECD countries provide the three study countries. Cameroon is
an important beneficiary of the preferential access OECD countries give to exports from
all countries in the region but the estimated value of Ghana‟s preferences are much less
and those for Mali, smaller again.
Donor aid is the dominant source of financing for public investment in agriculture in
all three countries. OECD donors, bilaterally and through their support of multilateral
organisations, have, since the early 1990s provided increasing amounts of agriculture-
specific development assistance to Ghana and Mali. There has been a decline in the
relatively small amount of agriculture-related aid provided Cameroon. But, even for
Ghana and Mali the amounts involved tend to be small relative to the agricultural GDP of
the three countries. From 2001 to 2005 the total of donor aid targeted to agriculture
amounted to less than 0.5% of Cameroon‟s agricultural GDP, just over 0.5% of Ghana‟s
and less than 2% of Mali‟s - percentages that would be smaller still if adjustments were
made for administrative costs and waste. Moreover, much of the increase in donor aid in
recent years has been to foster improvements in administrative and policy development
functions of government rather than to enhance productive capacity or market functioning
within the sector itself.
There has been progress in reducing poverty, and especially so in Ghana where the
national poverty rate has nearly halved since the early 1990s. In all three countries there
are fewer rural and urban people living below the respective national poverty lines now
than in the late 1990s. Still, roughly half the rural population in Cameroon (in 2001) and
Mali (in 2006) are in poverty and well over one-third in Ghana (in 2006). More could
have been expected on the poverty front given the strong growth in agricultural
production and productivity witnessed in the three countries. Although agricultural GDP
has grown steadily, so has the number of workers in the sector so that agricultural GDP
per worker, a proxy for agricultural income, has not grown very much at all – except in
Cameroon. In Ghana, the country posting the fastest progress in poverty reduction, almost
all the recent reduction in rural poverty seems to be coming from growth in earnings from
off-farm sources. And, in Cameroon, the country posting the strongest growth in
agricultural GDP per worker the apparent progress in poverty reduction has been meagre.
There remains some scope for further progress in reducing agricultural market
distortions through domestic policy reform. Administered pricing arrangements for cotton
in Mali and for cocoa in Ghana could be improved so that farmers get a still higher share
of the export value of their production. Likewise, farm incomes could be boosted if the
wide margins between prices at wholesale versus farm-gate could be reduced through,
e.g. improvements in transportation and marketing infrastructure. Relatively high rates of
import protection divert productive resources from production of export competing goods
reducing economic efficiency with perhaps negative implications for income distribution
and poverty as well.
Executive Summary – 9
AGRICULTURAL PROGRESS IN CAMEROON, GHANA AND MALI: WHY IT HAPPENED AND HOW TO SUSTAIN IT
Development assistance targeted to agriculture in the three study countries and in
Africa more generally is slated to increase sharply in coming years. While this trend is
laudable it must be remembered that the quality of spending is at least as important as the
level. A large share of foreign aid to agriculture in the study countries in past years was
spent on subsidies to production, including subsidies to purchased input use – a category
of public spending that has been shown to be amongst the least efficient and most
inequitable mechanisms for improving the economic plight of farmers in OECD
countries. There is no evident theoretical case for expecting otherwise for developing
countries such as Cameroon, Ghana or Mali. A relatively small share of foreign aid to
agriculture has gone to finance activities known to yield high social payoffs such as
agricultural research, extension and education.
Cameroon, Ghana and Mali all show signs of following a road to economic
development similar to that followed by all developed countries. Continuing along that
road will create adjustment pressures that call for policy action. The share of the
workforce and probably the absolute number of people working in agriculture is likely to
fall, and could fall rapidly in coming years if economy-wide progress continues. Policies
that foster the associated adjustments could include programmes of training and
education: (1) for those wanting to stay in farming but needing to diversify their sources
of income; (2) for those wishing to leave farming but remain in the area; or (3) for those
wishing to migrate to jobs in town. There will also be a continuing need for agricultural
policy, not to subsidise agricultural production or protect farmers from markets, but to
improve the sustained productive capacity of farm households and their ability to access
markets at home and abroad.
10 –Introduction
AGRICULTURAL PROGRESS IN CAMEROON, GHANA AND MALI: WHY IT HAPPENED AND HOW TO SUSTAIN IT
Introduction
Agriculture plays a prominent role in the economy and society in every country in sub
Saharan Africa. Most countries in the region have the natural and human resources
needed for strong and sustainable agricultural development and African governments
generally put agriculture at the top of their development priorities. Yet agriculture is
widely seen as underperforming [World Bank (2007), InterAcademy Council (2004)].
Despite some improvements in recent years large percentages of people who depend on
farming for a living are in poverty. Income gaps between farm and non-farm households
are wide and a too-high percentage of both rural and urban populations suffer from
malnutrition and food insecurity. It is an open question, however, whether these problems
can be blamed on poor agricultural sector performance per se or whether they, and
stagnant agricultural growth itself, are the consequence of other factors that constrain
economic growth more generally.
Economic conditions in sub Saharan Africa were worse in the mid-1980s when the
International Monetary Fund and the World Bank began to require changes in domestic
macroeconomic and sector policy as conditions for granting new loans or to obtain
interest rate relief on existing loans. A complete re-orientation of economic policy was
thought essential to promote economic growth, to generate income and reduce poverty.
As they applied to agriculture, these so-called Structural Adjustment Programs (SAPs)
were guided by free market principles similar in many respects to those used to judge
agricultural policy performance in OECD countries.
Cameroon, Ghana and Mali each suffered its own economic crisis at some point
during the 1980s‟ to early-1990s‟. Their respective governments responded to the crisis
by implementing economic policy reforms featuring profound changes in agricultural
policy. The agricultural sectors of all three countries have prospered since these reforms.
However, was the improved agricultural performance the result of policy reforms or was
it caused by something else, such as favourable developments in weather; higher world
commodity prices, increased development assistance and public spending on agriculture,
or improved trading opportunities?
The OECD has accumulated considerable experience in analyzing agricultural policy
and performance in OECD and some major non-OECD countries. We use the same basic
approach to evaluate the evolution of agricultural policy in Cameroon, Ghana and Mali,
focusing especially on the last ten to twenty years during which each country was
recovering from economic crisis. During these years, their governments implemented the
policy reforms imposed by the SAP‟s. However, the policies of interest here also include
those of OECD countries, including the agricultural trade protection and subsidies
afforded to OECD farmers and the agriculture-specific development assistance OECD
donor countries give to Cameroon, Ghana and Mali. In the second section, trends in
agricultural output, productivity and rural poverty in the years before and following
economic crisis are compared. The paper concludes by drawing implications for future
policy and identifies a number of issues meriting further analysis.
Macroeconomic Context – 11
AGRICULTURAL PROGRESS IN CAMEROON, GHANA AND MALI: WHY IT HAPPENED AND HOW TO SUSTAIN IT
Macroeconomic Context
From economic crisis to stability and sustained growth
The timing and duration of economic crisis were different among the three study
countries, but the pattern was broadly similar. In each, at some point during the late 1970s
to early 1990s there commenced a prolonged period of economic downturn culminating
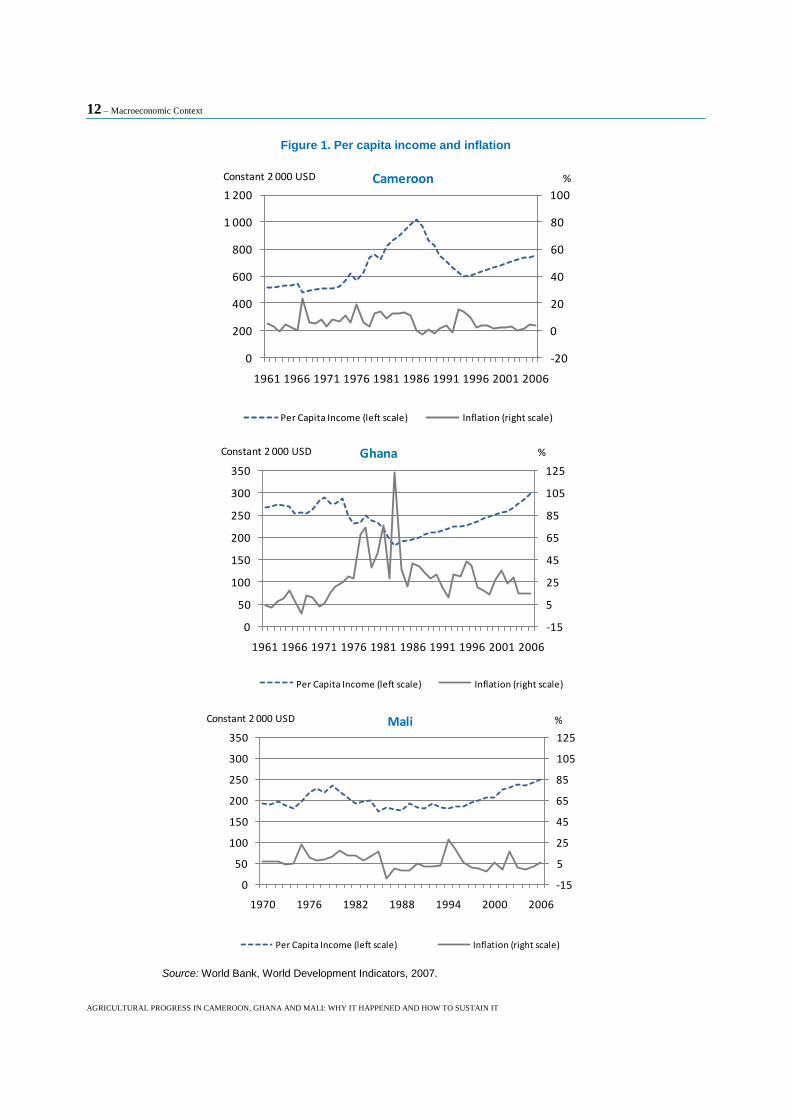
in economic and political emergency. The three panels of Figure 1 trace the evolution of
real per capita incomes and inflation for Cameroon, Ghana and Mali from the 1960s to
2005. Measured by the low point in real per capita income, Ghana‟s economy hit bottom
in 1983, Mali‟s in 1985 and Cameroon‟s in 1994. The policy response triggered by each
country‟s economic crisis provided the basis for a phase of improving incomes and
relatively stable inflation that has continued through to present times.
In US dollar terms, per capita incomes are more than twice as high in Cameroon as in
either Ghana or Mali. The fall was also the hardest there. Cameroon‟s income per capita
peaked at over USD 1 000 (constant USD 2 000) in 1986; less than ten years later it had
fallen to below USD 600 and, despite continuous growth since 1994, remains today well
short of that 1986 peak. Ghana‟s economy bottomed out in 1983; real incomes per head
have increased in every year since, finally surpassing the previous record in 2006 (a
record that had stood since 1971). Mali, poorer than either Cameroon or Ghana, did not
suffer an economic downturn as severe (in percentage terms) as the other two. However,
recovery has been slower and there have been the occasional years when per capita
income has dipped.
Inflation has continued to plague Ghana‟s economic recovery with annual rates
averaging above 20% until recent years when they have receded to the mid-teens. In Mali
and Cameroon the fixing of the exchange rate to the euro has kept inflation in check, but
perhaps at the cost of some significant loss in competitiveness. For example, in Ghana,
cocoa prices in local currency terms have risen much faster than in Cameroon. Ghana‟s
cocoa production has also accelerated while Cameroon‟s has stagnated. Other factors,
including major differences in the organisation of cocoa marketing and research between
Cameroon and Ghana could have contributed to Ghana‟s relatively better performance in
the sector.
12 – Macroeconomic Context
AGRICULTURAL PROGRESS IN CAMEROON, GHANA AND MALI: WHY IT HAPPENED AND HOW TO SUSTAIN IT
Figure 1. Per capita income and inflation
-20
0
20
40
60
80
100
0
200
400
600
800
1 000
1 200
1961 1966 1971 1976 1981 1986 1991 1996 2001 2006
Per Capita Income (left scale) Inflation (right scale)
CameroonConstant 2 000 USD %
-15
5
25
45
65
85
105
125
0
50
100
150
200
250
300
350
1961 1966 1971 1976 1981 1986 1991 1996 2001 2006
Per Capita Income (left scale) Inflation (right scale)
GhanaConstant 2 000 USD %
-15
5
25
45
65
85
105
125
0
50
100
150
200
250
300
350
1970 1976 1982 1988 1994 2000 2006
Per Capita Income (left scale) Inflation (right scale)
MaliConstant 2 000 USD %
Source: World Bank, World Development Indicators, 2007.
Macroeconomic Context – 13
AGRICULTURAL PROGRESS IN CAMEROON, GHANA AND MALI: WHY IT HAPPENED AND HOW TO SUSTAIN IT
Agriculture’s role in the economy is declining, signalling economic
development along familiar paths
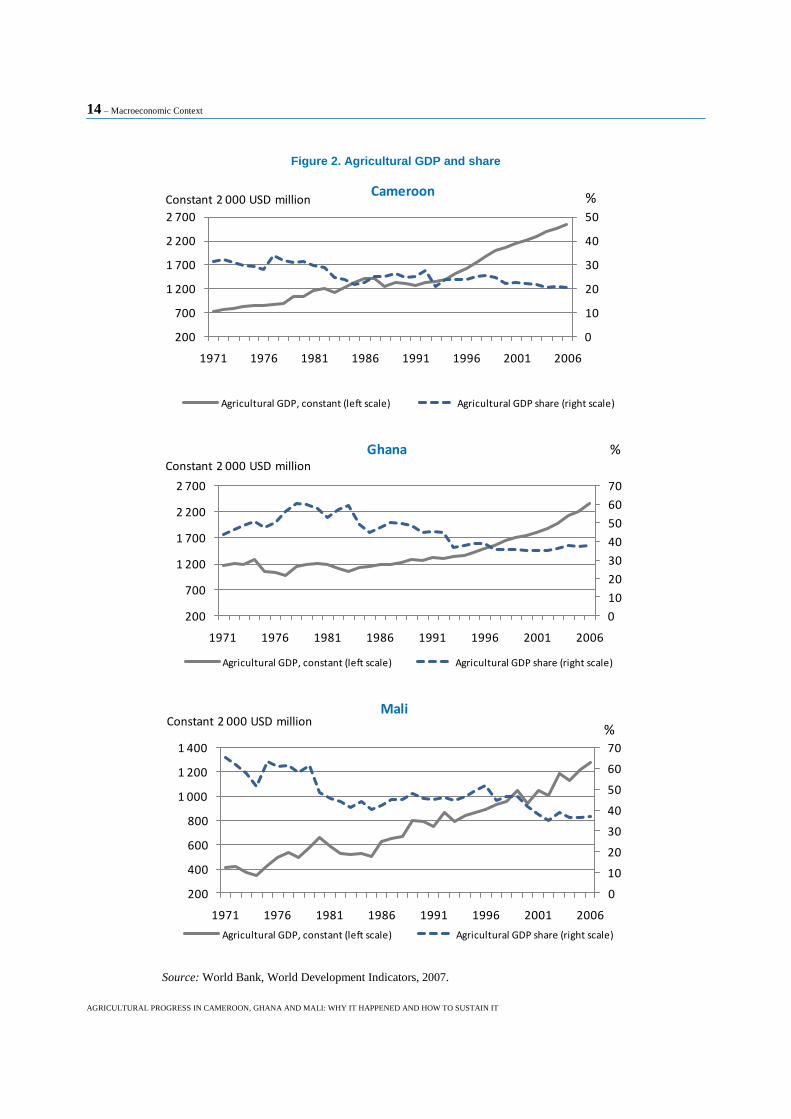
Figure 2 compares trends in economy-wide and agriculture GDP. Reflecting their
stage of economic development, agriculture‟s importance in the economy is relatively
much higher in these than in OECD countries, higher even than is the average for the
Sub-Saharan African region in total. In both Ghana and Mali, although agricultural GDP
fell during the crisis years it fell less than the total, i.e. in both countries agriculture‟s
share of GDP rose when the economy faltered. Since then, agricultural GDP in all three
countries has been growing, but less fast than the economy-wide total so that agriculture‟s
share has been declining.
Agriculture‟s share of the economy-wide GDP typically declines in growing
economies because growth in per capita incomes favours growth in consumer demand for
non-food goods and services over demand for food. Thus, except when growth in
agricultural exports offsets, an increasing share of labour and capital is used in the non-
agricultural sectors. Tracing these latter developments is difficult given data availabilities
for the three study countries.
14 – Macroeconomic Context
AGRICULTURAL PROGRESS IN CAMEROON, GHANA AND MALI: WHY IT HAPPENED AND HOW TO SUSTAIN IT
Figure 2. Agricultural GDP and share
0
10
20
30
40
50
200
700
1 200
1 700
2 200
2 700
1971 1976 1981 1986 1991 1996 2001 2006
Agricultural GDP, constant (left scale) Agricultural GDP share (right scale)
CameroonConstant 2 000 USD million %
0
10
20
30
40
50
60
70
200
700
1 200
1 700
2 200
2 700
1971 1976 1981 1986 1991 1996 2001 2006
Agricultural GDP, constant (left scale) Agricultural GDP share (right scale)
GhanaConstant 2 000 USD million
%
0
10
20
30
40
50
60
70
200
400
600
800
1 000
1 200
1 400
1971 1976 1981 1986 1991 1996 2001 2006
Agricultural GDP, constant (left scale) Agricultural GDP share (right scale)
MaliConstant 2 000 USD million
%
Source: World Bank, World Development Indicators, 2007.
Macroeconomic Context – 15
AGRICULTURAL PROGRESS IN CAMEROON, GHANA AND MALI: WHY IT HAPPENED AND HOW TO SUSTAIN IT
Agricultural Policy Developments
Major re-alignments of policy have led to a diminishing state role in
agricultural markets
In the years leading up to their respective economic crises government played a
dominant role in agricultural markets in Cameroon, Ghana and Mali. Both the prices
farmers received for their output and those they paid for purchased inputs were largely
influenced by the parameters of government procurement, subsidy and trade policies. Of
course, it was not only in these three developing countries that government was
omnipresent in agricultural markets and in the economic affairs of farmers. In a study of
agricultural price distortions, Krueger, Schiff and Valdes concluded that the net impact of
the whole package of macroeconomic, trade and agricultural policies used by
governments in developing countries before 1985 was largely negative for farmers,
i.e. that the farm sector was, in effect, taxed at a higher rate than non-farm sectors. Their
calculations acknowledged the positive support deriving from the price protection
afforded by import tariffs and from input subsidies but these were swamped by the
negatives deriving from both explicit and implicit taxation of exports – the latter a result
of overvalued exchange rates.
Agricultural policy reforms implemented since the 1980s have dramatically changed
the policy and market context in which farmers in the three study countries find
themselves. One way of quantifying this policy evolution is through the calculation of
annual indicators of financial transfers created by government interventions in the sector
(whether positive as is common in developed countries or negative as was common in
earlier years in most developing countries). Here we focus on just two categories of
transfers: (1) the market price support (positive and negative) that results from border
measures; and (2) public expenditures for agriculture financed by agriculture-specific
development assistance. As is typical for OECD countries, price support accounts for the
lion‟s share of total agricultural support provided farmers in Cameroon, Ghana and Mali.
And, almost all public expenditures on agriculture projects and programmes in these
countries are financed by development assistance under shared funding arrangements
whereby the government may contribute 20% or less of the total with donors covering the
rest.
Anti-agriculture domestic policy biases reduced but not eliminated
Market price support refers to the gross transfers from consumers and taxpayers to
agricultural producers arising from policy measures that create a gap between domestic
market prices and border prices. Ideally, this price gap is estimated by comparing prices
actually received by farmers to an associated world market price, with adjustments as
necessary to allow comparisons at the farm gate. Preliminary attempts to use the price gap
method for the present study were unsuccessful. Accordingly, a shortcut was chosen
16 – Macroeconomic Context
AGRICULTURAL PROGRESS IN CAMEROON, GHANA AND MALI: WHY IT HAPPENED AND HOW TO SUSTAIN IT
whereby percentage rates of price support were estimated using solely the data on applied
tariffs and export taxes. Estimates of applied (Most Favoured Nation - MFN) tariffs for
each country‟s main agricultural imports are available in the World Integrated Trade
System (WITS) database. Export tax data was obtained from national sources. Annex 1
contains a tabular presentation and an explanation of the data used in making market
price support calculations. Data measuring trends in agriculture specific development
assistance are available from the Creditor Reporting System database maintained by the
OECD‟s Development Assistance Committee. A discussion of findings from analysis of
that data is presented in a later section.
Tariffs
Cameroon, Ghana and Mali each belong to at least one regional trading agreement
that calls for preferential tariffs on trade amongst members and common external
tariffs (CET‟s) to be applied to trade with non-members. Cameroon belongs to the
Economic and Monetary Community of Central Africa (CEMAC). Both Ghana and Mali
are members of the Economic Community of West African States (ECOWAS). Mali is
also a member of the West African Economic and Monetary Union (UEMOA) a group of
West African countries with a common currency and a CET schedule identical to that of
ECOWAS.
In reality, most trade with other member countries of their respective trading
agreements tends to be small compared to trade with non-members, principally OECD
member countries, so that it is the CET‟s that really matter. The structure of CET‟s is
similar for all the regional agreements. Each comprises a tariff ladder wherein higher
tariffs are charged the higher the degree of further processing (value added) embodied in
the imported product. In all three cases, the tariff ladder contains a few rungs with only
slight variation in the products covered and the associated tariff rate.
Cameroon follows the system of common external tariffs (CET) applied by CEMAC
member countries. It is composed of four different tiers: 5% for essential goods, 10% for
raw materials, 20% for intermediate goods and 30% for finished consumer goods.
Ghana‟s tariff structure comprises three rates: a low rate of 0% (with some items recently
raised to 5%) reserved primarily for primary products, capital goods, and some basic
consumer goods; a moderate rate of 10% applied primarily to other raw materials and
intermediate inputs, as well as some consumer goods; and a higher rate of 20%, mainly
on final consumer goods. In addition, there are several programmes under which imports
can be exempted from import duties, and manufacturers can apply for permission to
import raw materials and intermediate inputs at concessionary duty rates. The UEMOA
agreement to which Mali adheres sets a minimum rate of 2% for essential goods, notably
medicines; 7% for raw materials, production equipment and some categories of
agricultural inputs; 12% for intermediate goods requiring further processing; and 22% for
finished consumer goods.
Care must be taken in using tariffs as indicators of the rate of protection afforded the
agricultural sector of a particular country. Generally speaking the tariff rate overstates the
farm price benefits of tariff protection. This partly reflects the fact that imported
commodities are typically not viewed by buyers and consumers as being identical to
(perfectly substitutable with) the domestically produced good. Where the imported and
the domestic good cannot be regarded as perfect substitutes the transmission of the tariff-
inclusive higher price for the imported good into a higher price for the domestically
Macroeconomic Context – 17
AGRICULTURAL PROGRESS IN CAMEROON, GHANA AND MALI: WHY IT HAPPENED AND HOW TO SUSTAIN IT
produced good will be partial and the tariff rate will overstate the associated producer
price benefits.
Price transmission will be less than 100% even for perfectly substitutable imports and
domestic goods if the costs of transporting the product from the border and/or from the
domestic producing zone are not proportional to product prices (as when, for example, the
transportation charge is so much per tonne per kilometre). Additionally, the protective
effect of the tariff is obviously of benefit only to those producers whose output competes
with the protected imported good. Producers of other imported or non-tradable goods may
not and producers of exported goods most likely would not gain from the imposition of
tariffs on selected imports. Indeed, some of those producers may find they have to pay
higher wages or land rents in order to meet the competition for those resources coming
from producers of protected commodities.
Export taxes
Where import tariffs have the potential to boost producer prices to levels higher than
they would otherwise be (positive market price support), export taxes have the opposite
effect, i.e. they depress producer prices to levels below where they would otherwise be
(negative market price support). Agricultural exports have long been an important source
of government revenue in all three study countries. But taxes on exports have also long
been judged a serious impediment to achieving a country‟s economic growth potential.
Accordingly, reducing them was a key objective of each of the country‟s policy reform
efforts – an objective largely accomplished.
Before the reforms, the government in Cameroon collected taxes on exports of a
number of different agri-industrial products: cocoa, cotton, medical plants, sugar, rubber,
coffee, palm oil and bananas. These were progressively eliminated and since 2000 only
exports of forestry products have been subject to export taxes.
In Ghana, cocoa procurement and pricing is done by a quasi-governmental marketing
board – COCOBOD. The tax rate for cocoa beans is determined annually by the Minister
of Finance and Economic Planning. Taxes are collected by COCOBOD and the revenues
transferred to the government - considered along with producers and other market
participants a „partner‟ in the cocoa business. Cocoa tax receipts are sufficiently
important to be singled out in routine presentations of government budgetary operations
and financing. In recent years 4 to 5% of the government‟s annual tax receipts have come
from cocoa export taxes. The rate of export tax charged was falling before the economic
crisis and has continued to fall since, now averaging just above 10% of the border price of
cocoa beans.
In Mali, the government used to but no longer collects taxes on exports of cotton.
However, cotton producer prices are set by a marketing organisation, the CMDT, partly
owned by the government of Mali. The pricing formula sets a processing and marketing
margin that is proportional to the FOB price of cotton so that in some years anyway the
government earns tax-like revenues in much the same way as if export taxes were
explicit. Part of these revenues was in the past used to fund services to cotton farmers,
such as rural infrastructure and education. We estimated this implicit export tax by
comparing domestic and world cotton prices adjusted for an assumed margin for cotton
processing and marketing. The procedure used in calculating the processing margin is
explained in Annex 2.
18 – Estimated Market Price Support Rates
AGRICULTURAL PROGRESS IN CAMEROON, GHANA AND MALI: WHY IT HAPPENED AND HOW TO SUSTAIN IT
Estimated Market Price Support Rates
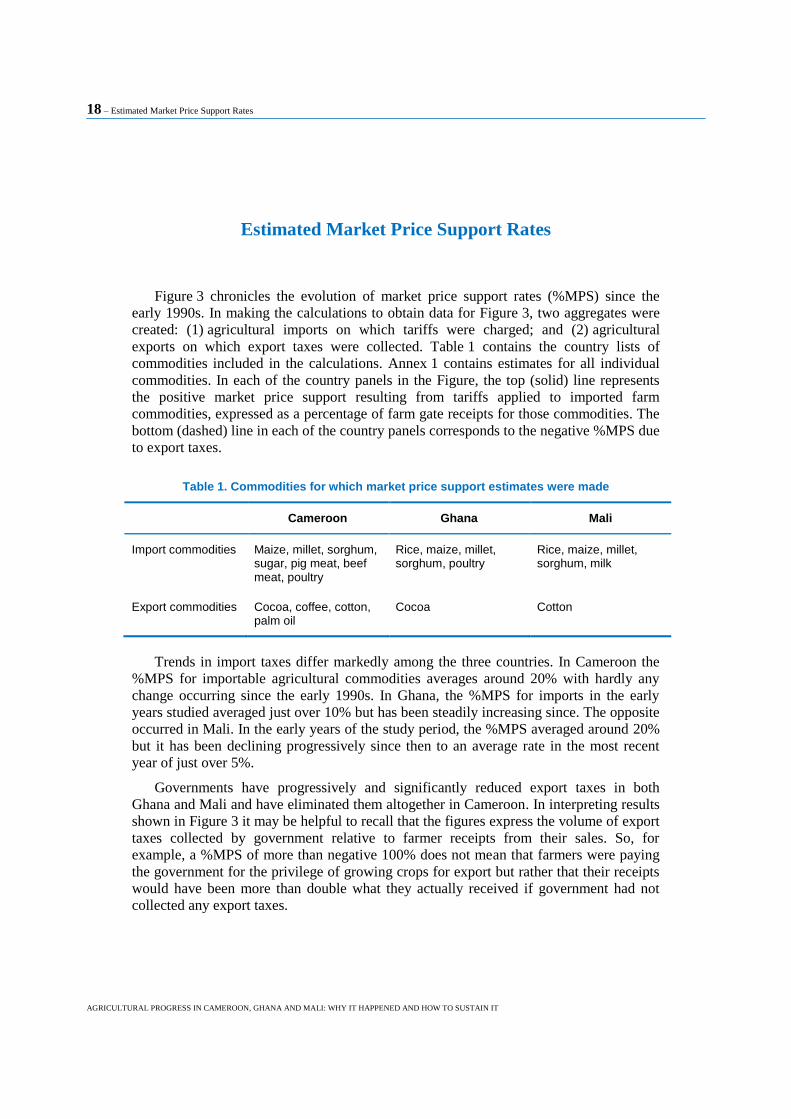
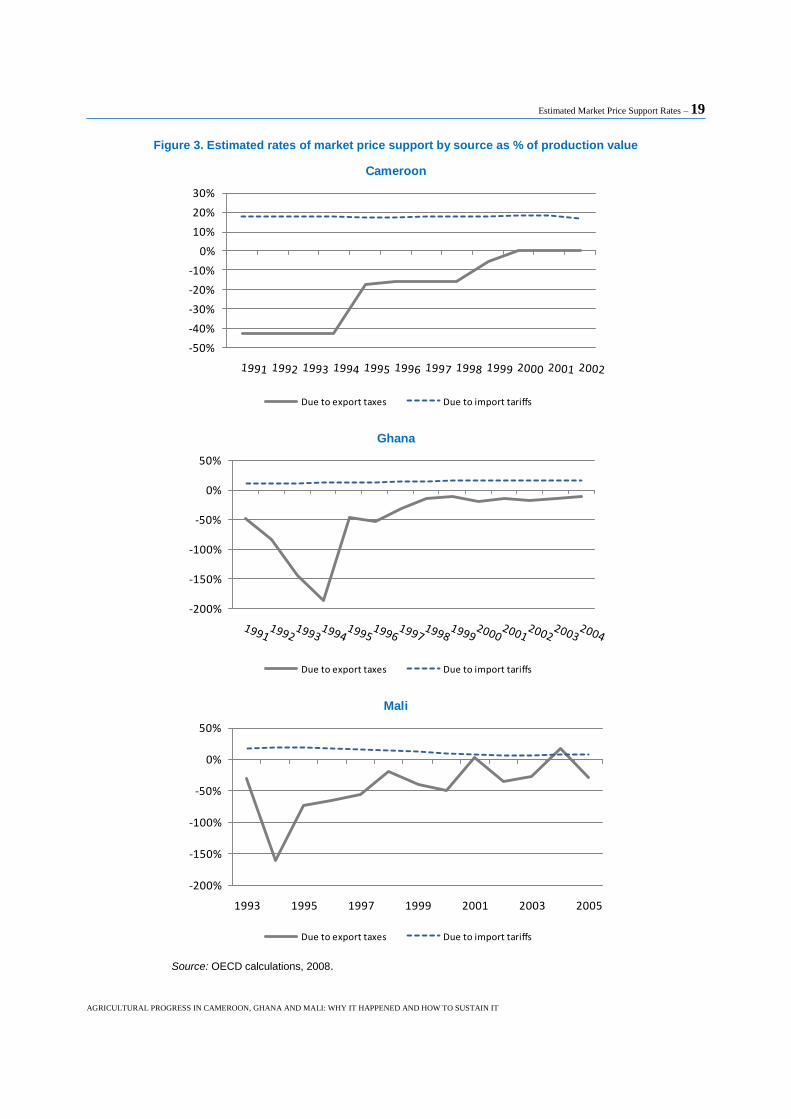
Figure 3 chronicles the evolution of market price support rates (%MPS) since the
early 1990s. In making the calculations to obtain data for Figure 3, two aggregates were
created: (1) agricultural imports on which tariffs were charged; and (2) agricultural
exports on which export taxes were collected. Table 1 contains the country lists of
commodities included in the calculations. Annex 1 contains estimates for all individual
commodities. In each of the country panels in the Figure, the top (solid) line represents
the positive market price support resulting from tariffs applied to imported farm
commodities, expressed as a percentage of farm gate receipts for those commodities. The
bottom (dashed) line in each of the country panels corresponds to the negative %MPS due
to export taxes.
Table 1. Commodities for which market price support estimates were made
Cameroon Ghana Mali
Import commodities Maize, millet, sorghum, sugar, pig meat, beef meat, poultry
Rice, maize, millet, sorghum, poultry
Rice, maize, millet, sorghum, milk
Export commodities Cocoa, coffee, cotton, palm oil
Cocoa Cotton
Trends in import taxes differ markedly among the three countries. In Cameroon the
%MPS for importable agricultural commodities averages around 20% with hardly any
change occurring since the early 1990s. In Ghana, the %MPS for imports in the early
years studied averaged just over 10% but has been steadily increasing since. The opposite
occurred in Mali. In the early years of the study period, the %MPS averaged around 20%
but it has been declining progressively since then to an average rate in the most recent
year of just over 5%.
Governments have progressively and significantly reduced export taxes in both
Ghana and Mali and have eliminated them altogether in Cameroon. In interpreting results
shown in Figure 3 it may be helpful to recall that the figures express the volume of export
taxes collected by government relative to farmer receipts from their sales. So, for
example, a %MPS of more than negative 100% does not mean that farmers were paying
the government for the privilege of growing crops for export but rather that their receipts
would have been more than double what they actually received if government had not
collected any export taxes.
Estimated Market Price Support Rates – 19
AGRICULTURAL PROGRESS IN CAMEROON, GHANA AND MALI: WHY IT HAPPENED AND HOW TO SUSTAIN IT
Figure 3. Estimated rates of market price support by source as % of production value
-50%
-40%
-30%
-20%
-10%
0%
10%
20%
30%
Cameroon
Due to export taxes Due to import tariffs
-200%
-150%
-100%
-50%
0%
50%
Ghana
Due to export taxes Due to import tariffs
-200%
-150%
-100%
-50%
0%
50%
1993 1995 1997 1999 2001 2003 2005
Mali
Due to export taxes Due to import tariffs
Source: OECD calculations, 2008.
20 – Agricultural Development Assistance
AGRICULTURAL PROGRESS IN CAMEROON, GHANA AND MALI: WHY IT HAPPENED AND HOW TO SUSTAIN IT
Agricultural Development Assistance
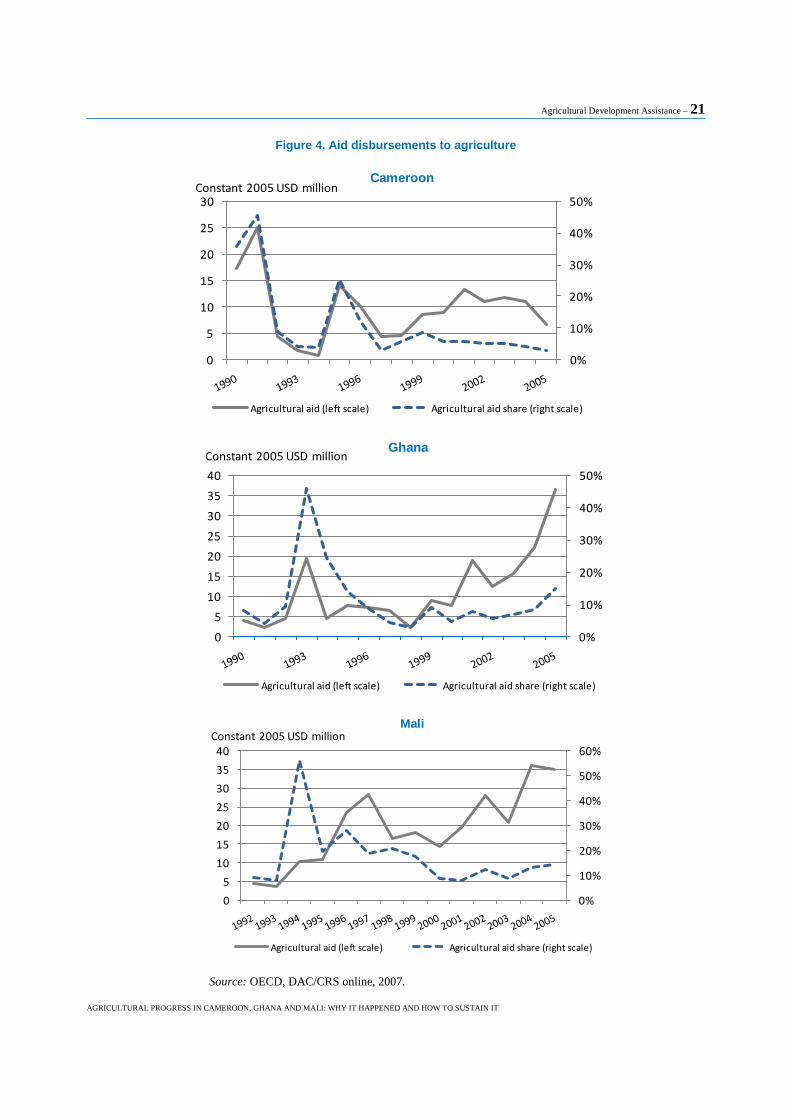
Disbursements of development assistance earmarked for agriculture are currently
running at less than 0.2% of agricultural GDP in Cameroon; around 0.9% in Ghana and
2.0% in Mali. Sector aid flows to Ghana and to Mali have been growing sharply in recent
years, but have been falling in Cameroon. All three countries could see dramatically
increased aid for agriculture if widespread demands for increased donor priority for the
sector are met. Agriculture‟s share in total sector aid (labelled “Agr aid share” in Figure 4
on following page) has declined, but that is because of increases in social sector aid flows
(health and education mainly), not because the real dollar amounts of agricultural
development assistance are falling.
Composition of aid to agriculture has largely favoured production - smaller
shares for agricultural research, extension and education
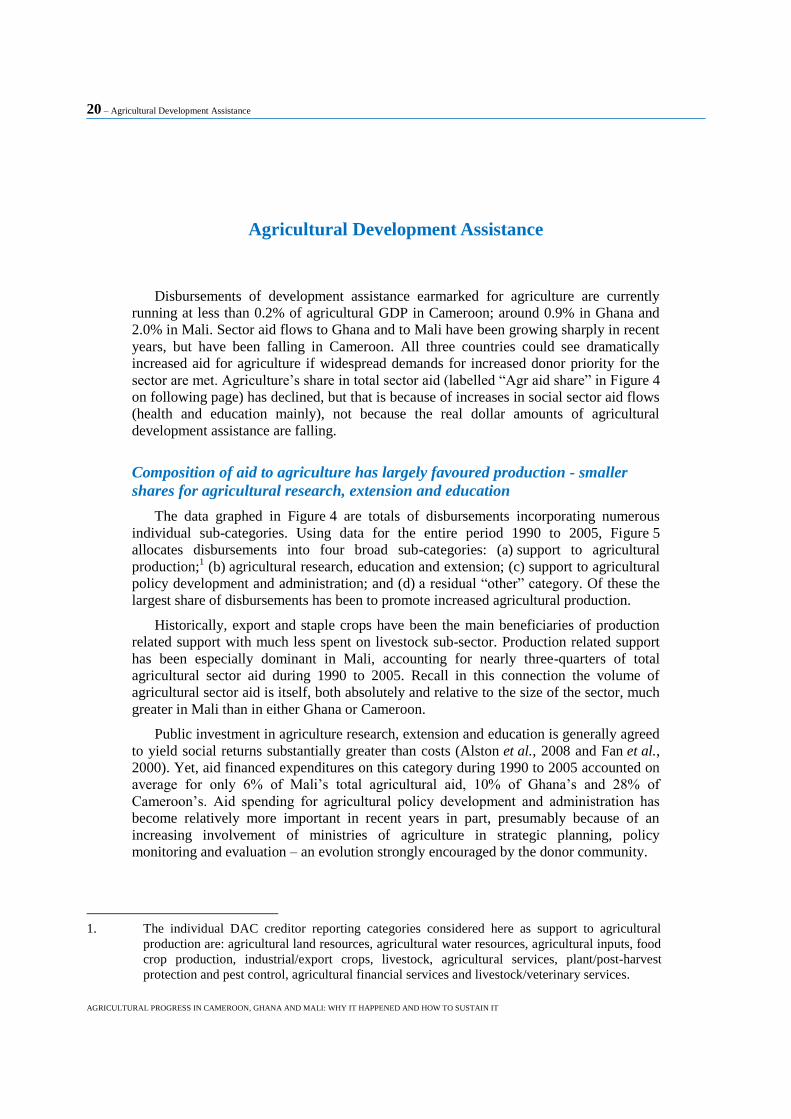
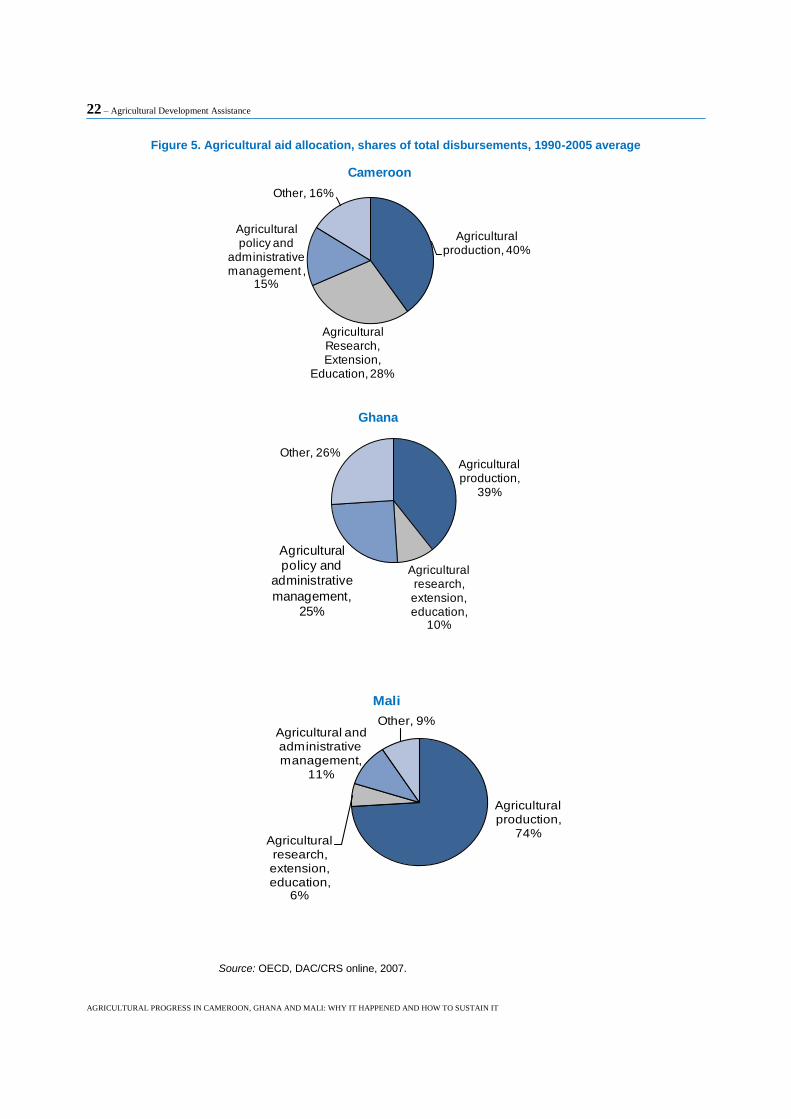
The data graphed in Figure 4 are totals of disbursements incorporating numerous
individual sub-categories. Using data for the entire period 1990 to 2005, Figure 5
allocates disbursements into four broad sub-categories: (a) support to agricultural
production;1 (b) agricultural research, education and extension; (c) support to agricultural
policy development and administration; and (d) a residual “other” category. Of these the
largest share of disbursements has been to promote increased agricultural production.
Historically, export and staple crops have been the main beneficiaries of production
related support with much less spent on livestock sub-sector. Production related support
has been especially dominant in Mali, accounting for nearly three-quarters of total
agricultural sector aid during 1990 to 2005. Recall in this connection the volume of
agricultural sector aid is itself, both absolutely and relative to the size of the sector, much
greater in Mali than in either Ghana or Cameroon.
Public investment in agriculture research, extension and education is generally agreed
to yield social returns substantially greater than costs (Alston et al., 2008 and Fan et al.,
2000). Yet, aid financed expenditures on this category during 1990 to 2005 accounted on
average for only 6% of Mali‟s total agricultural aid, 10% of Ghana‟s and 28% of
Cameroon‟s. Aid spending for agricultural policy development and administration has
become relatively more important in recent years in part, presumably because of an
increasing involvement of ministries of agriculture in strategic planning, policy
monitoring and evaluation – an evolution strongly encouraged by the donor community.
1. The individual DAC creditor reporting categories considered here as support to agricultural
production are: agricultural land resources, agricultural water resources, agricultural inputs, food
crop production, industrial/export crops, livestock, agricultural services, plant/post-harvest
protection and pest control, agricultural financial services and livestock/veterinary services.
Agricultural Development Assistance – 21
AGRICULTURAL PROGRESS IN CAMEROON, GHANA AND MALI: WHY IT HAPPENED AND HOW TO SUSTAIN IT
Figure 4. Aid disbursements to agriculture
0%
10%
20%
30%
40%
50%
0
5
10
15
20
25
30
Cameroon
Agricultural aid (left scale) Agricultural aid share (right scale)
Constant 2005 USD million
0%
10%
20%
30%
40%
50%
0
5
10
15
20
25
30
35
40
Ghana
Agricultural aid (left scale) Agricultural aid share (right scale)
Constant 2005 USD million
0%
10%
20%
30%
40%
50%
60%
0
5
10
15
20
25
30
35
40
Mali
Agricultural aid (left scale) Agricultural aid share (right scale)
Constant 2005 USD million
Source: OECD, DAC/CRS online, 2007.
22 – Agricultural Development Assistance
AGRICULTURAL PROGRESS IN CAMEROON, GHANA AND MALI: WHY IT HAPPENED AND HOW TO SUSTAIN IT
Figure 5. Agricultural aid allocation, shares of total disbursements, 1990-2005 average
Agricultural production, 40%
Agricultural Research, Extension,
Education, 28%
Agricultural policy and
administrative management ,
15%
Other, 16%
Cameroon
Agricultural production,
39%
Agricultural research, extension, education,
10%
Other, 26%
Ghana
Agricultural policy and
administrative
management, 25%
Agricultural production,
74%Agricultural research, extension, education,
6%
Other, 9%
Mali
Agricultural and administrative management,
11%
Source: OECD, DAC/CRS online, 2007.
Effects of Agriculture Policies in OECD Countries – 23
AGRICULTURAL PROGRESS IN CAMEROON, GHANA AND MALI: WHY IT HAPPENED AND HOW TO SUSTAIN IT
Effects of Agriculture Policies in OECD Countries
Incidence of OECD agricultural trade and subsidy policies in countries varies
among countries and products
Farmers in Cameroon, Ghana and Mali may be both helped and harmed in
consequence of agricultural policies implemented in OECD member countries. Many
OECD governments impose tariffs on imports of agricultural goods; some pay subsidies
to encourage exports and provide additional financial help through direct budgetary
payments, concessions on taxes, subsidised credit, fuel and fertiliser. Such interventions
boost the incentives to produce and, ultimately, the supply of protected commodities on
world markets. Through trade and world market links, the trade protection and domestic
support afforded OECD farmers lead to lower-than-otherwise world market prices and
farm incomes in some non-OECD countries.
However, some of the most important agricultural commodities produced in the three
study countries, cocoa and coffee for example, are either not produced at all or they are
produced in only small quantities in OECD countries. Accordingly, OECD trade
protection for those products tends naturally to be relatively insignificant also.
Meanwhile, other commodities produced in one or more of the study countries, rice and
cotton for example, are heavily supported or protected in the OECD. Undoubtedly, world
market prices for these are lower than they would be in the absence of trade protection
and support given OECD farmers.
A recent OECD study used a general equilibrium model in policy simulation analysis
aimed at estimating the economic and market effects for aggregated national, regional and
global markets of substantially reducing OECD‟s agricultural tariffs and subsidies
(OECD, 2007). The study estimated the potential impacts on farm incomes in a large
number of countries and regions that might be expected if all forms of agricultural trade
protection and subsidy in OECD countries were reduced. Although none of the study
countries is separately identified in that model, an indication of potential impacts on them
can be obtained from results for a regional aggregate representing all sub-Saharan
countries except South Africa. The results indicate that the prices of tradable agricultural
products and farm incomes in the region would increase by between 2 to 3% if OECD
governments were to eliminate all forms of farm trade protection and support.
Cotton, an important crop in Cameroon and the dominant export crop in Mali, is not
separately identified in OECD‟s producer support estimates. However, there is a general
consensus that cotton subsidies in OECD countries lead to increased supplies and
substantially lower-than-otherwise world market prices for cotton fibre. The potential
magnitude of such effects has been studied extensively in recent years with results that
differ somewhat between different studies depending on the time period being
considered, the assumptions made about key economic parameters and the production
incentives associated with different subsidy programmes.
24 – Effects of Agriculture Policies in OECD Countries
AGRICULTURAL PROGRESS IN CAMEROON, GHANA AND MALI: WHY IT HAPPENED AND HOW TO SUSTAIN IT
Alston, Sumner and Brunke (2007) discuss these complexities in some depth, review
findings obtained in many past studies and report estimates from their own analysis of the
effects of eliminating just those subsidies provided US cotton farmers. They estimate that
world market prices for cotton fibre would be between 6 and 14% higher if the United
States were to completely eliminate cotton subsidies. Estimated price impacts of the same
order of magnitude were found in a recent World Bank study that considered the effects
of eliminating both US and EU cotton subsidies (Anderson and Valenzuela, 2006). Using
these estimated price impacts, Mali farmers may lose upwards of USD 30 million per
year due to cotton subsidies given farmers in OECD countries (Annex 3 shows how this
estimate was made).
Economic benefits from preferential access are generally low
Many OECD countries provide market access to agricultural exports from Cameroon,
Ghana and Mali at tariff rates that are below the rates provided under the WTO‟s MFN
principle (Liapis, 2007). The potential negative consequences of OECD farm support for
world market prices and farm incomes in some countries can, in theory, be mitigated to
some degree by this preferential treatment. The economic value of preferential access
depends on the difference between the tariff applied to imports from the beneficiary
country and the rates applied to imports from countries not benefiting from preferential
access, the preference margin.
The great majority of Cameroon‟s agricultural exports enter the European Union, the
United States, Japan and Canada at zero tariffs. On an import-weighted average basis the
rate is less than 0.15% in all four markets. The preference margin for agricultural imports
from Cameroon into Canada, Japan or the United States is insignificantly small.
However, for the European Union - overwhelmingly the largest buyer of Cameroon‟s
exports, that difference is significant – averaging over 12% on an imported weighted
basis during 2001-03. The total economic benefits for Cameroon of preferential access for
its agricultural exports into the European Union have been estimated at approximately
USD 46 million (Liapis, 2007), which translates as just over 1% of agricultural sector
GDP. Cameroon ranks among the top 10 countries in terms of the economic value of their
preferential access to EU‟s agricultural markets.
For Ghana, agricultural trade with OECD countries is dominated by cocoa beans and
these enter tariff free, regardless of source, i.e. there are no preferential margins to be had.
Most of Ghana‟s exports of other agricultural products also enter OECD markets at zero
or very low tariffs. Neither the volumes nor the preferential margins are big enough to
provide a large monetary gain. For example, the import-weighted averages of the
preferential margin on Ghana‟s exports to the European Union and the United States in
2003 were less than 2%. The average annual value of preferential access for Ghana‟s
agricultural exports to the European Union, the United States, Japan and Canada during
2001-03 has been estimated at less than USD 9 million, a sum which translates at less
than 0.5% of agricultural sector GDP.
Mali‟s overwhelmingly most important export crop – cotton, enters most OECD
countries free of import duties regardless of source. Accordingly, the economic benefits
of Mali‟s preferential access are negligible – estimated at only around USD 85 000
annually for 2001-03.
Agricultural Performance – 25
AGRICULTURAL PROGRESS IN CAMEROON, GHANA AND MALI: WHY IT HAPPENED AND HOW TO SUSTAIN IT
Agricultural Performance
Real agricultural output has been growing, with food output in particular
growing faster than the population
What were the effects on agricultural sector performance of the policy reforms and
the ensuing transition from severe economic crisis to growth? Answering such question
satisfactorily would require analytical effort beyond the scope of the present study.
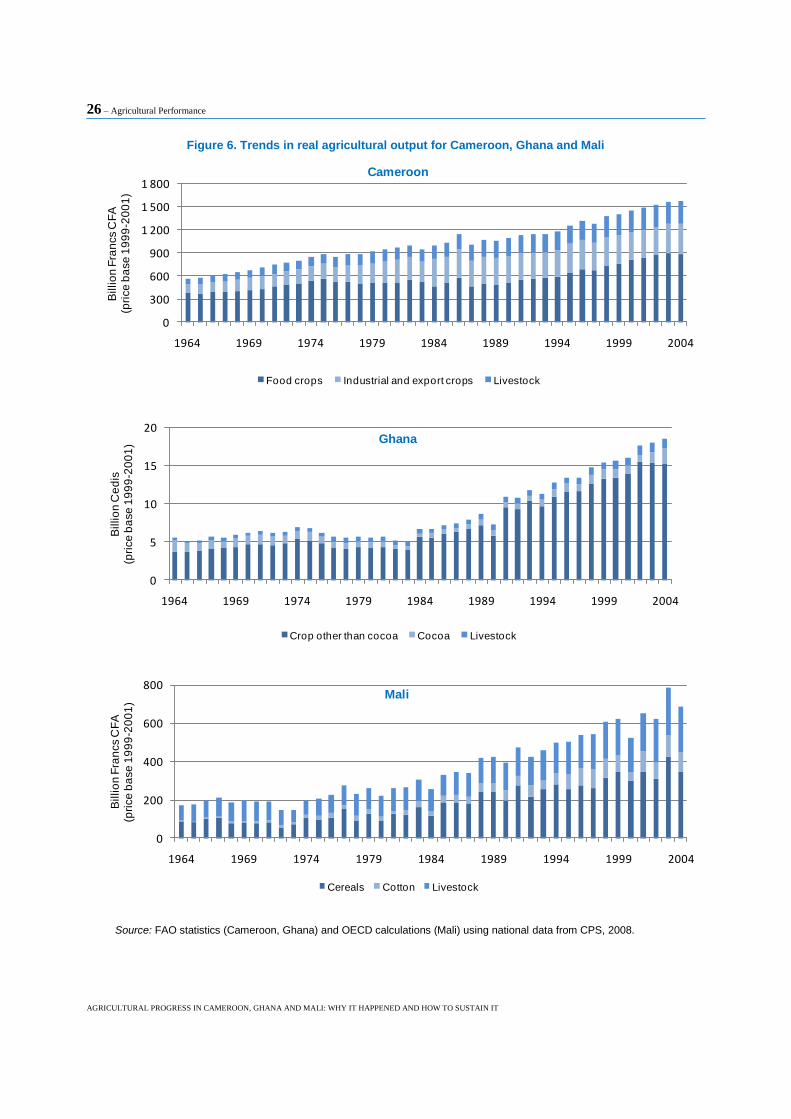
Nonetheless, simple trend analysis of available data provides some insights. Figure 6
shows volume trends in agricultural production for Cameroon, Ghana and Mali and the
breakdown amongst main agricultural products for 1964 to 2004.1 In each case there was
a significant acceleration in agricultural output growth in the years following economic
crisis in the three countries - from 1983 in Ghana and Mali and from 1994 in Cameroon.
The turnaround was especially pronounced in Ghana where during 1964 to 1983 the
annual average percent change in the total real value of agricultural production was
slightly negative but has since averaged nearly 6% per year. Meanwhile, the trend rate of
growth in total agricultural production doubled in both Mali and Cameroon following the
worst year of their respective economic crises. In none of the three countries was
domestic food production keeping up with growth in the population in the ten to
twenty years preceding the worst of their respective economic crises. However, in all
three, food output2 has been increasing significantly faster than population since the crisis
years: by 6% per year in Ghana and by 4% per year in both Mali and Cameroon.
The composition of agricultural output has also changed since the mid-1980s. In
Cameroon there has been a shift away from traditional export crops (coffee and cocoa for
example) towards staple crops. Increased production of staple crops there may have been
driven by growth in food demand and prices due both to increased regionalisation and
urbanisation of markets for food commodities. Meanwhile weak world prices, low yields
and unfavourable exchange rates (compared to competitors such as Ghana for cocoa and
Viet Nam for coffee) have contributed to the stagnation and some decline in Cameroon‟s
production of traditional export crops.
1. These data have been constructed by valuing annual production of each crop and livestock
component at the average of their respective prices during the three years 1999-2001. For
Cameroon and Ghana this aggregate was taken directly from the FAOSTAT database. For Mali
it was calculated from national data using the FAO‟s method.
2. Food output is defined here as follows: food crops and livestock in Cameroon; crops other than
cocoa and livestock in Ghana and cereals and livestock in Mali. With some exceptions (palm oil
and sugar for Cameroon) these products are mainly destined for food consumption within the
domestic market.
26 – Agricultural Performance
AGRICULTURAL PROGRESS IN CAMEROON, GHANA AND MALI: WHY IT HAPPENED AND HOW TO SUSTAIN IT
Figure 6. Trends in real agricultural output for Cameroon, Ghana and Mali
0
300
600
900
1 200
1 500
1 800
1964 1969 1974 1979 1984 1989 1994 1999 2004
Billio
n F
ran
cs C
FA
(pri
ce
ba
se
19
99
-20
01
)
Cameroon
Food crops Industrial and export crops Livestock
0
5
10
15
20
1964 1969 1974 1979 1984 1989 1994 1999 2004
Billio
n C
ed
is(p
rice
ba
se
19
99
-20
01
) Ghana
Crop other than cocoa Cocoa Livestock
0
200
400
600
800
1964 1969 1974 1979 1984 1989 1994 1999 2004
Billio
n F
ran
cs C
FA
(pri
ce
ba
se
19
99
-20
01
)
Mali
Cereals Cotton Livestock
Source: FAO statistics (Cameroon, Ghana) and OECD calculations (Mali) using national data from CPS, 2008.
Agricultural Performance – 27
AGRICULTURAL PROGRESS IN CAMEROON, GHANA AND MALI: WHY IT HAPPENED AND HOW TO SUSTAIN IT
By contrast, growth in production of traditional export crops in Ghana and Mali has
accelerated. Ghanaian cocoa production was declining in the years following
independence (-3.5% per year over the period 1961-83) but has recovered strongly since
1983 with both continuing area expansion and significant yield improvements. Malian
cotton is another success story. Policy reforms have led to a diminished role for the state
in cotton marketing and a higher producer share of cotton export receipts. The benefits of
these reforms have been enhanced by generally favourable world market prices and have
led to increases in Mali‟s cotton production that outpaced the quite strong growth in the
country‟s total agricultural output. And this occurred despite subsidized competition on
world cotton markets coming from OECD cotton producing countries.
Both area expansion and yield improvements have contributed to output growth
An influential report on African agriculture done recently for the United Nations
Secretary General warned of the implications for future food security of stagnant crop
yields and the concomitant expansions of arable land that have been required to meet the
food needs of fast growing populations. (InterAcademy Council, 2004) In the long run,
agricultural output growth based on using more and more of a country‟s fixed endowment
of land is unsustainable. In other parts of the world, declining availability of land suitable
for cultivation has been offset by yield improvements but this seems not to be happening
generally in Africa.
Of course, these concerns differ in degree depending on a country‟s land endowments
and whether technological progress favours land intensive or land extensive techniques.
In Mali, for example, although the share of arable in total agricultural land has been
growing, it is lower than in Ghana and lower still compared to Cameroon. Land extensive
technical progress could achieve increased production by enabling conversion of land
currently unsuitable for crops. Recall also, that it may not be possible to simultaneously
increase both the area under cultivation and the average yields as the marginal hectare of
land brought in to production would generally be less productive than land already in
production.
As the data in Figure 6 reveal, the composition of aggregate agricultural production
differs markedly among the three study countries. It is difficult to compare area and yield
trends using such highly aggregated data. It is common therefore to focus instead, as in
Figure 7, on the evolution of production and yield of cereals.3 Yield here refers to the
total real value of cereal production per hectare of land dedicated to cereal crops. Growth
over time in this variable can occur either because physical yields of the individual crops
making up that total (maize, millet, rice, etc.) are increasing or because the composition
of the aggregate increasingly favours higher priced crops. This latter effect made little
difference to yield results obtained for either Cameroon or Ghana. For Mali, however, the
strong production and yield growth for rice since the mid-1980s has driven the total real
value of cereal crop production upwards despite flat yield trends in lower priced millet,
sorghum and maize.
3. For all three countries, the cereal aggregate includes millet, sorghum, rice paddy and maize. It
additionally includes wheat in Cameroon, oats in Ghana, and wheat and fonio in Mali. Data for
this variable was calculated, as for the aggregates reported in Figure 6, by multiplying annual
production for each individual cereal crop times a three-year average price and then adding
across all of them.
28 – Agricultural Performance
AGRICULTURAL PROGRESS IN CAMEROON, GHANA AND MALI: WHY IT HAPPENED AND HOW TO SUSTAIN IT
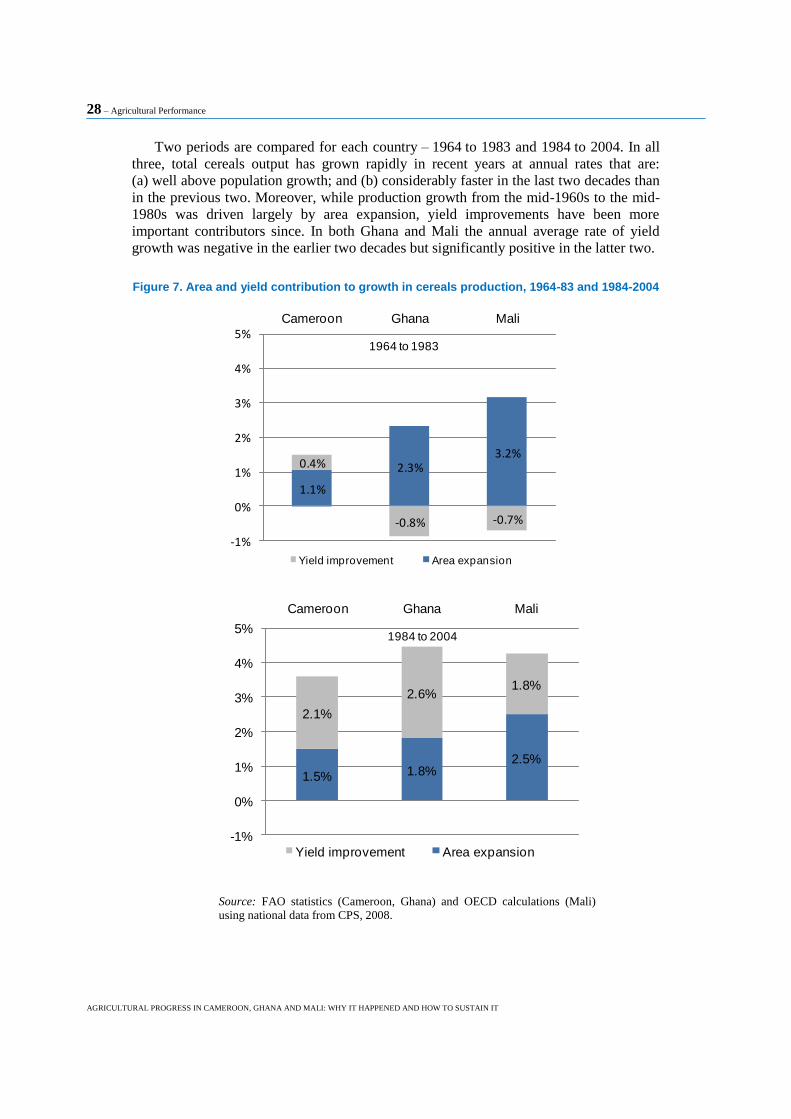
Two periods are compared for each country – 1964 to 1983 and 1984 to 2004. In all
three, total cereals output has grown rapidly in recent years at annual rates that are:
(a) well above population growth; and (b) considerably faster in the last two decades than
in the previous two. Moreover, while production growth from the mid-1960s to the mid-
1980s was driven largely by area expansion, yield improvements have been more
important contributors since. In both Ghana and Mali the annual average rate of yield
growth was negative in the earlier two decades but significantly positive in the latter two.
Figure 7. Area and yield contribution to growth in cereals production, 1964-83 and 1984-2004
1.1%
2.3%3.2%
0.4%
-0.8% -0.7%
-1%
0%
1%
2%
3%
4%
5%Cameroon Ghana Mali
1964 to 1983
Yield improvement Area expansion
1.5% 1.8%2.5%
2.1%
2.6%1.8%
-1%
0%
1%
2%
3%
4%
5%
Cameroon Ghana Mali
1984 to 2004
Yield improvement Area expansion
Source: FAO statistics (Cameroon, Ghana) and OECD calculations (Mali)
using national data from CPS, 2008.
Farm Incomes and Rural Poverty – 29
AGRICULTURAL PROGRESS IN CAMEROON, GHANA AND MALI: WHY IT HAPPENED AND HOW TO SUSTAIN IT
Farm Incomes and Rural Poverty
The turnarounds in agricultural and food production following their respective
economic crises were surely welcome developments for Cameroon, Ghana and Mali. But,
to what extent were those developments accompanied by progress in reducing poverty?
There are two questions one can pose when evaluating agricultural sector performance in
this context. Are the incomes of those who depend on farming or farm related
occupations rising? Are the prices consumers (including consumers who earn their living
in farm related occupations) pay for food and other products produced by the farm sector
declining? In the best case, the answer to both questions is yes. But, sometimes lower
prices for consumers can mean lower incomes for farmers and sometimes higher incomes
for farmers cannot be achieved except as consumers pay higher prices.
Agricultural GDP measures the returns to the primary factors: land, labour and
capital, used in agricultural production. Reflecting the assumption that these factors are
largely owned and supplied by farmers, agricultural GDP per agricultural worker is an
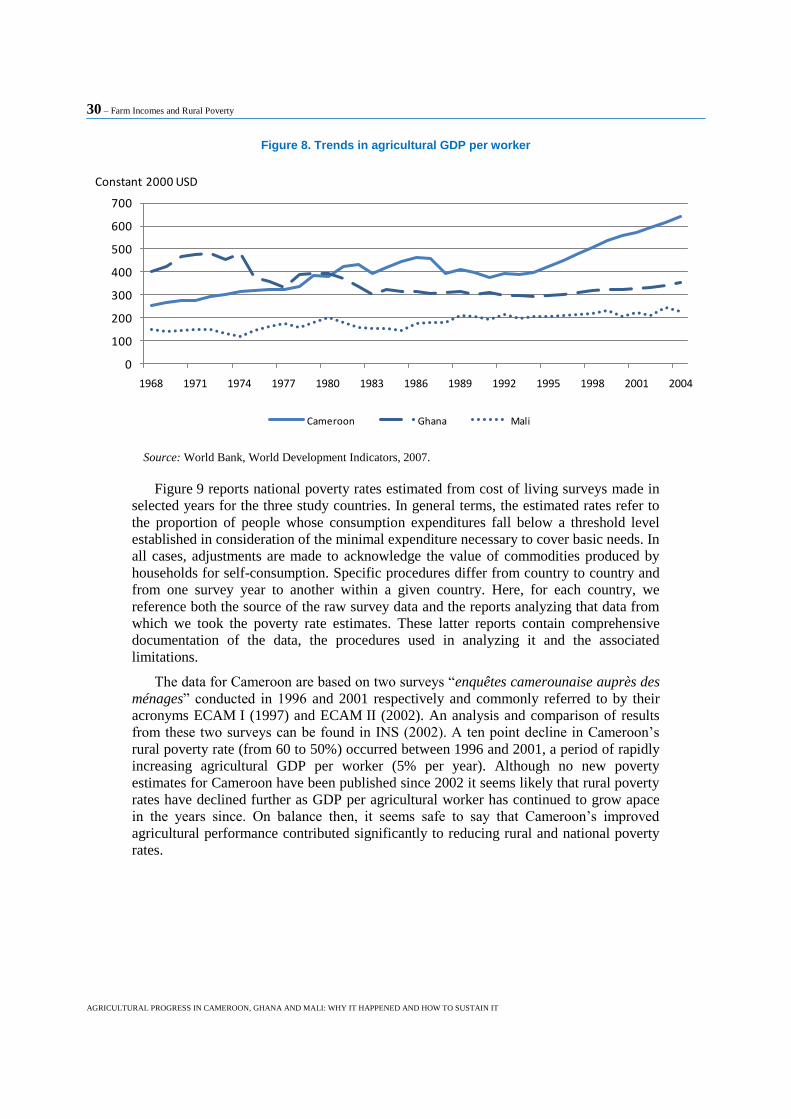
often used indicator of trends in farm incomes.1 Figure 8 plots the evolution of
agricultural GDP per worker in the three countries over the period 1967 to 2004. The
indicator suggests that per worker income has been growing somewhat in all three
countries, especially since the mid-1990s and more so in Cameroon than in either Ghana
or Mali. In general, however, because the number of agricultural workers has been
growing too, per worker GDP has not grown as fast as has total agricultural production or
sector-wide GDP in any of the three countries.
1. Measurement problems afflict the data for both agricultural GDP and the number of workers in
the sector, undermining confidence in the ratio of the two as an indicator of farm income. First,
not all primary factors used in agriculture are owned and supplied by farmers. Some farm land
and capital is owned by people who do not farm; some labour is supplied by people classified as
working in other sectors and some people classified as agricultural workers actually earn a
significant part of their income working in other sectors. Moreover, employment data is sparse.
For example, the World Bank‟s WDI database contains estimates of the percentage of Ghana‟s
work force employed in agriculture for only three years (61.1% in 1984, 62.2% in 1992 and
55.0% in 2000) only one such estimate for Cameroon (60.6% in 1990) and no information at all
for Mali
30 – Farm Incomes and Rural Poverty
AGRICULTURAL PROGRESS IN CAMEROON, GHANA AND MALI: WHY IT HAPPENED AND HOW TO SUSTAIN IT
Figure 8. Trends in agricultural GDP per worker
0
100
200
300
400
500
600
700
1968 1971 1974 1977 1980 1983 1986 1989 1992 1995 1998 2001 2004
Constant 2000 USD
Cameroon Ghana Mali
Source: World Bank, World Development Indicators, 2007.
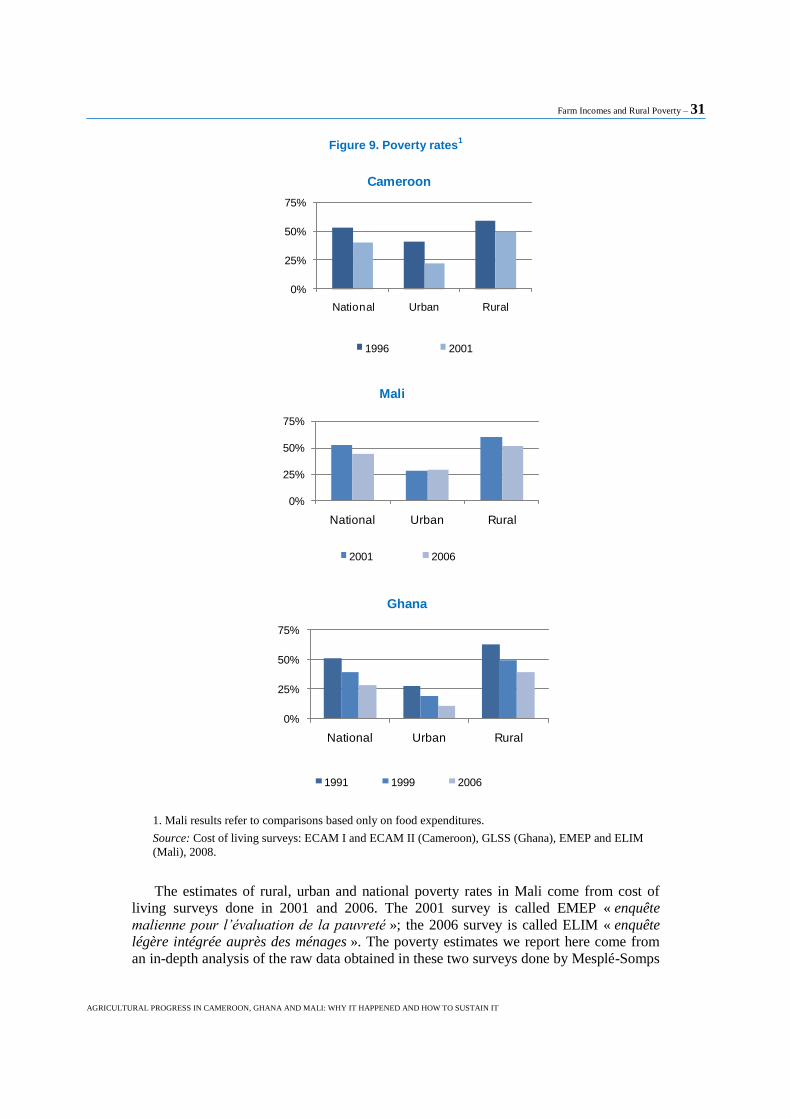
Figure 9 reports national poverty rates estimated from cost of living surveys made in
selected years for the three study countries. In general terms, the estimated rates refer to
the proportion of people whose consumption expenditures fall below a threshold level
established in consideration of the minimal expenditure necessary to cover basic needs. In
all cases, adjustments are made to acknowledge the value of commodities produced by
households for self-consumption. Specific procedures differ from country to country and
from one survey year to another within a given country. Here, for each country, we
reference both the source of the raw survey data and the reports analyzing that data from
which we took the poverty rate estimates. These latter reports contain comprehensive
documentation of the data, the procedures used in analyzing it and the associated
limitations.
The data for Cameroon are based on two surveys “enquêtes camerounaise auprès des
ménages” conducted in 1996 and 2001 respectively and commonly referred to by their
acronyms ECAM I (1997) and ECAM II (2002). An analysis and comparison of results
from these two surveys can be found in INS (2002). A ten point decline in Cameroon‟s
rural poverty rate (from 60 to 50%) occurred between 1996 and 2001, a period of rapidly
increasing agricultural GDP per worker (5% per year). Although no new poverty
estimates for Cameroon have been published since 2002 it seems likely that rural poverty
rates have declined further as GDP per agricultural worker has continued to grow apace
in the years since. On balance then, it seems safe to say that Cameroon‟s improved
agricultural performance contributed significantly to reducing rural and national poverty
rates.
Farm Incomes and Rural Poverty – 31
AGRICULTURAL PROGRESS IN CAMEROON, GHANA AND MALI: WHY IT HAPPENED AND HOW TO SUSTAIN IT
Figure 9. Poverty rates1
0%
25%
50%
75%
National Urban Rural
Cameroon
1996 2001
0%
25%
50%
75%
National Urban Rural
Mali
2001 2006
0%
25%
50%
75%
National Urban Rural
Ghana
1991 1999 2006
1. Mali results refer to comparisons based only on food expenditures.
Source: Cost of living surveys: ECAM I and ECAM II (Cameroon), GLSS (Ghana), EMEP and ELIM
(Mali), 2008.
The estimates of rural, urban and national poverty rates in Mali come from cost of
living surveys done in 2001 and 2006. The 2001 survey is called EMEP « enquête
malienne pour l’évaluation de la pauvreté »; the 2006 survey is called ELIM « enquête
légère intégrée auprès des ménages ». The poverty estimates we report here come from
an in-depth analysis of the raw data obtained in these two surveys done by Mesplé-Somps
32 – Farm Incomes and Rural Poverty
AGRICULTURAL PROGRESS IN CAMEROON, GHANA AND MALI: WHY IT HAPPENED AND HOW TO SUSTAIN IT
et al. (2008). Although both the EMEP and the ELIM surveys solicited information on
both food and non-food expenditures, Mesplé-Somps et al. used only the data measuring
food expenditures. They chose to focus just on food items because the method they use to
measure real consumption expenditures requires regional price information and none was
available for non-food items.
The estimated proportion of Mali‟s total population in poverty declined from 52.1 to
44.4% between 2001 and 2006, due entirely to a fall in the rural poverty rate – from
60.4 to 51.7%. Mali‟s urban poverty rate is estimated to have increased fractionally
between the two survey years (28.4 to 28.7%), perhaps reflecting the dampening effect on
urban wage rates of an ongoing and rapid rural to urban migration. Nationally, even
though Mali‟s population continued growing at around 3% per year from 2001 to 2006
the reduced incidence of poverty more than offset so that the absolute number of people
living in poverty also went down.
The role of improved agricultural performance in boosting farm incomes and
reducing rural poverty is less clear for Mali than seems the case for Cameroon. As
Figure 8 reveals growth in GDP per agricultural worker in Mali has been fairly flat
compared to that in Cameroon. However, over the period for which we have poverty
estimates growth in per worker GDP had accelerated somewhat, a development that
would have contributed to the improvement in the poverty rates. Another hypothesis is
that the improvement in rural poverty rates occurred, not because farm incomes were
growing, but because incomes of rural people from other sources were rising. For
example, in Mali as elsewhere in developing countries, earnings of agricultural workers
(mainly self-employed farmers) are significantly lower than those of workers in other
sectors. A large enough shift from farm to non-farm rural employment could significantly
increase the national average earnings of rural workers.
Poverty data plotted in Figure 9 for Ghana comes from three nationally representative
Ghana Living Standards Surveys (GLSS) conducted by the Ghana Statistical Service in
1991-92, 1998-99 and 2005-06. The discussion here is based on results obtained in a
World Bank analysis of the data reported in Coulombe and Wodon (2007). Nationally,
the poverty rate fell from 51.7% in 1991-92 to 39.5% in 1998-09, and then to 28.5% in
2005-06, probably the best record in poverty reduction seen in the whole of sub-Saharan
Africa over the last fifteen years. Ghana is on trend to achieve the Millennium
Development Goal of halving its poverty head count well ahead of the 2015 target date,
indeed possibly even by the end of 2008. Poverty in Ghana is almost exclusively a rural
phenomenon and within the rural population largely among those who depend on
agriculture for a living. Remarkably, the estimated incidence of urban poverty is now just
over 10%, less than one-third the estimated rate in 1991/92. Rural poverty rates are higher
(39% according to the 2005-06 survey) and have not dropped as fast. Still, the incidence
of rural poverty in Ghana is much less than in other countries in the region.
As for Mali, it is not entirely clear from the data graphed in Figure 8 what
contribution Ghana‟s improved agricultural performance made to progress in rural
poverty reduction. For Ghana though, there are some data available that help clarify the
picture. Figure 10 compares agricultural GDP per worker and earnings per agricultural
worker for 1991-92, 1998-99 and 2005-06. In theory, the former measures only that
income from agricultural activities while the latter includes earnings of people classified
as agricultural workers from both farm and non-farm sources. The data for agricultural
GDP per worker are two year averages based on national accounts; those for earnings are
survey estimates taken from Coulombe and Wodon (2006). Both indicators increased and
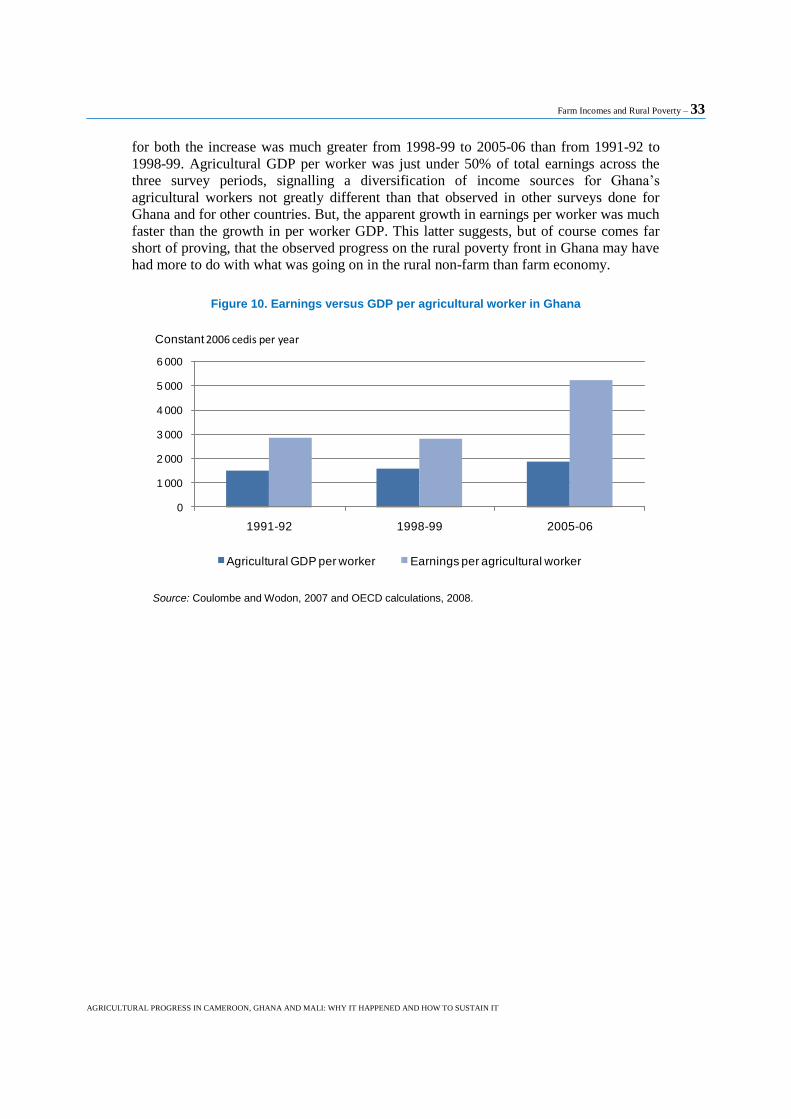
Farm Incomes and Rural Poverty – 33
AGRICULTURAL PROGRESS IN CAMEROON, GHANA AND MALI: WHY IT HAPPENED AND HOW TO SUSTAIN IT
for both the increase was much greater from 1998-99 to 2005-06 than from 1991-92 to
1998-99. Agricultural GDP per worker was just under 50% of total earnings across the
three survey periods, signalling a diversification of income sources for Ghana‟s
agricultural workers not greatly different than that observed in other surveys done for
Ghana and for other countries. But, the apparent growth in earnings per worker was much
faster than the growth in per worker GDP. This latter suggests, but of course comes far
short of proving, that the observed progress on the rural poverty front in Ghana may have
had more to do with what was going on in the rural non-farm than farm economy.
Figure 10. Earnings versus GDP per agricultural worker in Ghana
0
1 000
2 000
3 000
4 000
5 000
6 000
1991-92 1998-99 2005-06
Agricultural GDP per worker Earnings per agricultural worker
Constant 2006 cedis per year
Source: Coulombe and Wodon, 2007 and OECD calculations, 2008.
34 – Implications and Limitations
AGRICULTURAL PROGRESS IN CAMEROON, GHANA AND MALI: WHY IT HAPPENED AND HOW TO SUSTAIN IT
Implications and Limitations
The macroeconomic and agricultural policy achievements in the study countries
during the past ten to twenty years have yielded reduced and more stable rates of
inflation, exchange rates that better reflect market realities, significant diminution of
export taxes and greatly enhanced role for the market in determining agricultural prices.
These reforms sharply reduced the anti-agricultural biases that existed before. They seem
to have paid off so that where there are vestiges of those former biases, as is the case for
cotton in Mali and, though less so, for cocoa in Ghana, they should be eliminated. Import
tariffs have been harmonised and the system is more transparent than before but for the
covered commodities, the rates seem rather high for Ghana and Cameroon (15 to 20%)
much less in Mali (5%). Reducing such tariffs could: (1) further improve competitiveness
of agricultural export commodities that compete for the same resources as used to
produce protected imports; (2) enhance the efficiency of economy-wide resource
allocation; and (3) reduce the food bill for consumers.
Reducing OECD agricultural trade protection and subsidies could also help farm
incomes in the study countries. However, apart from the major exception of cotton
subsidies, estimated gains are modest. Recent increases in the actual and promised levels
of agricultural development assistance provide opportunities to correct for perceived
under-investment in provision of public goods for the sector and to correct for private
market failures. The challenge will be to ensure that funds are not diverted to provision of
goods and services that could better be provided by the private sector. Relatively small
shares of agricultural aid are currently used to fund provision of agricultural research,
extension and infrastructure – public expenditures known to yield high social returns.
A related challenge, evident when looking at the process for planning and
implementation of agricultural programmes and projects in the three study countries, is
how to better allocate, monitor and measure the impact of aid flows. In none of the three
case study countries does it appear that applied benefit-cost analysis plays an important
role in policy planning, monitoring or evaluation. Yet, the needs for such analysis are
growing as the responsibility for decisions about how aid monies are to be used, is
increasingly devolved from donors to recipients. Without the capacity to subject
alternative policy prescriptions to rigorous cost/benefit analysis there is a risk that large
sums of money could be wasted. Meeting those needs will be difficult within the
constraints of existing statistical support systems and analytical capacity in these
countries.
Support to agricultural production (as opposed to productivity) has featured
prominently in past allocations of agricultural aid in all three study countries. For Ghana,
Cameroon and Mali (though perhaps less so), the benefit of such a policy focus is not
evident from available data. Agricultural production to meet domestic food needs is more
than keeping pace and export crop production is generally booming, but this seems to
have more to do with macroeconomic and sectoral policy reform than with production
Implications and Limitations – 35
AGRICULTURAL PROGRESS IN CAMEROON, GHANA AND MALI: WHY IT HAPPENED AND HOW TO SUSTAIN IT
related subsidies. Such strong growth in real agricultural output did not spur equally rapid
improvements in farm incomes or poverty in either Ghana or Mali (but did so in
Cameroon). It seems clear that improvements in agricultural performance alone are not
sufficient to achieve desired progress in poverty reduction. While agriculture undoubtedly
has a role to play, public investments in improving productive capacity (for example,
extension and advisory services, research and technology development, and
infrastructure) appear to offer greater potential benefits than support for prices and inputs.
Some of the indicators studied here (declining shares of agricultural GDP and
employment, wide income gaps between farm and non-farm populations) are
characteristic of economies undergoing development. That process typically leads to
sharp declines in number of farmers and in the share of their income coming from farm
sources. The policy needs for the future may thus be more related to fostering income
diversification and smooth transitions from farm to non-farm work – in both rural and
urban settings. These needs, e.g. programmes of training and education or transitional
financial assistance, may be better addressed in the framework of rural development or
economic growth and adjustment policy more generally.
Of course, in attempting to infer policy conclusions from these case studies it is not
possible to set aside concerns about the robustness of the data and methods used.
Conclusions drawn here were based on descriptive analysis of trends in a limited number
of indicators of policy and performance. Moreover, for some of those indicators, such as
poverty, only a very few comparable observations are available and then only for recent
years. Valid data measuring prices, input use and incomes of farmers and farm
households is practically non-existent. These limitations translate directly as limitations to
the quality, depth and scope of applied economic analysis that would be necessary to
validate policy conclusions, including those tentatively drawn from the present study.
Many other issues deserve more attention than could be given them in this report.
Among potential constraints to further agriculture and rural development in the study
countries, four deserve much deeper analysis:
Access to off-farm work and other opportunities to diversify income sources.
Market failures that inhibit price transmission along the farm to market chain or that
make the costs of transportation, credit and modern inputs higher than they should
be.
Economic and market effects of agricultural and trade policies both in the study
countries and in those countries that are, or could be, important trading partners.
Security of land tenure and the efficiency of land markets.

Annex 1. Estimated Market Price Support Rates for Individual Commodities – 37
AGRICULTURAL PROGRESS IN CAMEROON, GHANA AND MALI: WHY IT HAPPENED AND HOW TO SUSTAIN IT
Annex 1
Estimated Market Price Support Rates
for Individual Commodities

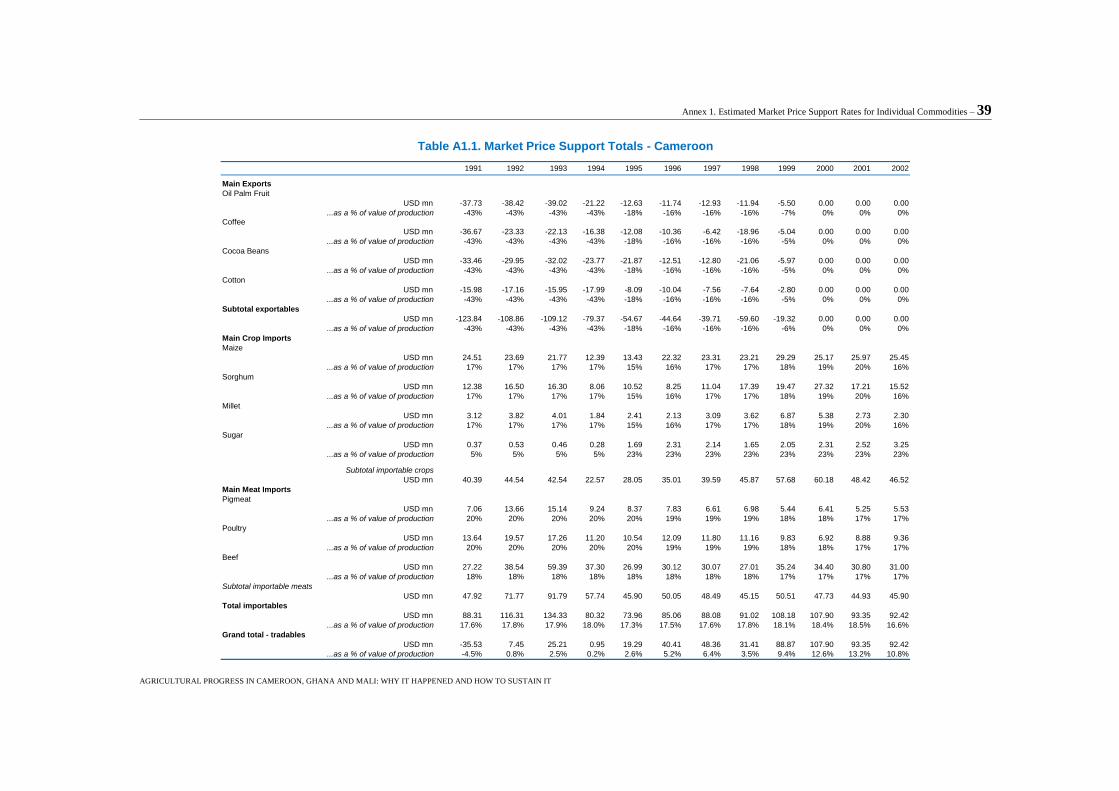
Annex 1. Estimated Market Price Support Rates for Individual Commodities – 39
AGRICULTURAL PROGRESS IN CAMEROON, GHANA AND MALI: WHY IT HAPPENED AND HOW TO SUSTAIN IT
Table A1.1. Market Price Support Totals - Cameroon
1991 1992 1993 1994 1995 1996 1997 1998 1999 2000 2001 2002
Main Exports
Oil Palm Fruit
USD mn -37.73 -38.42 -39.02 -21.22 -12.63 -11.74 -12.93 -11.94 -5.50 0.00 0.00 0.00
...as a % of value of production -43% -43% -43% -43% -18% -16% -16% -16% -7% 0% 0% 0%Coffee
USD mn -36.67 -23.33 -22.13 -16.38 -12.08 -10.36 -6.42 -18.96 -5.04 0.00 0.00 0.00
...as a % of value of production -43% -43% -43% -43% -18% -16% -16% -16% -5% 0% 0% 0%
Cocoa Beans
USD mn -33.46 -29.95 -32.02 -23.77 -21.87 -12.51 -12.80 -21.06 -5.97 0.00 0.00 0.00
...as a % of value of production -43% -43% -43% -43% -18% -16% -16% -16% -5% 0% 0% 0%
Cotton
USD mn -15.98 -17.16 -15.95 -17.99 -8.09 -10.04 -7.56 -7.64 -2.80 0.00 0.00 0.00
...as a % of value of production -43% -43% -43% -43% -18% -16% -16% -16% -5% 0% 0% 0%
Subtotal exportables
USD mn -123.84 -108.86 -109.12 -79.37 -54.67 -44.64 -39.71 -59.60 -19.32 0.00 0.00 0.00
...as a % of value of production -43% -43% -43% -43% -18% -16% -16% -16% -6% 0% 0% 0%
Main Crop Imports
Maize
USD mn 24.51 23.69 21.77 12.39 13.43 22.32 23.31 23.21 29.29 25.17 25.97 25.45
...as a % of value of production 17% 17% 17% 17% 15% 16% 17% 17% 18% 19% 20% 16%
Sorghum
USD mn 12.38 16.50 16.30 8.06 10.52 8.25 11.04 17.39 19.47 27.32 17.21 15.52
...as a % of value of production 17% 17% 17% 17% 15% 16% 17% 17% 18% 19% 20% 16%
Millet
USD mn 3.12 3.82 4.01 1.84 2.41 2.13 3.09 3.62 6.87 5.38 2.73 2.30
...as a % of value of production 17% 17% 17% 17% 15% 16% 17% 17% 18% 19% 20% 16%
Sugar
USD mn 0.37 0.53 0.46 0.28 1.69 2.31 2.14 1.65 2.05 2.31 2.52 3.25
...as a % of value of production 5% 5% 5% 5% 23% 23% 23% 23% 23% 23% 23% 23%
Subtotal importable crops
USD mn 40.39 44.54 42.54 22.57 28.05 35.01 39.59 45.87 57.68 60.18 48.42 46.52
Main Meat Imports
Pigmeat
USD mn 7.06 13.66 15.14 9.24 8.37 7.83 6.61 6.98 5.44 6.41 5.25 5.53
...as a % of value of production 20% 20% 20% 20% 20% 19% 19% 19% 18% 18% 17% 17%
Poultry
USD mn 13.64 19.57 17.26 11.20 10.54 12.09 11.80 11.16 9.83 6.92 8.88 9.36
...as a % of value of production 20% 20% 20% 20% 20% 19% 19% 19% 18% 18% 17% 17%
Beef
USD mn 27.22 38.54 59.39 37.30 26.99 30.12 30.07 27.01 35.24 34.40 30.80 31.00
...as a % of value of production 18% 18% 18% 18% 18% 18% 18% 18% 17% 17% 17% 17%
Subtotal importable meats
USD mn 47.92 71.77 91.79 57.74 45.90 50.05 48.49 45.15 50.51 47.73 44.93 45.90
Total importables
USD mn 88.31 116.31 134.33 80.32 73.96 85.06 88.08 91.02 108.18 107.90 93.35 92.42
...as a % of value of production 17.6% 17.8% 17.9% 18.0% 17.3% 17.5% 17.6% 17.8% 18.1% 18.4% 18.5% 16.6%
Grand total - tradables
USD mn -35.53 7.45 25.21 0.95 19.29 40.41 48.36 31.41 88.87 107.90 93.35 92.42
...as a % of value of production -4.5% 0.8% 2.5% 0.2% 2.6% 5.2% 6.4% 3.5% 9.4% 12.6% 13.2% 10.8%
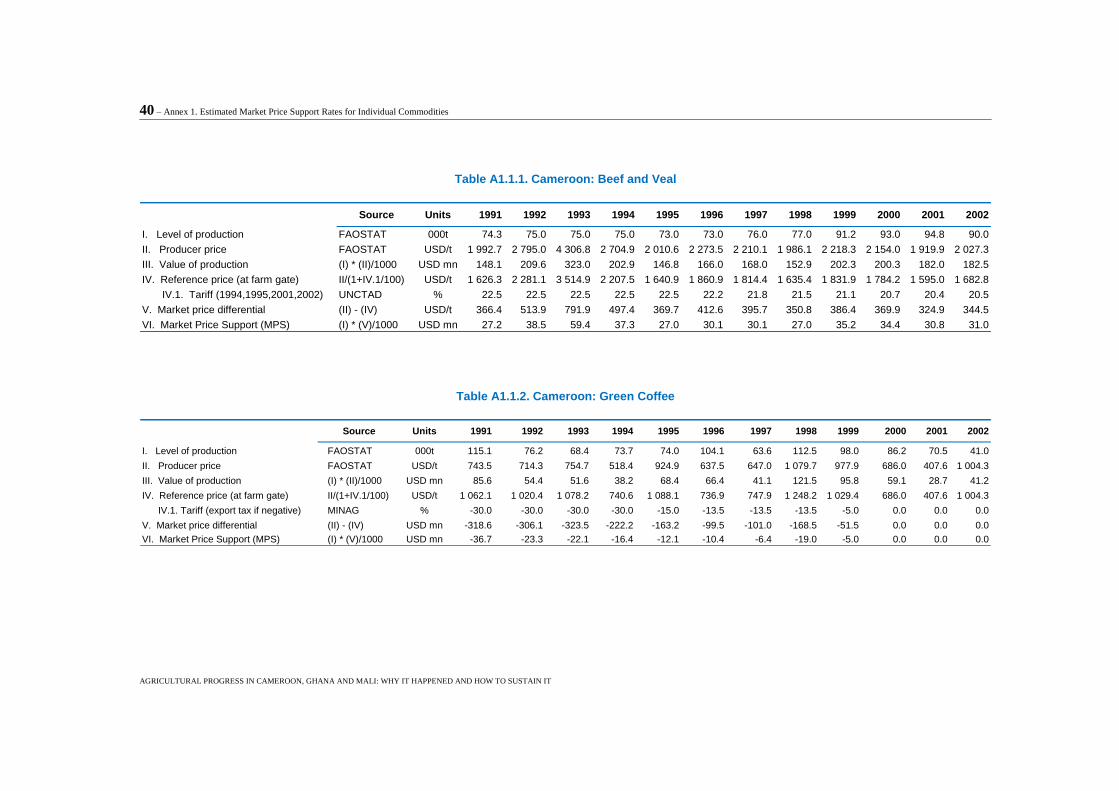
40 – Annex 1. Estimated Market Price Support Rates for Individual Commodities
AGRICULTURAL PROGRESS IN CAMEROON, GHANA AND MALI: WHY IT HAPPENED AND HOW TO SUSTAIN IT
Table A1.1.1. Cameroon: Beef and Veal
Source Units 1991 1992 1993 1994 1995 1996 1997 1998 1999 2000 2001 2002
I. Level of production FAOSTAT 000t 74.3 75.0 75.0 75.0 73.0 73.0 76.0 77.0 91.2 93.0 94.8 90.0
II. Producer price FAOSTAT USD/t 1 992.7 2 795.0 4 306.8 2 704.9 2 010.6 2 273.5 2 210.1 1 986.1 2 218.3 2 154.0 1 919.9 2 027.3
III. Value of production (I) * (II)/1000 USD mn 148.1 209.6 323.0 202.9 146.8 166.0 168.0 152.9 202.3 200.3 182.0 182.5
IV. Reference price (at farm gate) II/(1+IV.1/100) USD/t 1 626.3 2 281.1 3 514.9 2 207.5 1 640.9 1 860.9 1 814.4 1 635.4 1 831.9 1 784.2 1 595.0 1 682.8
IV.1. Tariff (1994,1995,2001,2002) UNCTAD % 22.5 22.5 22.5 22.5 22.5 22.2 21.8 21.5 21.1 20.7 20.4 20.5
V. Market price differential (II) - (IV) USD/t 366.4 513.9 791.9 497.4 369.7 412.6 395.7 350.8 386.4 369.9 324.9 344.5
VI. Market Price Support (MPS) (I) * (V)/1000 USD mn 27.2 38.5 59.4 37.3 27.0 30.1 30.1 27.0 35.2 34.4 30.8 31.0
Table A1.1.2. Cameroon: Green Coffee
Source Units 1991 1992 1993 1994 1995 1996 1997 1998 1999 2000 2001 2002
I. Level of production FAOSTAT 000t 115.1 76.2 68.4 73.7 74.0 104.1 63.6 112.5 98.0 86.2 70.5 41.0
II. Producer price FAOSTAT USD/t 743.5 714.3 754.7 518.4 924.9 637.5 647.0 1 079.7 977.9 686.0 407.6 1 004.3
III. Value of production (I) * (II)/1000 USD mn 85.6 54.4 51.6 38.2 68.4 66.4 41.1 121.5 95.8 59.1 28.7 41.2
IV. Reference price (at farm gate) II/(1+IV.1/100) USD/t 1 062.1 1 020.4 1 078.2 740.6 1 088.1 736.9 747.9 1 248.2 1 029.4 686.0 407.6 1 004.3
IV.1. Tariff (export tax if negative) MINAG % -30.0 -30.0 -30.0 -30.0 -15.0 -13.5 -13.5 -13.5 -5.0 0.0 0.0 0.0
V. Market price differential (II) - (IV) USD mn -318.6 -306.1 -323.5 -222.2 -163.2 -99.5 -101.0 -168.5 -51.5 0.0 0.0 0.0
VI. Market Price Support (MPS) (I) * (V)/1000 USD mn -36.7 -23.3 -22.1 -16.4 -12.1 -10.4 -6.4 -19.0 -5.0 0.0 0.0 0.0
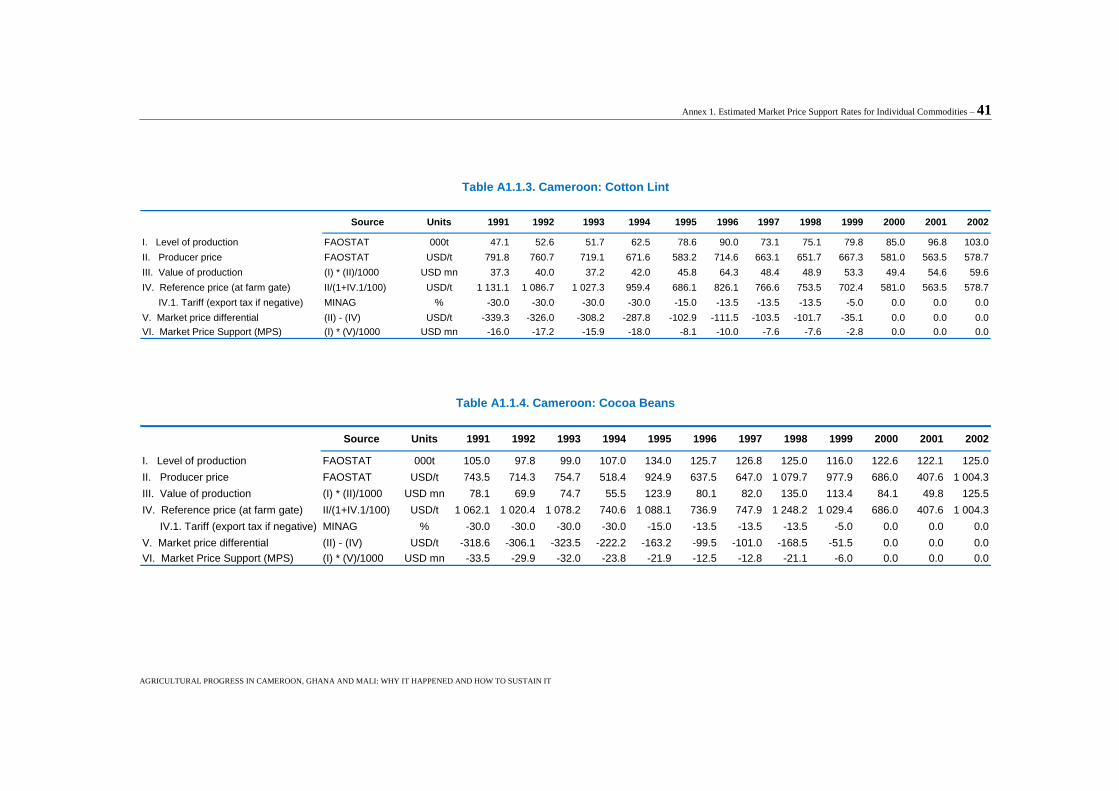
Annex 1. Estimated Market Price Support Rates for Individual Commodities – 41
AGRICULTURAL PROGRESS IN CAMEROON, GHANA AND MALI: WHY IT HAPPENED AND HOW TO SUSTAIN IT
Table A1.1.3. Cameroon: Cotton Lint
Source Units 1991 1992 1993 1994 1995 1996 1997 1998 1999 2000 2001 2002
I. Level of production FAOSTAT 000t 47.1 52.6 51.7 62.5 78.6 90.0 73.1 75.1 79.8 85.0 96.8 103.0
II. Producer price FAOSTAT USD/t 791.8 760.7 719.1 671.6 583.2 714.6 663.1 651.7 667.3 581.0 563.5 578.7
III. Value of production (I) * (II)/1000 USD mn 37.3 40.0 37.2 42.0 45.8 64.3 48.4 48.9 53.3 49.4 54.6 59.6
IV. Reference price (at farm gate) II/(1+IV.1/100) USD/t 1 131.1 1 086.7 1 027.3 959.4 686.1 826.1 766.6 753.5 702.4 581.0 563.5 578.7
IV.1. Tariff (export tax if negative) MINAG % -30.0 -30.0 -30.0 -30.0 -15.0 -13.5 -13.5 -13.5 -5.0 0.0 0.0 0.0
V. Market price differential (II) - (IV) USD/t -339.3 -326.0 -308.2 -287.8 -102.9 -111.5 -103.5 -101.7 -35.1 0.0 0.0 0.0
VI. Market Price Support (MPS) (I) * (V)/1000 USD mn -16.0 -17.2 -15.9 -18.0 -8.1 -10.0 -7.6 -7.6 -2.8 0.0 0.0 0.0
Table A1.1.4. Cameroon: Cocoa Beans
Source Units 1991 1992 1993 1994 1995 1996 1997 1998 1999 2000 2001 2002
I. Level of production FAOSTAT 000t 105.0 97.8 99.0 107.0 134.0 125.7 126.8 125.0 116.0 122.6 122.1 125.0
II. Producer price FAOSTAT USD/t 743.5 714.3 754.7 518.4 924.9 637.5 647.0 1 079.7 977.9 686.0 407.6 1 004.3
III. Value of production (I) * (II)/1000 USD mn 78.1 69.9 74.7 55.5 123.9 80.1 82.0 135.0 113.4 84.1 49.8 125.5
IV. Reference price (at farm gate) II/(1+IV.1/100) USD/t 1 062.1 1 020.4 1 078.2 740.6 1 088.1 736.9 747.9 1 248.2 1 029.4 686.0 407.6 1 004.3
IV.1. Tariff (export tax if negative) MINAG % -30.0 -30.0 -30.0 -30.0 -15.0 -13.5 -13.5 -13.5 -5.0 0.0 0.0 0.0
V. Market price differential (II) - (IV) USD/t -318.6 -306.1 -323.5 -222.2 -163.2 -99.5 -101.0 -168.5 -51.5 0.0 0.0 0.0
VI. Market Price Support (MPS) (I) * (V)/1000 USD mn -33.5 -29.9 -32.0 -23.8 -21.9 -12.5 -12.8 -21.1 -6.0 0.0 0.0 0.0
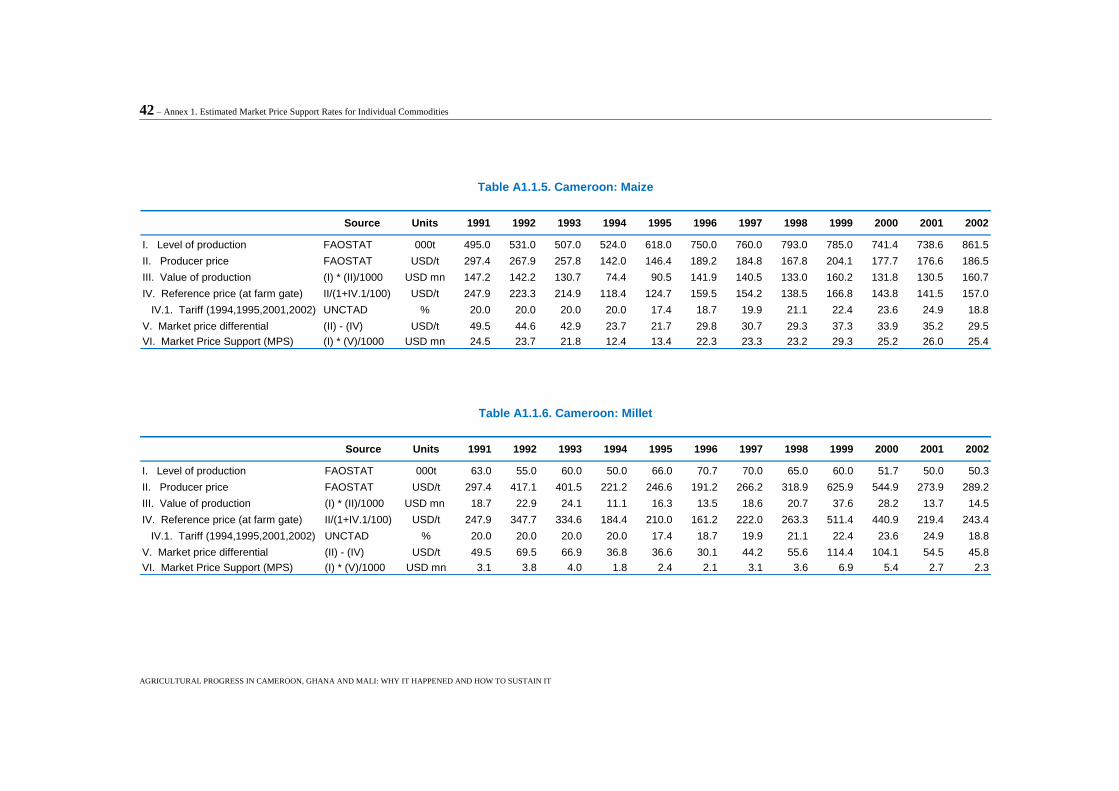
42 – Annex 1. Estimated Market Price Support Rates for Individual Commodities
AGRICULTURAL PROGRESS IN CAMEROON, GHANA AND MALI: WHY IT HAPPENED AND HOW TO SUSTAIN IT
Table A1.1.5. Cameroon: Maize
Source Units 1991 1992 1993 1994 1995 1996 1997 1998 1999 2000 2001 2002
I. Level of production FAOSTAT 000t 495.0 531.0 507.0 524.0 618.0 750.0 760.0 793.0 785.0 741.4 738.6 861.5
II. Producer price FAOSTAT USD/t 297.4 267.9 257.8 142.0 146.4 189.2 184.8 167.8 204.1 177.7 176.6 186.5
III. Value of production (I) * (II)/1000 USD mn 147.2 142.2 130.7 74.4 90.5 141.9 140.5 133.0 160.2 131.8 130.5 160.7
IV. Reference price (at farm gate) II/(1+IV.1/100) USD/t 247.9 223.3 214.9 118.4 124.7 159.5 154.2 138.5 166.8 143.8 141.5 157.0
IV.1. Tariff (1994,1995,2001,2002) UNCTAD % 20.0 20.0 20.0 20.0 17.4 18.7 19.9 21.1 22.4 23.6 24.9 18.8
V. Market price differential (II) - (IV) USD/t 49.5 44.6 42.9 23.7 21.7 29.8 30.7 29.3 37.3 33.9 35.2 29.5
VI. Market Price Support (MPS) (I) * (V)/1000 USD mn 24.5 23.7 21.8 12.4 13.4 22.3 23.3 23.2 29.3 25.2 26.0 25.4
Table A1.1.6. Cameroon: Millet
Source Units 1991 1992 1993 1994 1995 1996 1997 1998 1999 2000 2001 2002
I. Level of production FAOSTAT 000t 63.0 55.0 60.0 50.0 66.0 70.7 70.0 65.0 60.0 51.7 50.0 50.3
II. Producer price FAOSTAT USD/t 297.4 417.1 401.5 221.2 246.6 191.2 266.2 318.9 625.9 544.9 273.9 289.2
III. Value of production (I) * (II)/1000 USD mn 18.7 22.9 24.1 11.1 16.3 13.5 18.6 20.7 37.6 28.2 13.7 14.5
IV. Reference price (at farm gate) II/(1+IV.1/100) USD/t 247.9 347.7 334.6 184.4 210.0 161.2 222.0 263.3 511.4 440.9 219.4 243.4
IV.1. Tariff (1994,1995,2001,2002) UNCTAD % 20.0 20.0 20.0 20.0 17.4 18.7 19.9 21.1 22.4 23.6 24.9 18.8
V. Market price differential (II) - (IV) USD/t 49.5 69.5 66.9 36.8 36.6 30.1 44.2 55.6 114.4 104.1 54.5 45.8
VI. Market Price Support (MPS) (I) * (V)/1000 USD mn 3.1 3.8 4.0 1.8 2.4 2.1 3.1 3.6 6.9 5.4 2.7 2.3
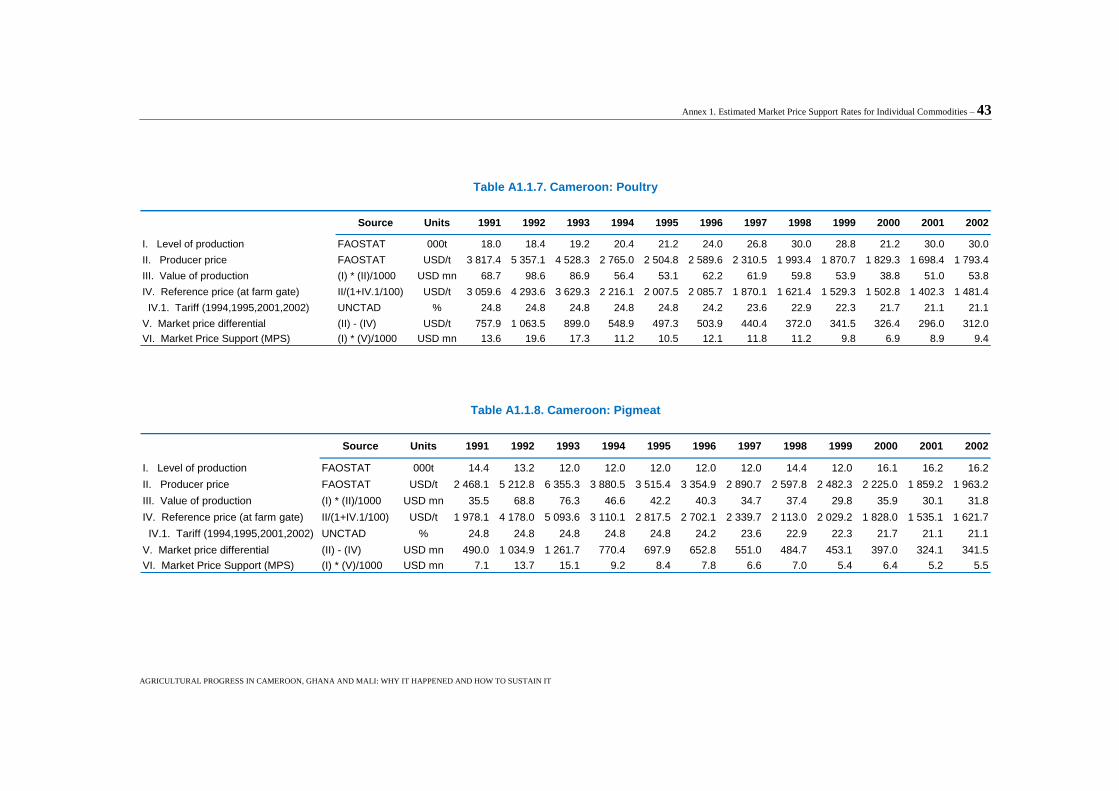
Annex 1. Estimated Market Price Support Rates for Individual Commodities – 43
AGRICULTURAL PROGRESS IN CAMEROON, GHANA AND MALI: WHY IT HAPPENED AND HOW TO SUSTAIN IT
Table A1.1.7. Cameroon: Poultry
Source Units 1991 1992 1993 1994 1995 1996 1997 1998 1999 2000 2001 2002
I. Level of production FAOSTAT 000t 18.0 18.4 19.2 20.4 21.2 24.0 26.8 30.0 28.8 21.2 30.0 30.0
II. Producer price FAOSTAT USD/t 3 817.4 5 357.1 4 528.3 2 765.0 2 504.8 2 589.6 2 310.5 1 993.4 1 870.7 1 829.3 1 698.4 1 793.4
III. Value of production (I) * (II)/1000 USD mn 68.7 98.6 86.9 56.4 53.1 62.2 61.9 59.8 53.9 38.8 51.0 53.8
IV. Reference price (at farm gate) II/(1+IV.1/100) USD/t 3 059.6 4 293.6 3 629.3 2 216.1 2 007.5 2 085.7 1 870.1 1 621.4 1 529.3 1 502.8 1 402.3 1 481.4
IV.1. Tariff (1994,1995,2001,2002) UNCTAD % 24.8 24.8 24.8 24.8 24.8 24.2 23.6 22.9 22.3 21.7 21.1 21.1
V. Market price differential (II) - (IV) USD/t 757.9 1 063.5 899.0 548.9 497.3 503.9 440.4 372.0 341.5 326.4 296.0 312.0
VI. Market Price Support (MPS) (I) * (V)/1000 USD mn 13.6 19.6 17.3 11.2 10.5 12.1 11.8 11.2 9.8 6.9 8.9 9.4
Table A1.1.8. Cameroon: Pigmeat
Source Units 1991 1992 1993 1994 1995 1996 1997 1998 1999 2000 2001 2002
I. Level of production FAOSTAT 000t 14.4 13.2 12.0 12.0 12.0 12.0 12.0 14.4 12.0 16.1 16.2 16.2
II. Producer price FAOSTAT USD/t 2 468.1 5 212.8 6 355.3 3 880.5 3 515.4 3 354.9 2 890.7 2 597.8 2 482.3 2 225.0 1 859.2 1 963.2
III. Value of production (I) * (II)/1000 USD mn 35.5 68.8 76.3 46.6 42.2 40.3 34.7 37.4 29.8 35.9 30.1 31.8
IV. Reference price (at farm gate) II/(1+IV.1/100) USD/t 1 978.1 4 178.0 5 093.6 3 110.1 2 817.5 2 702.1 2 339.7 2 113.0 2 029.2 1 828.0 1 535.1 1 621.7
IV.1. Tariff (1994,1995,2001,2002) UNCTAD % 24.8 24.8 24.8 24.8 24.8 24.2 23.6 22.9 22.3 21.7 21.1 21.1
V. Market price differential (II) - (IV) USD mn 490.0 1 034.9 1 261.7 770.4 697.9 652.8 551.0 484.7 453.1 397.0 324.1 341.5
VI. Market Price Support (MPS) (I) * (V)/1000 USD mn 7.1 13.7 15.1 9.2 8.4 7.8 6.6 7.0 5.4 6.4 5.2 5.5
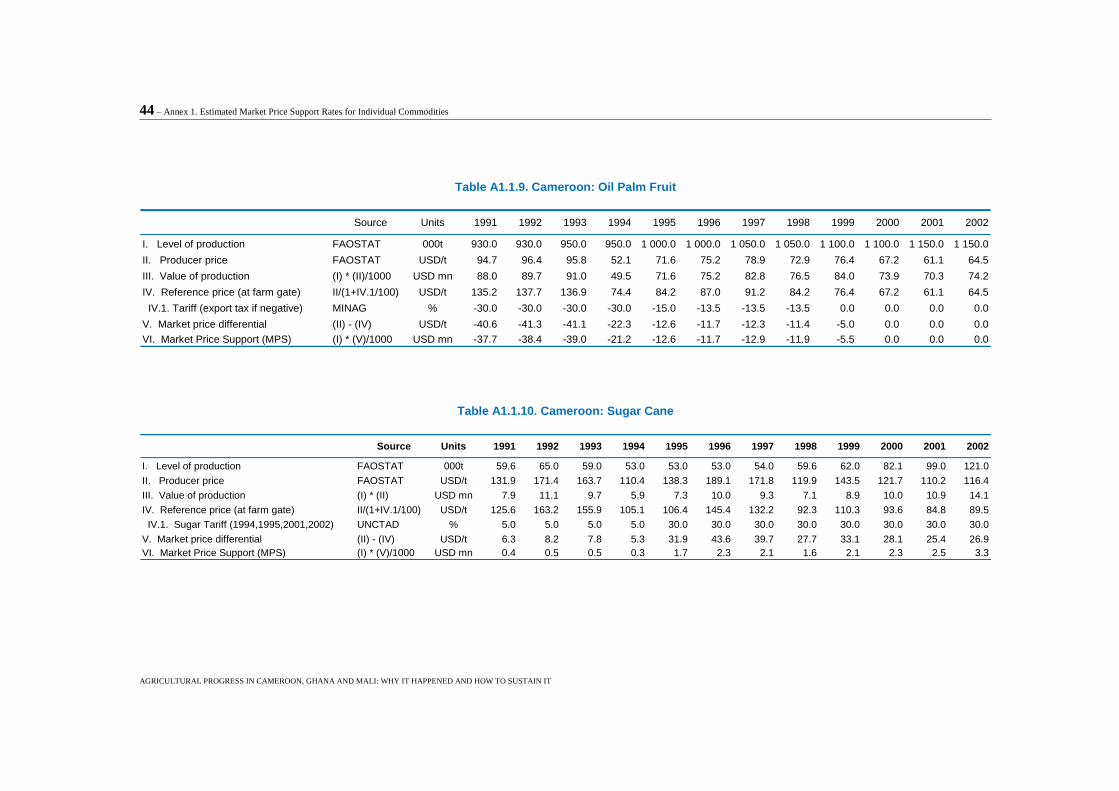
44 – Annex 1. Estimated Market Price Support Rates for Individual Commodities
AGRICULTURAL PROGRESS IN CAMEROON, GHANA AND MALI: WHY IT HAPPENED AND HOW TO SUSTAIN IT
Table A1.1.9. Cameroon: Oil Palm Fruit
Source Units 1991 1992 1993 1994 1995 1996 1997 1998 1999 2000 2001 2002
I. Level of production FAOSTAT 000t 930.0 930.0 950.0 950.0 1 000.0 1 000.0 1 050.0 1 050.0 1 100.0 1 100.0 1 150.0 1 150.0
II. Producer price FAOSTAT USD/t 94.7 96.4 95.8 52.1 71.6 75.2 78.9 72.9 76.4 67.2 61.1 64.5
III. Value of production (I) * (II)/1000 USD mn 88.0 89.7 91.0 49.5 71.6 75.2 82.8 76.5 84.0 73.9 70.3 74.2
IV. Reference price (at farm gate) II/(1+IV.1/100) USD/t 135.2 137.7 136.9 74.4 84.2 87.0 91.2 84.2 76.4 67.2 61.1 64.5
IV.1. Tariff (export tax if negative) MINAG % -30.0 -30.0 -30.0 -30.0 -15.0 -13.5 -13.5 -13.5 0.0 0.0 0.0 0.0
V. Market price differential (II) - (IV) USD/t -40.6 -41.3 -41.1 -22.3 -12.6 -11.7 -12.3 -11.4 -5.0 0.0 0.0 0.0
VI. Market Price Support (MPS) (I) * (V)/1000 USD mn -37.7 -38.4 -39.0 -21.2 -12.6 -11.7 -12.9 -11.9 -5.5 0.0 0.0 0.0
Table A1.1.10. Cameroon: Sugar Cane
Source Units 1991 1992 1993 1994 1995 1996 1997 1998 1999 2000 2001 2002
I. Level of production FAOSTAT 000t 59.6 65.0 59.0 53.0 53.0 53.0 54.0 59.6 62.0 82.1 99.0 121.0
II. Producer price FAOSTAT USD/t 131.9 171.4 163.7 110.4 138.3 189.1 171.8 119.9 143.5 121.7 110.2 116.4
III. Value of production (I) * (II) USD mn 7.9 11.1 9.7 5.9 7.3 10.0 9.3 7.1 8.9 10.0 10.9 14.1
IV. Reference price (at farm gate) II/(1+IV.1/100) USD/t 125.6 163.2 155.9 105.1 106.4 145.4 132.2 92.3 110.3 93.6 84.8 89.5
IV.1. Sugar Tariff (1994,1995,2001,2002) UNCTAD % 5.0 5.0 5.0 5.0 30.0 30.0 30.0 30.0 30.0 30.0 30.0 30.0
V. Market price differential (II) - (IV) USD/t 6.3 8.2 7.8 5.3 31.9 43.6 39.7 27.7 33.1 28.1 25.4 26.9
VI. Market Price Support (MPS) (I) * (V)/1000 USD mn 0.4 0.5 0.5 0.3 1.7 2.3 2.1 1.6 2.1 2.3 2.5 3.3
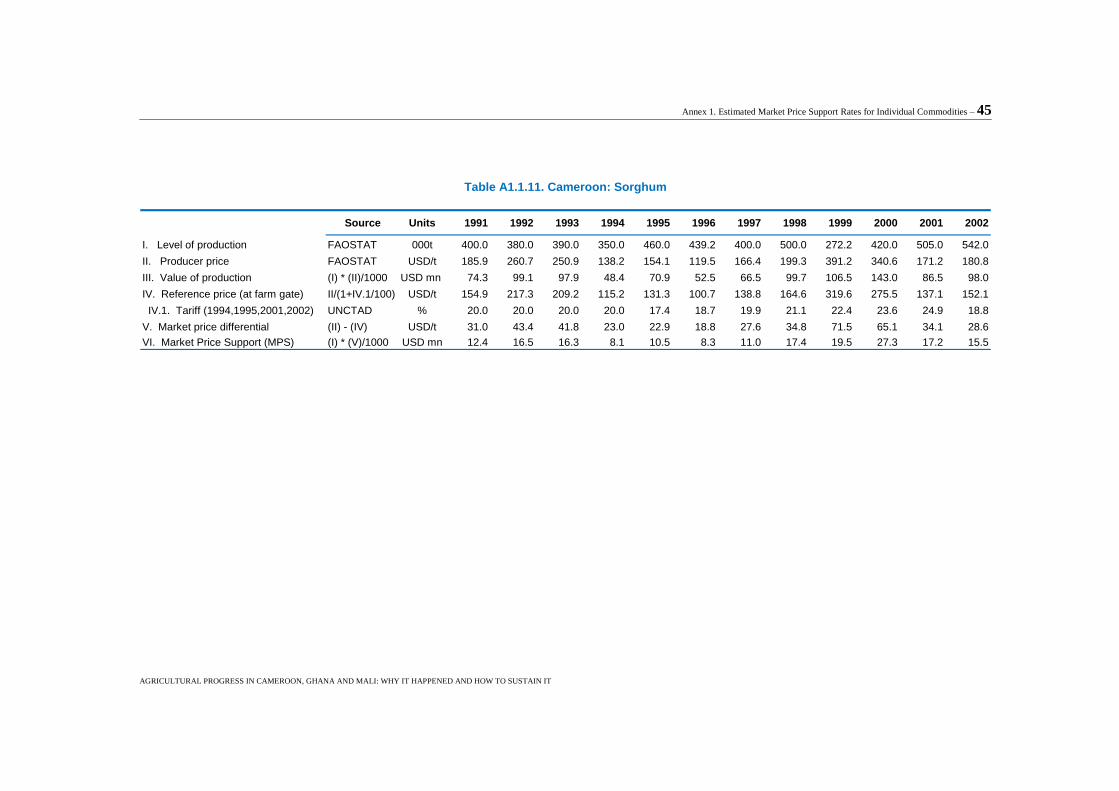
Annex 1. Estimated Market Price Support Rates for Individual Commodities – 45
AGRICULTURAL PROGRESS IN CAMEROON, GHANA AND MALI: WHY IT HAPPENED AND HOW TO SUSTAIN IT
Table A1.1.11. Cameroon: Sorghum
Source Units 1991 1992 1993 1994 1995 1996 1997 1998 1999 2000 2001 2002
I. Level of production FAOSTAT 000t 400.0 380.0 390.0 350.0 460.0 439.2 400.0 500.0 272.2 420.0 505.0 542.0
II. Producer price FAOSTAT USD/t 185.9 260.7 250.9 138.2 154.1 119.5 166.4 199.3 391.2 340.6 171.2 180.8
III. Value of production (I) * (II)/1000 USD mn 74.3 99.1 97.9 48.4 70.9 52.5 66.5 99.7 106.5 143.0 86.5 98.0
IV. Reference price (at farm gate) II/(1+IV.1/100) USD/t 154.9 217.3 209.2 115.2 131.3 100.7 138.8 164.6 319.6 275.5 137.1 152.1
IV.1. Tariff (1994,1995,2001,2002) UNCTAD % 20.0 20.0 20.0 20.0 17.4 18.7 19.9 21.1 22.4 23.6 24.9 18.8
V. Market price differential (II) - (IV) USD/t 31.0 43.4 41.8 23.0 22.9 18.8 27.6 34.8 71.5 65.1 34.1 28.6
VI. Market Price Support (MPS) (I) * (V)/1000 USD mn 12.4 16.5 16.3 8.1 10.5 8.3 11.0 17.4 19.5 27.3 17.2 15.5
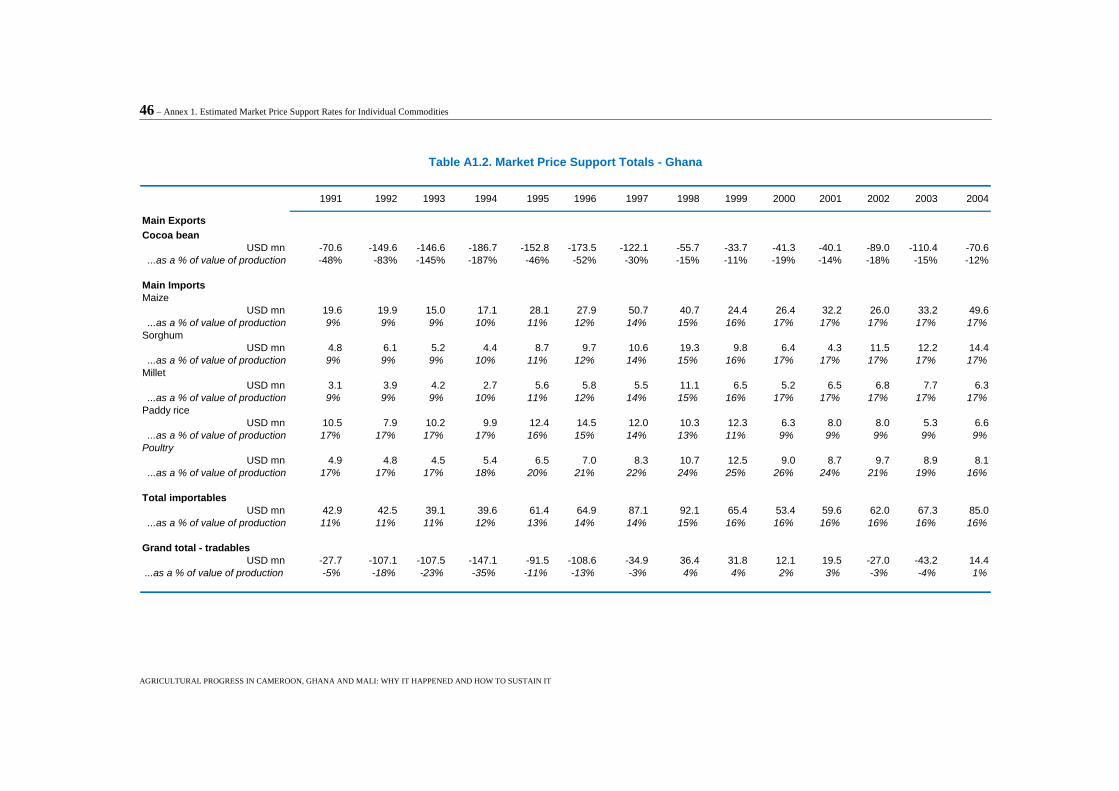
46 – Annex 1. Estimated Market Price Support Rates for Individual Commodities
AGRICULTURAL PROGRESS IN CAMEROON, GHANA AND MALI: WHY IT HAPPENED AND HOW TO SUSTAIN IT
Table A1.2. Market Price Support Totals - Ghana
1991 1992 1993 1994 1995 1996 1997 1998 1999 2000 2001 2002 2003 2004
Main Exports
Cocoa bean
USD mn -70.6 -149.6 -146.6 -186.7 -152.8 -173.5 -122.1 -55.7 -33.7 -41.3 -40.1 -89.0 -110.4 -70.6
...as a % of value of production -48% -83% -145% -187% -46% -52% -30% -15% -11% -19% -14% -18% -15% -12%
Main Imports
Maize
USD mn 19.6 19.9 15.0 17.1 28.1 27.9 50.7 40.7 24.4 26.4 32.2 26.0 33.2 49.6
...as a % of value of production 9% 9% 9% 10% 11% 12% 14% 15% 16% 17% 17% 17% 17% 17%
Sorghum
USD mn 4.8 6.1 5.2 4.4 8.7 9.7 10.6 19.3 9.8 6.4 4.3 11.5 12.2 14.4
...as a % of value of production 9% 9% 9% 10% 11% 12% 14% 15% 16% 17% 17% 17% 17% 17%
Millet
USD mn 3.1 3.9 4.2 2.7 5.6 5.8 5.5 11.1 6.5 5.2 6.5 6.8 7.7 6.3
...as a % of value of production 9% 9% 9% 10% 11% 12% 14% 15% 16% 17% 17% 17% 17% 17%
Paddy rice
USD mn 10.5 7.9 10.2 9.9 12.4 14.5 12.0 10.3 12.3 6.3 8.0 8.0 5.3 6.6
...as a % of value of production 17% 17% 17% 17% 16% 15% 14% 13% 11% 9% 9% 9% 9% 9%
Poultry
USD mn 4.9 4.8 4.5 5.4 6.5 7.0 8.3 10.7 12.5 9.0 8.7 9.7 8.9 8.1
...as a % of value of production 17% 17% 17% 18% 20% 21% 22% 24% 25% 26% 24% 21% 19% 16%
Total importables
USD mn 42.9 42.5 39.1 39.6 61.4 64.9 87.1 92.1 65.4 53.4 59.6 62.0 67.3 85.0
...as a % of value of production 11% 11% 11% 12% 13% 14% 14% 15% 16% 16% 16% 16% 16% 16%
Grand total - tradables
USD mn -27.7 -107.1 -107.5 -147.1 -91.5 -108.6 -34.9 36.4 31.8 12.1 19.5 -27.0 -43.2 14.4
...as a % of value of production -5% -18% -23% -35% -11% -13% -3% 4% 4% 2% 3% -3% -4% 1%
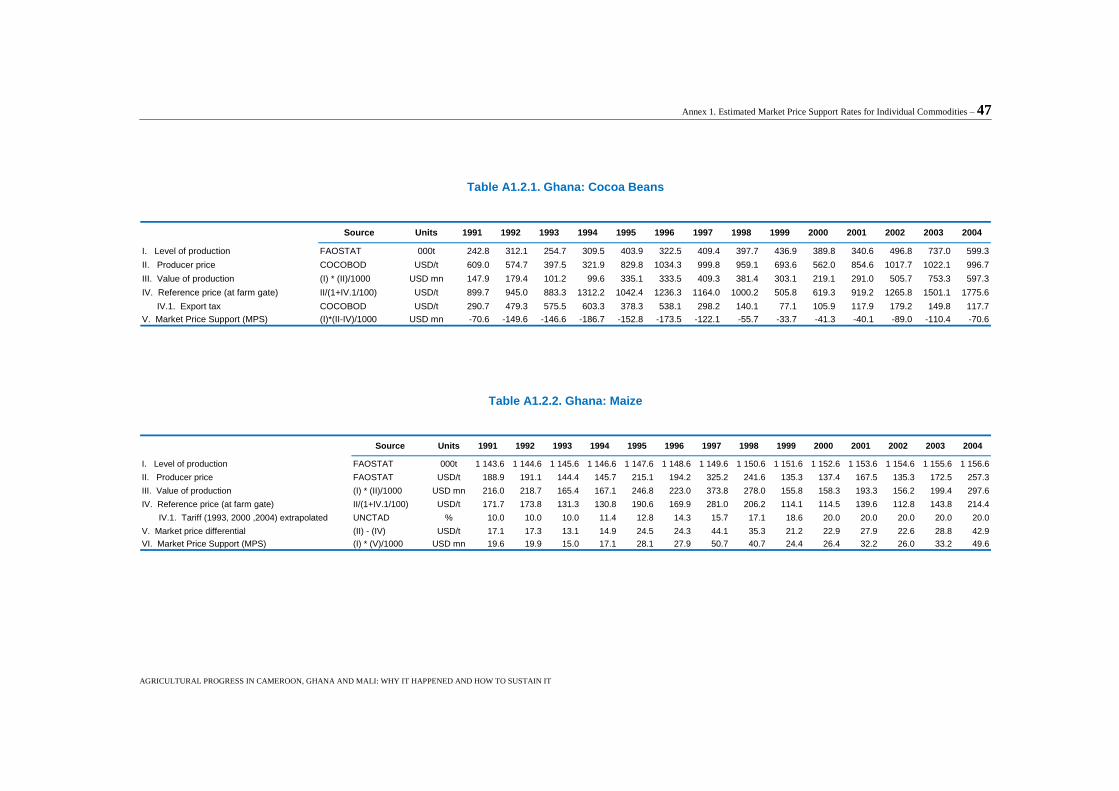
Annex 1. Estimated Market Price Support Rates for Individual Commodities – 47
AGRICULTURAL PROGRESS IN CAMEROON, GHANA AND MALI: WHY IT HAPPENED AND HOW TO SUSTAIN IT
Table A1.2.1. Ghana: Cocoa Beans
Source Units 1991 1992 1993 1994 1995 1996 1997 1998 1999 2000 2001 2002 2003 2004
I. Level of production FAOSTAT 000t 242.8 312.1 254.7 309.5 403.9 322.5 409.4 397.7 436.9 389.8 340.6 496.8 737.0 599.3
II. Producer price COCOBOD USD/t 609.0 574.7 397.5 321.9 829.8 1034.3 999.8 959.1 693.6 562.0 854.6 1017.7 1022.1 996.7
III. Value of production (I) * (II)/1000 USD mn 147.9 179.4 101.2 99.6 335.1 333.5 409.3 381.4 303.1 219.1 291.0 505.7 753.3 597.3
IV. Reference price (at farm gate) II/(1+IV.1/100) USD/t 899.7 945.0 883.3 1312.2 1042.4 1236.3 1164.0 1000.2 505.8 619.3 919.2 1265.8 1501.1 1775.6
IV.1. Export tax COCOBOD USD/t 290.7 479.3 575.5 603.3 378.3 538.1 298.2 140.1 77.1 105.9 117.9 179.2 149.8 117.7
V. Market Price Support (MPS) (I)*(II-IV)/1000 USD mn -70.6 -149.6 -146.6 -186.7 -152.8 -173.5 -122.1 -55.7 -33.7 -41.3 -40.1 -89.0 -110.4 -70.6
Table A1.2.2. Ghana: Maize
Source Units 1991 1992 1993 1994 1995 1996 1997 1998 1999 2000 2001 2002 2003 2004
I. Level of production FAOSTAT 000t 1 143.6 1 144.6 1 145.6 1 146.6 1 147.6 1 148.6 1 149.6 1 150.6 1 151.6 1 152.6 1 153.6 1 154.6 1 155.6 1 156.6
II. Producer price FAOSTAT USD/t 188.9 191.1 144.4 145.7 215.1 194.2 325.2 241.6 135.3 137.4 167.5 135.3 172.5 257.3
III. Value of production (I) * (II)/1000 USD mn 216.0 218.7 165.4 167.1 246.8 223.0 373.8 278.0 155.8 158.3 193.3 156.2 199.4 297.6
IV. Reference price (at farm gate) II/(1+IV.1/100) USD/t 171.7 173.8 131.3 130.8 190.6 169.9 281.0 206.2 114.1 114.5 139.6 112.8 143.8 214.4
IV.1. Tariff (1993, 2000 ,2004) extrapolated UNCTAD % 10.0 10.0 10.0 11.4 12.8 14.3 15.7 17.1 18.6 20.0 20.0 20.0 20.0 20.0
V. Market price differential (II) - (IV) USD/t 17.1 17.3 13.1 14.9 24.5 24.3 44.1 35.3 21.2 22.9 27.9 22.6 28.8 42.9
VI. Market Price Support (MPS) (I) * (V)/1000 USD mn 19.6 19.9 15.0 17.1 28.1 27.9 50.7 40.7 24.4 26.4 32.2 26.0 33.2 49.6
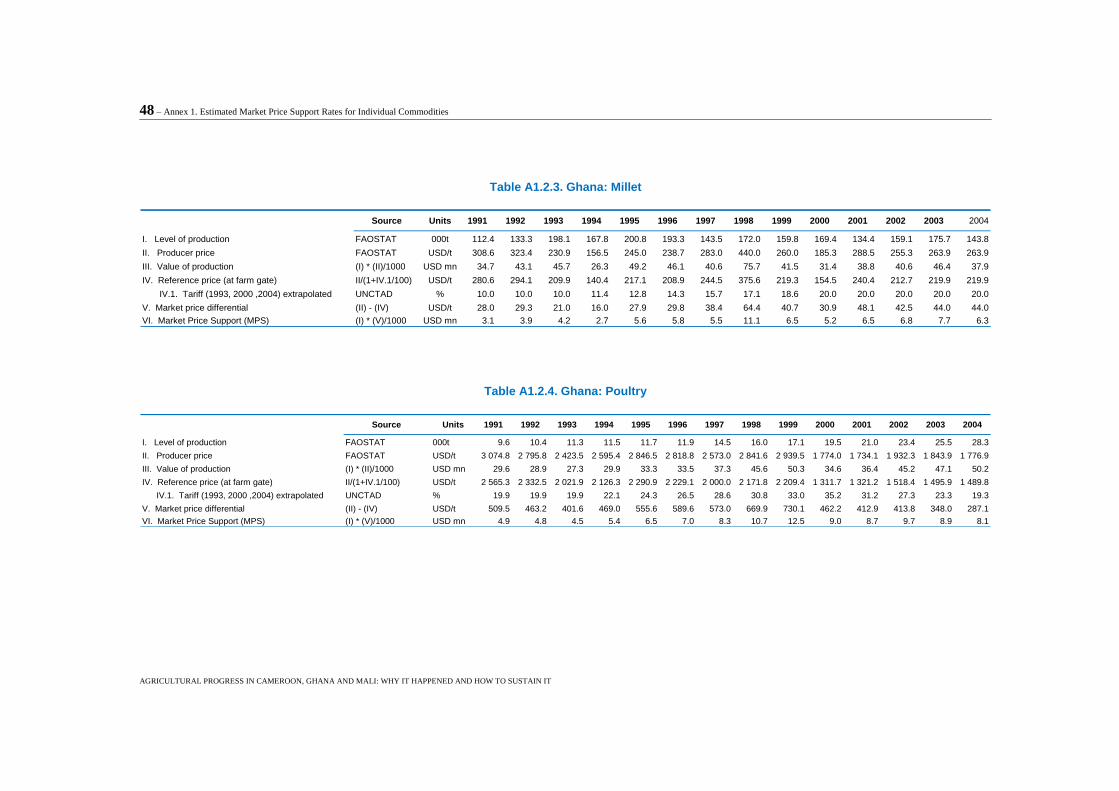
48 – Annex 1. Estimated Market Price Support Rates for Individual Commodities
AGRICULTURAL PROGRESS IN CAMEROON, GHANA AND MALI: WHY IT HAPPENED AND HOW TO SUSTAIN IT
Table A1.2.3. Ghana: Millet
Source Units 1991 1992 1993 1994 1995 1996 1997 1998 1999 2000 2001 2002 2003 2004
I. Level of production FAOSTAT 000t 112.4 133.3 198.1 167.8 200.8 193.3 143.5 172.0 159.8 169.4 134.4 159.1 175.7 143.8
II. Producer price FAOSTAT USD/t 308.6 323.4 230.9 156.5 245.0 238.7 283.0 440.0 260.0 185.3 288.5 255.3 263.9 263.9
III. Value of production (I) * (II)/1000 USD mn 34.7 43.1 45.7 26.3 49.2 46.1 40.6 75.7 41.5 31.4 38.8 40.6 46.4 37.9
IV. Reference price (at farm gate) II/(1+IV.1/100) USD/t 280.6 294.1 209.9 140.4 217.1 208.9 244.5 375.6 219.3 154.5 240.4 212.7 219.9 219.9
IV.1. Tariff (1993, 2000 ,2004) extrapolated UNCTAD % 10.0 10.0 10.0 11.4 12.8 14.3 15.7 17.1 18.6 20.0 20.0 20.0 20.0 20.0
V. Market price differential (II) - (IV) USD/t 28.0 29.3 21.0 16.0 27.9 29.8 38.4 64.4 40.7 30.9 48.1 42.5 44.0 44.0
VI. Market Price Support (MPS) (I) * (V)/1000 USD mn 3.1 3.9 4.2 2.7 5.6 5.8 5.5 11.1 6.5 5.2 6.5 6.8 7.7 6.3
Table A1.2.4. Ghana: Poultry
Source Units 1991 1992 1993 1994 1995 1996 1997 1998 1999 2000 2001 2002 2003 2004
I. Level of production FAOSTAT 000t 9.6 10.4 11.3 11.5 11.7 11.9 14.5 16.0 17.1 19.5 21.0 23.4 25.5 28.3
II. Producer price FAOSTAT USD/t 3 074.8 2 795.8 2 423.5 2 595.4 2 846.5 2 818.8 2 573.0 2 841.6 2 939.5 1 774.0 1 734.1 1 932.3 1 843.9 1 776.9
III. Value of production (I) * (II)/1000 USD mn 29.6 28.9 27.3 29.9 33.3 33.5 37.3 45.6 50.3 34.6 36.4 45.2 47.1 50.2
IV. Reference price (at farm gate) II/(1+IV.1/100) USD/t 2 565.3 2 332.5 2 021.9 2 126.3 2 290.9 2 229.1 2 000.0 2 171.8 2 209.4 1 311.7 1 321.2 1 518.4 1 495.9 1 489.8
IV.1. Tariff (1993, 2000 ,2004) extrapolated UNCTAD % 19.9 19.9 19.9 22.1 24.3 26.5 28.6 30.8 33.0 35.2 31.2 27.3 23.3 19.3
V. Market price differential (II) - (IV) USD/t 509.5 463.2 401.6 469.0 555.6 589.6 573.0 669.9 730.1 462.2 412.9 413.8 348.0 287.1
VI. Market Price Support (MPS) (I) * (V)/1000 USD mn 4.9 4.8 4.5 5.4 6.5 7.0 8.3 10.7 12.5 9.0 8.7 9.7 8.9 8.1
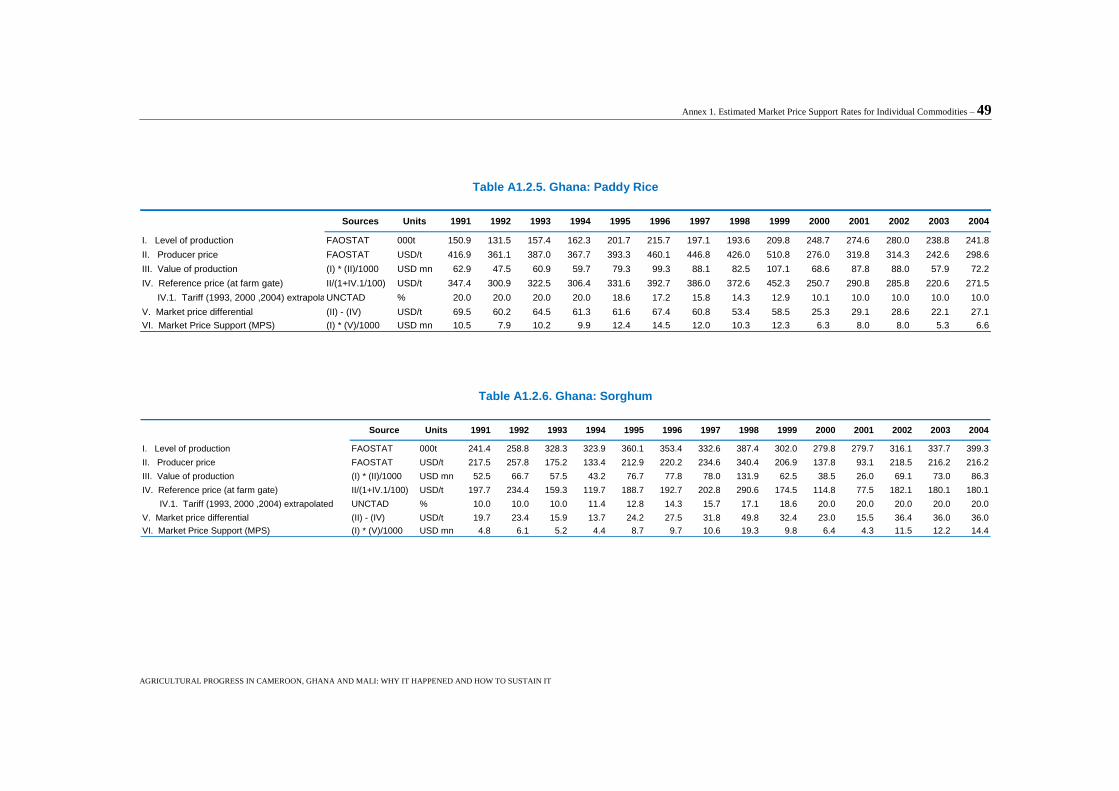
Annex 1. Estimated Market Price Support Rates for Individual Commodities – 49
AGRICULTURAL PROGRESS IN CAMEROON, GHANA AND MALI: WHY IT HAPPENED AND HOW TO SUSTAIN IT
Table A1.2.5. Ghana: Paddy Rice
Sources Units 1991 1992 1993 1994 1995 1996 1997 1998 1999 2000 2001 2002 2003 2004
I. Level of production FAOSTAT 000t 150.9 131.5 157.4 162.3 201.7 215.7 197.1 193.6 209.8 248.7 274.6 280.0 238.8 241.8
II. Producer price FAOSTAT USD/t 416.9 361.1 387.0 367.7 393.3 460.1 446.8 426.0 510.8 276.0 319.8 314.3 242.6 298.6
III. Value of production (I) * (II)/1000 USD mn 62.9 47.5 60.9 59.7 79.3 99.3 88.1 82.5 107.1 68.6 87.8 88.0 57.9 72.2
IV. Reference price (at farm gate) II/(1+IV.1/100) USD/t 347.4 300.9 322.5 306.4 331.6 392.7 386.0 372.6 452.3 250.7 290.8 285.8 220.6 271.5
IV.1. Tariff (1993, 2000 ,2004) extrapolatedUNCTAD % 20.0 20.0 20.0 20.0 18.6 17.2 15.8 14.3 12.9 10.1 10.0 10.0 10.0 10.0
V. Market price differential (II) - (IV) USD/t 69.5 60.2 64.5 61.3 61.6 67.4 60.8 53.4 58.5 25.3 29.1 28.6 22.1 27.1
VI. Market Price Support (MPS) (I) * (V)/1000 USD mn 10.5 7.9 10.2 9.9 12.4 14.5 12.0 10.3 12.3 6.3 8.0 8.0 5.3 6.6
Table A1.2.6. Ghana: Sorghum
Source Units 1991 1992 1993 1994 1995 1996 1997 1998 1999 2000 2001 2002 2003 2004
I. Level of production FAOSTAT 000t 241.4 258.8 328.3 323.9 360.1 353.4 332.6 387.4 302.0 279.8 279.7 316.1 337.7 399.3
II. Producer price FAOSTAT USD/t 217.5 257.8 175.2 133.4 212.9 220.2 234.6 340.4 206.9 137.8 93.1 218.5 216.2 216.2
III. Value of production (I) * (II)/1000 USD mn 52.5 66.7 57.5 43.2 76.7 77.8 78.0 131.9 62.5 38.5 26.0 69.1 73.0 86.3
IV. Reference price (at farm gate) II/(1+IV.1/100) USD/t 197.7 234.4 159.3 119.7 188.7 192.7 202.8 290.6 174.5 114.8 77.5 182.1 180.1 180.1
IV.1. Tariff (1993, 2000 ,2004) extrapolated UNCTAD % 10.0 10.0 10.0 11.4 12.8 14.3 15.7 17.1 18.6 20.0 20.0 20.0 20.0 20.0
V. Market price differential (II) - (IV) USD/t 19.7 23.4 15.9 13.7 24.2 27.5 31.8 49.8 32.4 23.0 15.5 36.4 36.0 36.0
VI. Market Price Support (MPS) (I) * (V)/1000 USD mn 4.8 6.1 5.2 4.4 8.7 9.7 10.6 19.3 9.8 6.4 4.3 11.5 12.2 14.4
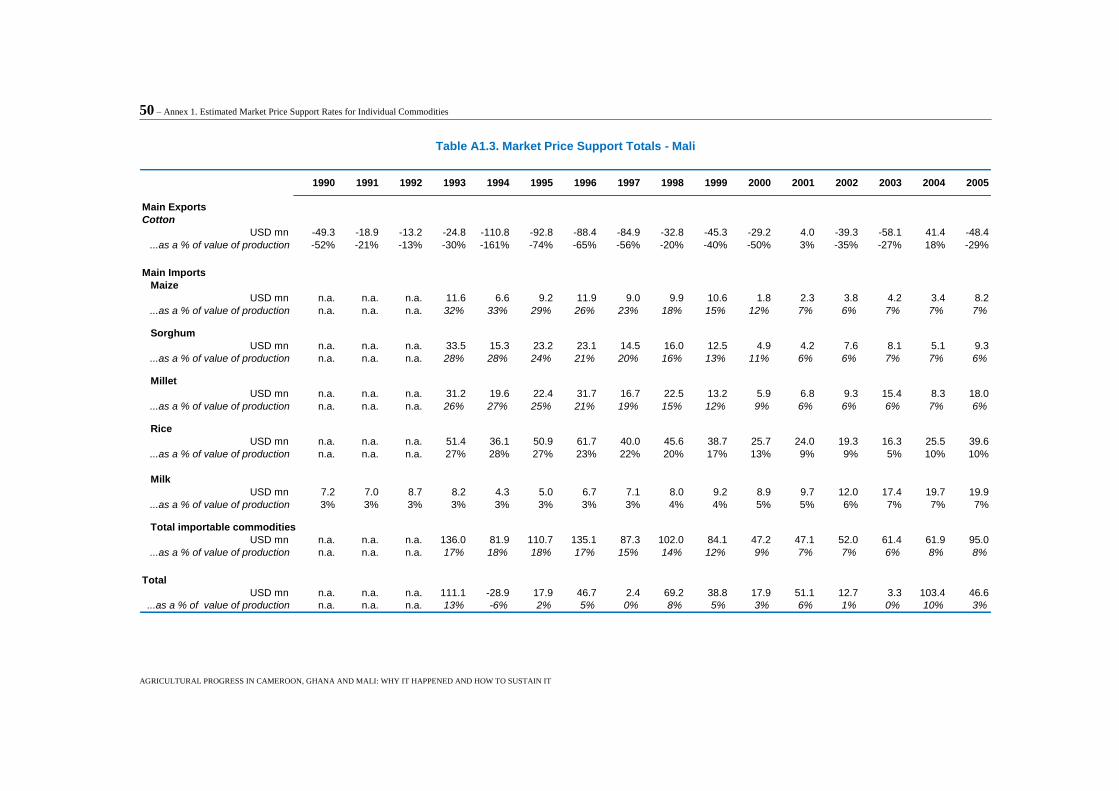
50 – Annex 1. Estimated Market Price Support Rates for Individual Commodities
AGRICULTURAL PROGRESS IN CAMEROON, GHANA AND MALI: WHY IT HAPPENED AND HOW TO SUSTAIN IT
Table A1.3. Market Price Support Totals - Mali
1990 1991 1992 1993 1994 1995 1996 1997 1998 1999 2000 2001 2002 2003 2004 2005
Main Exports
Cotton
USD mn -49.3 -18.9 -13.2 -24.8 -110.8 -92.8 -88.4 -84.9 -32.8 -45.3 -29.2 4.0 -39.3 -58.1 41.4 -48.4
...as a % of value of production -52% -21% -13% -30% -161% -74% -65% -56% -20% -40% -50% 3% -35% -27% 18% -29%
Main Imports
Maize
USD mn n.a. n.a. n.a. 11.6 6.6 9.2 11.9 9.0 9.9 10.6 1.8 2.3 3.8 4.2 3.4 8.2
...as a % of value of production n.a. n.a. n.a. 32% 33% 29% 26% 23% 18% 15% 12% 7% 6% 7% 7% 7%
Sorghum
USD mn n.a. n.a. n.a. 33.5 15.3 23.2 23.1 14.5 16.0 12.5 4.9 4.2 7.6 8.1 5.1 9.3
...as a % of value of production n.a. n.a. n.a. 28% 28% 24% 21% 20% 16% 13% 11% 6% 6% 7% 7% 6%
Millet
USD mn n.a. n.a. n.a. 31.2 19.6 22.4 31.7 16.7 22.5 13.2 5.9 6.8 9.3 15.4 8.3 18.0
...as a % of value of production n.a. n.a. n.a. 26% 27% 25% 21% 19% 15% 12% 9% 6% 6% 6% 7% 6%
Rice
USD mn n.a. n.a. n.a. 51.4 36.1 50.9 61.7 40.0 45.6 38.7 25.7 24.0 19.3 16.3 25.5 39.6
...as a % of value of production n.a. n.a. n.a. 27% 28% 27% 23% 22% 20% 17% 13% 9% 9% 5% 10% 10%
Milk
USD mn 7.2 7.0 8.7 8.2 4.3 5.0 6.7 7.1 8.0 9.2 8.9 9.7 12.0 17.4 19.7 19.9
...as a % of value of production 3% 3% 3% 3% 3% 3% 3% 3% 4% 4% 5% 5% 6% 7% 7% 7%
Total importable commodities
USD mn n.a. n.a. n.a. 136.0 81.9 110.7 135.1 87.3 102.0 84.1 47.2 47.1 52.0 61.4 61.9 95.0
...as a % of value of production n.a. n.a. n.a. 17% 18% 18% 17% 15% 14% 12% 9% 7% 7% 6% 8% 8%
Total
USD mn n.a. n.a. n.a. 111.1 -28.9 17.9 46.7 2.4 69.2 38.8 17.9 51.1 12.7 3.3 103.4 46.6
...as a % of value of production n.a. n.a. n.a. 13% -6% 2% 5% 0% 8% 5% 3% 6% 1% 0% 10% 3%
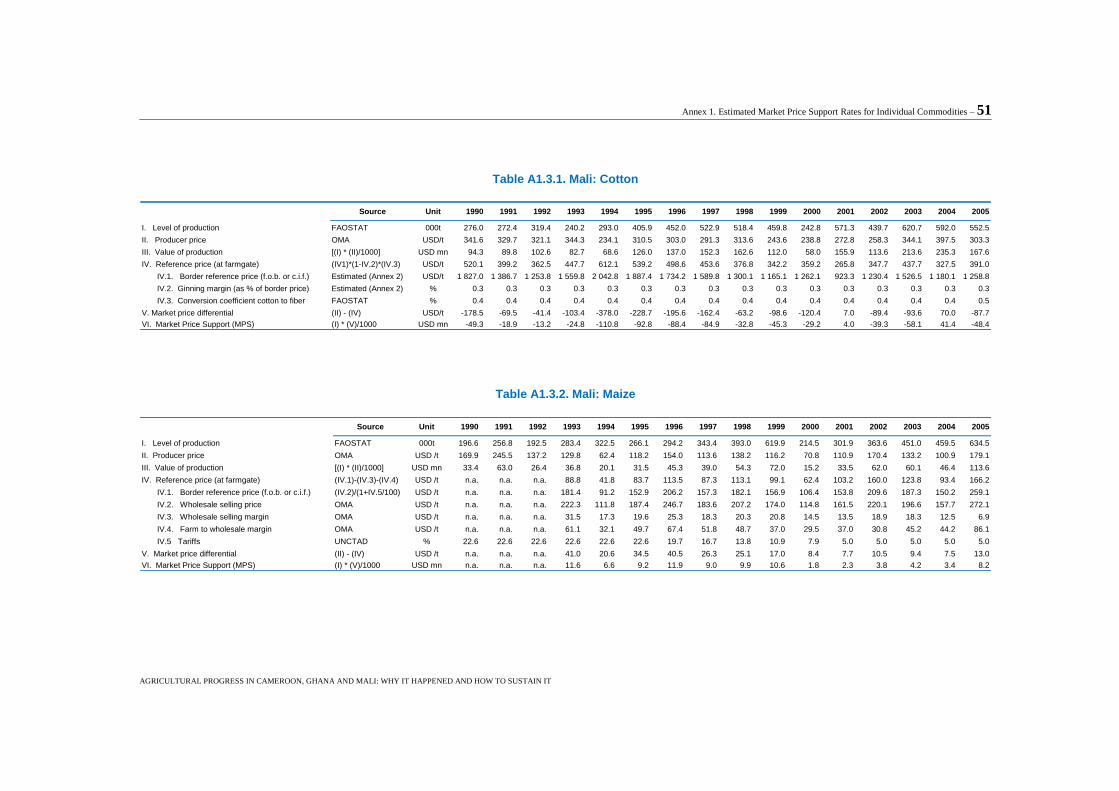
Annex 1. Estimated Market Price Support Rates for Individual Commodities – 51
AGRICULTURAL PROGRESS IN CAMEROON, GHANA AND MALI: WHY IT HAPPENED AND HOW TO SUSTAIN IT
Table A1.3.1. Mali: Cotton
Source Unit 1990 1991 1992 1993 1994 1995 1996 1997 1998 1999 2000 2001 2002 2003 2004 2005
I. Level of production FAOSTAT 000t 276.0 272.4 319.4 240.2 293.0 405.9 452.0 522.9 518.4 459.8 242.8 571.3 439.7 620.7 592.0 552.5
II. Producer price OMA USD/t 341.6 329.7 321.1 344.3 234.1 310.5 303.0 291.3 313.6 243.6 238.8 272.8 258.3 344.1 397.5 303.3
III. Value of production [(I) * (II)/1000] USD mn 94.3 89.8 102.6 82.7 68.6 126.0 137.0 152.3 162.6 112.0 58.0 155.9 113.6 213.6 235.3 167.6
IV. Reference price (at farmgate) (IV1)*(1-IV.2)*(IV.3) USD/t 520.1 399.2 362.5 447.7 612.1 539.2 498.6 453.6 376.8 342.2 359.2 265.8 347.7 437.7 327.5 391.0
IV.1. Border reference price (f.o.b. or c.i.f.) Estimated (Annex 2) USD/t 1 827.0 1 386.7 1 253.8 1 559.8 2 042.8 1 887.4 1 734.2 1 589.8 1 300.1 1 165.1 1 262.1 923.3 1 230.4 1 526.5 1 180.1 1 258.8
IV.2. Ginning margin (as % of border price) Estimated (Annex 2) % 0.3 0.3 0.3 0.3 0.3 0.3 0.3 0.3 0.3 0.3 0.3 0.3 0.3 0.3 0.3 0.3
IV.3. Conversion coefficient cotton to fiber FAOSTAT % 0.4 0.4 0.4 0.4 0.4 0.4 0.4 0.4 0.4 0.4 0.4 0.4 0.4 0.4 0.4 0.5
V. Market price differential (II) - (IV) USD/t -178.5 -69.5 -41.4 -103.4 -378.0 -228.7 -195.6 -162.4 -63.2 -98.6 -120.4 7.0 -89.4 -93.6 70.0 -87.7
VI. Market Price Support (MPS) (I) * (V)/1000 USD mn -49.3 -18.9 -13.2 -24.8 -110.8 -92.8 -88.4 -84.9 -32.8 -45.3 -29.2 4.0 -39.3 -58.1 41.4 -48.4
Table A1.3.2. Mali: Maize
Source Unit 1990 1991 1992 1993 1994 1995 1996 1997 1998 1999 2000 2001 2002 2003 2004 2005
I. Level of production FAOSTAT 000t 196.6 256.8 192.5 283.4 322.5 266.1 294.2 343.4 393.0 619.9 214.5 301.9 363.6 451.0 459.5 634.5
II. Producer price OMA USD /t 169.9 245.5 137.2 129.8 62.4 118.2 154.0 113.6 138.2 116.2 70.8 110.9 170.4 133.2 100.9 179.1
III. Value of production [(I) * (II)/1000] USD mn 33.4 63.0 26.4 36.8 20.1 31.5 45.3 39.0 54.3 72.0 15.2 33.5 62.0 60.1 46.4 113.6
IV. Reference price (at farmgate) (IV.1)-(IV.3)-(IV.4) USD /t n.a. n.a. n.a. 88.8 41.8 83.7 113.5 87.3 113.1 99.1 62.4 103.2 160.0 123.8 93.4 166.2
IV.1. Border reference price (f.o.b. or c.i.f.) (IV.2)/(1+IV.5/100) USD /t n.a. n.a. n.a. 181.4 91.2 152.9 206.2 157.3 182.1 156.9 106.4 153.8 209.6 187.3 150.2 259.1
IV.2. Wholesale selling price OMA USD /t n.a. n.a. n.a. 222.3 111.8 187.4 246.7 183.6 207.2 174.0 114.8 161.5 220.1 196.6 157.7 272.1
IV.3. Wholesale selling margin OMA USD /t n.a. n.a. n.a. 31.5 17.3 19.6 25.3 18.3 20.3 20.8 14.5 13.5 18.9 18.3 12.5 6.9
IV.4. Farm to wholesale margin OMA USD /t n.a. n.a. n.a. 61.1 32.1 49.7 67.4 51.8 48.7 37.0 29.5 37.0 30.8 45.2 44.2 86.1
IV.5 Tariffs UNCTAD % 22.6 22.6 22.6 22.6 22.6 22.6 19.7 16.7 13.8 10.9 7.9 5.0 5.0 5.0 5.0 5.0
V. Market price differential (II) - (IV) USD /t n.a. n.a. n.a. 41.0 20.6 34.5 40.5 26.3 25.1 17.0 8.4 7.7 10.5 9.4 7.5 13.0
VI. Market Price Support (MPS) (I) * (V)/1000 USD mn n.a. n.a. n.a. 11.6 6.6 9.2 11.9 9.0 9.9 10.6 1.8 2.3 3.8 4.2 3.4 8.2
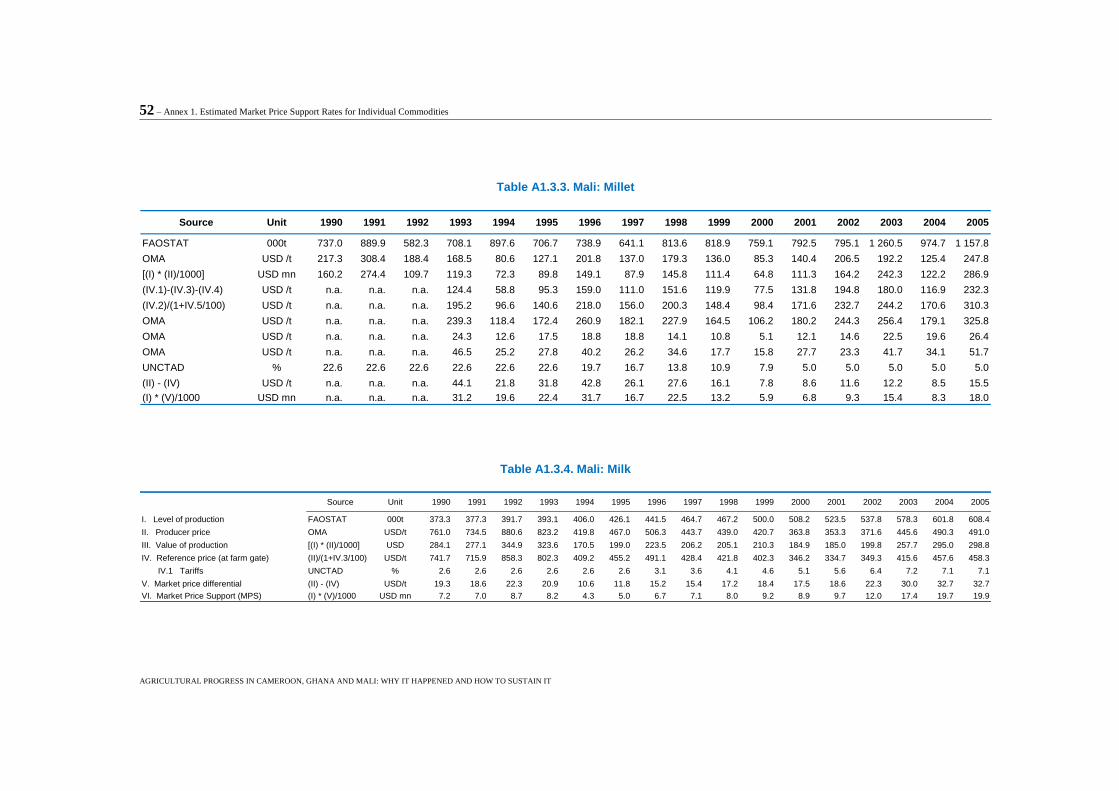
52 – Annex 1. Estimated Market Price Support Rates for Individual Commodities
AGRICULTURAL PROGRESS IN CAMEROON, GHANA AND MALI: WHY IT HAPPENED AND HOW TO SUSTAIN IT
Table A1.3.3. Mali: Millet
Source Unit 1990 1991 1992 1993 1994 1995 1996 1997 1998 1999 2000 2001 2002 2003 2004 2005
FAOSTAT 000t 737.0 889.9 582.3 708.1 897.6 706.7 738.9 641.1 813.6 818.9 759.1 792.5 795.1 1 260.5 974.7 1 157.8
OMA USD /t 217.3 308.4 188.4 168.5 80.6 127.1 201.8 137.0 179.3 136.0 85.3 140.4 206.5 192.2 125.4 247.8
[(I) * (II)/1000] USD mn 160.2 274.4 109.7 119.3 72.3 89.8 149.1 87.9 145.8 111.4 64.8 111.3 164.2 242.3 122.2 286.9
(IV.1)-(IV.3)-(IV.4) USD /t n.a. n.a. n.a. 124.4 58.8 95.3 159.0 111.0 151.6 119.9 77.5 131.8 194.8 180.0 116.9 232.3
(IV.2)/(1+IV.5/100) USD /t n.a. n.a. n.a. 195.2 96.6 140.6 218.0 156.0 200.3 148.4 98.4 171.6 232.7 244.2 170.6 310.3
OMA USD /t n.a. n.a. n.a. 239.3 118.4 172.4 260.9 182.1 227.9 164.5 106.2 180.2 244.3 256.4 179.1 325.8
OMA USD /t n.a. n.a. n.a. 24.3 12.6 17.5 18.8 18.8 14.1 10.8 5.1 12.1 14.6 22.5 19.6 26.4
OMA USD /t n.a. n.a. n.a. 46.5 25.2 27.8 40.2 26.2 34.6 17.7 15.8 27.7 23.3 41.7 34.1 51.7
UNCTAD % 22.6 22.6 22.6 22.6 22.6 22.6 19.7 16.7 13.8 10.9 7.9 5.0 5.0 5.0 5.0 5.0
(II) - (IV) USD /t n.a. n.a. n.a. 44.1 21.8 31.8 42.8 26.1 27.6 16.1 7.8 8.6 11.6 12.2 8.5 15.5
(I) * (V)/1000 USD mn n.a. n.a. n.a. 31.2 19.6 22.4 31.7 16.7 22.5 13.2 5.9 6.8 9.3 15.4 8.3 18.0
Table A1.3.4. Mali: Milk
Source Unit 1990 1991 1992 1993 1994 1995 1996 1997 1998 1999 2000 2001 2002 2003 2004 2005
I. Level of production FAOSTAT 000t 373.3 377.3 391.7 393.1 406.0 426.1 441.5 464.7 467.2 500.0 508.2 523.5 537.8 578.3 601.8 608.4
II. Producer price OMA USD/t 761.0 734.5 880.6 823.2 419.8 467.0 506.3 443.7 439.0 420.7 363.8 353.3 371.6 445.6 490.3 491.0
III. Value of production [(I) * (II)/1000] USD 284.1 277.1 344.9 323.6 170.5 199.0 223.5 206.2 205.1 210.3 184.9 185.0 199.8 257.7 295.0 298.8
IV. Reference price (at farm gate) (II)/(1+IV.3/100) USD/t 741.7 715.9 858.3 802.3 409.2 455.2 491.1 428.4 421.8 402.3 346.2 334.7 349.3 415.6 457.6 458.3
IV.1 Tariffs UNCTAD % 2.6 2.6 2.6 2.6 2.6 2.6 3.1 3.6 4.1 4.6 5.1 5.6 6.4 7.2 7.1 7.1
V. Market price differential (II) - (IV) USD/t 19.3 18.6 22.3 20.9 10.6 11.8 15.2 15.4 17.2 18.4 17.5 18.6 22.3 30.0 32.7 32.7
VI. Market Price Support (MPS) (I) * (V)/1000 USD mn 7.2 7.0 8.7 8.2 4.3 5.0 6.7 7.1 8.0 9.2 8.9 9.7 12.0 17.4 19.7 19.9
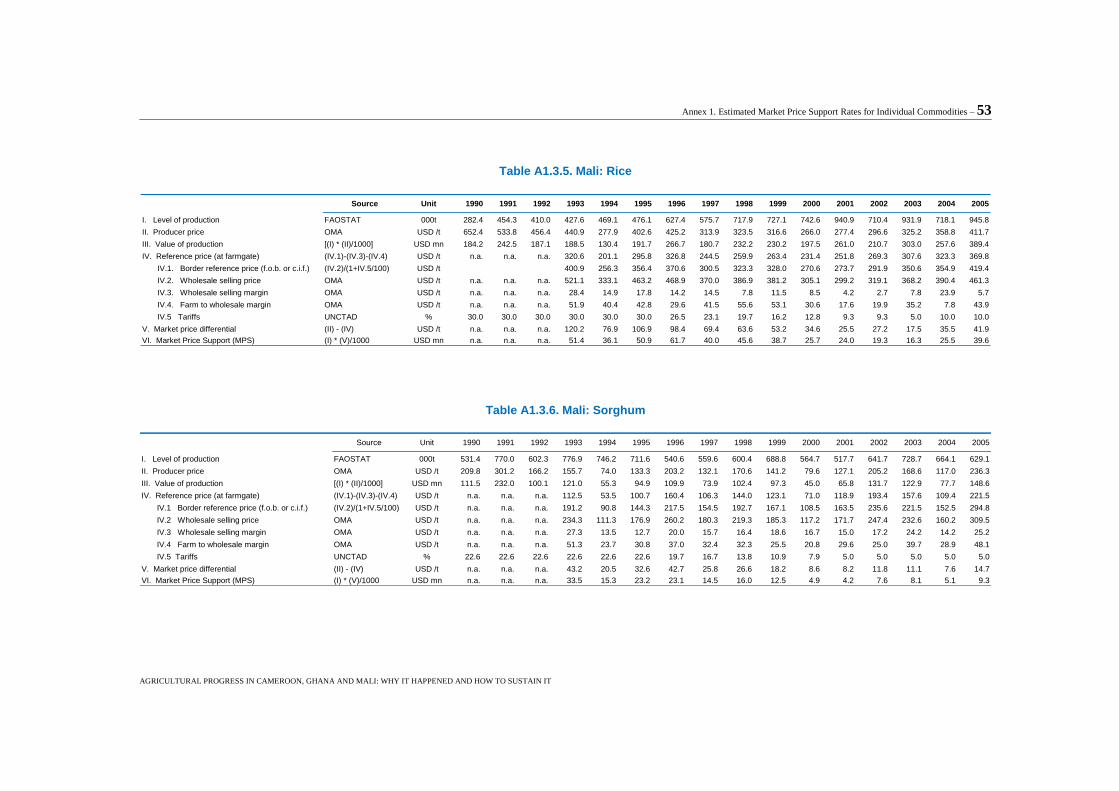
Annex 1. Estimated Market Price Support Rates for Individual Commodities – 53
AGRICULTURAL PROGRESS IN CAMEROON, GHANA AND MALI: WHY IT HAPPENED AND HOW TO SUSTAIN IT
Table A1.3.5. Mali: Rice
Source Unit 1990 1991 1992 1993 1994 1995 1996 1997 1998 1999 2000 2001 2002 2003 2004 2005
I. Level of production FAOSTAT 000t 282.4 454.3 410.0 427.6 469.1 476.1 627.4 575.7 717.9 727.1 742.6 940.9 710.4 931.9 718.1 945.8
II. Producer price OMA USD /t 652.4 533.8 456.4 440.9 277.9 402.6 425.2 313.9 323.5 316.6 266.0 277.4 296.6 325.2 358.8 411.7
III. Value of production [(I) * (II)/1000] USD mn 184.2 242.5 187.1 188.5 130.4 191.7 266.7 180.7 232.2 230.2 197.5 261.0 210.7 303.0 257.6 389.4
IV. Reference price (at farmgate) (IV.1)-(IV.3)-(IV.4) USD /t n.a. n.a. n.a. 320.6 201.1 295.8 326.8 244.5 259.9 263.4 231.4 251.8 269.3 307.6 323.3 369.8
IV.1. Border reference price (f.o.b. or c.i.f.) (IV.2)/(1+IV.5/100) USD /t 400.9 256.3 356.4 370.6 300.5 323.3 328.0 270.6 273.7 291.9 350.6 354.9 419.4
IV.2. Wholesale selling price OMA USD /t n.a. n.a. n.a. 521.1 333.1 463.2 468.9 370.0 386.9 381.2 305.1 299.2 319.1 368.2 390.4 461.3
IV.3. Wholesale selling margin OMA USD /t n.a. n.a. n.a. 28.4 14.9 17.8 14.2 14.5 7.8 11.5 8.5 4.2 2.7 7.8 23.9 5.7
IV.4. Farm to wholesale margin OMA USD /t n.a. n.a. n.a. 51.9 40.4 42.8 29.6 41.5 55.6 53.1 30.6 17.6 19.9 35.2 7.8 43.9
IV.5 Tariffs UNCTAD % 30.0 30.0 30.0 30.0 30.0 30.0 26.5 23.1 19.7 16.2 12.8 9.3 9.3 5.0 10.0 10.0
V. Market price differential (II) - (IV) USD /t n.a. n.a. n.a. 120.2 76.9 106.9 98.4 69.4 63.6 53.2 34.6 25.5 27.2 17.5 35.5 41.9
VI. Market Price Support (MPS) (I) * (V)/1000 USD mn n.a. n.a. n.a. 51.4 36.1 50.9 61.7 40.0 45.6 38.7 25.7 24.0 19.3 16.3 25.5 39.6
Table A1.3.6. Mali: Sorghum
Source Unit 1990 1991 1992 1993 1994 1995 1996 1997 1998 1999 2000 2001 2002 2003 2004 2005
I. Level of production FAOSTAT 000t 531.4 770.0 602.3 776.9 746.2 711.6 540.6 559.6 600.4 688.8 564.7 517.7 641.7 728.7 664.1 629.1
II. Producer price OMA USD /t 209.8 301.2 166.2 155.7 74.0 133.3 203.2 132.1 170.6 141.2 79.6 127.1 205.2 168.6 117.0 236.3
III. Value of production [(I) * (II)/1000] USD mn 111.5 232.0 100.1 121.0 55.3 94.9 109.9 73.9 102.4 97.3 45.0 65.8 131.7 122.9 77.7 148.6
IV. Reference price (at farmgate) (IV.1)-(IV.3)-(IV.4) USD /t n.a. n.a. n.a. 112.5 53.5 100.7 160.4 106.3 144.0 123.1 71.0 118.9 193.4 157.6 109.4 221.5
IV.1 Border reference price (f.o.b. or c.i.f.) (IV.2)/(1+IV.5/100) USD /t n.a. n.a. n.a. 191.2 90.8 144.3 217.5 154.5 192.7 167.1 108.5 163.5 235.6 221.5 152.5 294.8
IV.2 Wholesale selling price OMA USD /t n.a. n.a. n.a. 234.3 111.3 176.9 260.2 180.3 219.3 185.3 117.2 171.7 247.4 232.6 160.2 309.5
IV.3 Wholesale selling margin OMA USD /t n.a. n.a. n.a. 27.3 13.5 12.7 20.0 15.7 16.4 18.6 16.7 15.0 17.2 24.2 14.2 25.2
IV.4 Farm to wholesale margin OMA USD /t n.a. n.a. n.a. 51.3 23.7 30.8 37.0 32.4 32.3 25.5 20.8 29.6 25.0 39.7 28.9 48.1
IV.5 Tariffs UNCTAD % 22.6 22.6 22.6 22.6 22.6 22.6 19.7 16.7 13.8 10.9 7.9 5.0 5.0 5.0 5.0 5.0
V. Market price differential (II) - (IV) USD /t n.a. n.a. n.a. 43.2 20.5 32.6 42.7 25.8 26.6 18.2 8.6 8.2 11.8 11.1 7.6 14.7
VI. Market Price Support (MPS) (I) * (V)/1000 USD mn n.a. n.a. n.a. 33.5 15.3 23.2 23.1 14.5 16.0 12.5 4.9 4.2 7.6 8.1 5.1 9.3
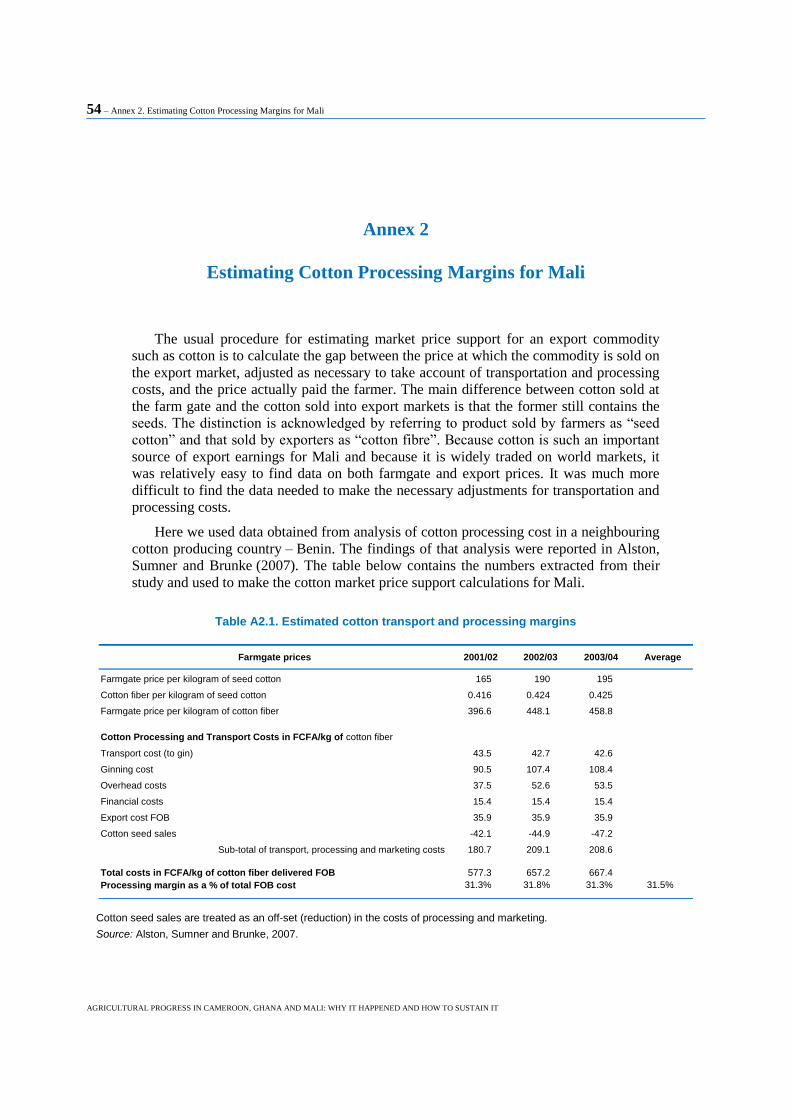
54 – Annex 2. Estimating Cotton Processing Margins for Mali
AGRICULTURAL PROGRESS IN CAMEROON, GHANA AND MALI: WHY IT HAPPENED AND HOW TO SUSTAIN IT
Annex 2
Estimating Cotton Processing Margins for Mali
The usual procedure for estimating market price support for an export commodity
such as cotton is to calculate the gap between the price at which the commodity is sold on
the export market, adjusted as necessary to take account of transportation and processing
costs, and the price actually paid the farmer. The main difference between cotton sold at
the farm gate and the cotton sold into export markets is that the former still contains the
seeds. The distinction is acknowledged by referring to product sold by farmers as “seed
cotton” and that sold by exporters as “cotton fibre”. Because cotton is such an important
source of export earnings for Mali and because it is widely traded on world markets, it
was relatively easy to find data on both farmgate and export prices. It was much more
difficult to find the data needed to make the necessary adjustments for transportation and
processing costs.
Here we used data obtained from analysis of cotton processing cost in a neighbouring
cotton producing country – Benin. The findings of that analysis were reported in Alston,
Sumner and Brunke (2007). The table below contains the numbers extracted from their
study and used to make the cotton market price support calculations for Mali.
Table A2.1. Estimated cotton transport and processing margins
Farmgate prices 2001/02 2002/03 2003/04 Average
Farmgate price per kilogram of seed cotton 165 190 195
Cotton fiber per kilogram of seed cotton 0.416 0.424 0.425
Farmgate price per kilogram of cotton fiber 396.6 448.1 458.8
Cotton Processing and Transport Costs in FCFA/kg of cotton fiber
Transport cost (to gin) 43.5 42.7 42.6
Ginning cost 90.5 107.4 108.4
Overhead costs 37.5 52.6 53.5
Financial costs 15.4 15.4 15.4
Export cost FOB 35.9 35.9 35.9
Cotton seed sales -42.1 -44.9 -47.2
Sub-total of transport, processing and marketing costs 180.7 209.1 208.6
Total costs in FCFA/kg of cotton fiber delivered FOB 577.3 657.2 667.4
Processing margin as a % of total FOB cost 31.3% 31.8% 31.3% 31.5%
Cotton seed sales are treated as an off-set (reduction) in the costs of processing and marketing.
Source: Alston, Sumner and Brunke, 2007.
Annex 2. Annex 2. Estimating Cotton Processing Margins for Mali – 55
AGRICULTURAL PROGRESS IN CAMEROON, GHANA AND MALI: WHY IT HAPPENED AND HOW TO SUSTAIN IT
An important question that arises when making price gap adjustments is whether to
assume that transport, processing costs are constant or that they are proportional to the
price of the product. Then, if proportional, are they to be measured relative to the
farmgate or the export price? Alson, Sumner and Brunke argue that the bulk of costs of
cotton marketing, trucks, fuel, loading and unloading and similar charges do not depend
on the price of cotton. Yet, for the three years for which we have the data for Benin, there
is very little variation in the margin when expressed as a percent of total costs (this
calculation is based on total unit costs at FOB rather than an export price assuming that,
in the medium term, these two will always converge). Accordingly, we have assumed a
margin for calculating cotton market price support equal to the three-year average of the
Benin results, i.e. 31.5%.
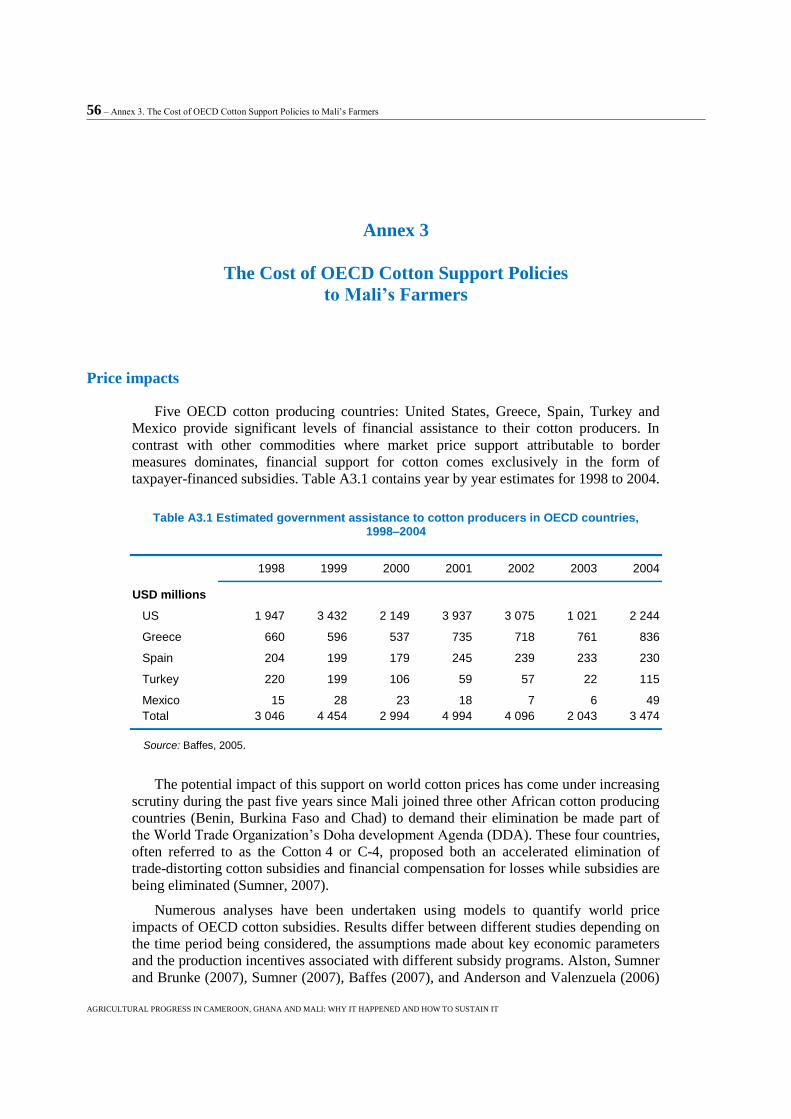
56 – Annex 3. The Cost of OECD Cotton Support Policies to Mali‟s Farmers
AGRICULTURAL PROGRESS IN CAMEROON, GHANA AND MALI: WHY IT HAPPENED AND HOW TO SUSTAIN IT
Annex 3
The Cost of OECD Cotton Support Policies
to Mali’s Farmers
Price impacts
Five OECD cotton producing countries: United States, Greece, Spain, Turkey and
Mexico provide significant levels of financial assistance to their cotton producers. In
contrast with other commodities where market price support attributable to border
measures dominates, financial support for cotton comes exclusively in the form of
taxpayer-financed subsidies. Table A3.1 contains year by year estimates for 1998 to 2004.
Table A3.1 Estimated government assistance to cotton producers in OECD countries, 1998–2004
1998 1999 2000 2001 2002 2003 2004
USD millions
US 1 947 3 432 2 149 3 937 3 075 1 021 2 244
Greece 660 596 537 735 718 761 836
Spain 204 199 179 245 239 233 230
Turkey 220 199 106 59 57 22 115
Mexico 15 28 23 18 7 6 49
Total 3 046 4 454 2 994 4 994 4 096 2 043 3 474
Source: Baffes, 2005.
The potential impact of this support on world cotton prices has come under increasing
scrutiny during the past five years since Mali joined three other African cotton producing
countries (Benin, Burkina Faso and Chad) to demand their elimination be made part of
the World Trade Organization‟s Doha development Agenda (DDA). These four countries,
often referred to as the Cotton 4 or C-4, proposed both an accelerated elimination of
trade-distorting cotton subsidies and financial compensation for losses while subsidies are
being eliminated (Sumner, 2007).
Numerous analyses have been undertaken using models to quantify world price
impacts of OECD cotton subsidies. Results differ between different studies depending on
the time period being considered, the assumptions made about key economic parameters
and the production incentives associated with different subsidy programs. Alston, Sumner
and Brunke (2007), Sumner (2007), Baffes (2007), and Anderson and Valenzuela (2006)
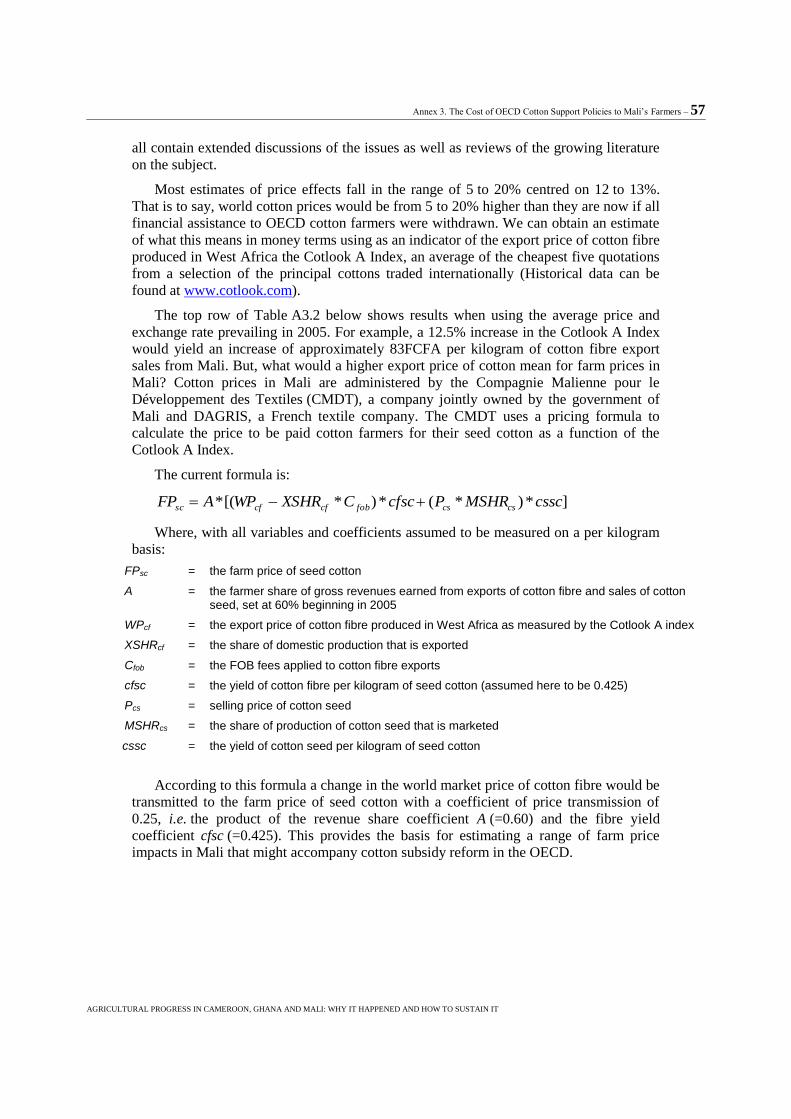
Annex 3. The Cost of OECD Cotton Support Policies to Mali‟s Farmers – 57
AGRICULTURAL PROGRESS IN CAMEROON, GHANA AND MALI: WHY IT HAPPENED AND HOW TO SUSTAIN IT
all contain extended discussions of the issues as well as reviews of the growing literature
on the subject.
Most estimates of price effects fall in the range of 5 to 20% centred on 12 to 13%.
That is to say, world cotton prices would be from 5 to 20% higher than they are now if all
financial assistance to OECD cotton farmers were withdrawn. We can obtain an estimate
of what this means in money terms using as an indicator of the export price of cotton fibre
produced in West Africa the Cotlook A Index, an average of the cheapest five quotations
from a selection of the principal cottons traded internationally (Historical data can be
found at www.cotlook.com).
The top row of Table A3.2 below shows results when using the average price and
exchange rate prevailing in 2005. For example, a 12.5% increase in the Cotlook A Index
would yield an increase of approximately 83FCFA per kilogram of cotton fibre export
sales from Mali. But, what would a higher export price of cotton mean for farm prices in
Mali? Cotton prices in Mali are administered by the Compagnie Malienne pour le
Développement des Textiles (CMDT), a company jointly owned by the government of
Mali and DAGRIS, a French textile company. The CMDT uses a pricing formula to
calculate the price to be paid cotton farmers for their seed cotton as a function of the
Cotlook A Index.
The current formula is:
]*)*(*)*[(* csscMSHRPcfscCXSHRWPAFP cscsfobcfcfsc
Where, with all variables and coefficients assumed to be measured on a per kilogram
basis:
FPsc = the farm price of seed cotton
A = the farmer share of gross revenues earned from exports of cotton fibre and sales of cotton seed, set at 60% beginning in 2005
WPcf = the export price of cotton fibre produced in West Africa as measured by the Cotlook A index
XSHRcf = the share of domestic production that is exported
Cfob = the FOB fees applied to cotton fibre exports
cfsc = the yield of cotton fibre per kilogram of seed cotton (assumed here to be 0.425)
Pcs = selling price of cotton seed
MSHRcs = the share of production of cotton seed that is marketed
cssc = the yield of cotton seed per kilogram of seed cotton
According to this formula a change in the world market price of cotton fibre would be
transmitted to the farm price of seed cotton with a coefficient of price transmission of
0.25, i.e. the product of the revenue share coefficient A (=0.60) and the fibre yield
coefficient cfsc (=0.425). This provides the basis for estimating a range of farm price
impacts in Mali that might accompany cotton subsidy reform in the OECD.
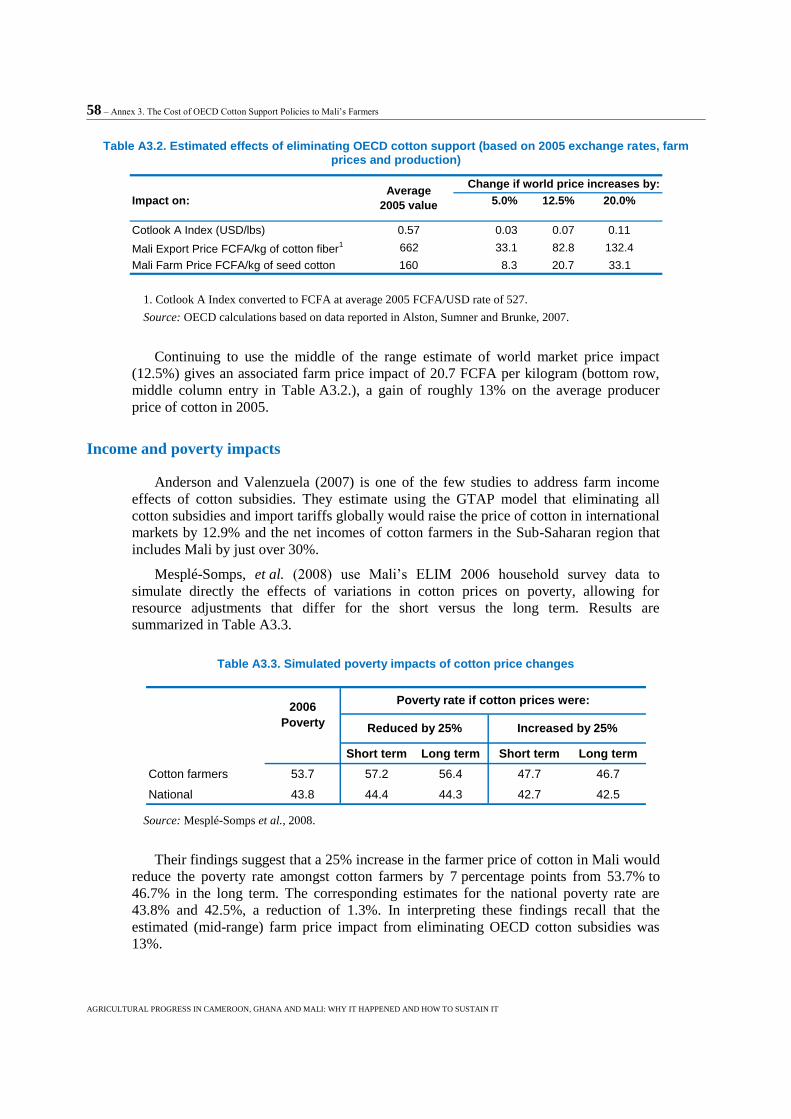
58 – Annex 3. The Cost of OECD Cotton Support Policies to Mali‟s Farmers
AGRICULTURAL PROGRESS IN CAMEROON, GHANA AND MALI: WHY IT HAPPENED AND HOW TO SUSTAIN IT
Table A3.2. Estimated effects of eliminating OECD cotton support (based on 2005 exchange rates, farm prices and production)
Impact on: 5.0% 12.5% 20.0%
Cotlook A Index (USD/lbs) 0.57 0.03 0.07 0.11
Mali Export Price FCFA/kg of cotton fiber1 662 33.1 82.8 132.4
Mali Farm Price FCFA/kg of seed cotton 160 8.3 20.7 33.1
Change if world price increases by:Average
2005 value
1. Cotlook A Index converted to FCFA at average 2005 FCFA/USD rate of 527.
Source: OECD calculations based on data reported in Alston, Sumner and Brunke, 2007.
Continuing to use the middle of the range estimate of world market price impact
(12.5%) gives an associated farm price impact of 20.7 FCFA per kilogram (bottom row,
middle column entry in Table A3.2.), a gain of roughly 13% on the average producer
price of cotton in 2005.
Income and poverty impacts
Anderson and Valenzuela (2007) is one of the few studies to address farm income
effects of cotton subsidies. They estimate using the GTAP model that eliminating all
cotton subsidies and import tariffs globally would raise the price of cotton in international
markets by 12.9% and the net incomes of cotton farmers in the Sub-Saharan region that
includes Mali by just over 30%.
Mesplé-Somps, et al. (2008) use Mali‟s ELIM 2006 household survey data to
simulate directly the effects of variations in cotton prices on poverty, allowing for
resource adjustments that differ for the short versus the long term. Results are
summarized in Table A3.3.
Table A3.3. Simulated poverty impacts of cotton price changes
Short term Long term Short term Long term
Cotton farmers 53.7 57.2 56.4 47.7 46.7
National 43.8 44.4 44.3 42.7 42.5
Poverty rate if cotton prices were:
Reduced by 25% Increased by 25%
2006
Poverty
Source: Mesplé-Somps et al., 2008.
Their findings suggest that a 25% increase in the farmer price of cotton in Mali would
reduce the poverty rate amongst cotton farmers by 7 percentage points from 53.7% to
46.7% in the long term. The corresponding estimates for the national poverty rate are
43.8% and 42.5%, a reduction of 1.3%. In interpreting these findings recall that the
estimated (mid-range) farm price impact from eliminating OECD cotton subsidies was
13%.
References – 59
AGRICULTURAL PROGRESS IN CAMEROON, GHANA AND MALI: WHY IT HAPPENED AND HOW TO SUSTAIN IT
References
Alston, Sumner and Brunke (2007), Impacts of Reductions in US Cotton Subsidies on
West African Cotton Producers, Oxfam America, Boston.
Alston, J.M., M.A. Andersen, J.S. James, and P.G. Pardey (2008), “U.S. Agricultural
Productivity Growth and the Benefits from Public R&D Spending: A Reassessment”
Manuscript in preparation, February 2008 (forthcoming).
Andersen, K. and E. Valenzuela (2006) “WTO‟s Doha Cotton Initiative: Who Would
Gain from Subsidy and Tariff Cuts?”, Washington, DC: World Bank, February.
Baffes, J. (2005), “The Cotton Problem”, World Bank Research Observer 20(1): 109-43,
Spring.
Coulombe, H., and Q. Wodon, (2007), “Ghana CEM: Meeting the Challenge of
Accelerated and Shared Growth - Poverty, Livelihoods and Access to Basic Services
in Ghana”, World Bank.
DNSI (2004), “Enquête malienne sur l‟évaluation de la pauvreté (EMEP), Principaux
résultants”, Direction Nationale de la Statistique et de l‟Informatique, République du
Mali.
DNSI (2007), « Tendance et déterminants de la pauvreté au Mali (2001-2006) » Direction
Nationale de la Statistique et de l‟Informatique, République du Mali.
Fan, S., P. Hazell, P. and S. Thorat, (2000), “Government spending, agricultural growth
and poverty in rural India”, American Journal of Agricultural Economics 82
(November 2000):1038-51.
Ghana Statistical Service (1995), “Ghana Living Standards Survey. Report of the Third
Round (GLSS 3). September 1991 – September 1992”, Ghana Statistical Service,
Accra.
Ghana Statistical Service (2000), “Ghana Living Standards Survey. Report of the Fourth
Round (GLSS 4)”, Ghana Statistical Service, Accra.
Ghana Statistical Service (2006), “Ghana Living Standards Survey, 2005-2006”, Ghana
Statistical Service, Accra.
INS (1997), “Enquete camerounaise auprès des ménages, Conditions de vie des ménages
au Cameroun en 1996”, L‟Institut national de la statistique, République du Cameroun.
INS (2002), « ECAM II - Deuxième enquête camerounaise auprès des ménages Agricoles
au Cameroun, profil de pauvreté en milieu rural au Cameroun en 2001 », L‟Institut
national de la statistique, République du Cameroun.
INS (2002), « Évolution de la pauvreté au Cameroun entre 1996 et 2001 », L‟Institut
national de la statistique, République du Cameroun.
60 – References
AGRICULTURAL PROGRESS IN CAMEROON, GHANA AND MALI: WHY IT HAPPENED AND HOW TO SUSTAIN IT
InterAcademy Council (2004), Realizing the Promise and Potential of African
Agriculture: Science and Technology Strategies for Improving Food Security and
Agricultural Productivity in Africa, Royal Netherlands Academy of Arts and Sciences,
Amsterdam, The Netherlands.
Krueger, A. O., M. Schiff and A. Valdés (1988), “Measuring the Impact of Sector-
Specific and Economy-Wide Policies on Agricultural Incentives in LDCs”, World
Bank Economic Review 2(3): 255-272.
Liapis, P., (2007), Preferential Trade Agreements: How much do they benefit developing
economies? OECD Paris.
Mesplé-Somps, S., A. Robilliard, J. Gräb, D. Cogneau and M. Grimm (2008), « Impact
de la culture du coton sur les conditions de vie des ménages: Étude sur le Mali et le
Burkina Faso » DIAL, Paris.
OECD (2007), Agricultural Policy and Trade Reform: Potential Effects at Global,
National and Household Levels, OECD, Paris.
Sumner, D.A. (2007), “U.S. Farm Programs and African Cotton”, International Food &
Agricultural Trade Policy Council, IPC Issue Brief 22, February 2007.
Wodon, Q., Briand, V., Labaste, P., Nouve, K. and Sangho, Yeyande, (2006) “Cotton and
Poverty in Mali”, World Bank Working Paper, Draft, Washington, DC: World Bank,
p 31.
World Bank (2007), “Agriculture for Development”, World Development Report 2008,
World Bank, Washington, DC.