Embed Size (px)
Citation preview

r d


( s e e St o n e m a n P. a n d G . B a t t i st i (2 0 1 0 ) ‘T h e D i f fu s i o n o fN e w T e c h n o l o g y ‘C h a pt e r 3 o f P a rt I V o fB r o n w y n H H a l l a n d N a t h a n R o s e n b e r g ( e d s . ) “H a n d bo o k o ft he Ec o n o m i c s o fT e c h n i c a lC h a n ge ”N o rt h H o l l a n d, E l s e v i e r ) .

Graph 3. The diffusion of unleaded petrol in the EU
0.4
0.6
0.8
1
0
0.2
0.4
8501 8607 8801 8907 9101 9207 9401 9507
Belgium Denmark France Greece
Ireland Italy Lux Neth
Portugal Spain UK WG
Source: Battisti and Stoneman (2000, 1999, 2001), OEP,RP,L

0.3
0.4
0.5
0
0.1
0.2
0.3
1979
1980
1981
1982
1983
1984
1985
1986
1987
1988
1989
1990
1991
1992
1993
1994
1995
1996
1997
1998
United Kingdom United States Australia

•
•
•

The diffusion of PC in Europe
0.2
0.3
0.4
0.5
0
0.1
1985 1986 1987 1988 1989 1990 1991 1992 1993 1994 1995 1996 1997 1998
Austria Belgium Denmark Finland
France Germany Greece Ireland
Italy Netherlands Norway Portugal
Spain Sweden Switzerland United Kingdom
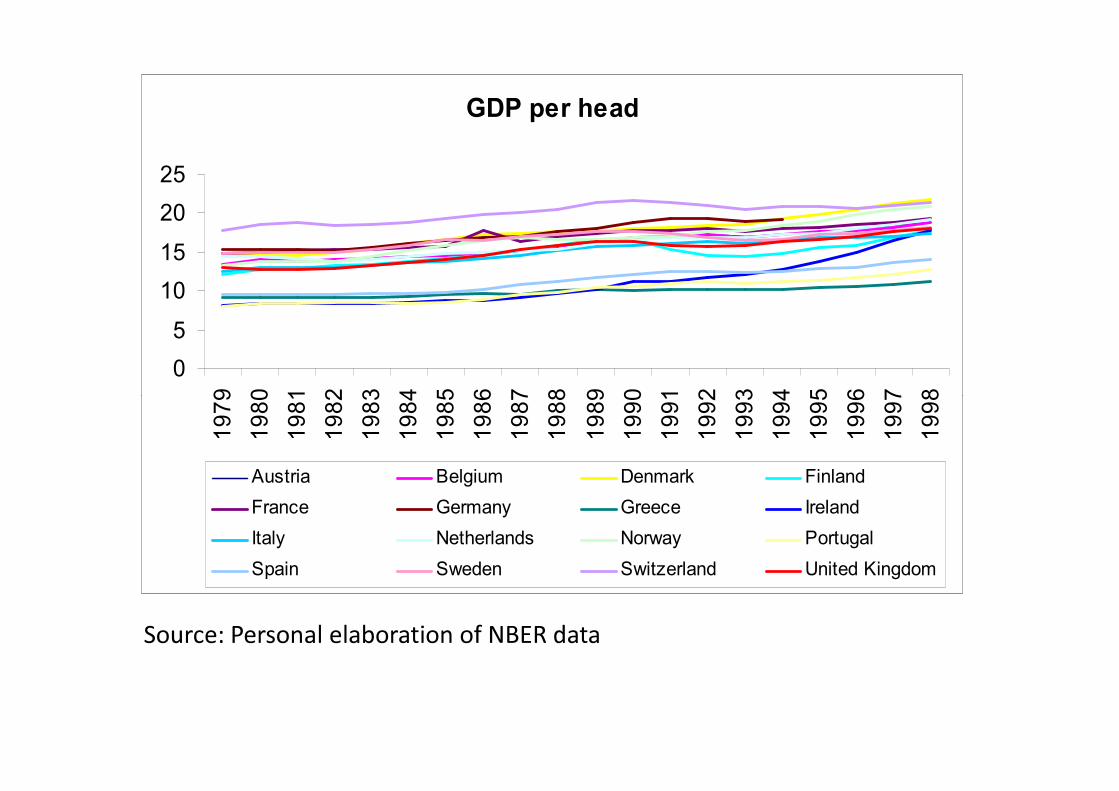
GDP per head
0
5
10
15
20
25
1979
1980
1981
1982
1983
1984
1985
1986
1987
1988
1989
1990
1991
1992
1993
1994
1995
1996
1997
1998
1979
1980
1981
1982
1983
1984
1985
1986
1987
1988
1989
1990
1991
1992
1993
1994
1995
1996
1997
1998
Austria Belgium Denmark Finland
France Germany Greece Ireland
Italy Netherlands Norway Portugal
Spain Sweden Switzerland United Kingdom
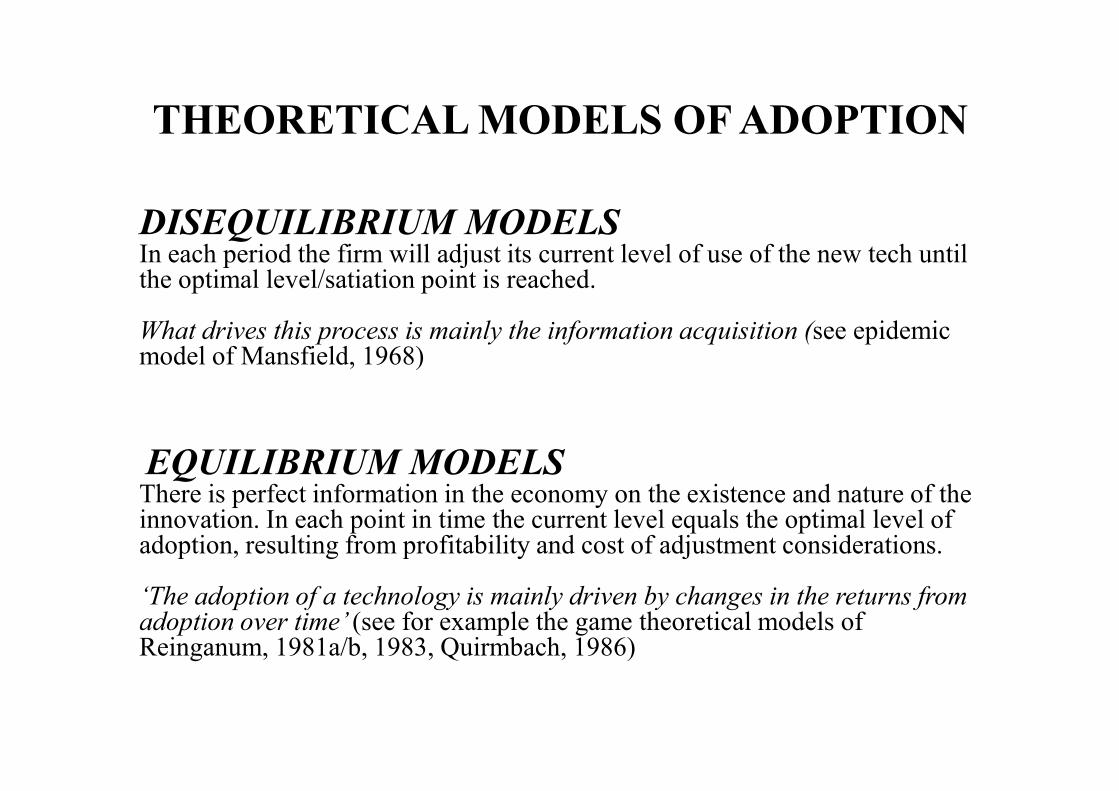
THEORETICAL MODELS OF ADOPTION
DISEQUILIBRIUM MODELS In each period the firm will adjust its current level of use of the new tech until the optimal level/satiation point is reached.
What drives this process is mainly the information acquisition (see epidemic model of Mansfield, 1968)
EQUILIBRIUM MODELSThere is perfect information in the economy on the existence and nature of the innovation. In each point in time the current level equals the optimal level of adoption, resulting from profitability and cost of adjustment considerations.
‘The adoption of a technology is mainly driven by changes in the returns from adoption over time’ (see for example the game theoretical models of Reinganum, 1981a/b, 1983, Quirmbach, 1986)

DISEQUILIBRIUM MODELS.
EPIDEMIC APPROACH
dtMNN
MdM t
tt )( −= β
)(exp1
1
tN
M t
βα +−+=
α α α α = date of initial contact
β= speed of diffusion (can be a function of firm specific and environmental factors)
1 = saturation level (100% adopters)
Inter firm literature: Mansfield 1968, 1989, Romeo 1977, Chow 1967,
Davies 1979, Griliches 1980, Dixon 1980, etc.
Marketing Literature: Bass 1969, Mahajan and Wind 1980, etc.

EQUILIBRIUM MODELS OF DIFFUSION
RANK Approach (David 1991, Davies 1979, Bonus 1973, etc.)
Firms can be ranked in terms of the benefits to be obtained from adoption as
adopters are different is some important dimensions (Size, Age, etc.)
NB Benefits from adoption independent of the number of users
and mostly determined by the firm ‘s characteristics.
STOCK Approach (Reiganum 1981, Quirmbach 1986,etc.) and
ORDER Approach (Funderberg and Tirole 1985, Ireland and Stoneman
1985 etc.)
The position in the adoption order determines the gross return from adoption. Firms
high in the adoption order get greater return than those lower down in the adoption
order. NB The larger the number of users the lower the gross benefits from adoption
EVOLUTIONARY APPROACH TO DIFFUSION(Nelson and Winter 1982, Metcalfe 1988, Dosi 1982, 1988, etc)
Diffusion is the outcome of competitive selection across technologies

de f. T H E I N T E R F I R M D I F F U S I O NT he p r o ce s s le a d in g t he f i r m t o a d o p t f o r t he f i r s t t i me a t le a s t on e u n i t o f a n e w te c hn o l o g y( Gr i l ic he s 1 95 7, Ma n s f ie l d 1 9 6 3 a /b , 1 9 6 8 , 1 9 9 3 , D a v ie s 1 9 7 9 , e tc )de f. T H E I N T R A F I R M D I F F U S I O NT he p r o ce s s le a d in g a f i r m t o e x te n s iv e l y u se t he n e w te c hn o l o g y s t a r t in g f r o m a p o in t i m me d i a te l ya f te r f i r s t a d o p t i on u n t i l d i f f u s i on i s c o m p le te d f o r t h a t f i r m (M a n s f ie l d 1 9 6 8, Sto ne m a n 1 9 8 1 ,B a t t i st i ( 2 0 0 0 ) , B a t t i st i a n d Sto ne m a n , 2 0 05 , e tc )E M P I R I C A L R E G U L A R I T I E S ( se e B a t t i s t i a n d S t on e m a n, 2 0 0 3 * )- i n t e r f i r m d i f fu s io n i s no t a go o d i n d ic a to ro fo ve r a l l d i f fu s io n- i n d u st r y d i f fu s io n t a ke s lo n ge r a n d i s s lo we r t h a n i n t e r f i r m d a t a m i g h t s u g ge st- i fo ne w a n t e d to u n d e r st a n d t he d e t e r m i n a n t so f i n no v a t io n s p re a d i n g t he n i n t r a - f i r m d i f fu s io n i s a si m po rt a n t a s i n t e r - f i r m d i f fu s io n- I n t r a - f i r m d i f fu s io n do e s no t ne c e s s a r i l y fo l lo w a n S - s h a pe p a t t e r n t y p ic a lo f e p i d e m ic -d i se q u i l i b r i u m t y pe - mo d e l s ( a s m a n y be l ie ve ! )- t he a do p t io n d r i ve r s o f i n t e r a n d i n t r a f i r m d i f fu s io n a re d i f fe re n t- fe w st u d ie s lo o k a t t he i n t r a - f i r m d i f fu s io n*Ba t t is t i G.a n d S to n e ma n P. (2 0 0 3 )‘ I n t e r F i r ma n d I n t ra F i r m E f f e c ts i n t h e D i f fu s i o n o f N e w P ro c e s sT e c h n o lo g i e s ’, R e s ea r c h Po l i c y Vo l. 3 2 , I s s u e 8 , p p . 1 6 4 1- 1 6 5 5 .
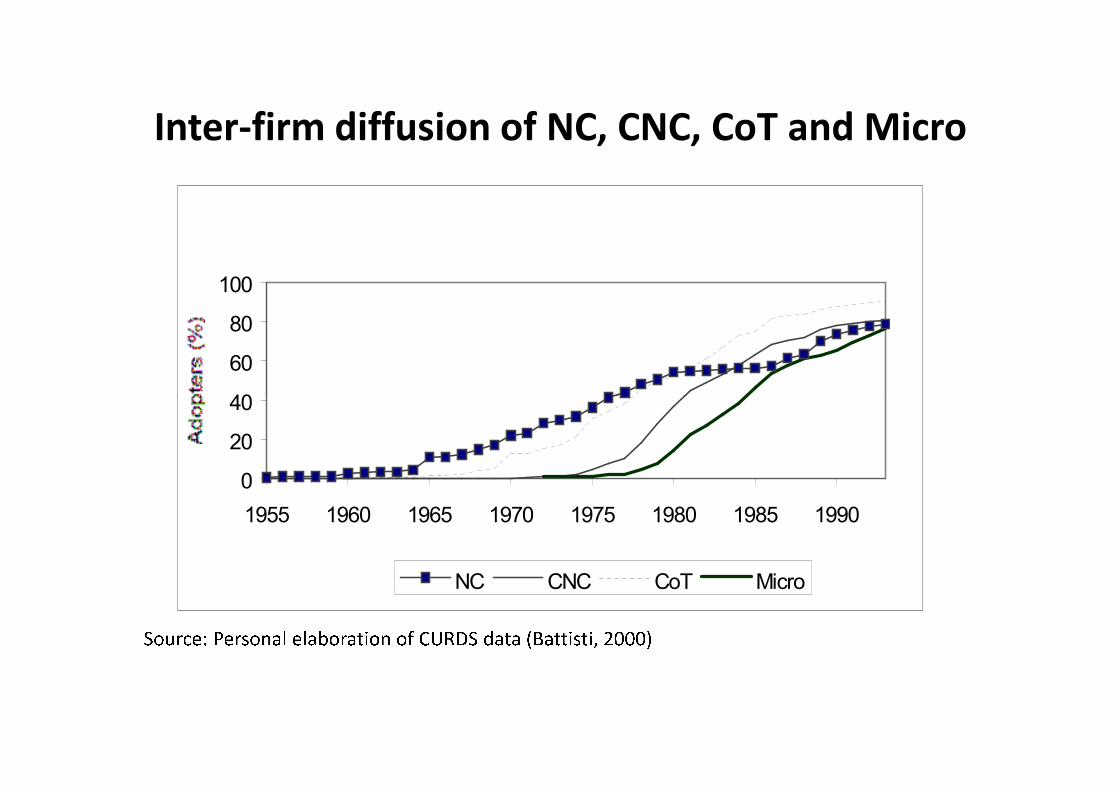
40
60
80
100
0
20
40
1955 1960 1965 1970 1975 1980 1985 1990
NC CNC CoT MicroS o u r c e : P e r s o n a l e l a b o r a t i o n o fC U R D S d a t a ( B a t t i st i, 2 0 0 0 )

20
25
30
35
Percentage of adopting firms
0
5
10
15
20
0 6-10 16-20 26-30 36-40 46-50 56-60 66-70 76-80 86-90 96-99
Percentage of machine tool stock incorporating technology j
Percentage of adopting firms
NC(%) MICRO(%) CNC(%) CoT(%)

Non users(%)
Basic users(%)
Enhanced users (%)
Row Total =100%Coun t
All firms 16.8 57.53 25.63 8173
Within industry distribution of use (within industry proportion of adopters)
Sic 92 description10-14 Mining and quarryin g 22.0 66.9 11.0 127
15-22 Manufacturing of food, clothing, wood, paper, publish & print
17.8 56.3 25.9 1005
23-29 Manufacturing of fuels, chemicals, plastic metals & minerals
14.5 56.6 28.9 1121
30-33 Manufacturing of electrical and optical equipments
5.1 63.4 31.5 527
34-35 Manufacturing of transport equipments
8.1 66.6 25.3 344
36-37 Manufacturing not elsewhere classified
16.0 65.5 18.5 443
40-41 Electricity, gas & water supply 13.2 62.3 24.5 53
Source: Personal elaboration of CIS3 (2003 community innovation survey)in Battisti and Stoneman (2009) Profitability, Externalities and Policy in the Inter and Intra Firm Adoption of New
Technology: the Example of E-Business Activities in the UK, Research Policy, 38 (1), 133-143
40-41 Electricity, gas & water supply 13.2 62.3 24.5 53
45 Construction 28.8 57.1 14.0 947
51 Wholesale Tra de (incl cars & bikes)
16.5 54.9 28.6 1041
60-64 Transport, storage & communication
20.3 50.5 29.2 773
65-67 Financial intermediation 13.3 54.3 32.3 405
70-74 Real estate, renting & business activities
15.7 58.3 26.0 1386
Total 16.8 57.5 25.6 8173
Usage by size (number of employees)
10-49 22.9 53.5 23.7 476150-249 9.4 65.2 25.3 2023
250 -499 6.5 62.3 31.2 722
500 -999 7.5 60.9 31.6 4021000+ 6.4 53.8 39.8 264
Total 16.8 57.5 25.6 8173

FIGURE 1 – DIFFUSION OF CAD AND JOD IN ITALY
Percentage of adopting plants
80 90
Source: Personal elaboration based on FLAUTO data
see Battisti G., Colombo M.G., Rabbiosi L. (2005) 'Complementarity effects in the simultaneous diffusion of technological
and organisational innovations', WP.05.03, Quaderni CIRET, pp.1-29, CIRET-Depr of Managerial Engineering,
Politecnico University of Milano -Italy.
Percentage of adopting plants
Year
0
10 20 30 40 50 60
70 80
70 72 74 76 78 80 82 84 86 88 90 92 94 96
CAD JOD

COMPLEMENTARITY
The IT productivity paradox…
The simple adoption of IT does not lead to significant productivity changes if not paired with organizational changes and new changes if not paired with organizational changes and new products and processes. (Milgrom and Roberts 1991, 1995, Bresnahan et al. 2002, Greenan 2003, Colombo Del Mastro 2003, Battisti and Stoneman 2009, etc.)
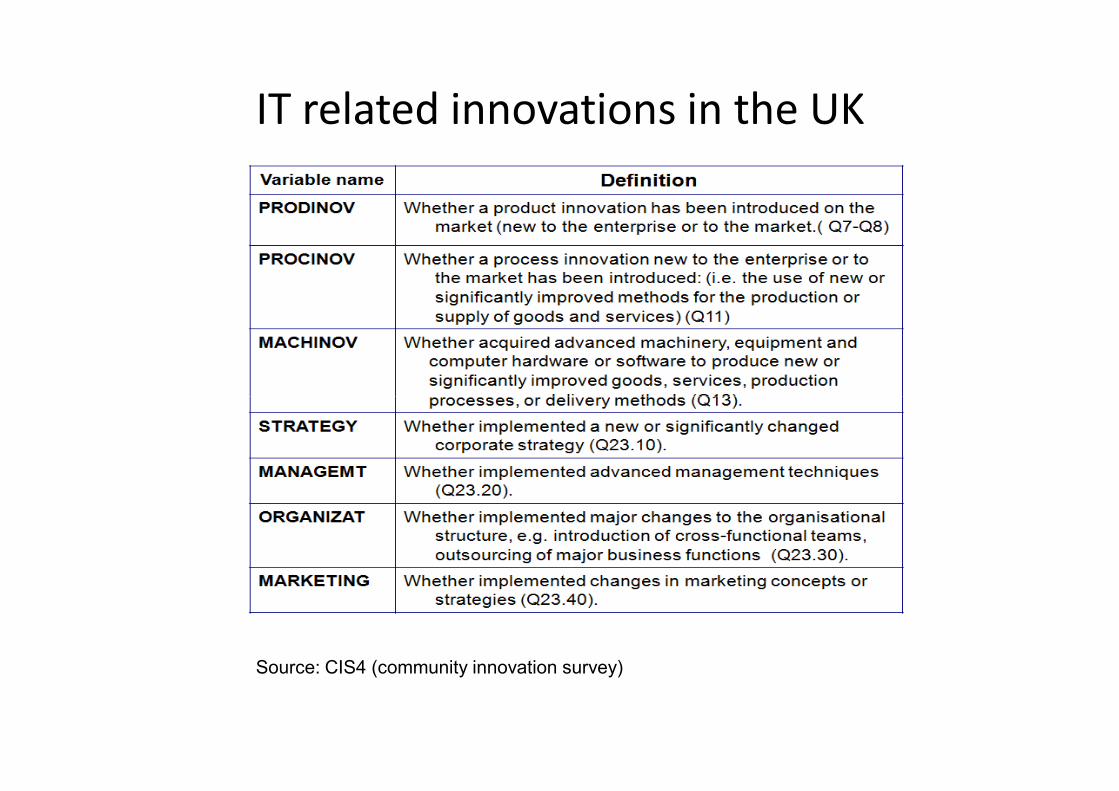
Source: CIS4 (community innovation survey)

INTENSITY OF USE IN THE UK
(low, medium and high intensive users)
-0.50
0.00
0.50
1.00
1.50
2.00StF
1
Simultaneous 95% Confidence Intervals for Means
1 2 3
Cluster
-1.00
Reference Line is the Overall Mean = -.0363
Managem Strategy Organiz Marketing Prodinov Procinov Machinov
Cluster 1 1.5 1.2 2.0 1.6 6.0 1.3 22.3
Cluster 2 18.7 20.7 25.8 27.8 48.2 32.4 71.5
Cluster 3 59.2 69.0 73.5 74.9 76.1 62.9 84.1
Source: Personal elaboration of CIS4 (2004 community innovation survey); Observations 15657 ; in Battisti and Stoneman, (forthcoming) ‘How innovative are UK firms? Evidence from the CIS4 on synergies between
technological and organisational innovations’ British Journal of Management

•
Intra cluster firms characteristics: descriptive statistics
SizePart of a group
Internat.market for its product
Age (whether est. after 2000) R&D Training
Science degree( % )
OtherDegree (%)
Public financial support
CLUSTER 1
Mean*/prop 168.75* 0.26 0.98 0.15 0.12 0.21 2.88* 4.93* 0.04
Trimm. mean 76.84 0.24 1 0.11 0.08 0.18 0.88 2.11 0
St. dev. 756.15 0.44 0.13 0.36 0.33 0.41 11.03 14.60 0.19
Source: Personal elaboration of CIS4 (2004 community innovation survey) Observations 15657
from Battisti and Stoneman, (forthcoming) ‘How innovative are UK firms? Evidence from the CIS4 on
synergies between technological and organisational innovations’ British Journal of Management
CLUSTER 2
Mean*/prop 304.39* 0.41 0.98 0.14 0.46 0.58 7.34* 8.90* 0.14
Trimm. mean 140.93 0.40 1 0.10 0.46 0.59 4.18 5.82 0.10
St. dev. 1281.23 0.49 0.15 0.35 0.50 0.49 17.06 17.78 0.35
CLUSTER 3
Mean*/prop 470.68* 0.53 0.97 0.16 0.68 0.76 11.00* 11.46* 0.25
Trimm. mean 219.30 0.53 1 0.12 0.70 0.79 7.71 8.28 0.22
St. dev. 2148.33 0.50 0.17 0.37 0.47 0.43 20.52 19.34 0.43

‘
’

•
•
•
•
•
•