Embed Size (px)
Citation preview
ODT Workforce Design Project
Midlands Regional Collaborative 2nd December 2014
Ella Poppitt, Head of Service DesignOrgan Donation and Transplantation
NHSBT
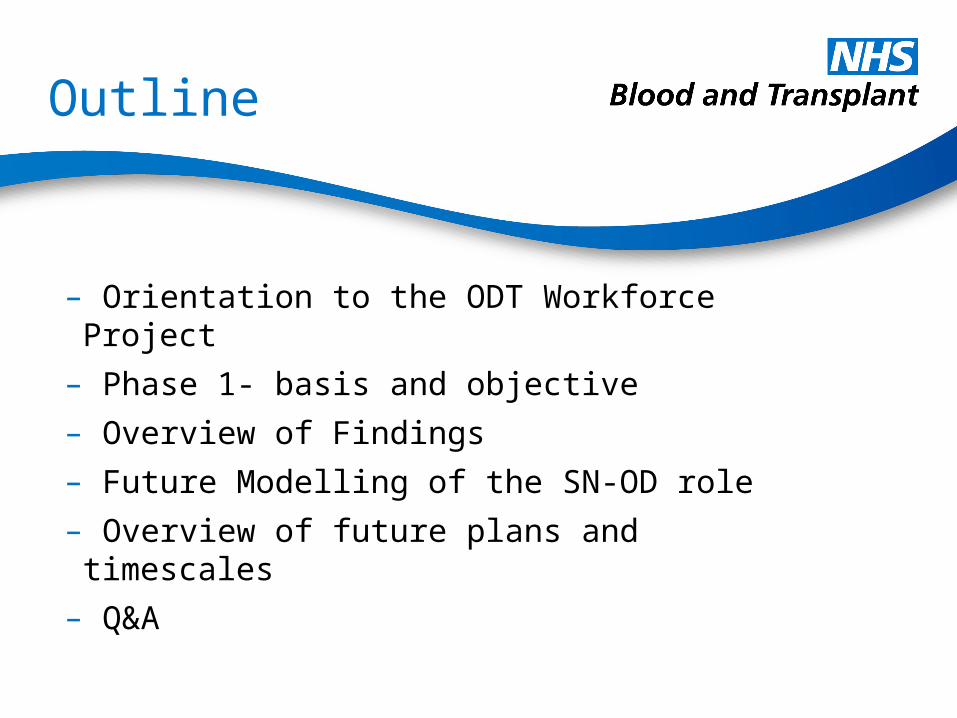
Outline
– Orientation to the ODT Workforce Project
– Phase 1- basis and objective
– Overview of Findings
– Future Modelling of the SN-OD role
– Overview of future plans and timescales
– Q&A
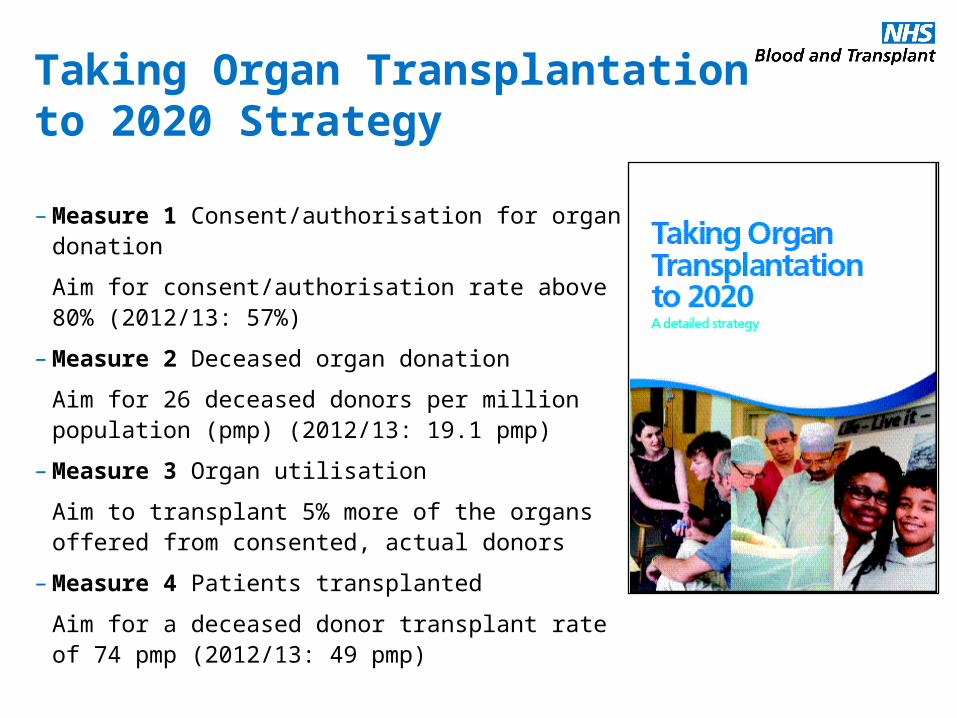
Taking Organ Transplantation to 2020 Strategy
– Measure 1 Consent/authorisation for organ donation
Aim for consent/authorisation rate above 80% (2012/13: 57%)
– Measure 2 Deceased organ donation
Aim for 26 deceased donors per million population (pmp) (2012/13: 19.1 pmp)
– Measure 3 Organ utilisation
Aim to transplant 5% more of the organs offered from consented, actual donors
– Measure 4 Patients transplanted
Aim for a deceased donor transplant rate of 74 pmp (2012/13: 49 pmp)
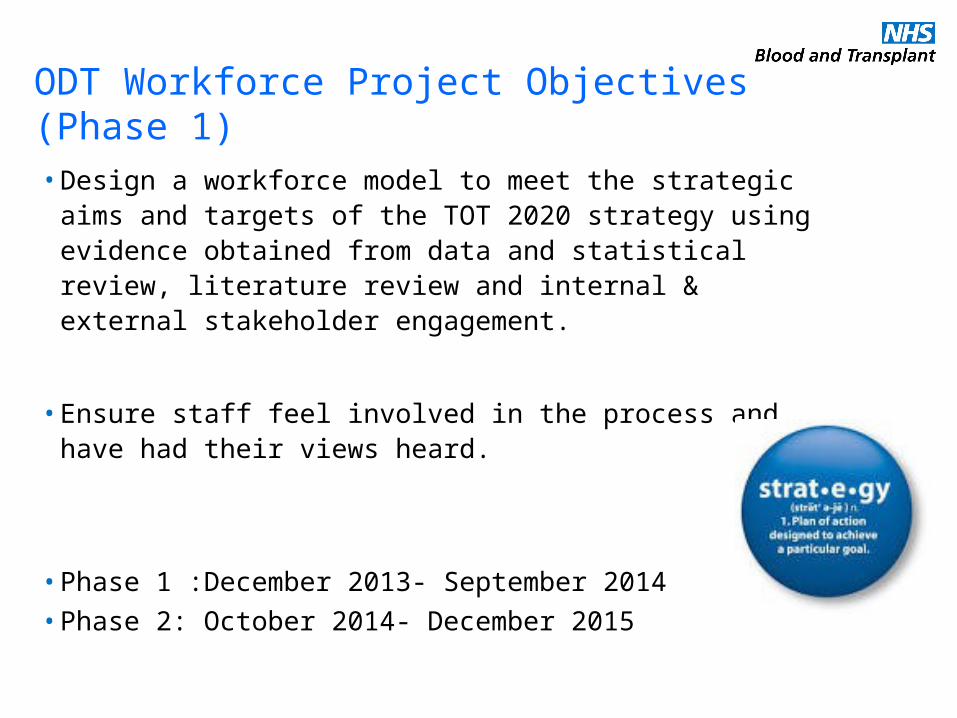
ODT Workforce Project Objectives (Phase 1)• Design a workforce model to meet the strategic aims and
targets of the TOT 2020 strategy using evidence obtained from data and statistical review, literature review and internal & external stakeholder engagement.
• Ensure staff feel involved in the process and have had their views heard.
• Phase 1 :December 2013- September 2014
• Phase 2: October 2014- December 2015
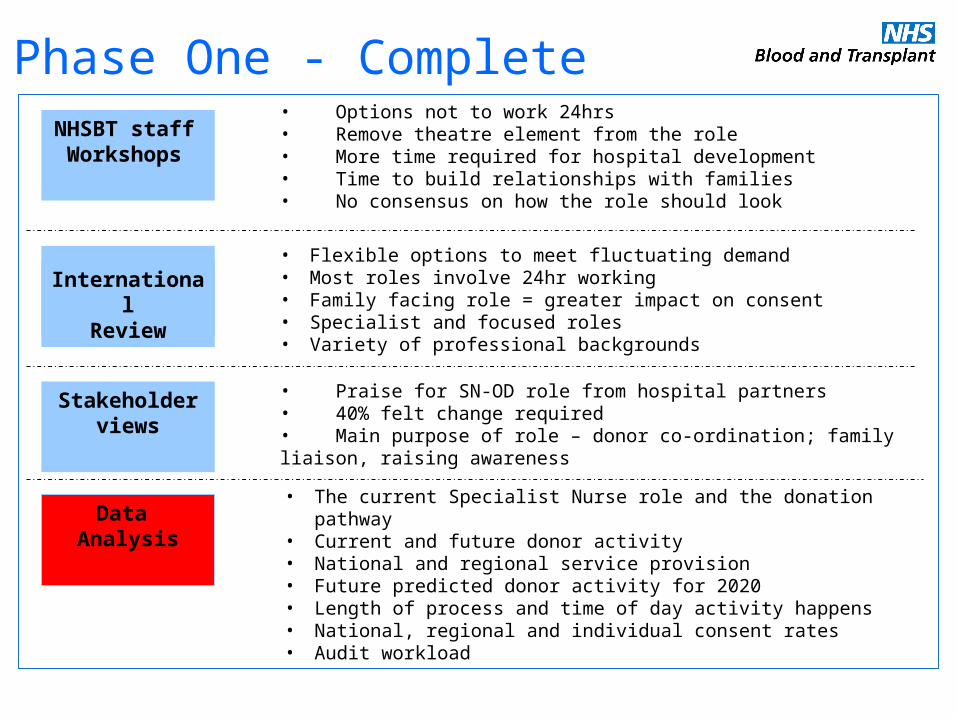
Phase One - Complete
• Flexible options to meet fluctuating demand• Most roles involve 24hr working• Family facing role = greater impact on consent• Specialist and focused roles• Variety of professional backgrounds
• The current Specialist Nurse role and the donation pathway• Current and future donor activity• National and regional service provision• Future predicted donor activity for 2020• Length of process and time of day activity happens• National, regional and individual consent rates• Audit workload
NHSBT staff Workshops
InternationalReview
Data Analysis
• Options not to work 24hrs• Remove theatre element from the role• More time required for hospital development• Time to build relationships with families• No consensus on how the role should look
• Praise for SN-OD role from hospital partners• 40% felt change required• Main purpose of role – donor co-ordination; family liaison, raising awareness
Stakeholder views

Statistics & Data Review for the Workforce Project
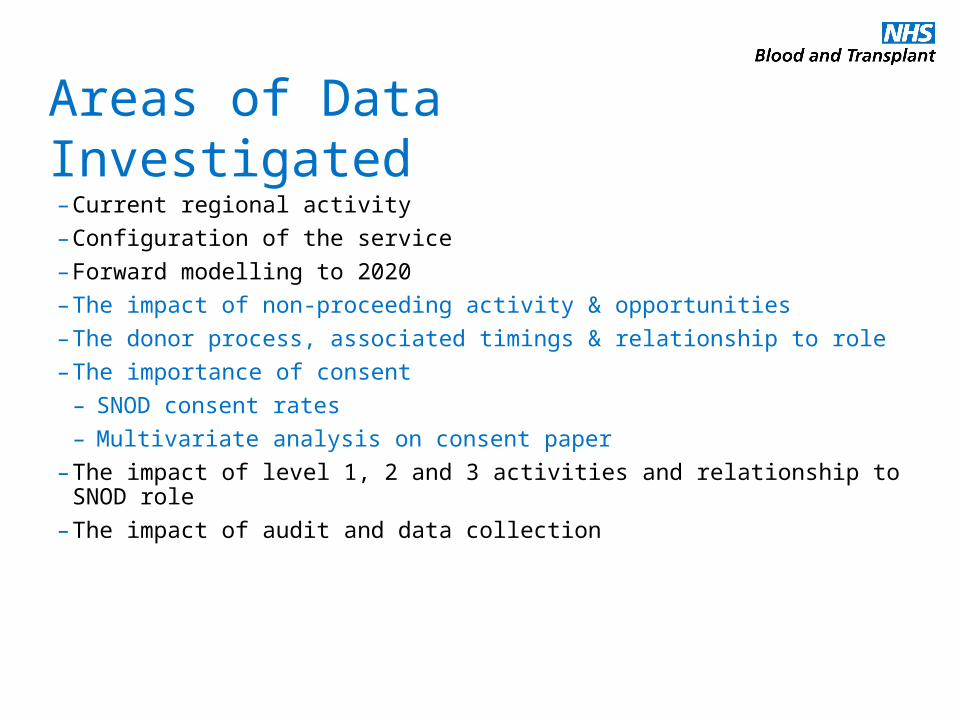
Areas of Data Investigated
– Current regional activity
– Configuration of the service
– Forward modelling to 2020
– The impact of non-proceeding activity & opportunities
– The donor process, associated timings & relationship to role
– The importance of consent
– SNOD consent rates
– Multivariate analysis on consent paper
– The impact of level 1, 2 and 3 activities and relationship to SNOD role
– The impact of audit and data collection
Number of potential DBD and/or eligible DCD by team, from 1 April 2013 to 31 March 2014 (PDA data as at 9 April 2014)
514
738
812
622
369
215
393
473457
321
377
439
0
100
200
300
400
500
600
700
800
900
Eastern London Midlands North West Northern NorthernIreland
Scotland SouthCentral
South East South Wales South West Yorkshire
Organ Donation Services Team
Num
ber
of p
oten
tial
DBD
and
/or
elig
ible
DCD
Regional Profile of Donation Potential
0
20
40
60
80
100
120
140
160
Pote
ntial
DBD
and
/or e
ligib
le D
CD
Trust/Boards with at least one potential DBD and/or eligible DCD
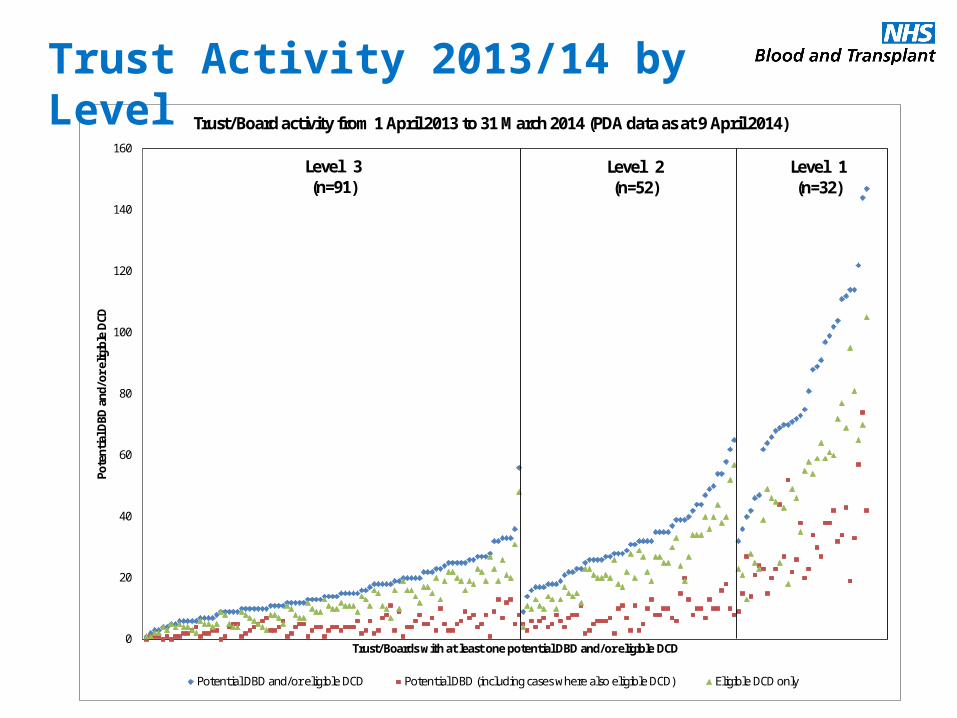
Trust/Board activity from 1 April 2013 to 31 March 2014 (PDA data as at 9 April 2014)
Potential DBD and/or eligible DCD Potential DBD (including cases where also eligible DCD) Eligible DCD only
Level 3(n=91)
Level 2(n=52)
Level 1(n=32)
Trust Activity 2013/14 by Level
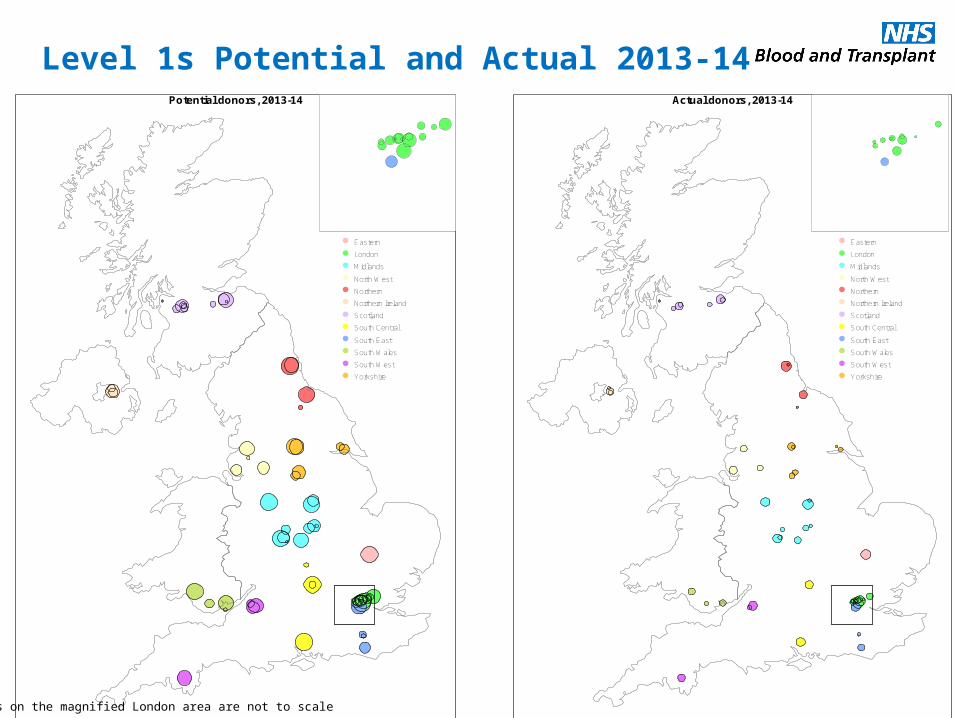
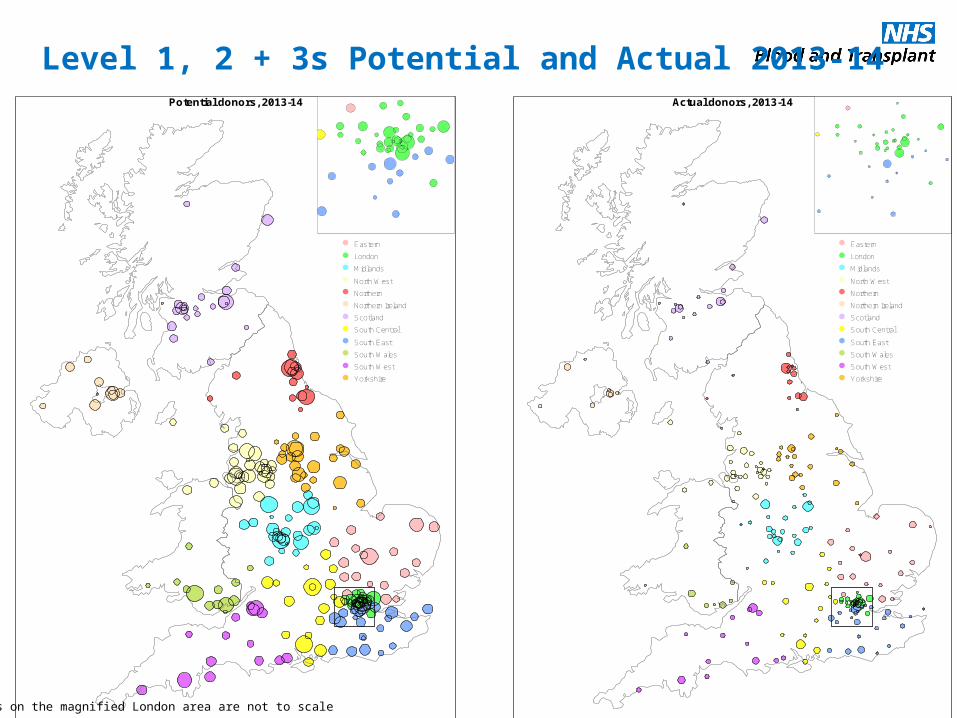
Actual donors, 2013-14
Eastern
London
Midlands
North West
Northern
Northern Ireland
Scotland
South Central
South East
South Wales
South West
Yorkshire
Potential donors, 2013-14
Eastern
London
Midlands
North West
Northern
Northern Ireland
Scotland
South Central
South East
South Wales
South West
Yorkshire
The dots on the magnified London area are not to scale
Level 1s Potential and Actual 2013-14
Actual donors, 2013-14
Eastern
London
Midlands
North West
Northern
Northern Ireland
Scotland
South Central
South East
South Wales
South West
Yorkshire
Potential donors, 2013-14
Eastern
London
Midlands
North West
Northern
Northern Ireland
Scotland
South Central
South East
South Wales
South West
Yorkshire
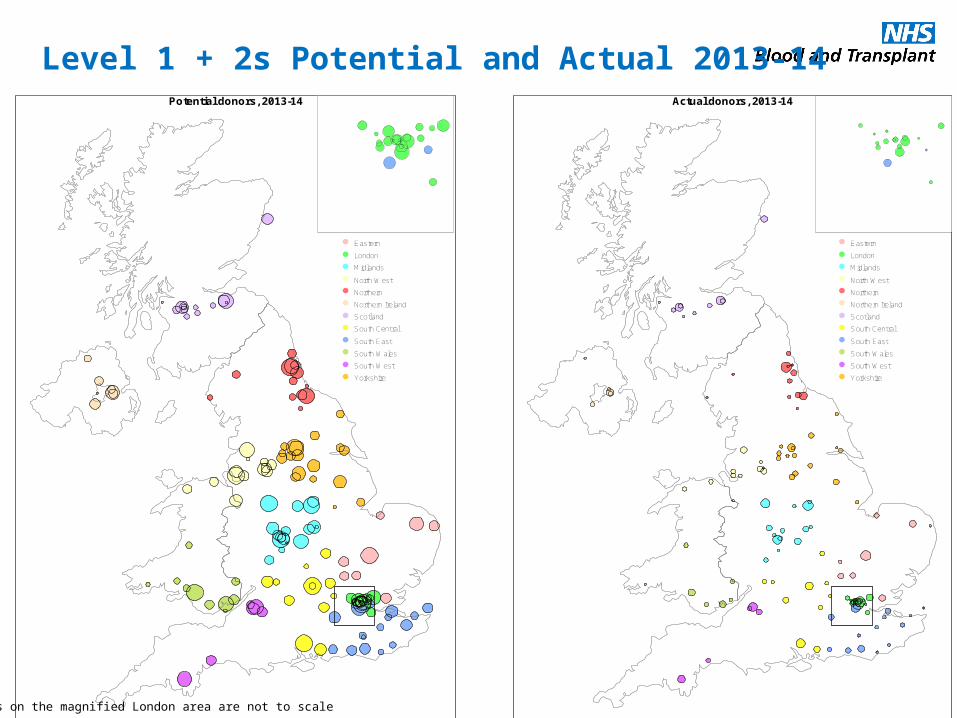
The dots on the magnified London area are not to scale
Level 1 + 2s Potential and Actual 2013-14
Actual donors, 2013-14
Eastern
London
Midlands
North West
Northern
Northern Ireland
Scotland
South Central
South East
South Wales
South West
Yorkshire
Potential donors, 2013-14
Eastern
London
Midlands
North West
Northern
Northern Ireland
Scotland
South Central
South East
South Wales
South West
Yorkshire
The dots on the magnified London area are not to scale
Level 1, 2 + 3s Potential and Actual 2013-14
1.6
1.5
2.3
1.4
3.0
4.8
2.3
3.3
0.5
0.5
0.5
0.5
12.5
15.8
10.3
14.4
3.9
3.9
2.1
1.5
Proc 2010/11 (n=388)
Proc 2013/14 (n=586)
Non-proc 2010/11 (n=10)
Non-proc 2013/14 (n=9)
Hours
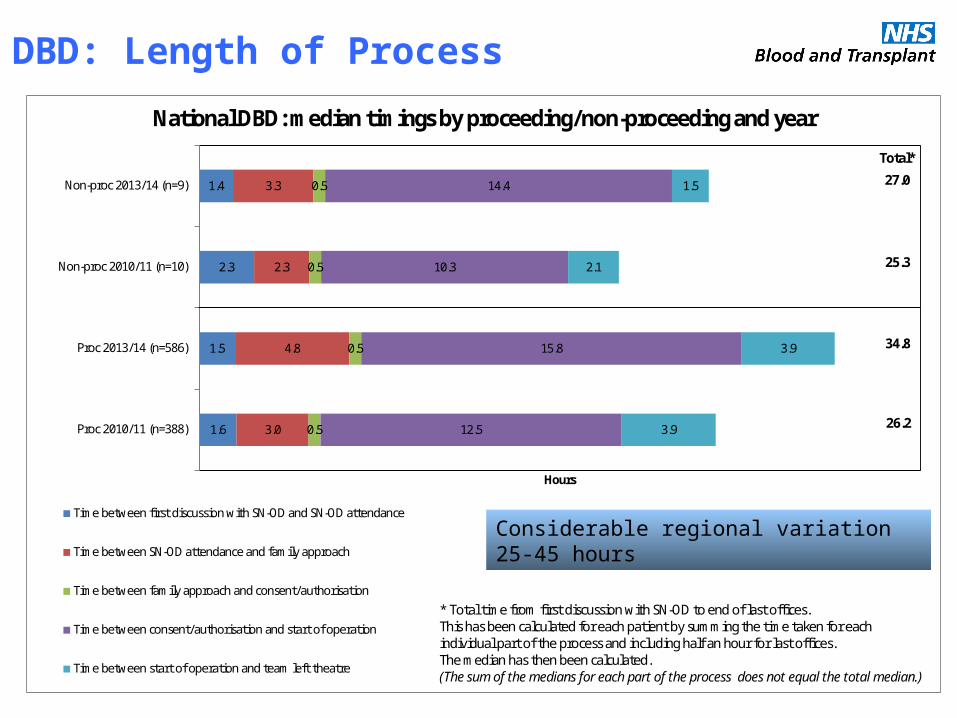
National DBD: median timings by proceeding/non-proceeding and year
Time between first discussion with SN-OD and SN-OD attendance
Time between SN-OD attendance and family approach
Time between family approach and consent/authorisation
Time between consent/authorisation and start of operation
Time between start of operation and team left theatre
27.0
25.3
34.8
26.2
Total*
* Total time from first discussion with SN-OD to end of last offices. This has been calculated for each patient by summing the time taken for each individual part of the process and including half an hour for last offices. The median has then been calculated. (The sum of the medians for each part of the process does not equal the total median.)
DBD: Length of Process
Considerable regional variation 25-45 hours
1.1
1.2
1.0
0.9
2.0
2.0
1.2
2.0
0.5
0.5
0.5
0.5
8.8
12.2
8.6
11.6
2.4
2.6
2.1
3.3
Proc 2010/11 (n=191)
Proc 2013/14 (n=342)
Non-proc 2010/11 (n=128)
Non-proc 2013/14 (n=210)
Hours
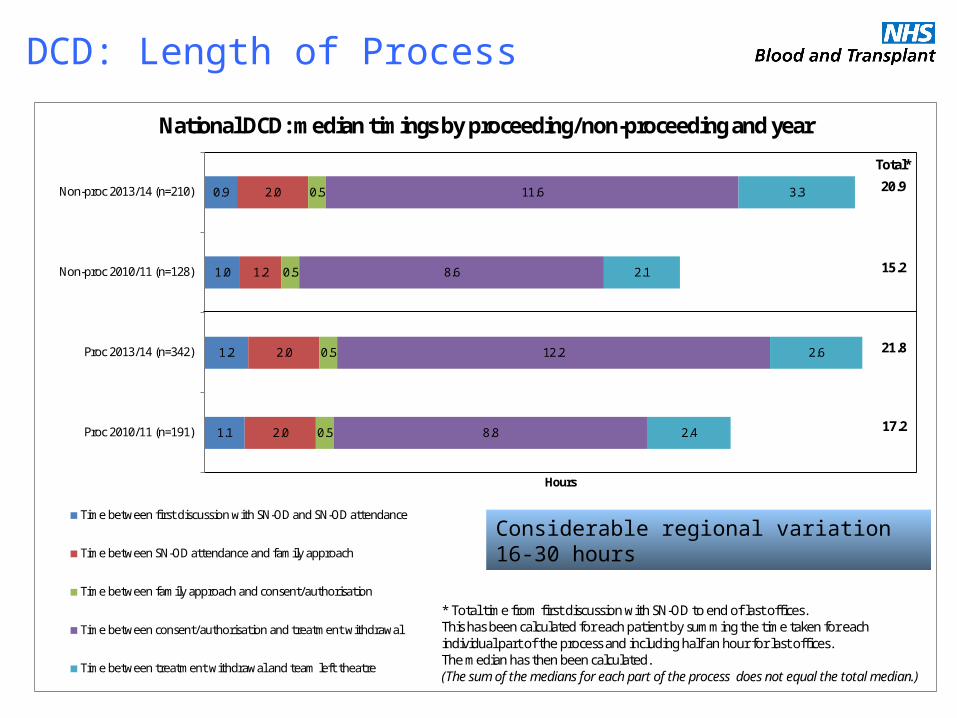
National DCD: median timings by proceeding/non-proceeding and year
Time between first discussion with SN-OD and SN-OD attendance
Time between SN-OD attendance and family approach
Time between family approach and consent/authorisation
Time between consent/authorisation and treatment withdrawal
Time between treatment withdrawal and team left theatre
20.9
15.2
21.8
17.2
Total*
* Total time from first discussion with SN-OD to end of last offices. This has been calculated for each patient by summing the time taken for each individual part of the process and including half an hour for last offices. The median has then been calculated. (The sum of the medians for each part of the process does not equal the total median.)
DCD: Length of Process
Considerable regional variation 16-30 hours
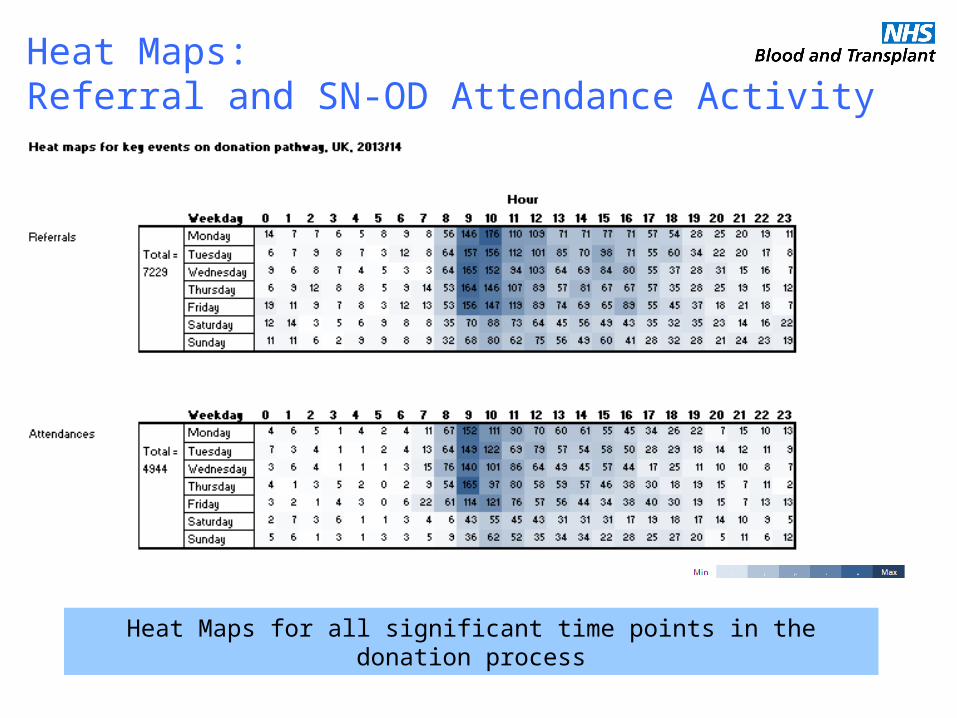
Heat Maps:Referral and SN-OD Attendance Activity
Heat Maps for all significant time points in the donation process
Consent Rate Multivariate Analysis
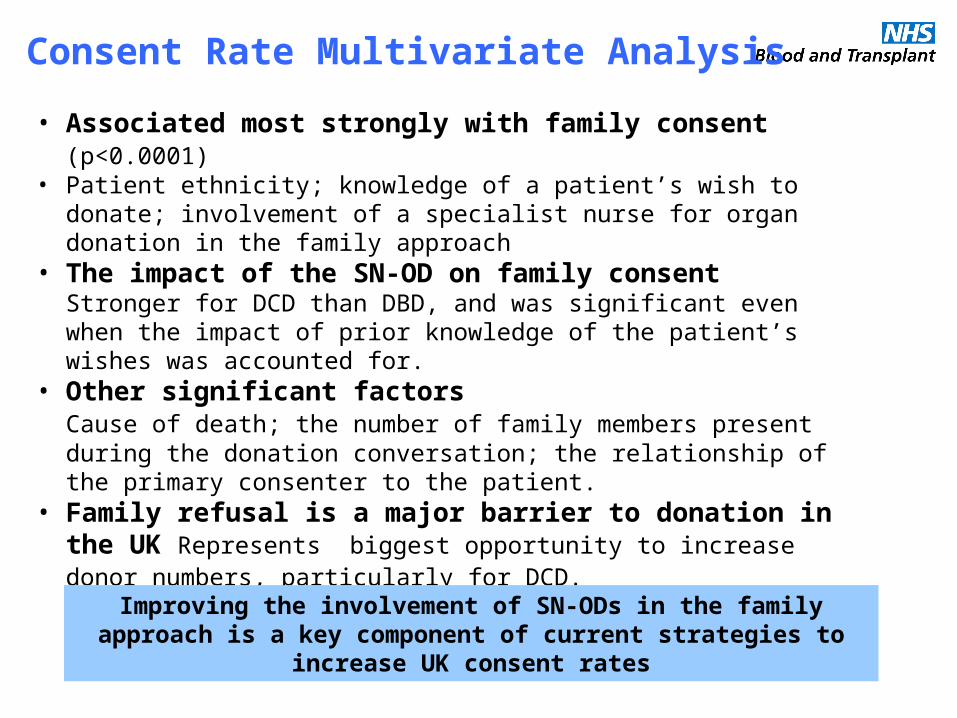
• Associated most strongly with family consent (p<0.0001) • Patient ethnicity; knowledge of a patient’s wish to donate; involvement of a
specialist nurse for organ donation in the family approach• The impact of the SN-OD on family consent
Stronger for DCD than DBD, and was significant even when the impact of prior knowledge of the patient’s wishes was accounted for.
• Other significant factors Cause of death; the number of family members present during the donation conversation; the relationship of the primary consenter to the patient.
• Family refusal is a major barrier to donation in the UK Represents biggest opportunity to increase donor numbers, particularly for DCD.
Improving the involvement of SN-ODs in the family approach is a key component of current strategies to increase UK consent rates
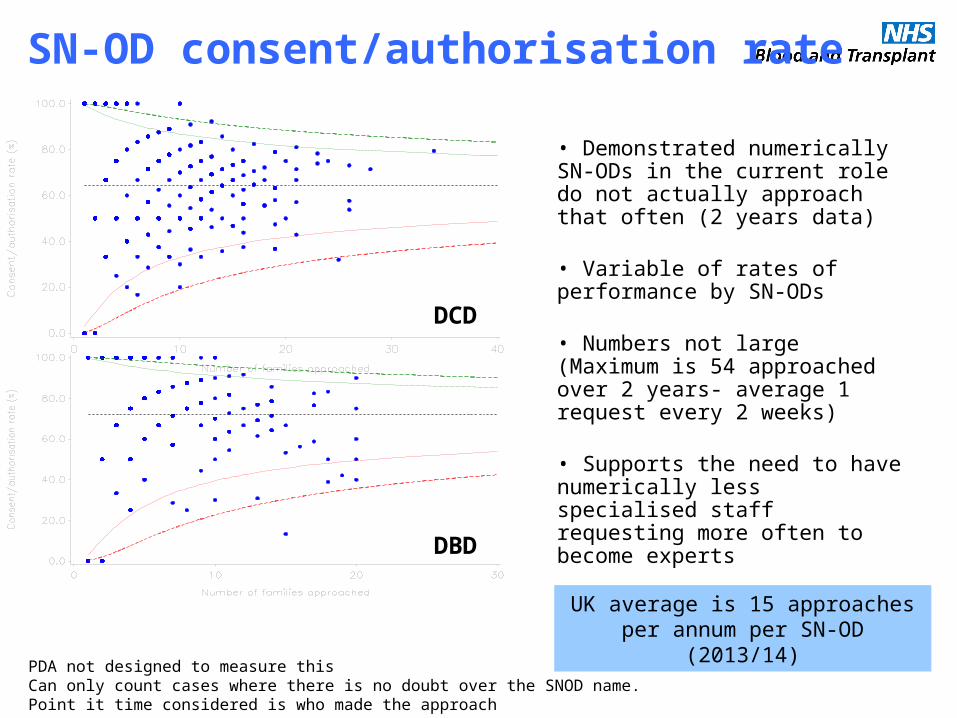
SN-OD consent/authorisation rate
DCD
DBD
• Demonstrated numerically SN-ODs in the current role do not actually approach that often (2 years data)
• Variable of rates of performance by SN-ODs
• Numbers not large (Maximum is 54 approached over 2 years- average 1 request every 2 weeks)
• Supports the need to have numerically less specialised staff requesting more often to become experts
• Impact on consent if you separate the requestor from the facilitator?
PDA not designed to measure thisCan only count cases where there is no doubt over the SNOD name.Point it time considered is who made the approach
UK average is 15 approaches per annum per SN-OD (2013/14)
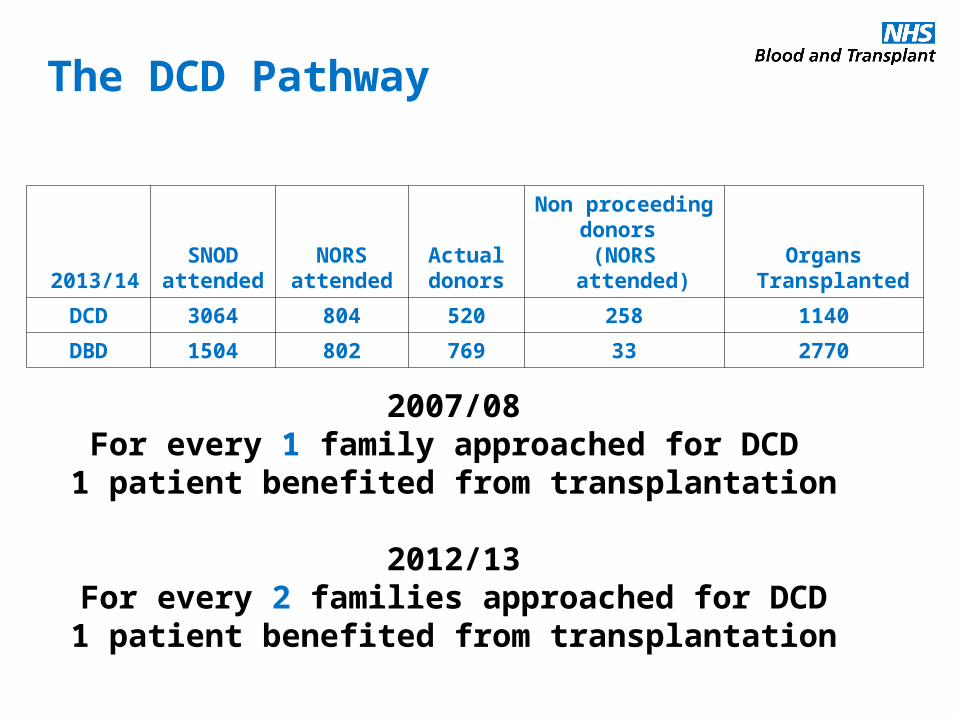
2013/14SNOD
attendedNORS
attendedActualdonors
Non proceedingdonors
(NORS attended)Organs
Transplanted
DCD 3064 804 520 258 1140
DBD 1504 802 769 33 2770
2007/08For every 1 family approached for DCD 1 patient benefited from transplantation
2012/13For every 2 families approached for DCD1 patient benefited from transplantation
The DCD Pathway
Number of proceeding and non-proceeding DBD and DCD donors (ie any consented eligible donor with a completed Core Donor Data Form)
1 April 2013 to 31 March 2014 (UKTR data as at 23 April 2014)
67
116
87 95
5332
62 60 67
26
56 60
60
64
71 47
40
14
44 47 39
19
51 43
8
15
5
4
5
3
3 6 5
2
4 3
66
79
6380
40
13
32
5842
30
68
43
0
50
100
150
200
250
300
Eastern London Midlands NorthWest
Northern NorthernIreland
Scotland SouthCentral
South East SouthWales
SouthWest
Yorkshire
Organ Donation Services Team
Num
ber
of p
roce
edin
g an
d no
n-pr
ocee
ding
don
ors
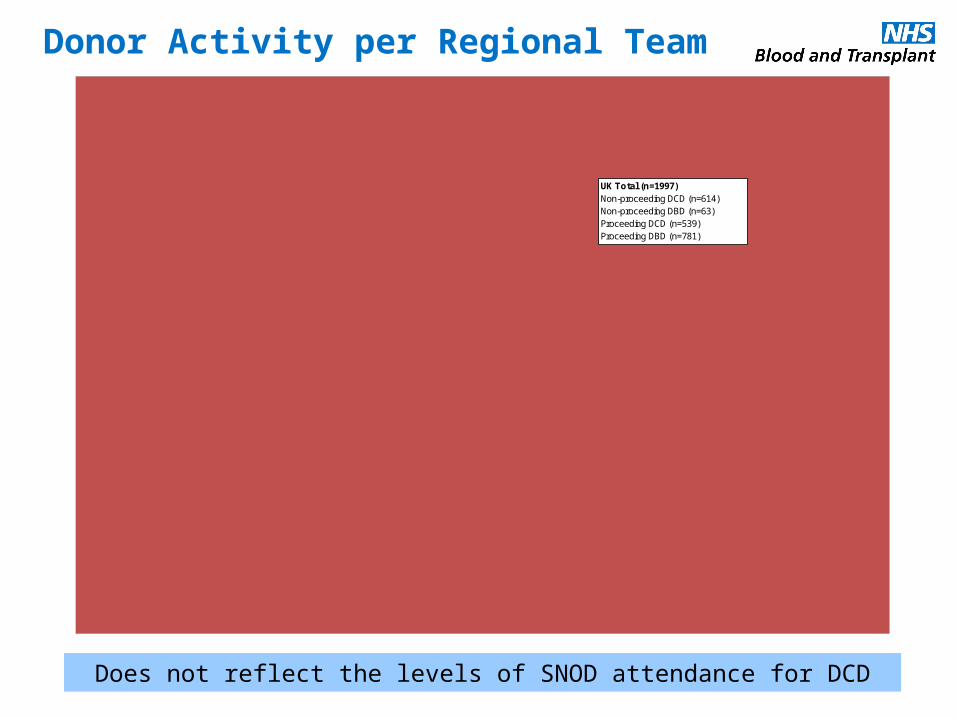
Non-proceeding DCD
Non-proceeding DBD
Proceeding DCD
Proceeding DBD
UK Total (n=1997)Non-proceeding DCD (n=614)Non-proceeding DBD (n=63)Proceeding DCD (n=539)Proceeding DBD (n=781)
Donor Activity per Regional Team
Does not reflect the levels of SNOD attendance for DCD
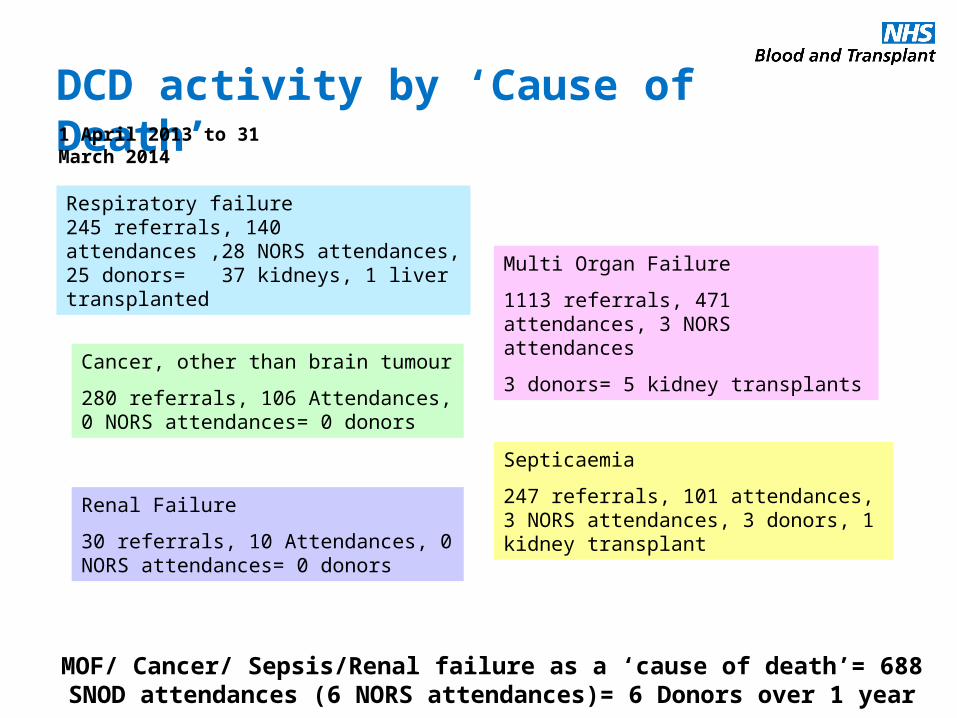
Respiratory failure245 referrals, 140 attendances ,28 NORS attendances, 25 donors= 37 kidneys, 1 liver transplanted
Multi Organ Failure
1113 referrals, 471 attendances, 3 NORS attendances
3 donors= 5 kidney transplantsCancer, other than brain tumour
280 referrals, 106 Attendances, 0 NORS attendances= 0 donors
Septicaemia
247 referrals, 101 attendances, 3 NORS attendances, 3 donors, 1 kidney transplant
MOF/ Cancer/ Sepsis/Renal failure as a ‘cause of death’= 688 SNOD attendances (6 NORS attendances)= 6 Donors over 1 year
DCD activity by ‘Cause of Death’1 April 2013 to 31 March 2014
Renal Failure
30 referrals, 10 Attendances, 0 NORS attendances= 0 donors
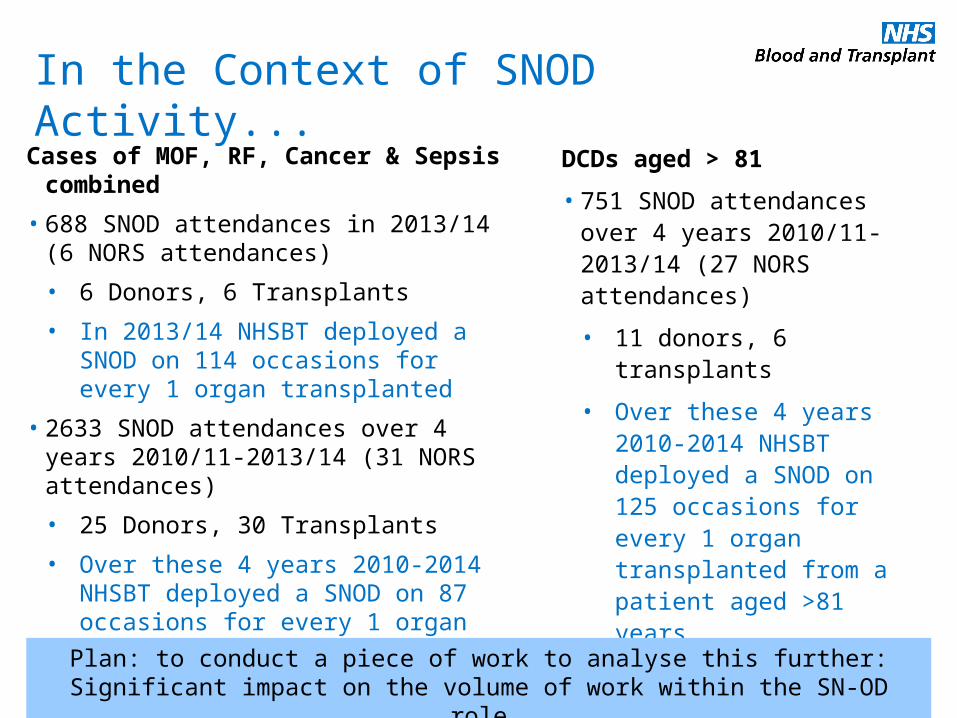
In the Context of SNOD Activity...
Cases of MOF, RF, Cancer & Sepsis combined
• 688 SNOD attendances in 2013/14 (6 NORS attendances)
• 6 Donors, 6 Transplants
• In 2013/14 NHSBT deployed a SNOD on 114 occasions for every 1 organ transplanted
• 2633 SNOD attendances over 4 years 2010/11-2013/14 (31 NORS attendances)
• 25 Donors, 30 Transplants
• Over these 4 years 2010-2014 NHSBT deployed a SNOD on 87 occasions for every 1 organ transplanted
DCDs aged > 81
• 751 SNOD attendances over 4 years 2010/11-2013/14 (27 NORS attendances)
• 11 donors, 6 transplants
• Over these 4 years 2010-2014 NHSBT deployed a SNOD on 125 occasions for every 1 organ transplanted from a patient aged >81 years
Plan: to conduct a piece of work to analyse this further: Significant impact on the volume of work within the SN-OD role
Workforce Modelling of the SNOD role
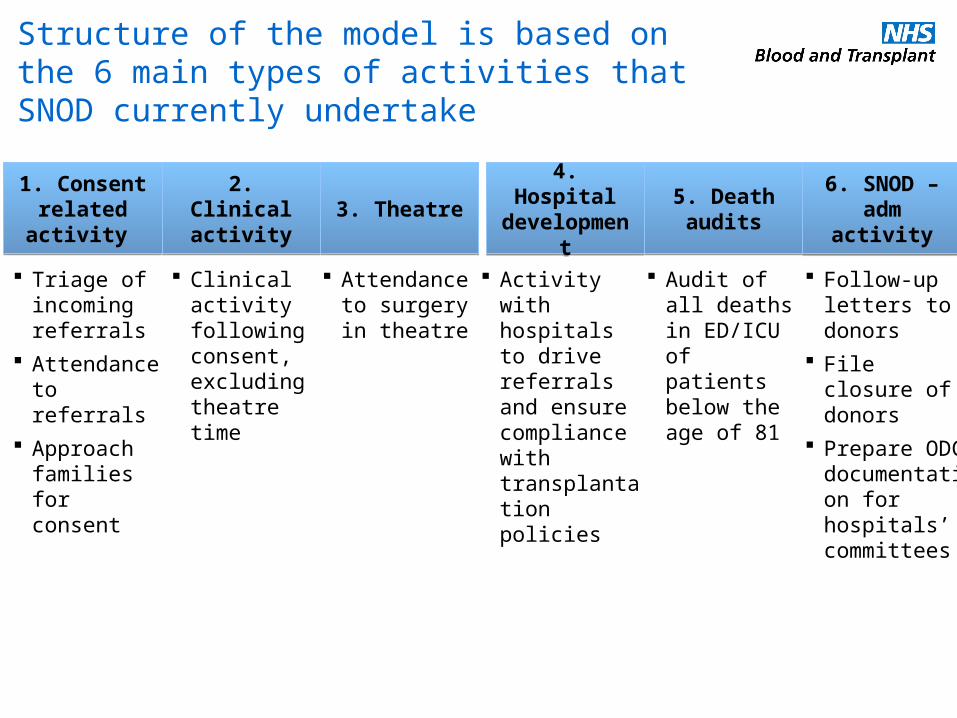
ClinicalClinical + demandStructure of the model is based on the 6 main types of activities that SNOD currently undertake
1. Consent related activity
1. Consent related activity
2. Clinical activity
2. Clinical activity 3. Theatre3. Theatre 4. Hospital
development4. Hospital
development5. Death audits
5. Death audits
6. SNOD – adm activity6. SNOD –
adm activity
Triage of incoming referrals
Attendance to referrals
Approach families for consent
Clinical activity following consent, excluding theatre time
Attendance to surgery in theatre
Activity with hospitals to drive referrals and ensure compliance with transplantation policies
Audit of all deaths in ED/ICU of patients below the age of 81
Follow-up letters to donors
File closure of donors
Prepare ODC documentation for hospitals’ committees
Consideration of Options
• Using the findings from phase 1 of the project
• Consideration of all options for each task- who could perform that role?
• Whether each ‘role’ should be SNOD/ other new NHSBT role/ non NHSBT role (i.e. a commissioned role)
• Likely impact of the National referral Centre (ODT Operational Hub) on some tasks currently performed by a SNOD
• All role options evaluated via a workforce model including the existing SNOD role
• Number of roles identified during workshops at a high level
Acknowledgement: Laura Hontorio Del Hoyo
Assistant Director, Blood donation and Strategy, NHSBT
Role Options Modelled- Revisited
• Dedicated requester/ consent role
• Audit role
• Hospital development
• Clinical Co-ordinator
• Theatre role
Additional Work
– Developing high level role profiles
– Consideration to alternative models of how staff on call are deployed to a referral
– Financial modelling of all options
Current SNOD roleConsideration of options +/- on callCommissioned/ local optionsRoles in isolation of component parts
Role Options Modelled- Considerations
• Dedicated requester/ consent role
• Audit role
• Hospital development
• Clinical Co-ordinator
• Theatre role
• Investigating the viability of all the options including the current SN-OD role against many criteria
Next Steps for the Project
–Evaluate the workforce modelling and feedback to staff the impact of the modelling on the options that
have been considered within the project- commenced–Engage with key stakeholders in relation the potential impact of
change during this period- commenced
–Trial new role as pilots within specific regions- Evaluate outcomes and impact- planning phase
–Take forward a paper based evaluation of potential triage interventions alongside current practice and evaluate findings- implement as appropriate- planning phase
–Timelines for phase 2 completion- 31st December 2015
–Implementation of any potential new workforce model for the SN-OD role- January 2016 onwards
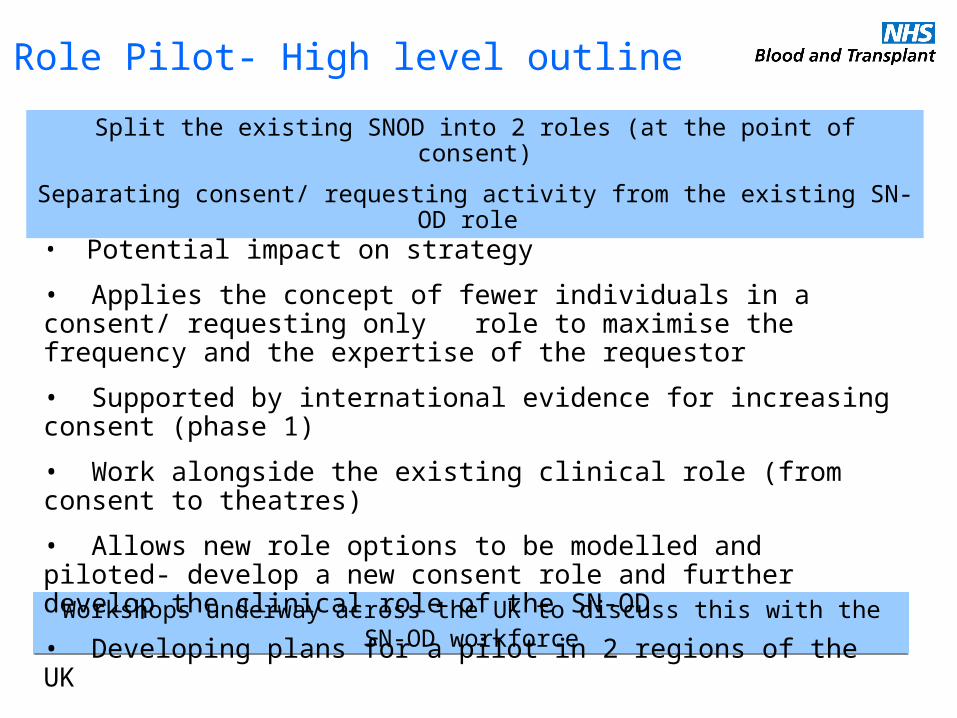
Role Pilot- High level outline
Workshops underway across the UK to discuss this with the SN-OD workforceWorkshops underway across the UK to discuss this with the SN-OD workforce
• Potential impact on strategy
• Applies the concept of fewer individuals in a consent/ requesting only role to maximise the frequency and the expertise of the requestor
• Supported by international evidence for increasing consent (phase 1)
• Work alongside the existing clinical role (from consent to theatres)
• Allows new role options to be modelled and piloted- develop a new consent role and further develop the clinical role of the SN-OD
• Developing plans for a pilot in 2 regions of the UK
Split the existing SNOD into 2 roles (at the point of consent)
Separating consent/ requesting activity from the existing SN-OD role
What will be the focus of the project in phase 2?
A Consent/ Specialist requesting Role to be taken forward via a pilot alongside the SNOD/ Clinical Role
A Consent/ Specialist requesting Role to be taken forward via a pilot alongside the SNOD/ Clinical Role
Pilot and Implement a DCD Triage model
Thank you for your attention