Embed Size (px)
Citation preview

Volume 4 No. 2 Quezon City, Philippines
ISSN 2545-9309
January-March 2018
Palay and Corn Quarterly Bulletin
October-December 2019
Philippine Statistics Authority Republic of the Philippines
Palay and Corn Quarterly Bulletin is a publication of the Philippine Statistics
Authority (PSA). The PSA reserves exclusive right to reproduce this publication in
whatever form. Should any portion of this publication be included in a report/article,
the title of the publication and the PSA should be cited as the source of data. The
PSA will not be responsible for any information derived from the processing of data
contained in this bulletin.
REPUBLIC OF THE PHILIPPINES
HIS EXCELLENCY
PRESIDENT RODRIGO R. DUTERTE
PHILIPPINE STATISTICS AUTHORITY
CLAIRE DENNIS S. MAPA, Ph.D.
Undersecretary
National Statistician and Civil Registrar General
ROSALINDA P. BAUTISTA
Assistant Secretary
Deputy National Statistician
Sectoral Statistics Office

FOREWORD
This report describes the palay and corn crop situation from October to December 2019. The estimates are the results of the January 2020 round of the Palay Production Survey (PPS) and Corn Production Survey (CPS) conducted quarterly by the PSA.
The report also includes information on monthly prices of palay, rice, corn and fertilizer; and cumulative actual decadal and normal rainfall. Data on prices are sourced from the Weekly Cereals and Fertilizer Price Monitoring (WCFPM) of the PSA, while rainfall data are provided by the Philippine Atmospheric Geophysical and Astronomical Services Administration (PAGASA).
CLAIRE DENNIS S. MAPA, Ph.D.
Undersecretary National Statistician and Civil Registrar General
Quezon City, Philippines February 2020
ii

This page is intentionally left blank

TABLE OF CONTENTS
Foreword ii Background viii Highlights
1.0 Palay and Corn Situation Palay 1 Corn 4 2.0 Prices Palay/Rice 7 Corn 8 Fertilizer 10
3.0 Weather Indicator, October-December 2019 12
LIST OF TABLES
Table No. Title Page No.
1.1 Volume of Production for Palay by Region October-December: 2017-2019 16
1.2 Harvest Area for Palay by Region, October-December: 2017-2019 17 1.3 Yield for Palay by Region, October-December: 2017-2019 18 1.4 Volume of Production for Irrigated Palay by Region
October-December: 2017-2019 19 1.5 Volume of Production for Rainfed Palay by Region
October-December: 2017-2019 20 1.6 Volume of Production for Corn by Region
October-December: 2017-2019 21 1.7 Harvest Area for Corn by Region, October-December: 2017-2019 22 1.8 Yield for Corn by Region, October-December: 2017-2019 23 1.9 Volume of Production for Yellow Corn by Region
October-December: 2017-2019 24 1.10 Volume of Production for White Corn by Region
October-December: 2017-2019 25 2.1 Monthly Average Prevailing Prices for Palay/Rice by Market Level
Philippines, January-December: 2018-2019 26
v
iv

Table No. Title Page No.
2.2 Monthly Average Prevailing Prices for Rice by Market Level Metro Manila, January-December: 2018-2019 27
2.3 Monthly Average Prevailing Prices for Yellow Corn by Market Level Philippines, January-December: 2018-2019 28
2.4 Monthly Average Prevailing Prices for White Corn by Market Level Philippines, January-December: 2018-2019 29
2.5 Monthly Average Dealers’ Prices for Fertilizer by Grade Philippines, January-December: 2018-2019 30
3.1 Cumulative Actual Decadal and Normal Rainfall by Region October-December: 2018-2019 31
v

LIST OF FIGURES
Figure No. Title Page No.
1 Palay Production, Philippines, October-December: 2017-2019 1 2 Percent Share of Irrigated and Rainfed Palay to the Total
Production, October-December: 2019 2 3 Distribution of Irrigated Palay Production by Region
October-December: 2019 2 4 Distribution of Rainfed Palay Production by Region
October-December: 2019 2 5 Thematic Map of Palay Production by Region
October-December: 2019 3 6 Corn Production, Philippines, October-December: 2017-2019 4 7 Distribution of Corn Production by Crop type
October-December: 2019 5 8 Distribution of Yellow Corn Production by Region
October-December: 2019 5 9 Distribution of White Corn Production by Region
October-December: 2019 5 10 Thematic Map of Corn Production by Region
October-December: 2019 6 11 Monthly Farmgate Prices for Rice, Philippines
January 2018 - December 2019 7 12 Monthly Wholesale Prices for Rice, Philippines
January 2018 - December 2019 7 13 Monthly Retail Prices for Rice, Philippines
January 2018 - December 2019 7 14 Monthly Wholesale Prices for Rice, Metro Manila
January 2018 - December 2019 8 15 Monthly Retail Prices for Rice, Metro Manila
January 2018 - December 2019 8 16 Monthly Farmgate Prices for Yellow Corn, Philippines
January 2018 - December 2019 8 17 Monthly Wholesale Prices for Yellow Corn, Philippines
January 2018 - December 2019 9 18 Monthly Retail Prices for Yellow Corn, Philippines
January 2018 - December 2019 9 19 M onthly Farmgate Prices for White Corn, Philippines
January 2018 – December 2019 9 20 Monthly Wholesale Prices for White Corn, Philippines
January 2018 - December 2019 10
vi

Figure No.
Title
Page No.
21 Monthly Retail Prices for White Corn, Philippines January 2018 - December 2019 10
22 Monthly Dealers’ Prices for Urea, Philippines January 2018 - December 2019 10
23 Monthly Dealers’ Prices for Ammosul, Philippines January 2018 - December 2019 11
24 Monthly Dealers’ Prices for Ammophos, Philippines January 2018 - December 2019 11
25 Monthly Dealers’ Prices for Complete, Philippines January 2018 - December 2019 11
vii

BACKGROUND1
Scope and Coverage
The Palay Production Survey (PPS) and Corn Production Survey (CPS) are the sources of data for palay and corn published in this Bulletin.
Production and harvest area for palay and corn are generated from PPS and CPS, respectively, which have four survey rounds in a year, that is, January, April, July and October.
Crops statistics cover all regions, except National Capital Region (NCR).
Sampling Methodology
The sampling design of PPS and CPS uses the results of the 2012 Census of Agriculture (CAF) and 2017 Listing of Farm Households (LFH) as the sampling frames. It employs a replicated two-stage stratified sampling design with province as domain. The barangay is the primary sampling unit, which is selected using probability proportional to size scheme. The farming household serves as the secondary sampling unit, which is selected systematically.
Data Collection
For PPS and CPS, data collection is conducted quarterly during the first 10 days of the month after the reference quarter, except for the fourth quarter where data collection is made earlier.
Concepts and Definitions
Crop production refers to the quantity produced and actually harvested for a particular crop during the reference period. It includes those harvested but damaged, stolen, given away, consumed, given as harvester’s share, reserved, etc. Excluded are those produced but not harvested due to low price, lack of demand and force majeure or fortuitous events, etc. Harvest area refers to the actual area from which harvests are realized. This excludes crop area which were totally damaged. It may be smaller than the area planted.
1Source: Excerpts from Crops Statistics of the Philippines 2012-2016, ISSN-2012-0487
https://psa.gov.ph/content/crops-statistics-philippines-national-and-regional
viii

HIGHLIGHTS
1.0 PALAY AND CORN SITUATION
PALAY
Palay production from October to December 2019 was 7.49 million metric tons. This was 4.7 percent higher than the level in the same period a year ago of 7.16 million metric tons. On the other hand, harvest area contracted to 1.84 million hectares from the previous year’s record of 1.85 million hectares. Yield increased to 4.07 metric tons per hectare or higher by 5.2 percent from the 2018 level of 3.87 metric tons. (Figure 1 and Table 1.1 to 1.3) o Increment in production was largest
in Cagayan Valley at 0.23 million
metric tons or by 31.4 percent. This
was followed by Western Visayas at
0.14 million metric tons (19.9%); and
Ilocos Region, 0.10 million metric
tons (9.2%). These regions also
increased in harvest area.
o Yield of palay per hectare in the
Cordillera Administrative Region
(CAR) and Cagayan Valley
increased by 31.0 percent and
28.1 percent, respectively, from their
respective levels in 2018. (Table 1.3)
FIGURE 1 Palay Production, Philippines
October-December: 2017-2019
1
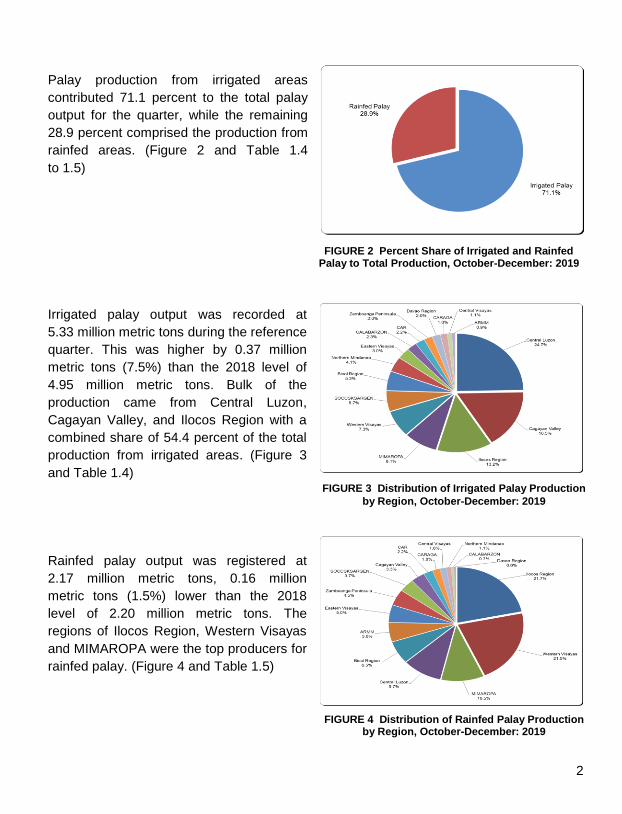
FIGURE 2 Percent Share of Irrigated and Rainfed Palay to Total Production, October-December: 2019
FIGURE 3 Distribution of Irrigated Palay Production
by Region, October-December: 2019
FIGURE 4 Distribution of Rainfed Palay Production by Region, October-December: 2019
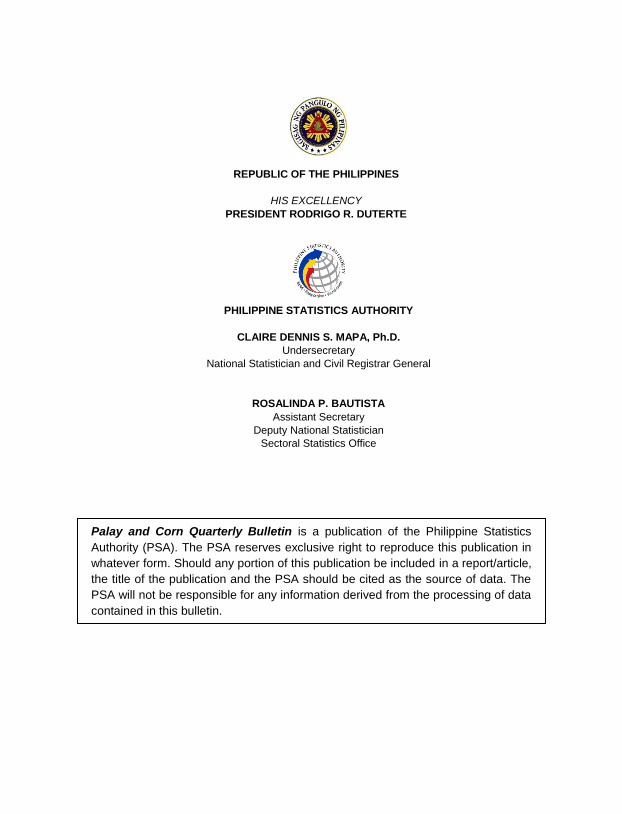
Palay production from irrigated areas
contributed 71.1 percent to the total palay
output for the quarter, while the remaining
28.9 percent comprised the production from
rainfed areas. (Figure 2 and Table 1.4
to 1.5)
Irrigated palay output was recorded at
5.33 million metric tons during the reference
quarter. This was higher by 0.37 million
metric tons (7.5%) than the 2018 level of
4.95 million metric tons. Bulk of the
production came from Central Luzon,
Cagayan Valley, and Ilocos Region with a
combined share of 54.4 percent of the total
production from irrigated areas. (Figure 3
and Table 1.4)
Rainfed palay output was registered at
2.17 million metric tons, 0.16 million
metric tons (1.5%) lower than the 2018
level of 2.20 million metric tons. The
regions of Ilocos Region, Western Visayas
and MIMAROPA were the top producers for
rainfed palay. (Figure 4 and Table 1.5)
2

FIGURE 5 Thematic Map of Palay Production by Region
October-December: 2019
3

CORN The October to December 2019 corn
production of 1.66 million metric tons
was lower by 8.2 percent than the 2018
level of 1.81 million metric tons.
Harvest area decreased to
559.03 thousand hectares from
the previous year’s record of
611.80 thousand hectares (8.6%).
However, yield per hectare increased by
0.5 percent, from 2.95 metric tons in
2018 to 2.97 metric tons in 2019.
(Figure 6 and Tables 1.6 to 1.8)
o Cutback in production was highest
in Cagayan Valley at 0.15 million
metric tons (42.2%), from the
previous year’s level of 0.36 million
metric tons. This was followed by
Zamboanga Peninsula (0.02 million
metric tons), and CALABARZON
(0.01 million metric tons).
Decrements in harvest area were
also observed in these regions.
o Yield of corn per hectare in CAR at 4.42 metric tons increased by 48.6 percent
compared with the previous year’s level of 2.98 metric tons.
4
FIGURE 6 Corn Production, Philippines
October-December: 2017-2019

FIGURE 7 Percent Share of Yellow and White Corn to Total Production, October-December: 2019
FIGURE 8 Distribution of Yellow Corn Production by Region, October-December: 2019
FIGURE 9 Distribution of White Corn Production by Region, October-December: 2019
Of the total corn production for October to
December 2019, yellow corn accounted for
69.6 percent, while white corn comprised
the remaining 30.4 percent. (Figure 7 and
Table 1.9 to 1.10)
Production of yellow corn was recorded at
1.15 million metric tons during the
reference period. This was 10.9 percent
lower than the 2018 level of
1.30 million metric tons. The major yellow
corn producing regions were
Northern Mindanao, SOCCSKSARGEN
and Cagayan Valley with a combined
output of 71.2 percent. (Figure 8 and
Table 1.9)
Production of white corn was posted at
0.50 million metric tons. This was lower by
1.2 percent than the previous year’s level
of 0.51 million metric tons. About
70 percent of the 2019 output was shared
by Northern Mindanao, ARMM,
SOCCSKSARGEN and Davao Region.
(Figure 9 and Table 1.10)
5

FIGURE 10 Thematic Map of Corn Production by Region October-December: 2019
6

FIGURE 11 Monthly Farmgate Prices for Palay Philippines, January 2018 - December 2019
FIGURE 12 Monthly Wholesale Prices for Rice Philippines, January 2018 - December 2019
FIGURE 13 Monthly Retail Prices for Rice Philippines, January 2018 - December 2019
2.0 PRICES2
PALAY
o The average farmgate price per
kilogram of palay for 2019 was
₱17.59, 15.7 percent lower than the
previous year’s average farmgate
price of ₱20.87. From January to
December 2019, the monthly average
farmgate prices were lower than their
respective levels in 2018, except
for January 2019. (Figure 11 and
Table 2.1)
RICE o At wholesale, average price
per kilogram of rice for 2019 was
₱39.25, 6.9 percent lower than the
previous year’s level of ₱42.16. The
monthly average wholesale prices per
kilogram of palay showed a
decreasing trend during the period,
from ₱41.59 in January 2019
to ₱37.24 in December 2019.
(Figure 12 and Table 2.1)
o This year’s average retail price
per kilogram of rice was ₱43.01, lower
by 4.8 percent than the previous
year’s level of ₱45.18. Monthly retail
prices exhibited the same movements
as wholesale price, that is, monthly
retail prices of rice showed a
decreasing trend, from ₱45.07 in
January 2019 to ₱41.48 in December
2019. Monthly prices were also lower
than their respective levels in 2018,
except for the first three months of
2019. (Figure 13 and Table 2.1)
2Source: Data on prices from Weekly Cereals and Fertilizer Price Monitoring (WCFPM) of the PSA
7

FIGURE 14 Monthly Wholesale Prices for Rice
Metro Manila, January 2018 - December 2019
FIGURE 15 Monthly Retail Prices for Rice Metro Manila, January 2018 - December 2019
FIGURE 16 Monthly Farmgate Prices for Yellow Corn Philippines, January 2018 - December 2019
o In Metro Manila, the average
wholesale price per kilogram of
rice for January to December
2019 was ₱34.54. This was
13.8 percent lower than the
previous year’s average price of
₱40.08 per kilogram. The
monthly wholesale prices for
2019 were lower than their
respective levels in 2018, except
January and February 2019.
(Figure 14 and Table 2.2)
o At retail, the average price per
kilogram of rice in Metro Manila
for 2019 was ₱43.58,
1.1 percent lower than the
previous year’s level of ₱44.07.
The monthly retail price per
kilogram of rice for 2019 was
highest in January at ₱44.25,
and lowest in August at ₱41.20.
(Figure 15 and Table 2.2)
CORN
Yellow Corn
o The January-December 2019
average farmgate price of yellow
corn was ₱13.37 per kilogram,
lower by 4.6 percent than the
₱14.01 level in 2018. The
monthly average farmgate prices
ranged from ₱12.14 to ₱14.10
per kilogram in 2019. (Figure 16
and Table 2.3)
8
o In 2019, the average wholesale
price per kilogram of yellow corn
was ₱19.96, lower by 1.0 percent
than the 2018 price of ₱20.15.
The monthly wholesale price was
highest in December 2019 at
₱21.39 while it was lowest in July
2019 at ₱18.26. (Figure 17 and
Table 2.3)
o The average retail price
per kilogram of yellow corn from
January to December 2019 was
₱24.96, higher by 1.8 percent
than the 2018 price of ₱24.52.
The monthly retail price was
highest in December 2019
at ₱25.86 per kilogram.
(Figure 18 and Table 2.3)
White Corn
o The January to December 2019
average farmgate price
per kilogram of white corn
was ₱14.78, a decrease by
6.5 percent from the previous
year’s quotation of ₱15.81. The
monthly average farmgate
prices per kilogram of white corn
ranged from ₱13.25 to ₱16.20.
(Figure 19 and Table 2.4) FIGURE 19 Monthly Farmgate Prices for White Corn
Philippines, January 2018 - December 2019
9
FIGURE 17 Monthly Wholesale Prices for Yellow Corn Philippines, January 2018 - December 2019
FIGURE 18 Monthly Retail Prices for Yellow Corn Philippines, January 2018 - December 2019

FIGURE 20 Monthly Wholesale Prices for White Corn
Philippines, January 2018 - December 2019
FIGURE 21 Monthly Retail Prices for White Corn
Philippines, January 2018 - December 2019
o At wholesale, the average price
per kilogram of white corn for
2019 was ₱18.95 or 8.5 percent
lower than the previous year’s
level of ₱20.72. The monthly
wholesale prices were lower
than their respective levels in
2018, except for the first three
months of 2019. (Figure 20 and
Table 2.4)
o In 2019, the average retail price
per kilogram of white corn was
₱27.48, 4.6 percent lower than
the previous year’s level of
₱28.81. Monthly retail prices in
2019 were lower than their
respective quotations in 2018.
(Figure 21 and Table 2.4)
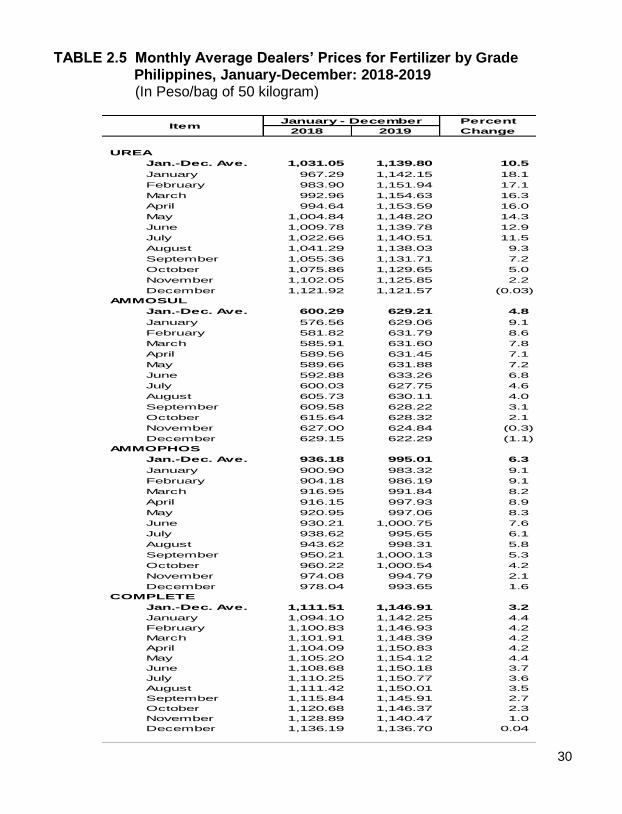
FERTILIZER
o In 2019, the 12-month average
dealers’ price per bag of
50 kilograms of urea fertilizer
was ₱1,139.80 or 10.5 percent
higher than the previous year’s
price of ₱1,031.05. The monthly
prices of urea fertilizer during
the period were higher than their
respective quotations in 2018
except in December 2019.
(Figure 22 and Table 2.5)
10
FIGURE 22 Monthly Dealers’ Prices for Urea
Philippines, January 2018 - December 2019

FIGURE 24 Monthly Dealers’ Prices for Ammophos
Philippines, January 2018 - December 2019
o The average dealers’ price per
bag of 50 kilograms of
ammonium sulfate or ammosul
fertilizer for 2019 was
₱629.21, 4.8 percent higher than
the 2018 quotation of ₱600.29.
The monthly prices of ammosul
from January to October were
higher than their respective
quotations in 2018. (Figure 23
and Table 2.5)
o For ammonium phosphate or
ammophos fertilizer, the average
dealers’ price per bag of
50 kilograms for 2019 was
₱995.01, 6.3 percent higher than
the 2018 quotation of ₱936.18.
The monthly prices of
ammophos in 2019 ranged from
₱983.32 to ₱1,000.75 per bag of
50 kilograms. (Figure 24 and
Table 2.5)
o In 2019, the 12-month average
dealers’ price per bag of
50 kilograms of complete fertilizer
was ₱1,146.91, 3.2 percent
higher than their 2018 quotation
of ₱1,111.51. The monthly prices
of complete fertilizer in 2019 were
higher than their respective
levels in 2018. (Figure 25 and
Table 2.5)
FIGURE 25 Monthly Dealers’ Prices for Complete
Philippines, January 2018 - December 2019
11
FIGURE 23 Monthly Dealers’ Prices for Ammosul Philippines, January 2018 - December 2019
3.0 WEATHER INDICATOR, OCTOBER-DECEMBER 20193
Weak El Niño condition which started since the last quarter of 2018 had persisted in the Central and Eastern Equatorial Pacific (CEEP). The warmer than average sea surface temperatures (SSTs) have slightly weakened in June, but still within El Niño threshold. It is expected that a transition from El Niño to ENSO-neutral condition will be likely to occur in August or September, with ENSO-neutral favored to continue through the last quarter of 2019. Rainfall assessment for the month of October 2019 in most parts of Luzon and eastern Visayas received way below to below normal rainfall conditions. Meanwhile, near to above normal rainfall were experienced over the western and central parts of Visayas and Mindanao. For the month of November 2019, it showed that near to above normal rainfall conditions were experienced in most parts of northern and central Luzon, MIMAROPA, Batangas, Cavite, Metro Manila, Panay Island, South Cotabato and most parts of Davao Region. The remaining parts of Luzon, Visayas and Mindanao received below to way below normal rainfall conditions. The rainfall assessment for December 2019 showed most parts of Luzon and Visayas, and some parts of Davao Region experienced near to above normal rainfall. However, the remaining parts of Mindanao received below to way below normal rainfall conditions. The weather systems that affected the country were the low pressure areas (LPAs), localized thunderstorms, easterlies, northeast (NE) monsoon, and the passage of six (6) tropical cyclones (TCs) over the Philippine Area of Responsibility (PAR), namely, Typhoon (TY) “Perla” (October 16-20), Typhoon (TY) “Quiel” (November 5-8), Typhoon (TY) “Ramon” (November 12-20), Severe Tropical Storm (STS) “Sarah” (November 19-22), Typhoon (TY) “Tisoy” (November 30 – December 5) and Typhoon (TY) “Ursula” (December 23-28).
3Source: Excerpts from Philippine Atmospheric, Geophysical and Astronomical Services Administration
(PAGASA), February 06, 2019 to April 05, 2019 Monthly Climate Assessment and Outlook
12

This page is intentionally left blank

STATISTICAL TABLES

This page is intentionally left blank

Level % Level %
PHILIPPINES 7,317,653 7,156,461 7,493,979 (161,192) (2.2) 337,518 4.7
Cordillera Administrative Region (CAR) 174,109 133,372 167,675 (40,737) (23.4) 34,303 25.7
Region I (Ilocos Region) 1,209,896 1,077,471 1,176,145 (132,425) (10.9) 98,675 9.2
Region II (Cagayan Valley) 870,735 724,007 951,313 (146,728) (16.9) 227,306 31.4
Region III (Central Luzon) 1,553,435 1,531,808 1,525,220 (21,627) (1.4) (6,588) (0.4)
Region IV-A (CALABARZON) 146,724 153,400 140,146 6,676 4.6 (13,255) (8.6)
MIMAROPA Region 549,191 615,425 659,346 66,234 12.1 43,921 7.1
Region V (Bicol Region) 475,861 479,526 424,585 3,665 0.8 (54,941) (11.5)
Region VI (Western Visayas) 697,714 713,923 855,714 16,209 2.3 141,791 19.9
Region VII (Central Visayas) 158,924 135,194 92,725 (23,730) (14.9) (42,470) (31.4)
Region VIII (Eastern Visayas) 293,419 290,871 268,382 (2,548) (0.9) (22,489) (7.7)
Region IX (Zamboanga Peninsula) 194,598 236,813 206,385 42,215 21.7 (30,428) (12.8)
Region X (Northern Mindanao) 223,022 239,640 240,515 16,618 7.5 876 0.4
Region XI (Davao Region) 103,522 105,544 115,276 2,022 2.0 9,732 9.2
Region XII (SOCCSKSARGEN) 350,823 369,186 383,000 18,363 5.2 13,814 3.7
Region XIII (Caraga) 172,705 176,384 125,021 3,679 2.1 (51,363) (29.1)
Autonomous Region in Muslim Mindanao (ARMM) 142,975 173,896 162,531 30,921 21.6 (11,365) (6.5)
2019Region 2018 / 2017 2019 / 2018
ChangeOctober - December
(Details may not add up due to rounding)
20182017
16
TABLE 1.1 Volume of Production for Palay by Region
October-December: 2017-2019
(In metric tons)

Level % Level %
PHILIPPINES 1,863,637 1,847,889 1,840,108 (15,748) (0.8) (7,782) (0.4)
Cordillera Administrative Region (CAR) 52,105 49,431 47,439 (2,674) (5.1) (1,992) (4.0)
Region I (Ilocos Region) 271,775 266,354 266,134 (5,421) (2.0) (221) (0.1)
Region II (Cagayan Valley) 208,004 207,773 213,155 (231) (0.1) 5,382 2.6
Region III (Central Luzon) 338,872 340,518 329,018 1,646 0.5 (11,500) (3.4)
Region IV-A (CALABARZON) 44,546 40,067 36,726 (4,479) (10.1) (3,340) (8.3)
MIMAROPA Region 149,357 150,682 155,479 1,325 0.9 4,797 3.2
Region V (Bicol Region) 132,503 127,851 117,922 (4,652) (3.5) (9,929) (7.8)
Region VI (Western Visayas) 206,262 210,079 248,741 3,817 1.9 38,662 18.4
Region VII (Central Visayas) 47,292 43,426 31,374 (3,866) (8.2) (12,052) (27.8)
Region VIII (Eastern Visayas) 78,949 78,017 72,797 (932) (1.2) (5,220) (6.7)
Region IX (Zamboanga Peninsula) 51,134 54,940 49,651 3,806 7.4 (5,289) (9.6)
Region X (Northern Mindanao) 49,334 50,416 49,573 1,082 2.2 (843) (1.7)
Region XI (Davao Region) 23,668 23,440 25,948 (228) (1.0) 2,508 10.7
Region XII (SOCCSKSARGEN) 99,180 99,686 103,236 506 0.5 3,550 3.6
Region XIII (Caraga) 55,767 56,824 42,862 1,057 1.9 (13,962) (24.6)
Autonomous Region in Muslim Mindanao (ARMM) 54,889 48,385 50,054 (6,504) (11.8) 1,669 3.4
2018 2019
(Details may not add up due to rounding)
Region
Change
2018 / 2017 2019 / 2018
October - December
2017
17
TABLE 1.2 Harvest Area for Palay by Region, October-December: 2017-2019 (In hectares)

Level % Level %
PHILIPPINES 3.93 3.87 4.07 (0.05) (1.4) 0.20 5.2
Cordillera Administrative Region (CAR) 3.34 2.70 3.53 (0.64) (19.3) 0.84 31.0
Region I (Ilocos Region) 4.45 4.05 4.42 (0.41) (9.1) 0.37 9.2
Region II (Cagayan Valley) 4.19 3.48 4.46 (0.70) (16.8) 0.98 28.1
Region III (Central Luzon) 4.58 4.50 4.64 (0.09) (1.9) 0.14 3.1
Region IV-A (CALABARZON) 3.29 3.83 3.82 0.53 16.2 (0.01) (0.3)
MIMAROPA Region 3.68 4.08 4.24 0.41 11.1 0.16 3.8
Region V (Bicol Region) 3.59 3.75 3.60 0.16 4.4 (0.15) (4.0)
Region VI (Western Visayas) 3.38 3.40 3.44 0.02 0.5 0.04 1.2
Region VII (Central Visayas) 3.36 3.11 2.96 (0.25) (7.4) (0.16) (5.1)
Region VIII (Eastern Visayas) 3.72 3.73 3.69 0.01 0.3 (0.04) (1.1)
Region IX (Zamboanga Peninsula) 3.81 4.31 4.16 0.50 13.3 (0.15) (3.6)
Region X (Northern Mindanao) 4.52 4.75 4.85 0.23 5.1 0.10 2.1
Region XI (Davao Region) 4.37 4.50 4.44 0.13 2.9 (0.06) (1.3)
Region XII (SOCCSKSARGEN) 3.54 3.70 3.71 0.17 4.7 0.01 0.2
Region XIII (Caraga) 3.10 3.10 2.92 0.01 0.2 (0.19) (6.0)
Autonomous Region in Muslim Mindanao (ARMM) 2.60 3.59 3.25 0.99 38.0 (0.35) (9.7)
(Details may not add up due to rounding)
Region
Change
2018 / 2017 2019 / 2018
October - December
2017 2018 2019
18
TABLE 1.3 Yield for Palay by Region, October-December: 2017-2019 (In metric tons per hectare)

Level % Level %
PHILIPPINES 5,111,052 4,954,456 5,325,833 (156,596) (3.1) 371,377 7.5
Cordillera Administrative Region (CAR) 129,943 98,223 119,246 (31,720) (24.4) 21,022 21.4
Region I (Ilocos Region) 728,545 636,635 705,162 (91,910) (12.6) 68,527 10.8
Region II (Cagayan Valley) 798,930 666,273 879,097 (132,657) (16.6) 212,824 31.9
Region III (Central Luzon) 1,276,284 1,275,013 1,314,708 (1,271) (0.1) 39,695 3.1
Region IV-A (CALABARZON) 108,522 121,931 124,457 13,409 12.4 2,526 2.1
MIMAROPA Region 353,066 398,875 432,507 45,809 13.0 33,632 8.4
Region V (Bicol Region) 320,830 325,168 283,439 4,338 1.4 (41,729) (12.8)
Region VI (Western Visayas) 312,538 311,510 389,436 (1,028) (0.3) 77,925 25.0
Region VII (Central Visayas) 102,193 85,240 58,705 (16,953) (16.6) (26,535) (31.1)
Region VIII (Eastern Visayas) 175,616 170,015 160,829 (5,601) (3.2) (9,186) (5.4)
Region IX (Zamboanga Peninsula) 96,201 114,421 107,779 18,220 18.9 (6,642) (5.8)
Region X (Northern Mindanao) 199,502 214,335 216,044 14,833 7.4 1,709 0.8
Region XI (Davao Region) 93,464 95,211 104,600 1,747 1.9 9,389 9.9
Region XII (SOCCSKSARGEN) 274,878 286,691 302,027 11,813 4.3 15,336 5.3
Region XIII (Caraga) 114,912 123,476 85,789 8,564 7.5 (37,687) (30.5)
Autonomous Region in Muslim Mindanao (ARMM) 25,628 31,438 42,008 5,810 22.7 10,570 33.6
(Details may not add up due to rounding)
2019Region
ChangeOctober - December
2017 20182018 / 2017 2019 / 2018
TABLE 1.4 Volume of Production for Irrigated Palay by Region
October-December: 2017-2019
(In metric tons)
19

Level % Level %
PHILIPPINES 2,206,601 2,202,005 2,168,147 (4,596) (0.2) (33,858) (1.5)
Cordillera Administrative Region (CAR) 44,166 35,149 48,429 (9,017) (20.4) 13,280 37.8
Region I (Ilocos Region) 481,351 440,836 470,983 (40,515) (8.4) 30,147 6.8
Region II (Cagayan Valley) 71,805 57,734 72,216 (14,071) (19.6) 14,482 25.1
Region III (Central Luzon) 277,151 256,795 210,512 (20,356) (7.3) (46,283) (18.0)
Region IV-A (CALABARZON) 38,202 31,469 15,689 (6,733) (17.6) (15,781) (50.1)
MIMAROPA Region 196,125 216,550 226,839 20,425 10.4 10,289 4.8
Region V (Bicol Region) 155,031 154,358 141,146 (673) (0.4) (13,211) (8.6)
Region VI (Western Visayas) 385,176 402,413 466,278 17,237 4.5 63,866 15.9
Region VII (Central Visayas) 56,731 49,954 34,020 (6,777) (11.9) (15,935) (31.9)
Region VIII (Eastern Visayas) 117,803 120,856 107,553 3,053 2.6 (13,303) (11.0)
Region IX (Zamboanga Peninsula) 98,397 122,392 98,606 23,995 24.4 (23,786) (19.4)
Region X (Northern Mindanao) 23,520 25,305 24,471 1,785 7.6 (833) (3.3)
Region XI (Davao Region) 10,058 10,333 10,676 275 2.7 343 3.3
Region XII (SOCCSKSARGEN) 75,945 82,495 80,973 6,550 8.6 (1,522) (1.8)
Region XIII (Caraga) 57,793 52,908 39,232 (4,885) (8.5) (13,676) (25.8)
Autonomous Region in Muslim Mindanao (ARMM) 117,347 142,458 120,523 25,111 21.4 (21,936) (15.4)
2019 / 2018
October - December
2017 2018 2019
(Details may not add up due to rounding)
Region
Change
2018 / 2017
20
TABLE 1.5 Volume of Production for Rainfed Palay by Region
October-December: 2017-2019
(In metric tons)

Level % Level %
PHILIPPINES 1,629,343 1,805,629 1,658,324 176,286 10.8 (147,305) (8.2)
Cordillera Administrative Region (CAR) 30,644 47,828 68,514 17,184 56.1 20,686 43.2
Region I (Ilocos Region) 8,247 7,924 7,712 (323) (3.9) (212) (2.7)
Region II (Cagayan Valley) 196,735 359,944 208,227 163,210 83.0 (151,718) (42.2)
Region III (Central Luzon) 5,041 4,852 6,610 (190) (3.8) 1,759 36.3
Region IV-A (CALABARZON) 31,525 36,129 22,367 4,604 14.6 (13,762) (38.1)
MIMAROPA Region 15,024 12,609 12,654 (2,415) (16.1) 45 0.4
Region V (Bicol Region) 48,114 53,633 53,444 5,519 11.5 (189) (0.4)
Region VI (Western Visayas) 53,554 50,881 63,086 (2,673) (5.0) 12,206 24.0
Region VII (Central Visayas) 39,178 31,161 26,714 (8,017) (20.5) (4,447) (14.3)
Region VIII (Eastern Visayas) 21,312 21,898 22,913 586 2.8 1,014 4.6
Region IX (Zamboanga Peninsula) 66,376 58,120 34,982 (8,256) (12.4) (23,137) (39.8)
Region X (Northern Mindanao) 466,024 455,114 454,975 (10,910) (2.3) (139) (0.0)
Region XI (Davao Region) 72,669 72,019 78,877 (650) (0.9) 6,858 9.5
Region XII (SOCCSKSARGEN) 377,049 370,650 358,864 (6,399) (1.7) (11,786) (3.2)
Region XIII (Caraga) 64,333 72,682 65,193 8,349 13.0 (7,489) (10.3)
Autonomous Region in Muslim Mindanao (ARMM) 133,518 150,186 173,192 16,668 12.5 23,006 15.3
October - December
2017 2018 2019Region
Change
2018 / 2017 2019 / 2018
(Details may not add up due to rounding)
21
TABLE 1.6 Volume of Production for Corn by Region October-December: 2017-2019 (In metric tons)

Level % Level %
PHILIPPINES 571,126 611,803 559,030 40,677 7.1 (52,773) (8.6)
Cordillera Administrative Region (CAR) 7,321 16,064 15,485 8,743 119.4 (579) (3.6)
Region I (Ilocos Region) 1,998 1,933 1,868 (65) (3.3) (65) (3.4)
Region II (Cagayan Valley) 47,123 100,819 47,363 53,696 113.9 (53,456) (53.0)
Region III (Central Luzon) 1,287 1,252 1,537 (35) (2.7) 285 22.8
Region IV-A (CALABARZON) 12,740 12,016 9,116 (724) (5.7) (2,899) (24.1)
MIMAROPA Region 4,707 4,224 4,211 (483) (10.3) (13) (0.3)
Region V (Bicol Region) 17,847 17,728 18,749 (119) (0.7) 1,021 5.8
Region VI (Western Visayas) 19,221 18,269 21,563 (952) (5.0) 3,294 18.0
Region VII (Central Visayas) 44,304 37,532 35,588 (6,772) (15.3) (1,944) (5.2)
Region VIII (Eastern Visayas) 15,337 15,802 15,331 465 3.0 (471) (3.0)
Region IX (Zamboanga Peninsula) 44,631 35,889 23,578 (8,743) (19.6) (12,310) (34.3)
Region X (Northern Mindanao) 116,031 111,142 111,946 (4,889) (4.2) 804 0.7
Region XI (Davao Region) 49,259 48,699 53,917 (560) (1.1) 5,218 10.7
Region XII (SOCCSKSARGEN) 123,144 122,845 124,639 (299) (0.2) 1,794 1.5
Region XIII (Caraga) 17,227 19,073 18,216 1,846 10.7 (857) (4.5)
Autonomous Region in Muslim Mindanao (ARMM) 48,949 48,517 55,923 (432) (0.9) 7,406 15.3
October - December
2017Region
Change
(Details may not add up due to rounding)
2018 / 2017 2019 / 20182018 2019
22
TABLE 1.7 Harvest Area for Corn by Region, October-December: 2017-2019 (In hectares)

Level % Level %
PHILIPPINES 2.85 2.95 2.97 0.10 3.5 0.02 0.5
Cordillera Administrative Region (CAR) 4.19 2.98 4.42 (1.21) (28.9) 1.45 48.6
Region I (Ilocos Region) 4.13 4.10 4.13 (0.03) (0.7) 0.03 0.7
Region II (Cagayan Valley) 4.17 3.57 4.40 (0.60) (14.5) 0.83 23.1
Region III (Central Luzon) 3.92 3.88 4.30 (0.04) (1.1) 0.43 11.0
Region IV-A (CALABARZON) 2.47 3.01 2.45 0.53 21.5 (0.55) (18.4)
MIMAROPA Region 3.19 2.99 3.00 (0.21) (6.5) 0.02 0.7
Region V (Bicol Region) 2.70 3.03 2.85 0.33 12.2 (0.17) (5.8)
Region VI (Western Visayas) 2.79 2.79 2.93 (0.00) (0.0) 0.14 5.0
Region VII (Central Visayas) 0.88 0.83 0.75 (0.05) (6.1) (0.08) (9.6)
Region VIII (Eastern Visayas) 1.39 1.39 1.49 (0.00) (0.3) 0.11 7.8
Region IX (Zamboanga Peninsula) 1.49 1.62 1.48 0.13 8.9 (0.14) (8.4)
Region X (Northern Mindanao) 4.02 4.09 4.06 0.08 2.0 (0.03) (0.7)
Region XI (Davao Region) 1.48 1.48 1.46 0.00 0.2 (0.02) (1.1)
Region XII (SOCCSKSARGEN) 3.06 3.02 2.88 (0.04) (1.5) (0.14) (4.6)
Region XIII (Caraga) 3.73 3.81 3.58 0.08 2.0 (0.23) (6.1)
Autonomous Region in Muslim Mindanao (ARMM) 2.73 3.10 3.10 0.37 13.5 0.00 0.0
Change
(Details may not add up due to rounding)
2018 / 2017 2019 / 2018
October - December
2017 2018 2019Region
23
TABLE 1.8 Yield for Corn by Region, October-December: 2017-2019 (In metric tons per hectare)

Level % Level %
PHILIPPINES 1,099,129 1,295,188 1,153,989 196,059 17.8 (141,199) (10.9)
Cordillera Administrative Region (CAR) 29,734 47,606 68,283 17,872 60.1 20,676 43.4
Region I (Ilocos Region) 3,953 3,748 3,417 (205) (5.2) (331) (8.8)
Region II (Cagayan Valley) 190,141 353,616 203,462 163,475 86.0 (150,154) (42.5)
Region III (Central Luzon) 3,512 2,432 3,662 (1,080) (30.7) 1,229 50.5
Region IV-A (CALABARZON) 18,502 24,408 14,743 5,906 31.9 (9,665) (39.6)
MIMAROPA Region 11,049 9,651 8,435 (1,398) (12.7) (1,216) (12.6)
Region V (Bicol Region) 38,646 43,947 41,189 5,301 13.7 (2,758) (6.3)
Region VI (Western Visayas) 37,070 34,806 48,223 (2,264) (6.1) 13,417 38.5
Region VII (Central Visayas) 1,476 1,020 644 (456) (30.9) (376) (36.9)
Region VIII (Eastern Visayas) 2,138 1,951 1,782 (187) (8.8) (168) (8.6)
Region IX (Zamboanga Peninsula) 8,494 11,943 6,683 3,449 40.6 (5,260) (44.0)
Region X (Northern Mindanao) 335,536 336,962 323,714 1,426 0.4 (13,248) (3.9)
Region XI (Davao Region) 13,616 11,908 14,270 (1,708) (12.5) 2,362 19.8
Region XII (SOCCSKSARGEN) 316,241 304,058 294,018 (12,183) (3.9) (10,040) (3.3)
Region XIII (Caraga) 40,138 45,696 38,346 5,558 13.8 (7,349) (16.1)
Autonomous Region in Muslim Mindanao (ARMM) 48,883 61,436 83,117 12,553 25.7 21,681 35.3
(Details may not add up due to rounding)
Region
Change
2018 / 2017 2019 / 2018
October - December
2017 2018 2019
TABLE 1.9 Volume of Production for Yellow Corn by Region
October-December: 2017-2019
(In metric tons)
24

Level % Level %
PHILIPPINES 530,214 510,441 504,336 (19,773) (3.7) (6,106) (1.2)
Cordillera Administrative Region (CAR) 910 222 231 (688) (75.6) 9 4.2
Region I (Ilocos Region) 4,294 4,176 4,295 (118) (2.7) 119 2.8
Region II (Cagayan Valley) 6,594 6,328 4,764 (266) (4.0) (1,564) (24.7)
Region III (Central Luzon) 1,529 2,419 2,949 890 58.2 530 21.9
Region IV-A (CALABARZON) 13,023 11,721 7,624 (1,302) (10.0) (4,097) (35.0)
MIMAROPA Region 3,975 2,958 4,219 (1,017) (25.6) 1,261 42.6
Region V (Bicol Region) 9,468 9,686 12,255 218 2.3 2,569 26.5
Region VI (Western Visayas) 16,484 16,074 14,863 (410) (2.5) (1,211) (7.5)
Region VII (Central Visayas) 37,702 30,141 26,070 (7,561) (20.1) (4,071) (13.5)
Region VIII (Eastern Visayas) 19,174 19,948 21,130 774 4.0 1,183 5.9
Region IX (Zamboanga Peninsula) 57,882 46,177 28,299 (11,705) (20.2) (17,877) (38.7)
Region X (Northern Mindanao) 130,488 118,152 131,261 (12,336) (9.5) 13,109 11.1
Region XI (Davao Region) 59,053 60,111 64,608 1,058 1.8 4,497 7.5
Region XII (SOCCSKSARGEN) 60,808 66,592 64,846 5,784 9.5 (1,746) (2.6)
Region XIII (Caraga) 24,195 26,986 26,846 2,791 11.5 (140) (0.5)
Autonomous Region in Muslim Mindanao (ARMM) 84,635 88,750 90,074 4,115 4.9 1,325 1.5
(Details may not add up due to rounding)
2019Region
ChangeOctober - December
2017 20182018 / 2017 2019 / 2018
TABLE 1.10 Volume of Production for White Corn by Region
October-December: 2017-2019
(In metric tons)
25

Percent
2018 2019 Change
FARMGATE
Jan.-Dec. Ave. 20.87 17.59 (15.7)
January 19.12 19.84 3.8
February 19.75 19.63 (0.6)
March 20.41 19.00 (6.9)
April 20.68 18.57 (10.2)
May 21.02 18.27 (13.1)
June 21.31 17.91 (16.0)
July 21.63 17.77 (17.8)
August 22.39 17.42 (22.2)
September 22.88 16.05 (29.9)
October 21.10 15.50 (26.5)
November 20.11 15.51 (22.9)
December 20.09 15.64 (22.2)
WHOLESALE
Jan.-Dec. Ave. 42.16 39.25 (6.9)
January 39.51 41.59 5.3
February 40.13 41.29 2.9
March 40.70 40.62 (0.2)
April 41.01 39.91 (2.7)
May 41.18 39.45 (4.2)
June 41.52 39.27 (5.4)
July 42.23 39.14 (7.3)
August 43.78 38.97 (11.0)
September 45.97 38.35 (16.6)
October 44.79 37.80 (15.6)
November 42.97 37.36 (13.1)
December 42.10 37.24 (11.5)
RETAIL
Jan.-Dec. Ave. 45.18 43.01 (4.8)
January 42.43 45.07 6.2
February 42.98 44.69 4.0
March 43.44 44.22 1.8
April 43.76 43.69 (0.2)
May 43.94 43.13 (1.8)
June 44.29 42.94 (3.0)
July 44.96 42.78 (4.8)
August 46.37 42.55 (8.2)
September 49.09 42.15 (14.1)
October 48.50 41.85 (13.7)
November 46.78 41.60 (11.1)
December 45.59 41.48 (9.0)
Item January - December
26
TABLE 2.1 Monthly Average Prevailing Prices for Palay/Rice by Market Level Philippines, January-December: 2018-2019
(In Peso per kilogram)

Percent
2018 2019 Change
METRO MANILA
WHOLESALE
Jan.-Dec. Ave. 40.08 34.54 (13.8)
January 37.90 40.40 6.6
February 38.35 38.75 1.0
March 39.08 35.75 (8.5)
April 38.85 35.03 (9.8)
May 39.15 33.80 (13.7)
June 39.26 34.43 (12.3)
July 40.15 32.83 (18.2)
August 41.08 33.34 (18.8)
September 44.52 34.23 (23.1)
October 41.83 31.93 (23.7)
November 40.68 32.04 (21.2)
December 40.14 32.00 (20.3)
RETAIL
Jan.-Dec. Ave. 44.07 43.58 (1.1)
January 41.50 44.25 6.6
February 42.00 44.00 4.8
March 42.00 44.00 4.8
April 42.00 44.00 4.8
May 42.00 44.00 4.8
June 42.50 44.00 3.5
July 45.00 43.00 (4.4)
August 45.25 41.20 (9.0)
September 48.00 44.00 (8.3)
October 46.75 44.00 (5.9)
November 47.00 44.00 (6.4)
December 44.80 42.50 (5.1)
January - December Item
27
TABLE 2.2 Monthly Average Prevailing Prices for Rice by Market Level Metro Manila, January-December: 2018-2019
(In Peso per kilogram)

Percent
2018 2019 Change
FARMGATE - Yellow
Jan.-Dec. Ave. 14.01 13.37 (4.6)
January 12.56 13.96 11.1
February 13.30 13.86 4.2
March 14.15 13.83 (2.3)
April 14.26 14.10 (1.1)
May 13.91 14.07 1.2
June 13.94 14.00 0.4
July 14.36 13.97 (2.7)
August 14.24 13.47 (5.4)
September 14.74 12.91 (12.4)
October 14.39 12.20 (15.2)
November 14.17 11.97 (15.5)
December 14.13 12.14 (14.1)
WHOLESALE - Yellow
Jan.-Dec. Ave. 20.15 19.96 (1.0)
January 18.83 20.30 7.8
February 19.16 19.47 1.6
March 19.90 19.53 (1.9)
April 20.11 20.23 0.6
May 20.10 19.79 (1.5)
June 20.10 18.40 (8.5)
July 20.08 18.26 (9.1)
August 20.53 19.89 (3.1)
September 20.93 20.75 (0.9)
October 20.83 20.45 (1.8)
November 20.65 21.00 1.7
December 20.61 21.39 3.8
RETAIL - Yellow
Jan.-Dec. Ave. 24.52 24.96 1.8
January 22.81 25.41 11.4
February 23.14 24.72 6.8
March 23.62 24.64 4.3
April 23.68 24.85 4.9
May 23.79 24.68 3.7
June 24.61 23.85 (3.1)
July 24.92 23.67 (5.0)
August 25.23 24.92 (1.2)
September 25.38 25.62 0.9
October 25.52 25.58 0.2
November 25.66 25.67 0.04
December 25.87 25.86 (0.04)
January - December Item
28
TABLE 2.3 Monthly Average Prevailing Prices for Yellow Corn by Market Level Philippines, January-December: 2018-2019 (In Peso per kilogram)

Percent
2018 2019 Change
FARMGATE - White
Jan.-Dec. Ave. 15.81 14.78 (6.5)
January 16.22 14.03 (13.5)
February 17.17 14.55 (15.3)
March 17.37 15.10 (13.1)
April 17.43 16.02 (8.1)
May 17.03 16.20 (4.9)
June 16.16 16.20 0.2
July 15.61 15.94 2.1
August 14.89 15.16 1.8
September 14.52 14.09 (3.0)
October 14.57 13.46 (7.6)
November 14.39 13.34 (7.3)
December 14.33 13.25 (7.5)
WHOLESALE - White
Jan.-Dec. Ave. 20.72 18.95 (8.5)
January 19.70 20.75 5.3
February 20.59 21.03 2.1
March 20.43 22.12 8.3
April 20.34 19.86 (2.4)
May 19.87 19.67 (1.0)
June 21.41 19.37 (9.5)
July 20.74 18.42 (11.2)
August 21.75 18.05 (17.0)
September 20.76 17.29 (16.7)
October 21.14 16.97 (19.7)
November 20.79 17.00 (18.2)
December 21.10 16.88 (20.0)
RETAIL - White
Jan.-Dec. Ave. 28.81 27.48 (4.6)
January 29.70 28.12 (5.3)
February 29.99 28.22 (5.9)
March 29.96 28.81 (3.8)
April 29.99 27.98 (6.7)
May 29.82 27.90 (6.4)
June 29.05 27.79 (4.3)
July 27.52 27.15 (1.3)
August 28.12 27.03 (3.9)
September 27.80 26.69 (4.0)
October 27.89 26.65 (4.4)
November 27.81 26.72 (3.9)
December 28.08 26.71 (4.9)
January - December Item
29
TABLE 2.4 Monthly Average Prevailing Prices for White Corn by Market Level Philippines, January-December: 2018-2019
(In Peso per kilogram)
29
Percent
2018 2019 Change
UREA
Jan.-Dec. Ave. 1,031.05 1,139.80 10.5
January 967.29 1,142.15 18.1
February 983.90 1,151.94 17.1
March 992.96 1,154.63 16.3
April 994.64 1,153.59 16.0
May 1,004.84 1,148.20 14.3
June 1,009.78 1,139.78 12.9
July 1,022.66 1,140.51 11.5
August 1,041.29 1,138.03 9.3
September 1,055.36 1,131.71 7.2
October 1,075.86 1,129.65 5.0
November 1,102.05 1,125.85 2.2
December 1,121.92 1,121.57 (0.03)
AMMOSUL
Jan.-Dec. Ave. 600.29 629.21 4.8
January 576.56 629.06 9.1
February 581.82 631.79 8.6
March 585.91 631.60 7.8
April 589.56 631.45 7.1
May 589.66 631.88 7.2
June 592.88 633.26 6.8
July 600.03 627.75 4.6
August 605.73 630.11 4.0
September 609.58 628.22 3.1
October 615.64 628.32 2.1
November 627.00 624.84 (0.3)
December 629.15 622.29 (1.1)
AMMOPHOS
Jan.-Dec. Ave. 936.18 995.01 6.3
January 900.90 983.32 9.1
February 904.18 986.19 9.1
March 916.95 991.84 8.2
April 916.15 997.93 8.9
May 920.95 997.06 8.3
June 930.21 1,000.75 7.6
July 938.62 995.65 6.1
August 943.62 998.31 5.8
September 950.21 1,000.13 5.3
October 960.22 1,000.54 4.2
November 974.08 994.79 2.1
December 978.04 993.65 1.6
COMPLETE
Jan.-Dec. Ave. 1,111.51 1,146.91 3.2
January 1,094.10 1,142.25 4.4
February 1,100.83 1,146.93 4.2
March 1,101.91 1,148.39 4.2
April 1,104.09 1,150.83 4.2
May 1,105.20 1,154.12 4.4
June 1,108.68 1,150.18 3.7
July 1,110.25 1,150.77 3.6
August 1,111.42 1,150.01 3.5
September 1,115.84 1,145.91 2.7
October 1,120.68 1,146.37 2.3
November 1,128.89 1,140.47 1.0
December 1,136.19 1,136.70 0.04
Item January - December
30
TABLE 2.5 Monthly Average Dealers’ Prices for Fertilizer by Grade Philippines, January-December: 2018-2019
(In Peso/bag of 50 kilogram)

2018 2019 2019/2018 2019/Normal
Philippines 6,994.4 8,832.8 11,023.5 26.3 (19.9)
National Capital Region (NCR) 365.2 395.9 287.7 8.4 37.6
Cordillera Administrative Region (CAR) 148.0 523.9 435.2 254.0 20.4
Region I (Ilocos Region) 208.2 252.8 799.2 21.4 (68.4)
Region II (Cagayan Valley) 321.6 835.4 556.3 159.8 50.2
Region III (Central Luzon) 246.7 336.6 1,135.7 36.4 (70.4)
Region IV-A (CALABARZON) 461.2 750.4 551.4 62.7 36.1
MIMAROPA Region 251.5 449.3 501.4 78.6 (10.4)
Region V (Bicol Region) 606.0 995.7 1,152.7 64.3 (13.6)
Region VI (Western Visayas) 377.2 683.1 711.4 81.1 (4.0)
Region VII (Central Visayas) 524.7 482.8 527.7 (8.0) (8.5)
Region VIII (Eastern Visayas) 921.3 837.1 1,004.4 (9.1) (16.7)
Region IX (Zamboanga Peninsula) 519.6 366.2 652.6 (29.5) (43.9)
Region X (Northern Mindanao) 331.5 373.3 523.7 12.6 (28.7)
Region XI (Davao Region) 378.5 411.3 548.0 8.7 (24.9)
Region XII (SOCCSKSARGEN) 312.9 266.3 350.9 (14.9) (24.1)
Region XIII (Caraga) 689.7 622.7 892.3 (9.7) (30.2)
Autonomous Region in Muslim Mindanao (ARMM) 330.6 250.0 392.7 (24.4) (36.3)
Source: PAGASA
OCTOBER-DECEMBER
ActualNORMAL
% DEVIATIONRegion
31
TABLE 3.1 Cumulative Actual Decadal and Normal Rainfall by Region October-December: 2018-2019 (In millimeters)

This page is intentionally left blank

This page is intentionally left blank

PALAY AND CORN QUARTERLY BULLETIN
PHILIPPINE STATISTICS AUTHORITY
DIVINA GRACIA L. DEL PRADO Assistant National Statistician
Economic Sector Statistics Service
CROPS STATISTICS DIVISION
ERMINA V. TEPORA
Chief Statistical Specialist
REYNALDO Q. VALLESTEROS Supervising Statistical Specialist
JUDITHA C. PERIDO
Senior Statistical Specialist
JOY C. DE GUZMAN Statistical Specialist II
CORAZON B. BAGTO Statistical Specialist II
DIONISIO M. DE VERA Statistical Specialist II
MAY G. CAMMAYO Statistical Specialist I
JOHN MERVIN P. DE CASTRO
Statistical Analyst

PHILIPPINE STATISTICS AUTHORITY 16th Floor, ETON Cyberpod Centris 3
EDSA. Corner Quezon Avenue, Quezon City, Philippines
www.psa.gov.ph
/PhilippineStatisticsAuthority /PSAgovph