Embed Size (px)
Citation preview
Texas
Water
Conditions Report
1700 N. Congress Ave., P.O. Box 13231, Austin, TX 78711-3231
Telephone (512) 463-7847 Fax (512) 936-0816 1-800-RELAYTX (for the hearing impaired)
www.twdb.texas.gov
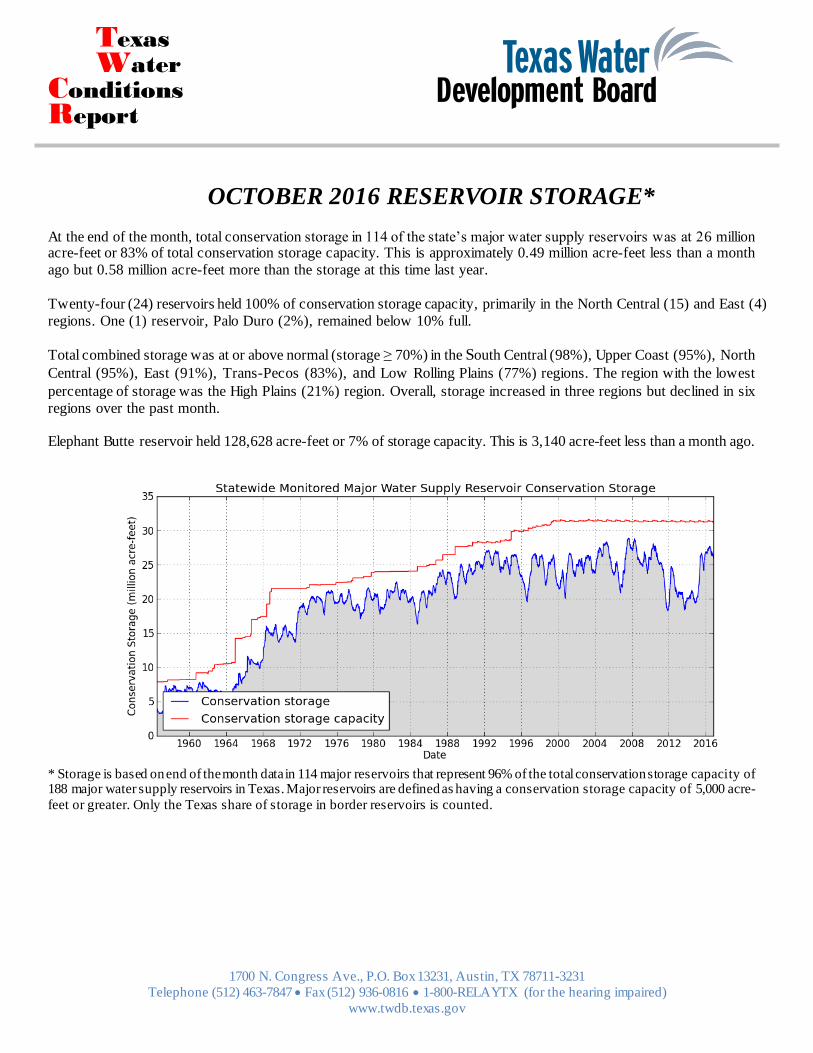
OCTOBER 2016 RESERVOIR STORAGE*
At the end of the month, total conservation storage in 114 of the state’s major water supply reservoirs was at 26 million acre-feet or 83% of total conservation storage capacity. This is approximately 0.49 million acre-feet less than a month
ago but 0.58 million acre-feet more than the storage at this time last year.
Twenty-four (24) reservoirs held 100% of conservation storage capacity, primarily in the North Central (15) and East (4)
regions. One (1) reservoir, Palo Duro (2%), remained below 10% full.
Total combined storage was at or above normal (storage ≥ 70%) in the South Central (98%), Upper Coast (95%), North
Central (95%), East (91%), Trans-Pecos (83%), and Low Rolling Plains (77%) regions. The region with the lowest
percentage of storage was the High Plains (21%) region. Overall, storage increased in three regions but declined in six
regions over the past month.
Elephant Butte reservoir held 128,628 acre-feet or 7% of storage capacity. This is 3,140 acre-feet less than a month ago.
* Storage is based on end of the month data in 114 major reservoirs that represent 96% of the total conservation storage capacity of 188 major water supply reservoirs in Texas. Major reservoirs are defined as having a conservation storage capacity of 5,000 acre-
feet or greater. Only the Texas share of storage in border reservoirs is counted.
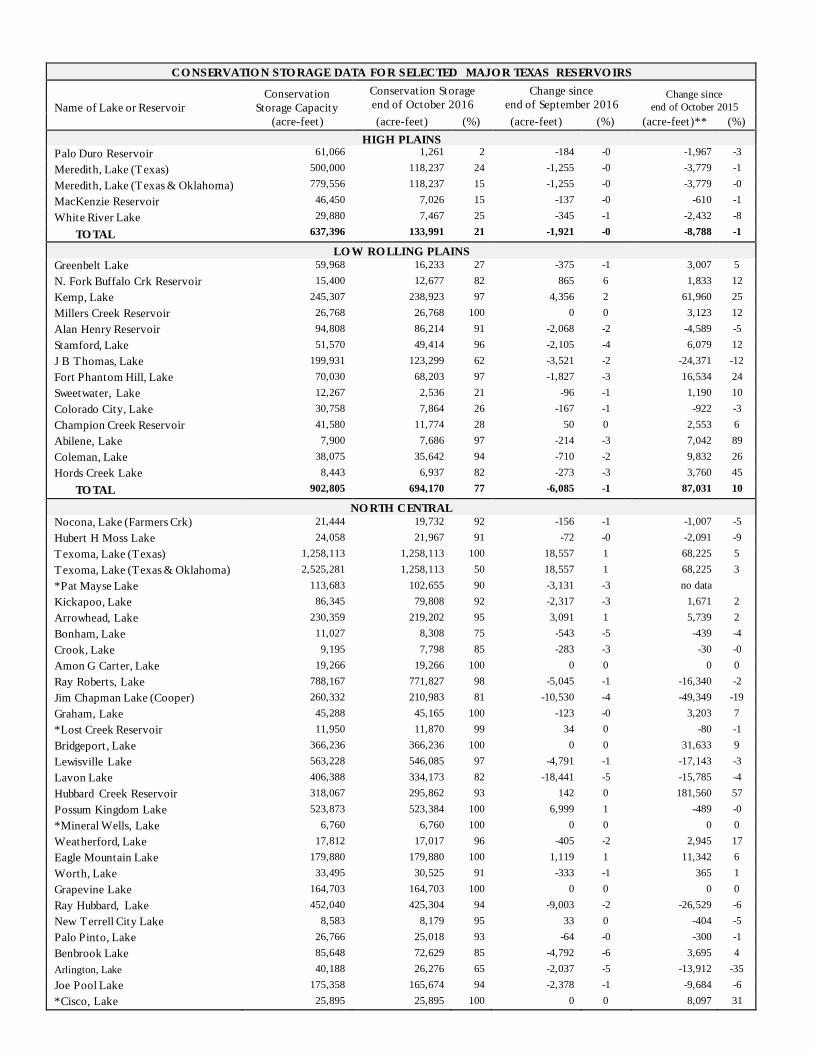
CO NSERVATIO N STO RAGE DATA FO R SELECTED MAJO R TEXAS RESERVO IRS
Name of Lake or Reservoir
Conservation
Storage Capacity
(acre-feet)
Conservation Storage
end of October 2016
Change since
end of September 2016 Change since
end of October 2015
(acre-feet) (%) (acre-feet) (%) (acre-feet)** (%)
HIGH PLAINS
Palo Duro Reservoir 61,066 1,261 2 -184 -0 -1,967 -3
Meredith, Lake (Texas) 500,000 118,237 24 -1,255 -0 -3,779 -1
Meredith, Lake (Texas & Oklahoma) 779,556 118,237 15 -1,255 -0 -3,779 -0
MacKenzie Reservoir 46,450 7,026 15 -137 -0 -610 -1
White River Lake 29,880 7,467 25 -345 -1 -2,432 -8
TO TAL 637,396 133,991 21 -1,921 -0 -8,788 -1
LO W RO LLING PLAINS
Greenbelt Lake 59,968 16,233 27 -375 -1 3,007 5
N. Fork Buffalo Crk Reservoir 15,400 12,677 82 865 6 1,833 12
Kemp, Lake 245,307 238,923 97 4,356 2 61,960 25
Millers Creek Reservoir 26,768 26,768 100 0 0 3,123 12
Alan Henry Reservoir 94,808 86,214 91 -2,068 -2 -4,589 -5
Stamford, Lake 51,570 49,414 96 -2,105 -4 6,079 12
J B Thomas, Lake 199,931 123,299 62 -3,521 -2 -24,371 -12
Fort Phantom Hill, Lake 70,030 68,203 97 -1,827 -3 16,534 24
Sweetwater, Lake 12,267 2,536 21 -96 -1 1,190 10
Colorado City, Lake 30,758 7,864 26 -167 -1 -922 -3
Champion Creek Reservoir 41,580 11,774 28 50 0 2,553 6
Abilene, Lake 7,900 7,686 97 -214 -3 7,042 89
Coleman, Lake 38,075 35,642 94 -710 -2 9,832 26
Hords Creek Lake 8,443 6,937 82 -273 -3 3,760 45
TO TAL 902,805 694,170 77 -6,085 -1 87,031 10
NO RTH CENTRAL
Nocona, Lake (Farmers Crk) 21,444 19,732 92 -156 -1 -1,007 -5
Hubert H Moss Lake 24,058 21,967 91 -72 -0 -2,091 -9
Texoma, Lake (Texas) 1,258,113 1,258,113 100 18,557 1 68,225 5
Texoma, Lake (Texas & Oklahoma) 2,525,281 1,258,113 50 18,557 1 68,225 3
*Pat Mayse Lake 113,683 102,655 90 -3,131 -3 no data
Kickapoo, Lake 86,345 79,808 92 -2,317 -3 1,671 2
Arrowhead, Lake 230,359 219,202 95 3,091 1 5,739 2
Bonham, Lake 11,027 8,308 75 -543 -5 -439 -4
Crook, Lake 9,195 7,798 85 -283 -3 -30 -0
Amon G Carter, Lake 19,266 19,266 100 0 0 0 0
Ray Roberts, Lake 788,167 771,827 98 -5,045 -1 -16,340 -2
Jim Chapman Lake (Cooper) 260,332 210,983 81 -10,530 -4 -49,349 -19
Graham, Lake 45,288 45,165 100 -123 -0 3,203 7
*Lost Creek Reservoir 11,950 11,870 99 34 0 -80 -1
Bridgeport, Lake 366,236 366,236 100 0 0 31,633 9
Lewisville Lake 563,228 546,085 97 -4,791 -1 -17,143 -3
Lavon Lake 406,388 334,173 82 -18,441 -5 -15,785 -4
Hubbard Creek Reservoir 318,067 295,862 93 142 0 181,560 57
Possum Kingdom Lake 523,873 523,384 100 6,999 1 -489 -0
*Mineral Wells, Lake 6,760 6,760 100 0 0 0 0
Weatherford, Lake 17,812 17,017 96 -405 -2 2,945 17
Eagle Mountain Lake 179,880 179,880 100 1,119 1 11,342 6
Worth, Lake 33,495 30,525 91 -333 -1 365 1
Grapevine Lake 164,703 164,703 100 0 0 0 0
Ray Hubbard, Lake 452,040 425,304 94 -9,003 -2 -26,529 -6
New Terrell City Lake 8,583 8,179 95 33 0 -404 -5
Palo Pinto, Lake 26,766 25,018 93 -64 -0 -300 -1
Benbrook Lake 85,648 72,629 85 -4,792 -6 3,695 4
Arlington, Lake 40,188 26,276 65 -2,037 -5 -13,912 -35
Joe Pool Lake 175,358 165,674 94 -2,378 -1 -9,684 -6
*Cisco, Lake 25,895 25,895 100 0 0 8,097 31
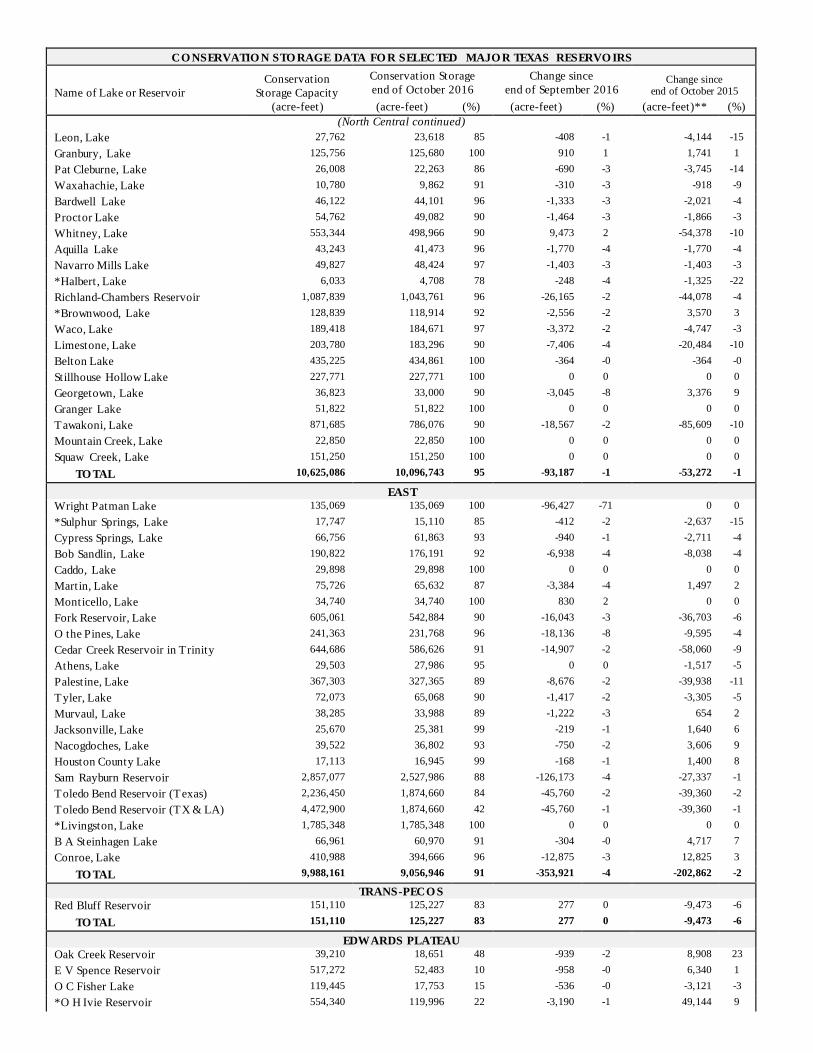
CO NSERVATIO N STO RAGE DATA FO R SELECTED MAJO R TEXAS RESERVO IRS
Name of Lake or Reservoir
Conservation
Storage Capacity
(acre-feet)
Conservation Storage
end of October 2016
Change since
end of September 2016 Change since
end of October 2015
(acre-feet) (%) (acre-feet) (%) (acre-feet)** (%)
(North Central continued)
Leon, Lake 27,762 23,618 85 -408 -1 -4,144 -15
Granbury, Lake 125,756 125,680 100 910 1 1,741 1
Pat Cleburne, Lake 26,008 22,263 86 -690 -3 -3,745 -14
Waxahachie, Lake 10,780 9,862 91 -310 -3 -918 -9
Bardwell Lake 46,122 44,101 96 -1,333 -3 -2,021 -4
Proctor Lake 54,762 49,082 90 -1,464 -3 -1,866 -3
Whitney, Lake 553,344 498,966 90 9,473 2 -54,378 -10
Aquilla Lake 43,243 41,473 96 -1,770 -4 -1,770 -4
Navarro Mills Lake 49,827 48,424 97 -1,403 -3 -1,403 -3
*Halbert, Lake 6,033 4,708 78 -248 -4 -1,325 -22
Richland-Chambers Reservoir 1,087,839 1,043,761 96 -26,165 -2 -44,078 -4
*Brownwood, Lake 128,839 118,914 92 -2,556 -2 3,570 3
Waco, Lake 189,418 184,671 97 -3,372 -2 -4,747 -3
Limestone, Lake 203,780 183,296 90 -7,406 -4 -20,484 -10
Belton Lake 435,225 434,861 100 -364 -0 -364 -0
Stillhouse Hollow Lake 227,771 227,771 100 0 0 0 0
Georgetown, Lake 36,823 33,000 90 -3,045 -8 3,376 9
Granger Lake 51,822 51,822 100 0 0 0 0
Tawakoni, Lake 871,685 786,076 90 -18,567 -2 -85,609 -10
Mountain Creek, Lake 22,850 22,850 100 0 0 0 0
Squaw Creek, Lake 151,250 151,250 100 0 0 0 0
TO TAL 10,625,086 10,096,743 95 -93,187 -1 -53,272 -1
EAST
Wright Patman Lake 135,069 135,069 100 -96,427 -71 0 0
*Sulphur Springs, Lake 17,747 15,110 85 -412 -2 -2,637 -15
Cypress Springs, Lake 66,756 61,863 93 -940 -1 -2,711 -4
Bob Sandlin, Lake 190,822 176,191 92 -6,938 -4 -8,038 -4
Caddo, Lake 29,898 29,898 100 0 0 0 0
Martin, Lake 75,726 65,632 87 -3,384 -4 1,497 2
Monticello, Lake 34,740 34,740 100 830 2 0 0
Fork Reservoir, Lake 605,061 542,884 90 -16,043 -3 -36,703 -6
O the Pines, Lake 241,363 231,768 96 -18,136 -8 -9,595 -4
Cedar Creek Reservoir in Trinity 644,686 586,626 91 -14,907 -2 -58,060 -9
Athens, Lake 29,503 27,986 95 0 0 -1,517 -5
Palestine, Lake 367,303 327,365 89 -8,676 -2 -39,938 -11
Tyler, Lake 72,073 65,068 90 -1,417 -2 -3,305 -5
Murvaul, Lake 38,285 33,988 89 -1,222 -3 654 2
Jacksonville, Lake 25,670 25,381 99 -219 -1 1,640 6
Nacogdoches, Lake 39,522 36,802 93 -750 -2 3,606 9
Houston County Lake 17,113 16,945 99 -168 -1 1,400 8
Sam Rayburn Reservoir 2,857,077 2,527,986 88 -126,173 -4 -27,337 -1
Toledo Bend Reservoir (Texas) 2,236,450 1,874,660 84 -45,760 -2 -39,360 -2
Toledo Bend Reservoir (TX & LA) 4,472,900 1,874,660 42 -45,760 -1 -39,360 -1
*Livingston, Lake 1,785,348 1,785,348 100 0 0 0 0
B A Steinhagen Lake 66,961 60,970 91 -304 -0 4,717 7
Conroe, Lake 410,988 394,666 96 -12,875 -3 12,825 3
TO TAL 9,988,161 9,056,946 91 -353,921 -4 -202,862 -2
TRANS-PECO S
Red Bluff Reservoir 151,110 125,227 83 277 0 -9,473 -6
TO TAL 151,110 125,227 83 277 0 -9,473 -6
EDWARDS PLATEAU
Oak Creek Reservoir 39,210 18,651 48 -939 -2 8,908 23
E V Spence Reservoir 517,272 52,483 10 -958 -0 6,340 1
O C Fisher Lake 119,445 17,753 15 -536 -0 -3,121 -3
*O H Ivie Reservoir 554,340 119,996 22 -3,190 -1 49,144 9
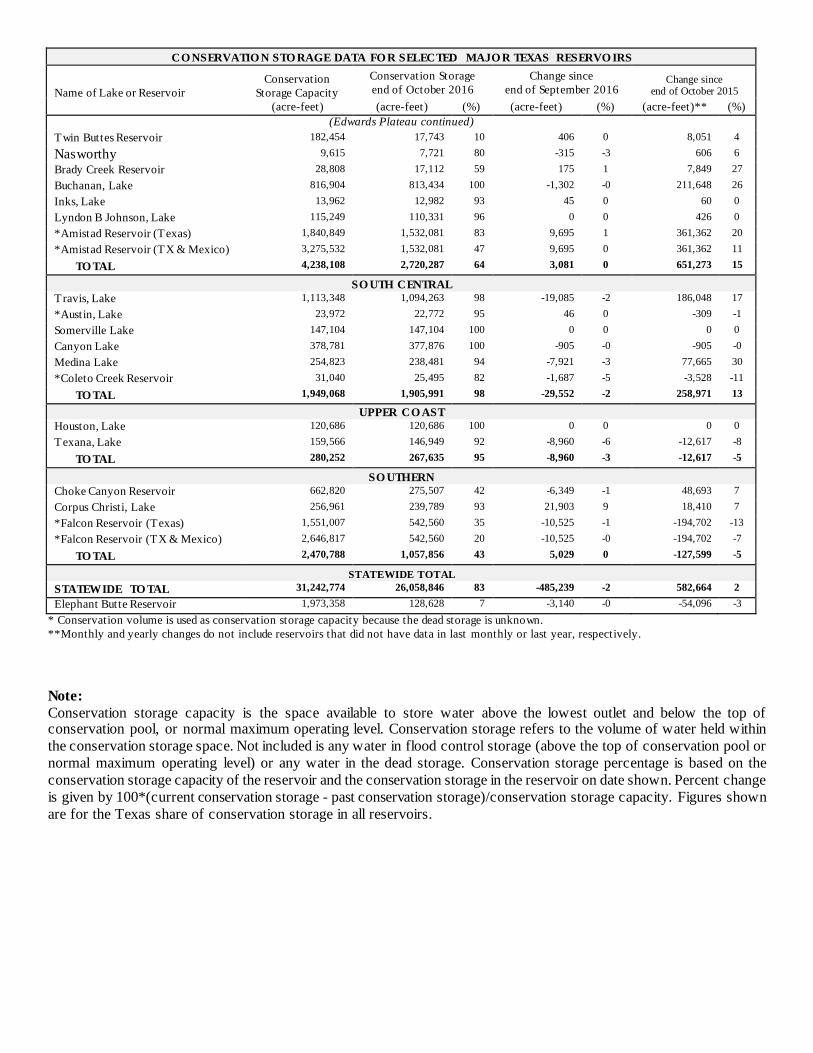
CO NSERVATIO N STO RAGE DATA FO R SELECTED MAJO R TEXAS RESERVO IRS
Name of Lake or Reservoir
Conservation
Storage Capacity
(acre-feet)
Conservation Storage
end of October 2016
Change since
end of September 2016 Change since
end of October 2015
(acre-feet) (%) (acre-feet) (%) (acre-feet)** (%)
(Edwards Plateau continued)
Twin Buttes Reservoir 182,454 17,743 10 406 0 8,051 4
Nasworthy 9,615 7,721 80 -315 -3 606 6
Brady Creek Reservoir 28,808 17,112 59 175 1 7,849 27
Buchanan, Lake 816,904 813,434 100 -1,302 -0 211,648 26
Inks, Lake 13,962 12,982 93 45 0 60 0
Lyndon B Johnson, Lake 115,249 110,331 96 0 0 426 0
*Amistad Reservoir (Texas) 1,840,849 1,532,081 83 9,695 1 361,362 20
*Amistad Reservoir (TX & Mexico) 3,275,532 1,532,081 47 9,695 0 361,362 11
TO TAL 4,238,108 2,720,287 64 3,081 0 651,273 15
SO UTH CENTRAL
T ravis, Lake 1,113,348 1,094,263 98 -19,085 -2 186,048 17
*Austin, Lake 23,972 22,772 95 46 0 -309 -1
Somerville Lake 147,104 147,104 100 0 0 0 0
Canyon Lake 378,781 377,876 100 -905 -0 -905 -0
Medina Lake 254,823 238,481 94 -7,921 -3 77,665 30
*Coleto Creek Reservoir 31,040 25,495 82 -1,687 -5 -3,528 -11
TO TAL 1,949,068 1,905,991 98 -29,552 -2 258,971 13
UPPER CO AST
Houston, Lake 120,686 120,686 100 0 0 0 0
Texana, Lake 159,566 146,949 92 -8,960 -6 -12,617 -8
TO TAL 280,252 267,635 95 -8,960 -3 -12,617 -5
SO UTHERN
Choke Canyon Reservoir 662,820 275,507 42 -6,349 -1 48,693 7
Corpus Christi, Lake 256,961 239,789 93 21,903 9 18,410 7
*Falcon Reservoir (Texas) 1,551,007 542,560 35 -10,525 -1 -194,702 -13
*Falcon Reservoir (TX & Mexico) 2,646,817 542,560 20 -10,525 -0 -194,702 -7
TO TAL 2,470,788 1,057,856 43 5,029 0 -127,599 -5
STATEWIDE TOTAL
STATEWIDE TO TAL 31,242,774 26,058,846 83 -485,239 -2 582,664 2
Elephant Butte Reservoir 1,973,358 128,628 7 -3,140 -0 -54,096 -3
* Conservation volume is used as conservation storage capacity because the dead storage is unknown.
**Monthly and yearly changes do not include reservoirs that did not have data in last monthly or last year, respectively.
Note:
Conservation storage capacity is the space available to store water above the lowest outlet and below the top of conservation pool, or normal maximum operating level. Conservation storage refers to the volume of water held within
the conservation storage space. Not included is any water in flood control storage (above the top of conservation pool or
normal maximum operating level) or any water in the dead storage. Conservation storage percentage is based on the
conservation storage capacity of the reservoir and the conservation storage in the reservoir on date shown. Percent change
is given by 100*(current conservation storage - past conservation storage)/conservation storage capacity. Figures shown
are for the Texas share of conservation storage in all reservoirs.
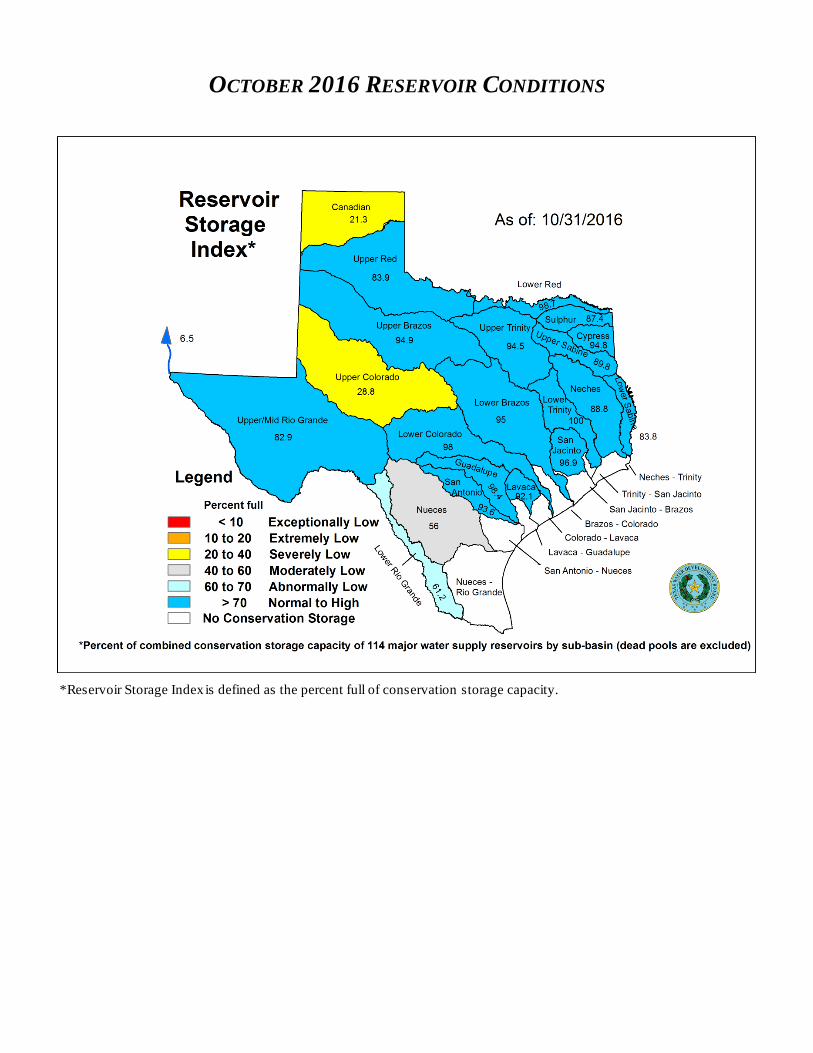
OCTOBER 2016 RESERVOIR CONDITIONS
*Reservoir Storage Index is defined as the percent full of conservation storage capacity.
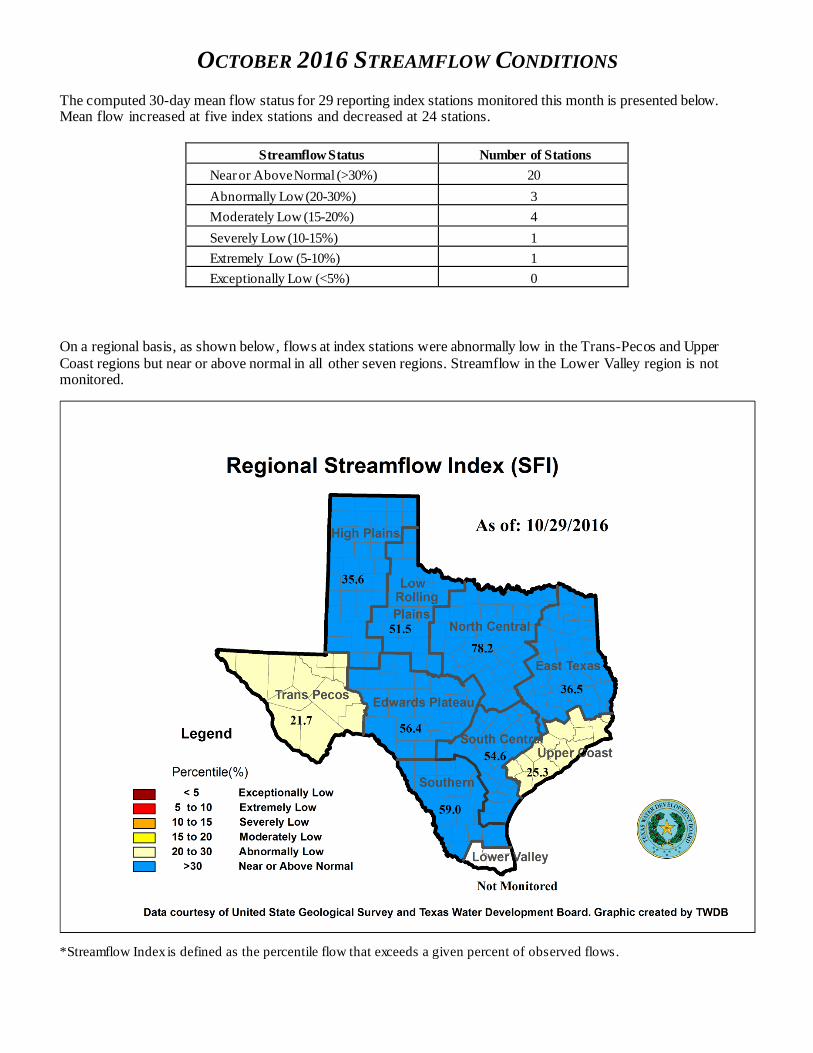
OCTOBER 2016 STREAMFLOW CONDITIONS
The computed 30-day mean flow status for 29 reporting index stations monitored this month is presented below. Mean flow increased at five index stations and decreased at 24 stations.
Streamflow Status Number of Stations
Near or Above Normal (>30%) 20
Abnormally Low (20-30%) 3
Moderately Low (15-20%) 4
Severely Low (10-15%) 1
Extremely Low (5-10%) 1
Exceptionally Low (<5%) 0
On a regional basis, as shown below, flows at index stations were abnormally low in the Trans-Pecos and Upper
Coast regions but near or above normal in all other seven regions. Streamflow in the Lower Valley region is not monitored.
*Streamflow Index is defined as the percentile flow that exceeds a given percent of observed flows.
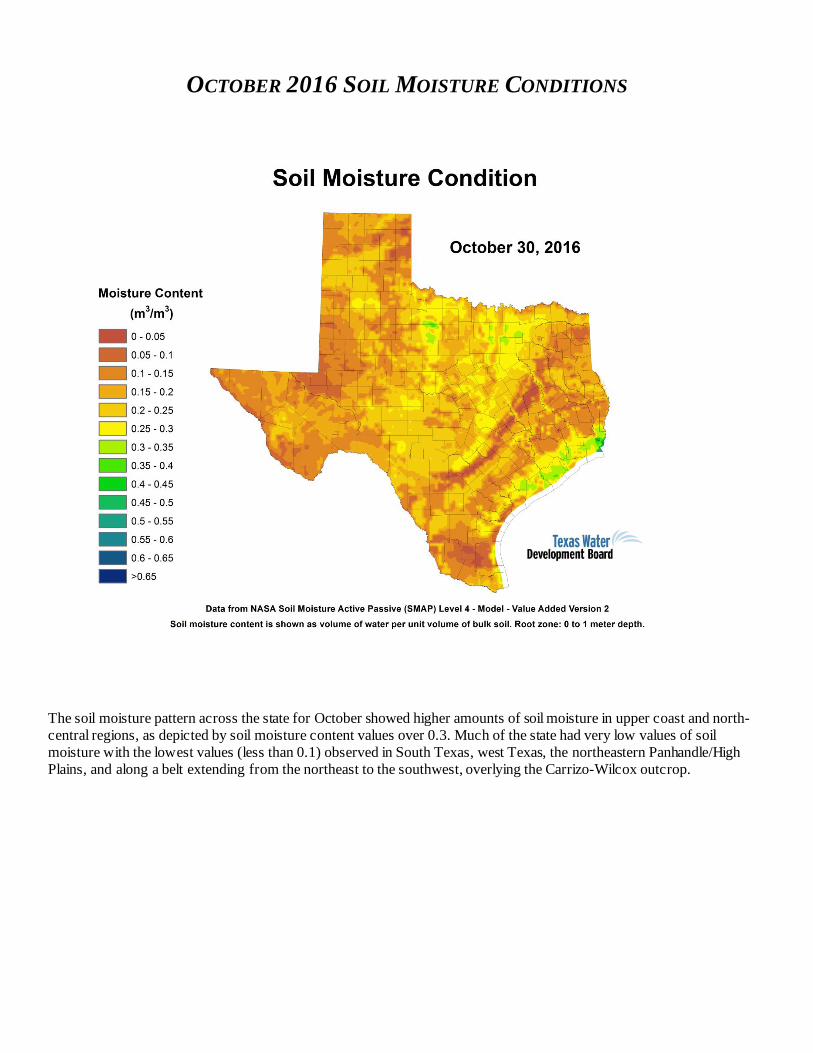
OCTOBER 2016 SOIL MOISTURE CONDITIONS
The soil moisture pattern across the state for October showed higher amounts of soil moisture in upper coast and north-
central regions, as depicted by soil moisture content values over 0.3. Much of the state had very low values of soil
moisture with the lowest values (less than 0.1) observed in South Texas, west Texas, the northeastern Panhandle/High
Plains, and along a belt extending from the northeast to the southwest, overlying the Carrizo-Wilcox outcrop.
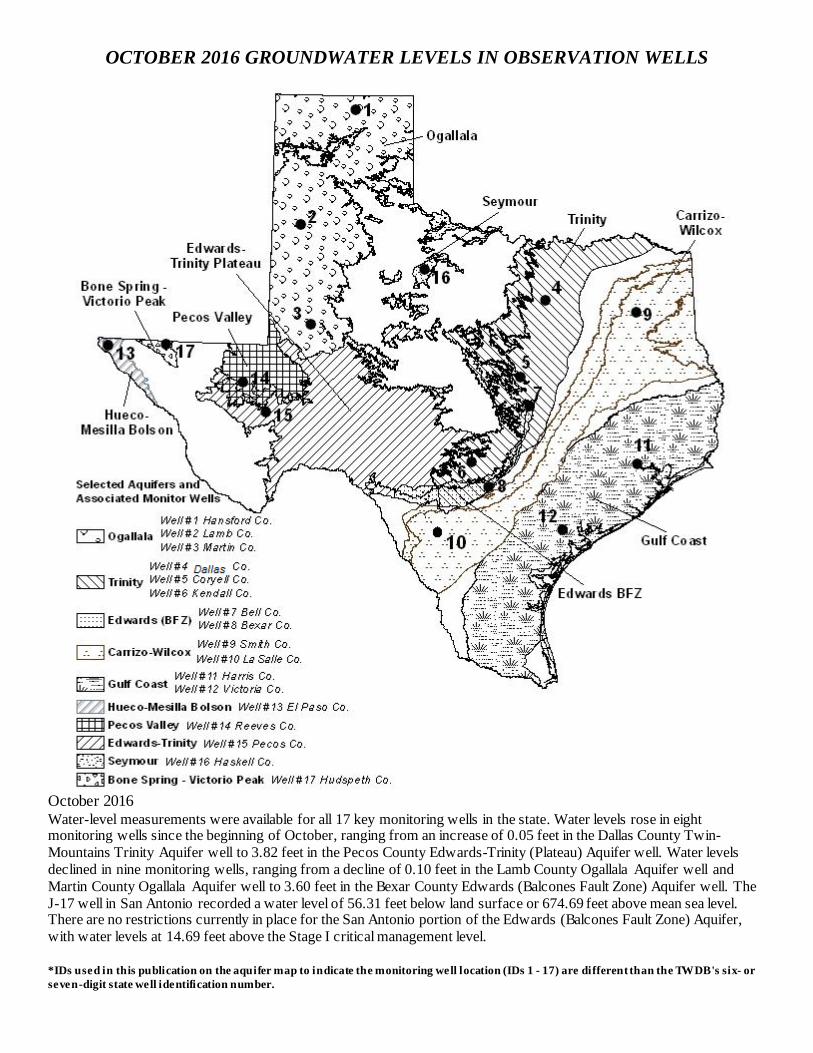
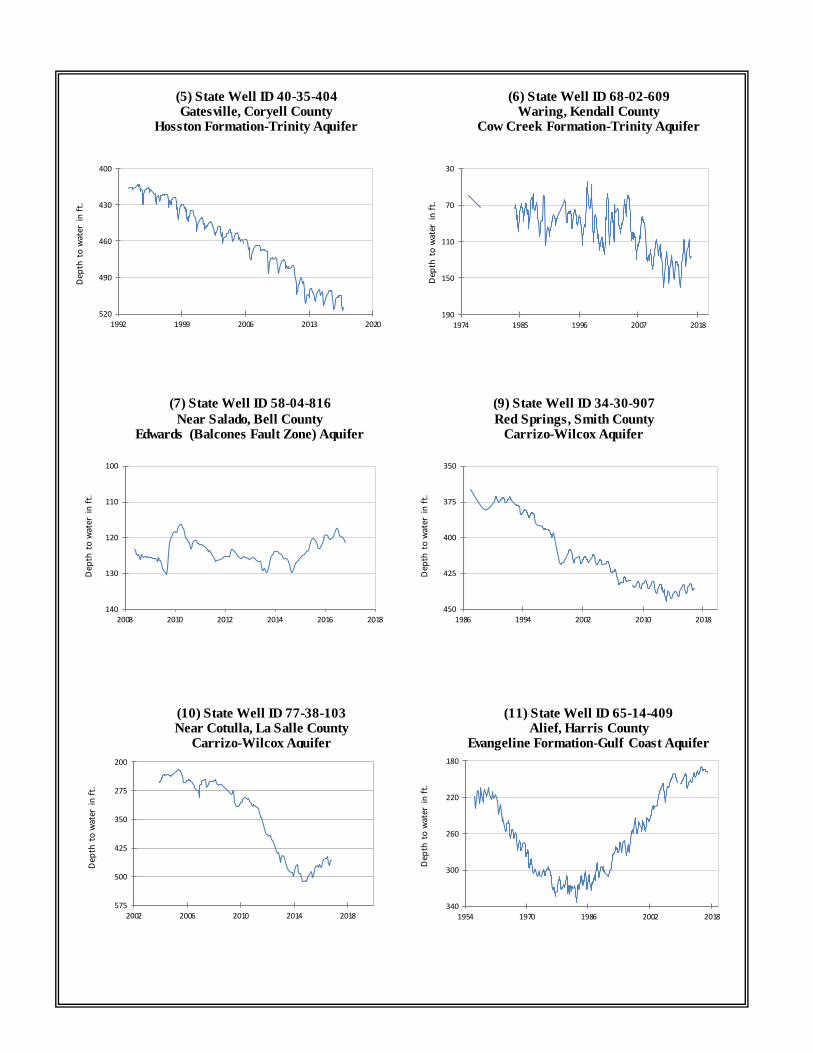
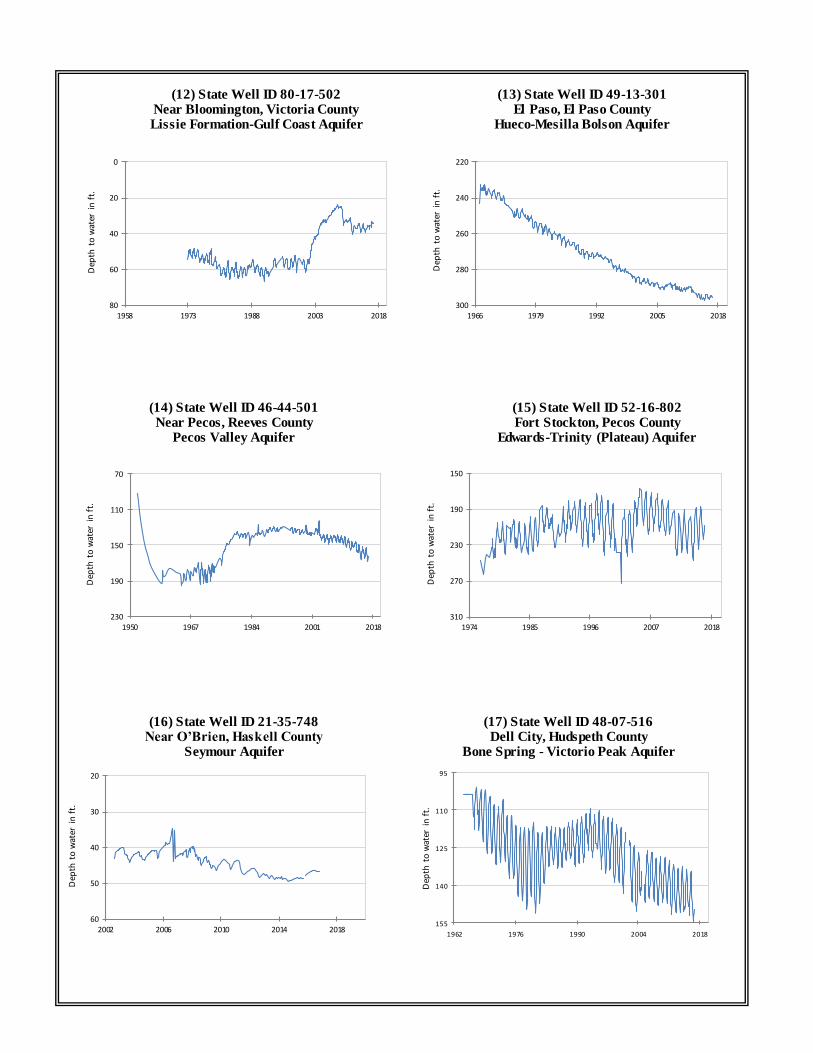
OCTOBER 2016 GROUNDWATER LEVELS IN OBSERVATION WELLS
October 2016 Water-level measurements were available for all 17 key monitoring wells in the state. Water levels rose in eight monitoring wells since the beginning of October, ranging from an increase of 0.05 feet in the Dallas County Twin-
Mountains Trinity Aquifer well to 3.82 feet in the Pecos County Edwards-Trinity (Plateau) Aquifer well. Water levels
declined in nine monitoring wells, ranging from a decline of 0.10 feet in the Lamb County Ogallala Aquifer well and
Martin County Ogallala Aquifer well to 3.60 feet in the Bexar County Edwards (Balcones Fault Zone) Aquifer well. The
J-17 well in San Antonio recorded a water level of 56.31 feet below land surface or 674.69 feet above mean sea level. There are no restrictions currently in place for the San Antonio portion of the Edwards (Balcones Fault Zone) Aquifer,
with water levels at 14.69 feet above the Stage I critical management level.
*IDs used in this publication on the aquifer map to indicate the monitoring well location (IDs 1 - 17) are different than the TWDB's six- or
seven-digit state well identification number.
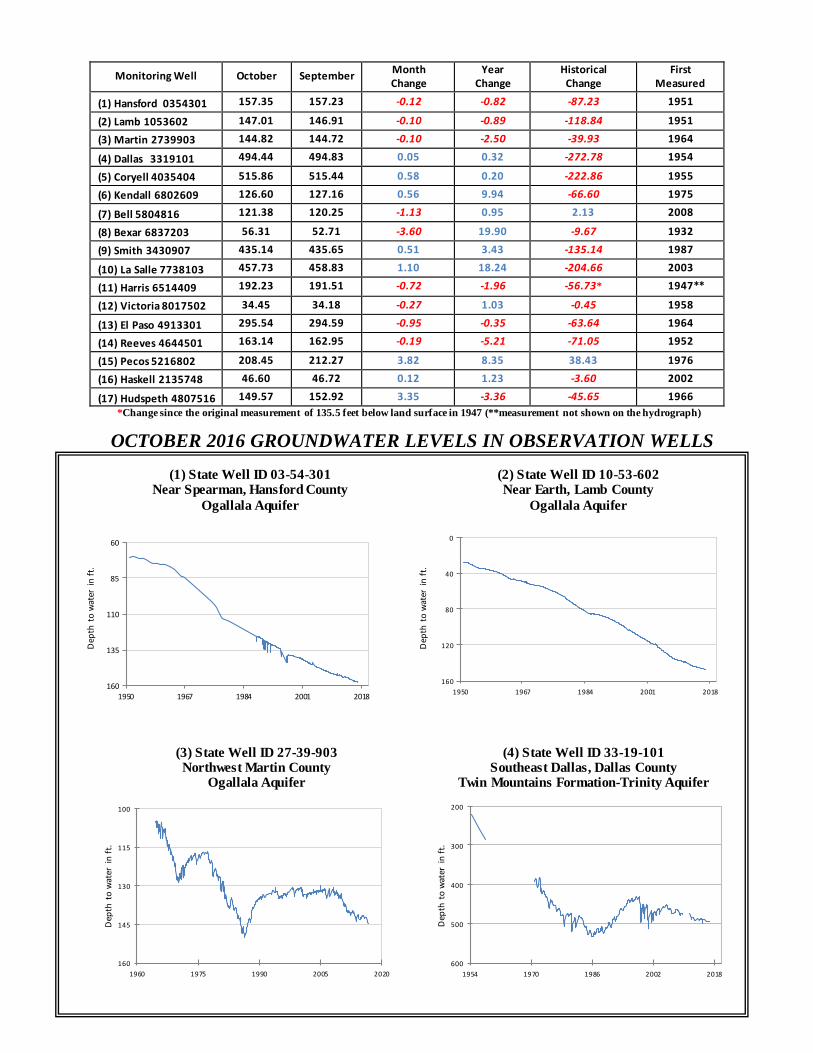
Monitoring Well October September Month Change
Year Change
Historical Change
First Measured
(1) Hansford 0354301 157.35 157.23 -0.12 -0.82 -87.23 1951
(2) Lamb 1053602 147.01 146.91 -0.10 -0.89 -118.84 1951
(3) Martin 2739903 144.82 144.72 -0.10 -2.50 -39.93 1964
(4) Dallas 3319101 494.44 494.83 0.05 0.32 -272.78 1954
(5) Coryell 4035404 515.86 515.44 0.58 0.20 -222.86 1955
(6) Kendall 6802609 126.60 127.16 0.56 9.94 -66.60 1975
(7) Bell 5804816 121.38 120.25 -1.13 0.95 2.13 2008
(8) Bexar 6837203 56.31 52.71 -3.60 19.90 -9.67 1932
(9) Smith 3430907 435.14 435.65 0.51 3.43 -135.14 1987
(10) La Salle 7738103 457.73 458.83 1.10 18.24 -204.66 2003
(11) Harris 6514409 192.23 191.51 -0.72 -1.96 -56.73* 1947**
(12) Victoria 8017502 34.45 34.18 -0.27 1.03 -0.45 1958
(13) El Paso 4913301 295.54 294.59 -0.95 -0.35 -63.64 1964
(14) Reeves 4644501 163.14 162.95 -0.19 -5.21 -71.05 1952
(15) Pecos 5216802 208.45 212.27 3.82 8.35 38.43 1976
(16) Haskell 2135748 46.60 46.72 0.12 1.23 -3.60 2002
(17) Hudspeth 4807516 149.57 152.92 3.35 -3.36 -45.65 1966
*Change since the original measurement of 135.5 feet below land surface in 1947 (**measurement not shown on the hydrograph)
OCTOBER 2016 GROUNDWATER LEVELS IN OBSERVATION WELLS
60
85
110
135
1601950 1967 1984 2001 2018
Dep
th t
o w
ater
in
ft.
0
40
80
120
160
1950 1967 1984 2001 2018
Dep
th t
o w
ater
in
ft.
100
115
130
145
160
1960 1975 1990 2005 2020
Dep
th t
o w
ater
in
ft.
200
300
400
500
600
1954 1970 1986 2002 2018
Dep
th t
o w
ater
in
ft.
(2) State Well ID 10-53-602 Near Earth, Lamb County
Ogallala Aquifer
(1) State Well ID 03-54-301 Near Spearman, Hansford County
Ogallala Aquifer
(4) State Well ID 33-19-101 Southeast Dallas, Dallas County
Twin Mountains Formation-Trinity Aquifer
(3) State Well ID 27-39-903 Northwest Martin County
Ogallala Aquifer
400
430
460
490
5201992 1999 2006 2013 2020
Dep
th t
o w
ater
in
ft.
30
70
110
150
1901974 1985 1996 2007 2018
Dep
th t
o w
ater
in
ft.
100
110
120
130
1402008 2010 2012 2014 2016 2018
Dep
th t
o w
ater
in
ft.
350
375
400
425
4501986 1994 2002 2010 2018
Dep
th t
o w
ater
in
ft.
200
275
350
425
500
5752002 2006 2010 2014 2018
Dep
th t
o w
ater
in
ft.
180
220
260
300
3401954 1970 1986 2002 2018
Dep
th t
o w
ater
in
ft.
(5) State Well ID 40-35-404 Gatesville, Coryell County
Hosston Formation-Trinity Aquifer
(6) State Well ID 68-02-609 Waring, Kendall County
Cow Creek Formation-Trinity Aquifer
(7) State Well ID 58-04-816
Near Salado, Bell County Edwards (Balcones Fault Zone) Aquifer
(9) State Well ID 34-30-907
Red Springs, Smith County Carrizo-Wilcox Aquifer
(10) State Well ID 77-38-103 Near Cotulla, La Salle County
Carrizo-Wilcox Aquifer
(11) State Well ID 65-14-409 Alief, Harris County
Evangeline Formation-Gulf Coast Aquifer
0
20
40
60
801958 1973 1988 2003 2018
Dep
th t
o w
ater
in
ft.
220
240
260
280
3001966 1979 1992 2005 2018
Dep
th t
o w
ater
in
ft.
70
110
150
190
2301950 1967 1984 2001 2018
Dep
th t
o w
ater
in
ft.
150
190
230
270
3101974 1985 1996 2007 2018
Dep
th t
o w
ater
in
ft.
20
30
40
50
602002 2006 2010 2014 2018
Dep
th t
o w
ater
in
ft.
95
110
125
140
155
1962 1976 1990 2004 2018
Dep
th t
o w
ater
in
ft.
(12) State Well ID 80-17-502 Near Bloomington, Victoria County Lissie Formation-Gulf Coast Aquifer
(13) State Well ID 49-13-301 El Paso, El Paso County
Hueco-Mesilla Bolson Aquifer
(16) State Well ID 21-35-748 Near O’Brien, Haskell County
Seymour Aquifer
(17) State Well ID 48-07-516 Dell City, Hudspeth County
Bone Spring - Victorio Peak Aquifer
(14) State Well ID 46-44-501 Near Pecos, Reeves County
Pecos Valley Aquifer
(15) State Well ID 52-16-802 Fort Stockton, Pecos County
Edwards-Trinity (Plateau) Aquifer
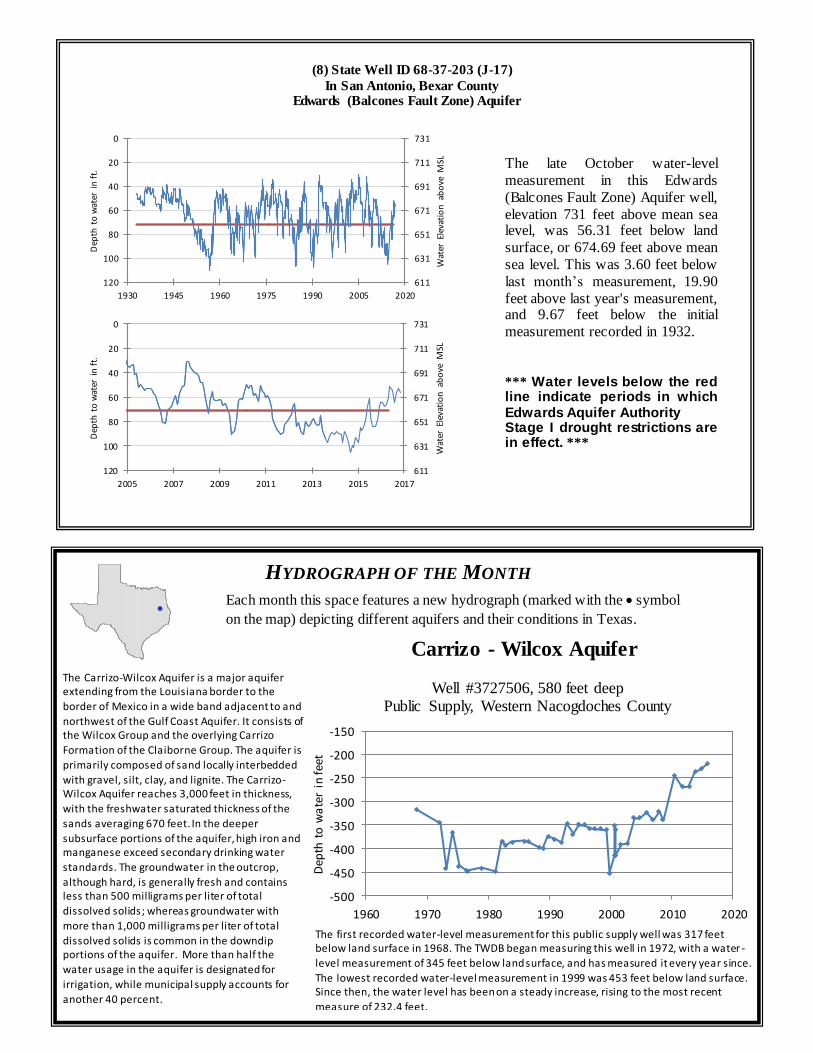
(8) State Well ID 68-37-203 (J-17)
In San Antonio, Bexar County Edwards (Balcones Fault Zone) Aquifer
HYDROGRAPH OF THE MONTH
-500
-450
-400
-350
-300
-250
-200
-150
1960 1970 1980 1990 2000 2010 2020
Dep
th t
o w
ate
r in
feet
Well #3727506, 580 feet deepPublic Supply, Western Nacogdoches County
611
631
651
671
691
711
7310
20
40
60
80
100
120
1930 1945 1960 1975 1990 2005 2020
Wat
er E
leva
tio
n a
bo
ve M
SL
Dep
th t
o w
ater
in
ft.
611
631
651
671
691
711
7310
20
40
60
80
100
120
2005 2007 2009 2011 2013 2015 2017
Wat
er E
leva
tio
n a
bo
ve M
SL
Dep
th t
o w
ater
in
ft.
The first recorded water-level measurement for this public supply well was 317 feet below land surface in 1968. The TWDB began measuring this well in 1972, with a water -
level measurement of 345 feet below land surface, and has measured it every year since.
The lowest recorded water-level measurement in 1999 was 453 feet below land surface. Since then, the water level has been on a steady increase, rising to the most recent
measure of 232.4 feet.
Each month this space features a new hydrograph (marked with the symbol
on the map) depicting different aquifers and their conditions in Texas.
The Carrizo-Wilcox Aquifer is a major aquifer extending from the Louisiana border to the
border of Mexico in a wide band adjacent to and
northwest of the Gulf Coast Aquifer. It consists of the Wilcox Group and the overlying Carrizo
Formation of the Claiborne Group. The aquifer is
primarily composed of sand locally interbedded
with gravel, silt, clay, and lignite. The Carrizo-Wilcox Aquifer reaches 3,000 feet in thickness,
with the freshwater saturated thickness of the
sands averaging 670 feet. In the deeper
subsurface portions of the aquifer, high iron and manganese exceed secondary drinking water
standards. The groundwater in the outcrop,
although hard, is generally fresh and contains less than 500 milligrams per liter of total
dissolved solids; whereas groundwater with
more than 1,000 milligrams per liter of total
dissolved solids is common in the downdip portions of the aquifer. More than half the
water usage in the aquifer is designated for
irrigation, while municipal supply accounts for
another 40 percent.
The late October water-level
measurement in this Edwards
(Balcones Fault Zone) Aquifer well,
elevation 731 feet above mean sea level, was 56.31 feet below land
surface, or 674.69 feet above mean
sea level. This was 3.60 feet below
last month’s measurement, 19.90
feet above last year's measurement, and 9.67 feet below the initial
measurement recorded in 1932.
*** Water levels below the red line indicate periods in which Edwards Aquifer Authority Stage I drought restrictions are in effect. ***
Carrizo - Wilcox Aquifer