Embed Size (px)
Citation preview

Texas
Water
Conditions Report
1700 N. Congress Ave., P.O. Box 13231, Austin, TX 78711-3231
Telephone (512) 463-7847 Fax (512) 936-0816 1-800-RELAYTX (for the hearing impaired)
www.twdb.texas.gov
AUGUST 2016 RESERVOIR STORAGE*
At the end of the month, total conservation storage in 114 of the state’s major water supply reservoirs was at 26.98 million acre-feet or 86% of total conservation storage capacity. This is approximately 0.06 million acre-feet more than a
month ago and 1.18 million acre-feet more than the storage at this time last year.
Thirty-seven (37) reservoirs held 100% of conservation storage capacity, primarily in the North Central (24) and East (8)
regions. Two (2) reservoirs remained below 10% full: Palo Duro (3%) and Twin Buttes (9%).
Total combined storage was at or above normal (storage ≥ 70%) in the North Central (97%), South Central (100%),
East (97%), Upper Coast (100%), Trans-Pecos (85%), and Low Rolling Plains (74%) regions. The region with the
lowest percentage of storage was the High Plains (22%) region. Overall, storage increased in five regions but declined
in four regions over the past month.
Elephant Butte reservoir held 133,532 acre-feet or 7% of storage capacity. This is 57,881 acre-feet less than a month
ago.
* Storage is based on end of the month data in 114 major reservoirs that represent 96% of the total conservation storage capaci ty of 188 major
water supply reservoirs in Texas. Major reservoirs are defined as having a conservation storage capacity of 5,000 acre-feet or greater. Only the
Texas share of storage in border reservoirs is counted.

CO NSERVATIO N STO RAGE DATA FO R SELECTED MAJO R TEXAS RESERVO IRS
Name of Lake or Reservoir
Conservation
Storage Capacity
(acre-feet)
Conservation Storage
end of August 2016
Change since
end of July 2016
Change since
end of August 2015
(acre-feet) (%) (acre-feet) (%) (acre-feet)** (%)
HIGH PLAINS
Palo Duro Reservoir 61,066 1,652 3 112 0 -185 -0
Meredith, Lake (Texas) 500,000 123,102 25 -4,250 -1 17,506 4
Meredith, Lake (Texas & Oklahoma) 779,556 123,102 16 -4,250 -1 17,506 2
MacKenzie Reservoir 46,450 7,141 15 69 0 -628 -1
White River Lake 29,880 7,991 27 -397 -1 -2,597 -9
TO TAL 637,396 139,886 22 -4,466 -1 14,096 2
LO W RO LLING PLAINS
Greenbelt Lake 59,968 16,500 28 1,516 3 3,463 6
N. Fork Buffalo Crk Reservoir 15,400 11,548 75 -637 -4 -14 -0
Kemp, Lake 245,307 221,452 90 -15,814 -6 28,725 12
Millers Creek Reservoir 26,768 24,075 90 -709 -3 -1,237 -5
Alan Henry Reservoir 94,808 85,734 90 -1,523 -2 -6,867 -7
Stamford, Lake 51,570 46,122 89 -1,531 -3 -905 -2
J B Thomas, Lake 199,931 127,045 64 -3,057 -2 -25,474 -13
Fort Phantom Hill, Lake 70,030 66,374 95 -1,215 -2 21,631 31
Sweetwater, Lake 12,267 2,678 22 -87 -1 1,211 10
Colorado City, Lake 30,758 7,374 24 -309 -1 -2,003 -7
Champion Creek Reservoir 41,580 10,261 25 -303 -1 4,499 11
Abilene, Lake 7,900 7,847 99 530 7 7,581 96
Coleman, Lake 38,075 35,837 94 -765 -2 8,907 23
Hords Creek Lake 8,443 7,380 87 -220 -3 4,043 48
TO TAL 902,805 670,227 74 -24,124 -3 43,560 5
NO RTH CENTRAL
Nocona, Lake (Farmers Crk) 21,444 20,096 94 -603 -3 -432 -2
Hubert H Moss Lake 24,058 22,174 92 -1,229 -5 -795 -3
Texoma, Lake (Texas) 1,258,113 1,224,906 97 -33,207 -3 -33,207 -3
Texoma, Lake (Texas & Oklahoma) 2,525,281 1,224,906 49 -33,207 -1 -33,207 -1
*Pat Mayse Lake 113,683 109,097 96 -1,725 -2 no data Kickapoo, Lake 86,345 82,925 96 58 0 1,255 1
Arrowhead, Lake 230,359 210,281 91 -5,132 -2 -13,033 -6
Bonham, Lake 11,027 9,256 84 -422 -4 -78 -1
Crook, Lake 9,195 8,325 91 -154 -2 325 4
Amon G Carter, Lake 19,266 19,266 100 0 0 289 2
Ray Roberts, Lake 788,167 788,167 100 284 0 0 0
Jim Chapman Lake (Cooper) 260,332 236,728 91 -9,991 -4 -4,883 -2
Graham, Lake 45,288 45,288 100 2,680 6 3,492 8
*Lost Creek Reservoir 11,950 11,887 99 168 1 164 1
Bridgeport, Lake 366,236 366,236 100 0 0 21,546 6
Lewisville Lake 563,228 563,228 100 0 0 0 0
Lavon Lake 406,388 368,854 91 -17,934 -4 -4,011 -1
Hubbard Creek Reservoir 318,067 297,005 93 -1,575 -0 188,175 59
Possum Kingdom Lake 523,873 522,404 100 4,721 1 4,721 1
*Mineral Wells, Lake 6,760 6,760 100 163 2 279 4
Weatherford, Lake 17,812 17,725 100 1,181 7 2,249 13
Eagle Mountain Lake 179,880 179,880 100 1,462 1 11,759 7
Worth, Lake 33,495 33,495 100 2,870 9 4,257 13
Grapevine Lake 164,703 164,703 100 0 0 0 0
Ray Hubbard, Lake 452,040 436,565 97 -3,907 -1 15,134 3
New Terrell City Lake 8,583 8,385 98 -34 -0 290 3
Palo Pinto, Lake 26,766 25,361 95 -884 -3 1,048 4
Benbrook Lake 85,648 82,208 96 -782 -1 9,942 12
Arlington, Lake 40,188 32,458 81 -2,756 -7 1,646 4

CO NSERVATIO N STO RAGE DATA FO R SELECTED MAJO R TEXAS RESERVO IRS
Name of Lake or Reservoir
Conservation
Storage Capacity
(acre-feet)
Conservation Storage
end of August 2016
Change since
end of July 2016
Change since
end of August 2015
(acre-feet) (%) (acre-feet) (%) (acre-feet)** (%)
(North Central continued)
Joe Pool Lake 175,358 171,742 98 -2,435 -1 -3,616 -2
*Cisco, Lake 25,895 25,895 100 0 0 7,605 29
Leon, Lake 27,762 24,665 89 -1,014 -4 -282 -1
Granbury, Lake 125,756 125,756 100 76 0 0 0
Pat Cleburne, Lake 26,008 24,137 93 -953 -4 1,199 5
Waxahachie, Lake 10,780 10,684 99 160 1 1,606 15
Bardwell Lake 46,122 46,122 100 657 1 937 2
Proctor Lake 54,762 51,531 94 -2,679 -5 -3,231 -6
Whitney, Lake 553,344 509,716 92 -10,526 -2 -14,656 -3
Aquilla Lake 43,243 43,243 100 0 0 3,500 8
Navarro Mills Lake 49,827 49,827 100 0 0 1,542 3
*Halbert, Lake 6,033 5,312 88 49 1 335 6
Richland-Chambers Reservoir 1,087,839 1,087,839 100 9,830 1 9,404 1
*Brownwood, Lake 128,839 122,662 95 -2,403 -2 252 0
Waco, Lake 189,418 189,418 100 648 0 10,137 5
Limestone, Lake 203,780 197,009 97 4,376 2 17,005 8
Belton Lake 435,225 435,225 100 0 0 0 0
Stillhouse Hollow Lake 227,771 227,771 100 0 0 3,845 2
Georgetown, Lake 36,823 36,823 100 231 1 6,199 17
Granger Lake 51,822 51,822 100 0 0 0 0
Tawakoni, Lake 871,685 829,499 95 -27,844 -3 -14,032 -2
Mountain Creek, Lake 22,850 22,850 100 0 0 23 0
Squaw Creek, Lake 151,250 151,250 100 0 0 0 0
TO TAL 10,625,086 10,334,461 97 -98,575 -1 237,904 2
EAST
Wright Patman Lake 231,496 231,496 100 0 0 0 0
*Sulphur Springs, Lake 17,747 16,380 92 -619 -3 760 4
Cypress Springs, Lake 66,756 63,908 96 948 1 1,293 2
Bob Sandlin, Lake 190,822 186,866 98 1,364 1 no data
Caddo, Lake 29,898 29,898 100 0 0 0 0
Martin, Lake 75,726 72,448 96 2,961 4 3,291 4
Monticello, Lake 34,740 34,740 100 0 0 468 1
Fork Reservoir, Lake 605,061 569,950 94 -4,296 -1 -4,042 -1
O the Pines, Lake 268,566 268,566 100 0 0 2,787 1
Cedar Creek Reservoir in Trinity 644,686 621,747 96 4,773 1 15,827 2
Athens, Lake 29,503 28,573 97 -126 -0 867 3
Palestine, Lake 367,303 348,652 95 -1,794 -0 4,457 1
Tyler, Lake 72,073 68,147 95 317 0 2,107 3
Murvaul, Lake 38,285 36,752 96 975 3 1,907 5
Jacksonville, Lake 25,670 25,670 100 335 1 1,213 5
Nacogdoches, Lake 39,522 39,151 99 2,678 7 3,554 9
Houston County Lake 17,113 17,113 100 767 4 1,432 8
Sam Rayburn Reservoir 2,857,077 2,765,277 97 -21,167 -1 -53,618 -2
Toledo Bend Reservoir (Texas) 2,236,450 2,095,782 94 -60,340 -3 53,252 2
Toledo Bend Reservoir (TX & LA) 4,472,900 2,095,782 47 -60,340 -1 53,252 1
*Livingston, Lake 1,785,348 1,785,348 100 0 0 0 0
B A Steinhagen Lake 66,961 63,416 95 -1,762 -3 -1,034 -2
Conroe, Lake 410,988 410,988 100 10,103 2 21,369 5
TO TAL 10,111,791 9,780,868 97 -64,883 -1 55,890 1
TRANS-PECO S
Red Bluff Reservoir 151,110 129,099 85 6,422 4 20,288 13
TO TAL 151,110 129,099 85 6,422 4 20,288 13

CO NSERVATIO N STO RAGE DATA FO R SELECTED MAJO R TEXAS RESERVO IRS
Name of Lake or Reservoir
Conservation
Storage Capacity
(acre-feet)
Conservation Storage
end of August 2016
Change since
end of July 2016
Change since
end of August 2015
(acre-feet) (%) (acre-feet) (%) (acre-feet)** (%)
EDWARDS PLATEAU
Oak Creek Reservoir 39,210 18,870 48 517 1 8,259 21
E V Spence Reservoir 517,272 49,609 10 -1,726 -0 11,419 2
O C Fisher Lake 115,742 15,811 14 -903 -1 3,010 3
*O H Ivie Reservoir 554,340 118,689 21 -5,676 -1 36,431 7
Twin Buttes Reservoir 182,454 16,524 9 -946 -1 5,149 3
Nasworthy 9,615 8,048 84 -258 -3 -135 -1
Brady Creek Reservoir 28,808 14,182 49 -436 -2 4,396 15
Buchanan, Lake 816,904 811,266 99 866 0 224,190 27
Inks, Lake 13,962 12,877 92 -98 -1 -173 -1
Lyndon B Johnson, Lake 115,249 110,636 96 487 0 122 0
*Amistad Reservoir (Texas) 1,840,849 1,466,747 80 95,804 5 314,375 17
*Amistad Reservoir (TX & Mexico) 3,275,532 1,466,747 45 95,804 3 314,375 10
TO TAL 4,234,405 2,643,259 62 87,631 2 607,043 14
SO UTH CENTRAL
T ravis, Lake 1,113,348 1,113,348 100 37,005 3 226,096 20
*Austin, Lake 23,972 22,696 95 46 0 -76 -0
Somerville Lake 147,104 147,104 100 0 0 0 0
Canyon Lake 378,781 378,781 100 0 0 8,503 2
Medina Lake 254,823 251,679 99 -663 -0 69,927 27
*Coleto Creek Reservoir 31,040 28,671 92 -329 -1 no data
TO TAL 1,949,068 1,942,279 100 36,059 2 304,450 16
UPPER CO AST
Houston, Lake 120,686 120,686 100 0 0 0 0
Texana, Lake 159,566 159,382 100 8,431 5 15,424 10
TO TAL 280,252 280,068 100 8,431 3 15,424 6
SO UTHERN
Choke Canyon Reservoir 695,262 304,194 44 74,542 11 66,596 10
Corpus Christi, Lake 256,961 211,292 82 51,108 20 -18,887 -7
*Falcon Reservoir (Texas) 1,551,007 540,811 35 -9,162 -1 -165,375 -11
*Falcon Reservoir (TX & Mexico) 2,646,817 540,811 20 -9,162 -0 -165,375 -6
TO TAL 2,503,230 1,056,297 42 116,488 5 -117,666 -5
STATEWIDE TOTAL
STATEWIDE TO TAL 31,395,143 26,976,444 86 62,983 0 1,180,989 4
Elephant Butte Reservoir 1,973,358 133,532 7 -57,881 -3 -53,039 -3
* Conservation volume is used as conservation storage capacity because the dead storage is unknown.
** Monthly and yearly changes do not include reservoirs that did not have data in last monthly or last year, respectively.
Note:
Conservation storage capacity is the space available to store water above the lowest outlet and below the top of conservation pool, or normal maximum operating level. Conservation storage refers to the volume of water held within
the conservation storage space. Not included is any water in flood control storage (above the top of conservation pool or
normal maximum operating level) or any water in the dead storage. Conservation storage percentage is based on the
conservation storage capacity of the reservoir and the conservation storage in the reservoir on date shown. Percent change
is given by 100*(current conservation storage - past conservation storage)/conservation storage capacity. Figures shown
are for the Texas share of conservation storage in all reservoirs.

AUGUST 2016 RESERVOIR CONDITIONS
*Reservoir Storage Index is defined as the percent full of conservation storage capacity.

AUGUST 2016 STREAMFLOW CONDITIONS
The computed 30-day mean flow status for 29 reporting index stations monitored this month is presented below. Mean flow increased at 22 index stations, decreased at six (6) stations, and remained unchanged at one (1)
station.
Streamflow Status Number of Stations
Near or Above Normal (>30%) 26
Abnormally Low (20-30%) 1
Moderately Low (15-20%) 1
Severely Low (10-15%) 0
Extremely Low (5-10%) 1
Exceptionally Low (<5%) 0
On a regional basis, as shown below, flows at index stations were near or above normal in all nine regions.
Streamflow in the Lower Valley region is not monitored.
*Streamflow Index is defined as the percentile flow that exceeds a given percent of observed flows .

AUGUST 2016 SOIL MOISTURE CONDITIONS
Soil moisture has decreased across much of the central and eastern portion of the state in the past month. Soil moisture
content in major portions of central, north, and east Texas are in 0.2–0.45 range but is mostly below 0.2 in west and
Panhandle regions.
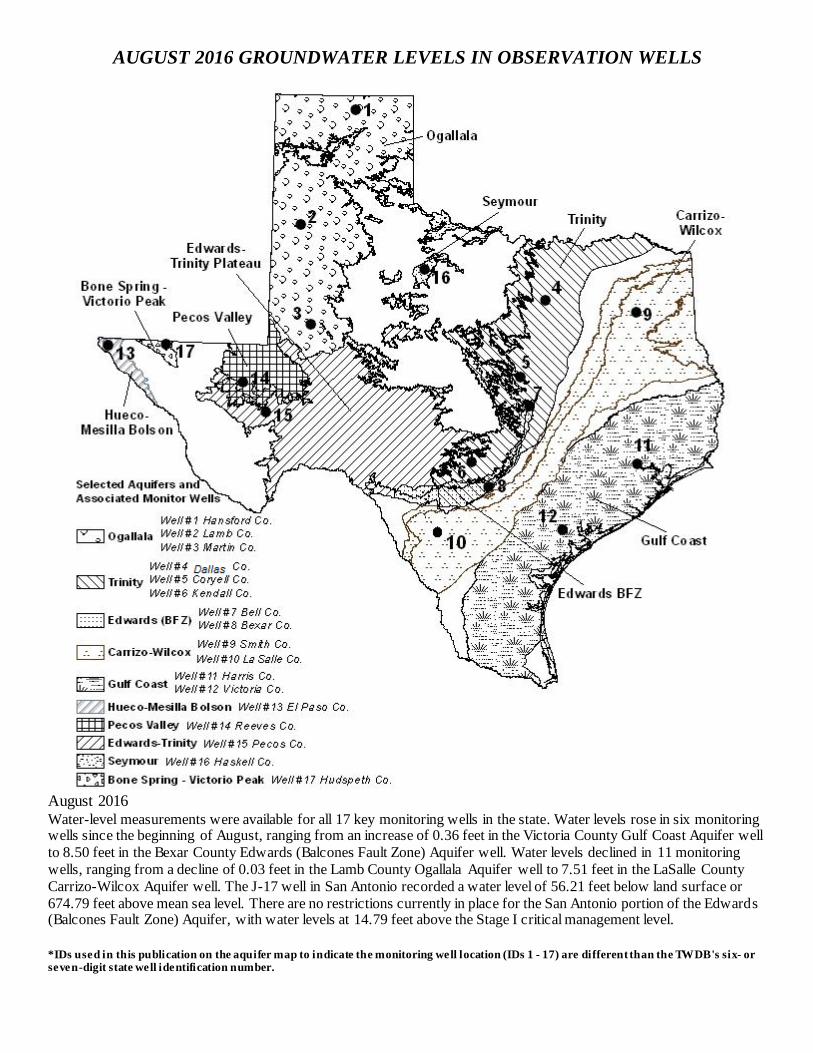
AUGUST 2016 GROUNDWATER LEVELS IN OBSERVATION WELLS
August 2016 Water-level measurements were available for all 17 key monitoring wells in the state. Water levels rose in six monitoring wells since the beginning of August, ranging from an increase of 0.36 feet in the Victoria County Gulf Coast Aquifer well
to 8.50 feet in the Bexar County Edwards (Balcones Fault Zone) Aquifer well. Water levels declined in 11 monitoring
wells, ranging from a decline of 0.03 feet in the Lamb County Ogallala Aquifer well to 7.51 feet in the LaSalle County
Carrizo-Wilcox Aquifer well. The J-17 well in San Antonio recorded a water level of 56.21 feet below land surface or
674.79 feet above mean sea level. There are no restrictions currently in place for the San Antonio portion of the Edwards (Balcones Fault Zone) Aquifer, with water levels at 14.79 feet above the Stage I critical management level.
*IDs used in this publication on the aquifer map to indicate the monitoring well location (IDs 1 - 17) are different than the TWDB's six- or seven-digit state well identification number.

Monitoring Well August July Month Change
Year Change
Historical Change
First Measured
(1) Hansford 0354301 157.26 157.16 -0.10 -0.84 -87.14 1951
(2) Lamb 1053602 146.88 146.85 -0.03 -1.04 -118.71 1951
(3) Martin 2739903 144.57 144.38 -0.19 -2.81 -39.68 1964
(4) Dallas 3319101 494.70 494.23 -0.47 -2.56 -272.70 1954
(5) Coryell 4035404 517.54 512.33 -5.21 -1.55 -225.54 1955
(6) Kendall 6802609 128.23 124.56 -3.67 2.01 -68.23 1975
(7) Bell 5804816 119.44 119.29 -0.15 1.97 4.07 2008
(8) Bexar 6837203 56.21 64.71 8.50 27.10 -9.57 1932
(9) Smith 3430907 435.50 436.39 0.89 2.12 -135.5 1987
(10) La Salle 7738103 470.54 463.03 -7.51 1.38 -217.47 2003
(11) Harris 6514409 191.10 190.15 -0.95 -3.77 -55.60* 1947**
(12) Victoria 8017502 33.84 34.20 0.36 2.22 0.16 1958
(13) El Paso 4913301 295.04 295.41 0.37 -0.59 -63.14 1964
(14) Reeves 4644501 163.16 168.64 5.48 2.11 -71.07 1952
(15) Pecos 5216802 219.73 223.95 4.22 11.41 27.15 1976
(16) Haskell 2135748 46.73 46.54 -0.19 1.83 -3.73 2002
(17) Hudspeth 4807516 154.70 154.06 -0.64 -7.15 -50.78 1966
*Change since the original measurement of 135.5 feet below land surface in 1947 (**measurement not shown on the hydrograph)
AUGUST 2016 GROUNDWATER LEVELS IN OBSERVATION WELLS
60
85
110
135
160
1950 1967 1984 2001 2018
Dep
th t
o w
ater
in
ft.
0
40
80
120
160
1950 1967 1984 2001 2018
Dep
th t
o w
ater
in
ft.
100
115
130
145
160
1960 1975 1990 2005 2020
Dep
th t
o w
ater
in
ft.
200
300
400
500
600
1954 1970 1986 2002 2018
Dep
th t
o w
ater
in
ft.
(2) State Well ID 10-53-602 Near Earth, Lamb County
Ogallala Aquifer
(1) State Well ID 03-54-301 Near Spearman, Hansford County
Ogallala Aquifer
(4) State Well ID 33-19-101
Southeast Dallas, Dallas County Twin Mountains Formation-Trinity Aquifer
(3) State Well ID 27-39-903
Northwest Martin County Ogallala Aquifer

400
430
460
490
520
1992 1999 2006 2013 2020
Dep
th t
o w
ater
in
ft.
30
70
110
150
190
1974 1985 1996 2007 2018
Dep
th t
o w
ater
in
ft.
100
110
120
130
140
2008 2010 2012 2014 2016 2018
Dep
th t
o w
ater
in
ft.
350
375
400
425
450
1986 1994 2002 2010 2018
Dep
th t
o w
ater
in
ft.
200
275
350
425
500
575
2002 2006 2010 2014 2018
Dep
th t
o w
ater
in
ft.
180
220
260
300
340
1954 1970 1986 2002 2018
Dep
th t
o w
ater
in
ft.
(5) State Well ID 40-35-404 Gatesville, Coryell County
Hosston Formation-Trinity Aquifer
(6) State Well ID 68-02-609 Waring, Kendall County
Cow Creek Formation-Trinity Aquifer
(7) State Well ID 58-04-816 Near Salado, Bell County
Edwards (Balcones Fault Zone) Aquifer
(9) State Well ID 34-30-907 Red Springs, Smith County
Carrizo-Wilcox Aquifer
(10) State Well ID 77-38-103 Near Cotulla, La Salle County
Carrizo-Wilcox Aquifer
(11) State Well ID 65-14-409 Alief, Harris County
Evangeline Formation-Gulf Coast Aquifer

0
20
40
60
80
1958 1973 1988 2003 2018
Dep
th t
o w
ater
in
ft.
220
240
260
280
300
1966 1979 1992 2005 2018
Dep
th t
o w
ater
in
ft.
70
110
150
190
230
1950 1967 1984 2001 2018
Dep
th t
o w
ater
in
ft.
150
190
230
270
310
1974 1985 1996 2007 2018
Dep
th t
o w
ater
in
ft.
20
30
40
50
60
2002 2006 2010 2014 2018
Dep
th t
o w
ater
in
ft.
95
110
125
140
155
1962 1976 1990 2004 2018
Dep
th t
o w
ater
in
ft.
(12) State Well ID 80-17-502
Near Bloomington, Victoria County Lissie Formation-Gulf Coast Aquifer
(13) State Well ID 49-13-301
El Paso, El Paso County Hueco-Mesilla Bolson Aquifer
(16) State Well ID 21-35-748 Near O’Brien, Haskell County
Seymour Aquifer
(17) State Well ID 48-07-516 Dell City, Hudspeth County
Bone Spring - Victorio Peak Aquifer
(14) State Well ID 46-44-501
Near Pecos, Reeves County Pecos Valley Aquifer
(15) State Well ID 52-16-802
Fort Stockton, Pecos County Edwards-Trinity (Plateau) Aquifer

(8) State Well ID 68-37-203 (J-17)
In San Antonio, Bexar County Edwards (Balcones Fault Zone) Aquifer
HYDROGRAPH OF THE MONTH
-240
-235
-230
-225
-220
-215
-210
-205
-200
1960 1970 1980 1990 2000 2010 2020
Dep
th t
o w
ate
r in
feet
Well #4807418, 948 feet deepUnused, northern Hudspeth County
611
631
651
671
691
711
7310
20
40
60
80
100
120
1930 1945 1960 1975 1990 2005 2020
Wat
er E
leva
tio
n a
bo
ve M
SL
Dep
th t
o w
ater
in
ft.
611
631
651
671
691
711
7310
20
40
60
80
100
120
2005 2007 2009 2011 2013 2015 2017
Wat
er E
leva
tio
n a
bo
ve M
SL
Dep
th t
o w
ater
in
ft.
The first recorded water-level measurement of this unused well was 202.05 feet below land surface in 1967 by the United States Geological Survey. The TWDB
began measuring this well in 1969 and has measured every year since. This 1969 measurement of 201.69 feet below land surface was the highest recorded measurement. Over the past 15 years, the water level has been mainly declining
due to continued, steady, nearby irrigation pumping. The lowest water-level
measurement was recorded in 2016 at 234.03 feet below land surface.
Each month this space features a new hydrograph (marked with the symbol
on the map) depicting different aquifers and their conditions in Texas.
The Bone Springs – Victorio Peak Aquifer
is a minor aquifer located in Northern Hudspeth County. The principal water-
bearing units in the aquifer are the Permian aged Bone Springs and Victorio Peak limestones. The formations produce
groundwater from solution cavities developed along joints and fracture planes. Water is generally slightly saline, with
total dissolved solids of 1,000 to 3,000 milligrams per liter. In the Dell Valley
area, total dissolved solids increase to 3,000 to 10,000 milligrams per liter. Since the late 1940s, pumping has been the
number one means of discharge for the aquifer. Water levels have declined in the Dell Valley area from 5 to 60 feet, with an
average of about 30 feet over a period of about 55 years. These declines are most
likely due to pumping for irrigation. Water levels over the last 30 years have been relatively constant, except for the last few
years, during which, water levels have
declined because of drought.
The late August water-level
measurement in this Edwards
(Balcones Fault Zone) Aquifer well,
elevation 731 feet above mean sea level, was 56.21 feet below land
surface, or 674.79 feet above mean
sea level. This was 8.50 feet above
last month’s measurement, 27.10
feet above last year's measurement, and 9.57 feet below the initial
measurement recorded in 1932.
*** Water levels below the red line indicate periods in which Edwards Aquifer Authority Stage I drought restrictions are in effect. ***
Bone Springs – Victorio Peak Aquifer