Embed Size (px)
Citation preview

October 2016 Energy Research Partnership
Potential Role of Hydrogen in the UK Energy System

The Energy Research Partnership«The Energy Research Partnership is a high-level forum bringing together key stakeholders and funders of energy research, development, demonstration and deployment in Government, industry and academia, plus other interested bodies, to identify and work together towards shared goals.
The Partnership has been designed to give strategic direction to UK energy innovation, seeking to influence the development of new technologies and enabling timely, focussed investments to be made. It does this by (i) influencing members in their respective individual roles and capacities and (ii) communicating views more widely to other stakeholders and decision makers as appropriate. ERP’s remit covers the whole energy system, including supply (nuclear, fossil fuels, renewables), infrastructure, and the demand side (built environment, energy efficiency, transport).
The ERP is co-chaired by Professor John Loughhead, Chief Scientific Advisor at the Department of Energy and Climate Change and Dr Keith MacLean (formerly Director of Policy & Research at Scottish and Southern Energy). A small in-house team provides independent and rigorous analysis to underpin the ERP’s work. The ERP is supported through members’ contributions.
Co-ChairsProf John Loughhead FREngDr Keith MacLean
MembersProf Julian Allwood Carl ArntzenDavid Ball Dr Peter Bance Prof Phil BlytheDr Masao ChakiDr David Clarke FREng Tom Delay Ian FunnellAngus Gillespie Dr Martin Grant FREng Derek GrieveProf Neville Jackson FREng Dr Ron Loveland Kathryn MagnayMargaret McGinlayDuncan McLaren Prof John Miles FREng Ali NainiRob Saunders Phillip SellwoodDr Robert SorrellMarta SmartProf Jim WatsonNick Winser FREngDavid Wright
ObserversDr David JoffeAndrew Wright
Chief Scientific Advisor Independent industry co-chair
Reader in Engineering Managing DirectorHead of Strategy and Business DevelopmentChief Executive OfficerChief Scientific AdvisorChief ResearcherChief Executive Chief Executive Managing Director, Power SystemsVice President CO2 Chief Executive Officer - Energy Exec Leader – Systems & Projects EngChief Technology & Innovation Officer Energy Advisor to Welsh Government Head of EnergyDirector, Energy & Clean TechnologyAdvisor Director & Professor of Energy Strategy Managing DirectorHead of Energy Chief Executive OfficerGroup Head of TechnologyHead of Partnership FundingExecutive DirectorChairman, Energy Systems CatapultDirector, Electricity Transmission Asset Management
Head of ModellingSenior Partner, Energy Systems
BEISFormerly of SSE
University of CambridgeBosch Thermotechnology LtdDrax Power LimitedOrigami Energy LtdDfTHitachi Europe LtdEnergy Technologies InstituteCarbon TrustABB LimitedShell Int’l Petroleum Co. LtdWS Atkins PLCGE Energy Power ConversionRicardo UK LtdWelsh GovernmentEPSRCScottish EnterpriseFriends of the Earth, UKArup / Cambridge UniversityTurquoise InternationalInnovateUKEnergy Saving TrustBPSSEUK Energy Research CentreRoyal Academy of EngineeringNational Grid
Committee on Climate ChangeOfgem
ERP MEMBERSHIP
2

Contents
Executive summary 4
1. Introduction 7
2. Hydrogen 8
3. Hydrogen in the energy system 10
4. Production and storage 18
5. Efficiency and demand for hydrogen 23
6. Carbon emissions 28
7. How Hydrogen might enter the energy system 31
8. UK capability 35
9. Conclusions 36
References 38
The Energy Research Partnership Reports
ERP Reports provide an overarching insight into the development challenges for key low-carbon technologies. Using the expertise of the ERP membership and wider stakeholder engagement, each report identifies the challenges for a particular cross-cutting issue, the state-of-the-art in addressing these challenges and the organisational landscape (including funding and RD&D) active in the area. The work seeks to identify critical gaps in activities that will prevent key low-carbon technologies from reaching their full potential and makes recommendations for investors and Government to address these gaps.
This project was guided by a steering group made up of experts from ERP members and other key organisations, as listed below.
The views in this report are not the official point of view of any organisation or individual and do not constitute government policy.
Lead AnalystRichard Heap
Steering GroupNeville Jackson (Chair)Peter BanceDennis Gammer
Energy Research Partnership
Ricardo UK LtdOrigami Energy LtdETI
Thanks also to the wide range of experts who helped inform this work and gave their time to be interviewed. A particular thanks to Richard Kemp-Harper, Liz Flint, Harsh Pershad, Rufus Ford, Nigel Holmes, Richard Mizzi and Alan Thomson.
If you have any queries please contact Richard Heap via [email protected] 3

Executive summary«Hydrogen appears to be a convincing pathway to decarbonisation that could be rolled out to a majority of gas customers by 2050. The main concerns are around the associated costs and deliverability of the necessary steam methane reforming plant and associated Carbon Capture and Storage (CCS) infrastructure to handle the large volumes of CO2, and how to secure long-term supplies of zero-carbon hydrogen.
The biggest challenges are where large volumes of hydrogen will come from and how to decarbonise it. Natural gas will be used to produce a majority, as it is cheaper than from wind or nuclear, but residual emissions from CCS and hydrocarbon extraction will need to be addressed. Surplus electricity from wind will produce only a small fraction of the hydrogen needed for heat; meeting this demand with electricity would require about 70 GW of additional nuclear capacity - seven times current capacity.
Replacing natural gas with hydrogen for heating will increase consumption of gas and produce more CO2. Some of the increase could be offset by measures to reduce energy demand for heat. Mixing hydrogen into the natural gas supply would provide little carbon reduction, even at high blends, and would be expensive, so switching has to be done area by area and straight to 100% hydrogen.
Imports of natural gas mean most of the upstream emissions from extraction are likely to be outside the UK. This may be an issue for meeting global climate targets set out in the Paris Agreement.
Zero-carbon hydrogen could be imported, using technologies such as very-high temperature solar thermal deployed in sunny regions, such as North Africa. But these are unlikely to be commercialised and cost competitive to meet early bulk demand.
A strategic, long-term plan is needed for hydrogen to make it zero-carbon
• Carbon capture and storage will need to be in place for early production in 2030
• Energy security implications of import dependency will need assessing, and appropriate measures developed.
Hydrogen is already entering the energy system in stand-alone applications. It has the potential to play a valuable, integrated role, helping to manage the electricity grid, fuel vehicle fleets and industry. These niche applications can develop without hydrogen from natural gas, but will benefit from removing regulatory and market barriers to help them become commercially viable.
4 Executive Summary
• Integration of hydrogeninto energy, transport, industry, chemicals
• Remove regulatory and market barriers
• Technology support• Whole system modelling
• Public engagement• Heat energy demand reduction
• Regulation for decarbonised hydrogen
Integrated in energy system • Electrolysis of surplus electricity• Industrial surplus
• Carbon Capture & Storage• Large-scale hydrogen storage• Building heat demand reduction
• Shipping – liquefaction• International / intercontinental
pipelines
Long-term strategy to decarbonise hydrogen
Hydrogen from natural gas• Mainly from Natural Gas SMR • Some from biomass & waste • Some from coal gasification
Stand-alone applicationsElec grid mgt, some transport
Decarbonisation of gas grid Heat, Industry, Transport
Zero-Carbon hydrogen• Hydrogen imports • Zero-carbon production • Negative-emission offsets
Hydrogenfrom Natural Gas
Zero-CarbonHydrogen
Integrated Hydrogen
Hydrogen is already entering the energy system and could play a valuable role. But its widespread use requires deliberate intervention, to ensure it delivers decarbonisation and to address challenges, including its impact on energy security.
1. Enable early, stand-alone, hydrogen technologies
Removing regulatory barriers and providing a level playing field will enable early hydrogen technologies to compete.
2. A plan for large-scale use of hydrogen to address carbon emissions and energy security implications.
The following actions will need to be in place if hydrogen is to make an extensive contribution to decarbonisation of the energy system, such as heat and transport:
a. A long-term strategic plan is needed to deliver zero-carbon hydrogen.
Residual greenhouse gas emissions from hydrogen production will need to be addressed to meet UK and global climate targets.
b. Carbon Capture and Storage (CCS) will need to be in place before 2030, to enable large-scale use of hydrogen.
Natural gas provides the cheapest source of hydrogen, but CO2 emissions will increase without CCS.
Decarbonisation of metropolitan gas networks would produce CO2 that would help support the development of CCS infrastructure.
c. Energy security implications of import dependency will need assessing, and appropriate measures developed.
Extensive hydrogen use could rely on natural gas until late into this century.
Hydrogen imports could take over, as zero-carbon technologies develop.
d. A programme to insulate existing houses and buildings to a high standard, to reduce energy demand and offset increases in natural gas consumption.
e. Early public engagement will be essential.
Need to understand concerns and pre-conceptions about hydrogen, particularly safety aspects.
Concern may include how any energy supply transformation is undertaken.
f. Evaluate need for, and locations of, large-scale hydrogen storage.
g. Developers and equipment providers need a clear signal to enable investment.
By late 2017, regulators need to indicate potential for hydrogen, so it can be incorporated into business planning for next gas price control period.
Appliance manufacturers need a clear signal to enable RD&D investment.
h. Robust understanding of safety is essential, supported by meaningful regulation.
Retrofitting hydrogen into homes with confined spaces presents new risks.
Piping 100% hydrogen into homes could create new risks, requiring an understanding of how the public might interact and use the technologies.
3. Whole system approach to hydrogen, to evaluate potential in the energy system.
a. Whole system, sustainability criteria should be used to evaluate the benefits
Impacts on primary energy supply, energy security and decarbonisation.
Consider practical and commercial issues alongside technical and economic.
b. Ensure cross-sector benefits are realised to reduce costs and improve efficiencies.
4. Support UK industry and expertise to capitalise on emerging global markets.
a. UK has leading expertise, but is regarded as a fast follower, with fragmented capability. Coordination is needed to build on progress by Innovate UK and EU FCH-JU projects.
The 2016 Hydrogen and Fuel Cell Roadmap led by Innovate UK sets out how a coordinated process could deliver these benefits.
Executive Summary 5
Recommendations«

Hydrogen presents a potential option for decarbonising parts of the energy system, but this needs to be balanced with an understanding of where it will come from, the impact on primary energy consumption and imports, along with clarity about how hydrogen will be made zero-carbon.
Benefits to consumers and energy system
Hydrogen technologies offer attractive benefits to the end-user, with comparable utility to current technologies. Consumers will have the benefits of an electric vehicle, but with a refuelling service similar to fossil fuels. A domestic hydrogen boiler could function in the same way as existing gas boilers, whilst maintaining resilience for householders by retaining the diversity of energy vectors.
Once produced hydrogen is highly flexible and can supply a range of markets, across the energy sector and in chemicals. As an energy vector it can have the characteristics of vectors, such as electricity or gas. Like electricity it is clean at point of use1 and requires production. Like natural gas, it can be stored at a range of volumes at low cost, separating production from time of use.
It could be used to decarbonise a range of energy services and tackle air quality issues. Any pollution and carbon emissions associated with producing hydrogen would be centralised and managed at scale. With the challenge and cost of replacing fossil fuels with a decarbonised electricity system becoming clear, it is being argued that hydrogen could provide a practical and cost-effective alternative.
Opportunities available now
Benefits are already being recognised commercially, in an increasing range of markets: hydrogen fuel-cell forklift trucks are replacing battery-electric units in warehouses, giving a better duty cycle and no charging downtime. Quiet, clean, rapid-response power units are replacing diesel generators.
Opportunities are extending into transport and grid management services. Technologies are being deployed that can provide services to the electricity grid and produce hydrogen for the transport market. The amount of hydrogen produced will depend on how the electricity system is managed, but it could fuel about 10% of passenger vehicles.
Early developments should be able to achieve a scale where they can be commercial viable. To do this will require a range of actions, including regulatory changes, support for a refuelling network, safety regulations, along with cost reductions, particularly in small-scale storage.
Expanded opportunities
Hydrogen could replace natural gas in the local gas network, decarbonising domestic and commercial heat, and extending to industry and potentially transport. Gas boilers and appliances will need to be replaced, but it may offer a simpler, cheaper and possibly quicker pathway to reduce carbon emissions than other options.
A hydrogen route would put the onus and financing of delivery on a few agents, in the same way as the conversion from Coal Gas2 in the 1970s. Gas network companies could take responsibility to decarbonise the gas supply and upgrade equipment as necessary.
Extensive social and technical planning would be required to ensure trust, as all connected parties would be affected. A robust understanding is also needed of the safety aspects, supported by meaningful legislation. The physical conversion of a city to hydrogen could be achieved in a couple of years.
In contrast, an electrification route currently puts the onus on the home-owner, which may well require installing a new heating system and possibly more extensive alterations. At some point the electricity networks are likely to need upgrading.
Blending hydrogen into the gas network has limited benefit for decarbonisation unless very high blends of hydrogen were used - 80% hydrogen by volume delivers carbon reduction of 50%. Blends above 20% would require modifications to end-user appliances. Permitting very low blends (about 3%) would be beneficial, allowing surplus hydrogen from electricity grid management services to be off-loaded into the gas network, when other markets cannot take it.
Trade-offs and limitations
However, the benefits hydrogen can offer, and the apparent simplicity with which it could be deployed, need to be balanced with the inherent inefficiencies of hydrogen pathways and the implications this has for energy security.
The lowest cost production process for hydrogen is Steam Methane Reforming (SMR) of natural gas. Using SMR to supply hydrogen for domestic heat would increase the gas consumption by a third.3 Some of this increase in overall consumption could be offset if insulation was added to the buildings.
Surplus electricity from renewables will only deliver part of the potential hydrogen demand, or less depending on how the future electricity grid is managed. Producing large volumes of low-carbon hydrogen from UK renewables, at an acceptable social and economic cost, will present challenges.
Without CCS, hydrogen from SMR cannot be classified as low carbon, as the process currently produces more CO2 than burning natural gas alone. The quantities of CO2 produced from early projects, such as Leeds H21, could provide the basis for developing a CCS programme.
However, the residual CO2 emissions from CCS and upstream from gas extraction, could become significant post-2050, as demand for zero-carbon options increases to meet global climate objectives.
New hydrogen production techniques, such as solar technologies, might reduce some of the impacts. Hydrogen could be imported, shipped as a liquid or pumped through long distance pipelines.
For transport the impact on primary energy is less significant, but oil consumption will be replaced by gas, as it is increasingly used to produce hydrogen.
The practical advantages that hydrogen offers, for decarbonising both heat and transport, along with maintaining energy resilience from a diversified energy vectors, should be evaluated against the challenges of decarbonising hydrogen and the impacts on energy security.
1 Although how it is burned will need to be managed to reduce any NOx emissions.2 Also referred to as Town Gas, which was 50% hydrogen3 Based on SMR with CCS efficiency of 74%, Leeds H21 quote 68.4% for first generation.
6 Executive Summary
Extended summary«

1 Introduction«Scope of the report
This study sets out to take an objective look at hydrogen and its associated technologies to understand what the potential applications are and how they might affect the UK energy system. The study has consulted widely with industry and academia and drawn on a large number of papers and reports on the various aspects of hydrogen.
Introduction 7
Many proposals have been put forward for using hydrogen in the energy system, surrounded by varying degrees of hype. However, cost reductions and advances in reliability of fuel cells, mean that the benefits it could provide are bringing it closer to market and are already being realised in niche markets. Hydrogen Fuel Cell Vehicles are being demonstrated globally, with a growing network of refuelling stations. More recently it is being proposed to decarbonise domestic heat, through conversion of parts of the local gas network.
Up until the 1970’s hydrogen made up 50% of the local gas supply, until the switch from ‘coal’ or ‘town gas’ to natural gas. Today, hydrogen is produced at scale for fertilizer production and in oil refining, to produce low sulphur petrol.
Hydrogen has a number of roles it can play, offering appealing benefits, such as rapid refuelling for vehicles and bulk storage of energy for long periods. Like electricity, hydrogen is a flexible energy vector and could be used to decarbonise end-use technologies for heat and transport, helping to improve air quality and tackle climate change. It can provide similar utility as fuels, such as gas and oil, and be transported by road or pipeline. Production can also be scaled from large centralised sites to local units, closer to point of use, with the energy transmitted by electricity or gas.
The various roles for hydrogen could be highly interconnected with one service creating a supply for other uses. While these interactions may yield useable volumes to allow some activity, at some point demand for hydrogen could increase, requiring dedicated production infrastructure, which has impacts on primary energy demand and decarbonising supply. System level understanding is needed of the implications of supply and demand, with the practical benefits balanced by a better understanding of the long-term implications.
Hydrogen has been criticised for being expensive and an inefficient use of energy. It also faces technical challenges, such as storing usable quantities (both small and very large), how to develop the infrastructure to deliver it in large volumes, and producing cost-competitive, carbon-free hydrogen.
UK R&D is at the forefront of fuel cell technologies, particularly for vehicles. Fuel cell companies such as ITM Power, Ceres Power, AFC Energy and Intelligent Energy, are all partnering internationally. Johnson Matthey, in Swindon, is one of the largest global supplier of fuel cell membrane components, while BOC and Air Products are major producers of industrial hydrogen.
4 45 million tonnes, 500 billion Nm3
5 At 3.54 kWh H2 per Nm3 HHV (683,000 tonnes per year or 7.6 billion Nm3) 6 90,000 tonnes, 0.4-1.0 billion Nm3 Roads2HyCom 2009 7 about 25% by energy content8 DECC 2015a 9 source Staffell 2011, Ekins 2010, IDEALHY
8 Hydrogen
2 Hydrogen«Using hydrogen is not new. Globally, about 1,700 TWh4 of hydrogen are produced per year, for use in oil refining and chemical industries such as ammonia production and fertilizers. Its use is expected to grow, with increasing fertilizer use and decreasing quality of oil supply.
UK production is about 26.9 TWh/yr5 from about 15 sites. About half is a by-product, mainly from the chemical industry, which is either used on site or sold as chemical feedstock, with a small percentage vented. Increases in capacity could lead to a surplus of up to 3.5 TWh/yr6, which could be used to supply early energy markets.
Hydrogen is also not new in the energy system. Until it was finally phased out in 1988, Town Gas, which consisted of 50% hydrogen by volume,7 was piped to homes, industry and street lighting. Produced from coal and oil, consumption peaked at 133.8 TWh in 19698 of which about 30 TWh was hydrogen.
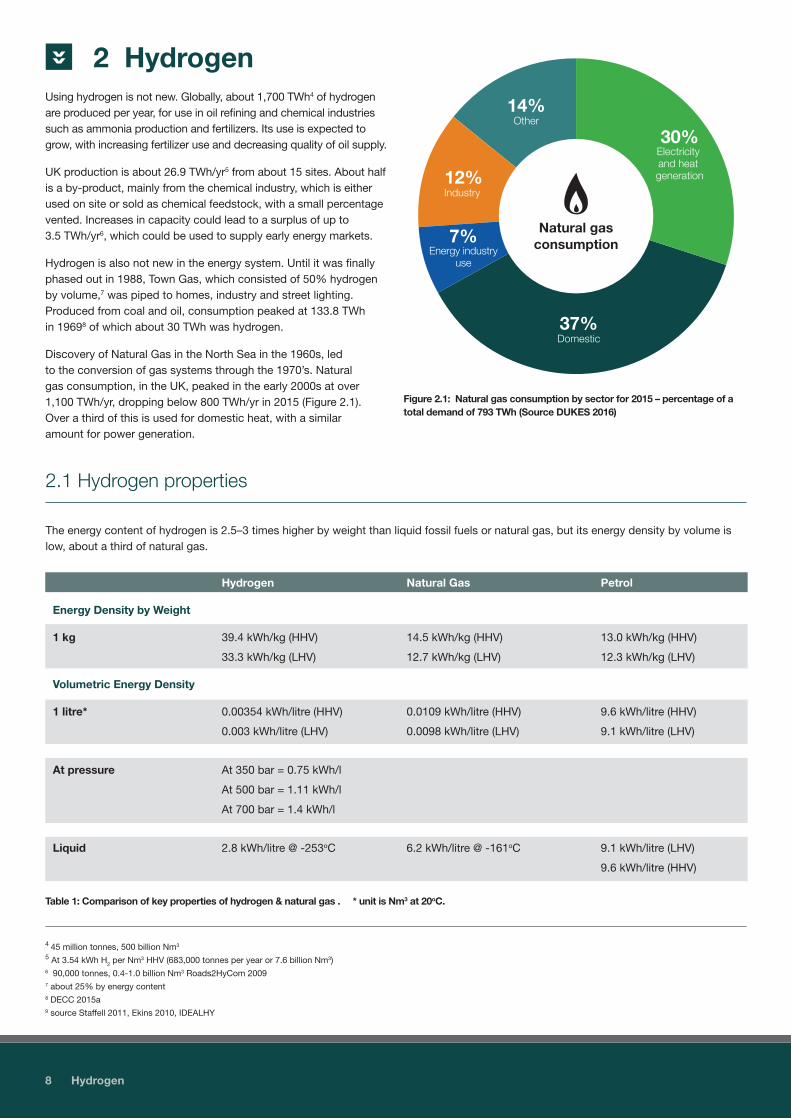
Discovery of Natural Gas in the North Sea in the 1960s, led to the conversion of gas systems through the 1970’s. Natural gas consumption, in the UK, peaked in the early 2000s at over 1,100 TWh/yr, dropping below 800 TWh/yr in 2015 (Figure 2.1). Over a third of this is used for domestic heat, with a similar amount for power generation.
Figure 2.1: Natural gas consumption by sector for 2015 – percentage of a total demand of 793 TWh (Source DUKES 2016)
12%Industry
14%Other
30%Electricity and heat generation
37%Domestic
Natural gas consumption7%
Energy industry use
The energy content of hydrogen is 2.5–3 times higher by weight than liquid fossil fuels or natural gas, but its energy density by volume is low, about a third of natural gas.
2.1 Hydrogen properties
Hydrogen Natural Gas Petrol
Energy Density by Weight
1 kg 39.4 kWh/kg (HHV) 14.5 kWh/kg (HHV) 13.0 kWh/kg (HHV)
33.3 kWh/kg (LHV) 12.7 kWh/kg (LHV) 12.3 kWh/kg (LHV)
Volumetric Energy Density
1 litre* 0.00354 kWh/litre (HHV) 0.0109 kWh/litre (HHV) 9.6 kWh/litre (HHV)
0.003 kWh/litre (LHV) 0.0098 kWh/litre (LHV) 9.1 kWh/litre (LHV)
At pressure At 350 bar = 0.75 kWh/l
At 500 bar = 1.11 kWh/l
At 700 bar = 1.4 kWh/l
Liquid 2.8 kWh/litre @ -253oC 6.2 kWh/litre @ -161oC 9.1 kWh/litre (LHV)
9.6 kWh/litre (HHV)
Table 1: Comparison of key properties of hydrogen & natural gas . * unit is Nm3 at 20oC.

However, compression or liquefaction require an energy input and appropriate containment. Carrying 5 kg of hydrogen at 700 bar in a car requires a 125 litre tank, weighing about 80 kg. (700 bar is 10,000 psi, about 3 times the pressure of a scuba diving tank and 100 times that of an LPG cylinder in a car).
Liquefaction increases energy density to 2.8 kWh/litre but has to be stored below -253oC (or slightly higher temperatures but at very high pressure). This requires greater management, as the hydrogen can easily boil off. For small volumes, such as in vehicles, the rate of loss is significant. Hydrogen can also be stored like gas in large volumes for long periods at medium pressure.
10 CCC 2015
Hydrogen 9
Glossary and Units
In this report, to enable comparison of various energy vectors, the units used are kWh and TWh.
m3 Nm3 – ‘normal’ volume: volume of gas at 20oC.
GWh 1GWh = 3,600,000 MJ
Blending Mixing hydrogen with natural gas. Usually refers to a volume basis rather than energy.
Vol% Percentage of a gas by volume as opposed to percentage by energy content
LHV Lower Heating Value
HHV Higher Heating Value
The difference in gross (HHV) and net (LHV) heating value for hydrogen is higher than most other fuels. The distinction is important as some technologies are able to utilise the latent heat of condensation while it is unlikely in others. Condensing boilers can be quoted in HHV, while gas turbines and power stations are generally quoted in LHV. The convention in Europe is to quote HHV for electrolysers and LHV for fuel cells.
Efficiency
Heat Pump (CoP 2.5) 250%
SMR 80%
SMR + CCS 74%
Electrolyser 80%
Gas boiler 90%
Hydrogen boiler 90%
Electricity transmission 93%
Hydrogen Pipe 94%
Vehicle Charger 91%
Vehicle Battery 85%
Vehicle Electric motor 90%
Vehicle Fuel Cell 48%
H2 compressor 700bar 88%
CO2 Emissions
CCS & SMR CO2 Capture rate 90%
Natural gas inc extraction 0.204 MtCO2/TWh
exc extraction 0.185 MtCO2/TWh
H2 via SMR+CCS inc extraction 0.275 MtCO2/TWh
exc extraction 0.249 MtCO2/TWh
Electricity grid 2050 (assumed) 0.01 MtCO2/TWh10
Vehicle energy consumption
Petrol 0.615 kWh/km
Battery Electric Vehicle (BEV) 0.21 kWh/km
Hydrogen Fuel Cell Vehicle (HFCV) 0.43 kWh/km
Gas for heat/house 14,959 kWh
Average mileage/car 13,623 km/yr
Metropolitan data 2.45 people per house
1 car per household

10 Hydrogen in the energy system
3 Hydrogen in the energy system«Hydrogen is a flexible energy vector that could be used to decarbonise a range of end-use technologies, including transport and domestic, commercial and industrial heat. It can also provide ancillary services to the electricity grid and store energy for long periods. In these sectors it has the potential to provide clear benefits, in terms of environmental performance and operational utility.
Like electricity, hydrogen is clean11 at the point of use, but requires production. A variety of feedstock and technologies can be used to produce hydrogen, at a range of scale, although some produce carbon emissions. Unlike electricity, it can be handled like a fuel, such as gas, and can be stored relatively easily in large volumes. It can be burned
as fuel in a turbine, domestic boiler or internal combustion engine, or turned into electricity and heat using a fuel cell, or converted to other compounds such as synthetic methane or ammonia. This flexibility means it can be used in a range of applications and offer a variety of services, crossing between the electricity, gas and transport systems.
Understanding its potential is complex and requires a whole-system perspective. The practicalities of its use and deployment may make it attractive, both commercially and for delivering decarbonisation. In some cases, it may not appear to be a viable option, but its interactions with other energy services and markets could make it more attractive.
3.1 Key roles across the energy system
Hydrogen could play four potential roles in the energy system: transport, provision of heat, electricity grid services, and in niche markets. These could develop independently as stand-alone markets that are integrated in to the energy system, or be driven by a policy to decarbonise large parts of the energy system, such as transport or heat, where the costs and practicalities of deploying it could make it an attractive option, compared to alternative decarbonisation pathways.
The extent to which hydrogen is used, beyond the stand-alone opportunities, will be determined by the development of a suitable transportation infrastructure, large-scale storage facilities and, most importantly, the environmental and social impacts of providing the primary energy. The availability of low carbon electricity and CCS will be critical.
11 The higher flame temperature from burning hydrogen, could increase NOx emissions, unless managed
Fuel cellCHP
Fuel cell CHP –with SMR
Static use – electricity production
Fuel Cell
Large Central H2 Storage
ElectrolysisLocalStorage
Large scale Electrolysis
On-boardstorage
Fuel Cell/ ICE
GridElectricity
VariableRenewable
es
NaturalGas
Biomass
Coal
CO2
CO2
CO2
CentralProduction
Methane reforming/ Gasi�cationBiological
SMR
Combustion
Heat
Primary energy Production ApplicationDistribution
Hydrogen Pipeline
Road tanker: Compressedor Liquid Hydrogen
Electricity transmission
Natural Gas Pipeline
Static UseDomestic and Commercial
Electricity Grid Balancing Service
Central H2 Production
Local H2Production
Forecourt Fuel Cell Vehicle
Industry heat
Centralised
Local
Figure 3.1: Schematic of the various hydrogen energy systems being proposed, showing the alternative production and distribution methods and uses. On the right hand side, in orange, are the various applications, where it can be used in fuel cells or burned directly in a gas turbine, domestic boiler or internal combustion engine (ICE).
Fuel cellCHP
Fuel cell CHP –with SMR
Static use – electricity production
Fuel Cell
Large Central H2 Storage
ElectrolysisLocalStorage
Large scale Electrolysis
On-boardstorage
Fuel Cell/ ICE
GridElectricity
VariableRenewable
es
NaturalGas
Biomass
Coal
CO2
CO2
CO2
CentralProduction
Methane reforming/ Gasi�cationBiological
SMR
Combustion
Heat
Primary energy Production ApplicationDistribution
Hydrogen Pipeline
Road tanker: Compressedor Liquid Hydrogen
Electricity transmission
Natural Gas Pipeline
Static UseDomestic and Commercial
Electricity Grid Balancing Service
Central H2 Production
Local H2Production
Forecourt Fuel Cell Vehicle
Industry heat
Centralised
Local

Hydrogen in the energy system 11
Hydrogen production can be centralised or local, so it is closer to market with the energy delivered by electricity, or by feedstock such as gas. For example, electrolysers could be located according to the demands of the electricity grid, or proximity to markets, such as transport or injection into the gas main. Or, they could be located near wind farms to overcome grid constraints.
Distribution can be by road, either as a liquid or compressed gas, or by pipeline either blended in the natural gas system or in a dedicated network, as is currently used for some industrial applications.
For transport, the most cost effective and efficient method of supplying a refuelling station will depend on a number of factors including daily demand, proximity to central hydrogen production facilities.12 Smaller demand volumes tend to suit on-site electrolysis or delivery by tube tanker, whereas higher demand could be met by a hydrogen pipeline or by on-site reformation of methane. The latter would be harder to decarbonise.
Alternatively, synthetic-methane could be produced from hydrogen, which could ‘drop-in’ to the existing gas network (see Text Box 3.1). This could allow hydrogen to be used in the gas network without the need for major modifications. It could also allow renewable generation to avoid constraints on the electricity network, where there is sufficient surplus to warrant the capital investment. However, the scale of such a system would be constrained by the availability of biomass or electricity generating capacity to supply the low-carbon hydrogen, and a suitable low-cost source of CO2. The additional conversion stage will make the production process less efficient, but this would have to be offset against the infrastructure costs.
Repurposing the gas network
Hydrogen could be used to reduce the carbon content of the gas system, either by blending or 100% replacement. Repurposing the existing infrastructure could be cheaper and less disruptive than an electrification route, or district heating, both of which would require extensive works to build or upgrade the networks.13
Using hydrogen in the existing gas system will depend on the tolerance of the pipes and appliances on the system. Currently about 70,000 km of the 280,000 km of low-pressure gas distribution network is made of iron pipes that are not suitable for hydrogen.14 The rest are made of tolerant polyethylene pipes. By 2030 the Iron Mains Replacement Programme is expected to have replaced a majority of the remaining of iron pipes, leaving only a few percent that will need to be converted to hydrogen tolerant.
The gas transmission system is largely made of steel, which would could weaken and crack at high blends or 100% hydrogen, although could tolerate low percentages.15 If hydrogen replaced natural gas completely, then the 7,660 km of transmission network16 would need upgrading or a parallel system built. While this may appear expensive it would need to be compared to the cost and practicalities of alternative solutions for replacing the energy services currently provided by the gas system.
3.2 Distribution of hydrogen
0%
10%
20%
30%
40%
50%
60%
70% 80% 90% 100%
0.0
2.0
4.0
6.0
8.0
10.0
12.0
0% 10% 20% 30% 40% 50% 60% 70% 80% 90% 100%
To
tal Carb
on A
batem
ent
Cal
ori
fic
Val
ue (C
V) o
f g
as (k
Wh/
m3 )
Blend of hydrogen (volume)
CV kWh/m3 % carbon abated
Figure 3.2: Energy content of blended gas and percentage of carbon emissions abated with increasing mix of hydrogen, where hydrogen is produced from SMR of natural gas with 90% CO2 capture rate (upstream gas extraction not included). Note: using hydrogen from zero-carbon electrolysis would produce a similar shaped curve, but would attain 100% capture.
12 Element Energy 200613 ICEPT 201614 HSE 201415 HSE 201516 National Grid 2016b
A number of overlapping pathways could develop for hydrogen in the energy system (Figure 3.1) with production from a variety of feedstocks, in different locations. It could provide services to other sectors, such as utilising surplus electricity, storing energy, providing a feedstock to the chemical industry, or helping decarbonise the gas network. Integrating multiple markets could reduce costs and allow technologies to operate more efficiently.
Early developments are likely to utilize the available ‘surplus’ electricity resource. Projects such as Aberdeen’s bus project and ITM’s electrolysers integrate grid balancing services with vehicle refuelling stations or injection into the gas grid. There is uncertainty about how much hydrogen could be produced from surplus electricity (see Section 4).

However, the amount of carbon reduction is not directly proportional to the percentage blend, as the volumetric energy density of hydrogen is only a third that of methane. A 10% blend, by volume, reduces the energy content by 7%, requiring more blended-gas to be delivered. The result is only a 3% carbon saving. A 50% carbon saving requires an 80% blend of hydrogen (from SMR with 90% capture) or 75% blend if from zero carbon electrolysis (Figure 3.2). To compensate for the reduced volumetric energy content, the volume of gas supplied has to rise so as to deliver the same energy.
Blending
In addition to the limited impact on abating carbon emissions, blending presents several other challenges that make it an unattractive proposition.
Increasing the blend of hydrogen in the local gas network would require all end-use appliances to be modified, as hydrogen burns differently to methane. The wide variety of appliances makes it hard to assess a safe limit, although HSE concluded that in the UK blends of up to 20% by volume are unlikely to increase risk and appliances will tolerate it without any modifications.17 Some appliances, such as gas turbines, may require modifications at very low blends, because of the higher burn temperature and increased NOx. Vehicles using compressed natural gas (CNG) would also need modifying, even at low blends, or require a separate hydrogen-free supply.18
One beneficial exception would be to permit up to a 3% blend by volume, which would allow early grid management projects to develop, with little or no disruption to end-users. ITM suggest this would allow up to 11 TWhelec of surplus electricity to be captured19 (see Section 3.5). If the gas system was converted to 100% hydrogen, then these projects could continue to contribute.
If the estimated ‘surplus’ electricity from curtailed wind could be captured, then it could supply about 9% of household energy demand (see Section 4), which is equivalent to a blend of 24% by volume.
It has been suggested that the blend in the gas network could be increased in stages, but this may mean that each increase will require further modifications to the appliances, which would be cost prohibitive.
Maintaining a consistent percentage blend would require storage to buffer variations in demand and avoid flexing hydrogen production, particularly in the summer, when national gas demand can fall to about 300 GWh/day compared to winter of 3,000 GWh/day20. Using renewable electricity or surplus wind would require substantial storage, due to the variability of generation. Average surplus wind could be about 100 GWhelec/day, but could peak at over 800 GWhelec/day21 (see Text Box 4.1). Capturing even half of the latter would require over 15 GWe of electrolysers and would overwhelm any on-site storage. Large centralised storage would therefore be necessary.
Alternatively, the blend percentage could be allowed to vary up to a defined limit, but this frequent variability in energy content would make customer billing challenging, as it is based on overall amount of energy delivered. Metering equipment may also need to be changed to cope with hydrogen, although it is expected to tolerate at least 25 vol% blends.22
Biogas is also being developed to decarbonise the gas grid, with estimates that gasification of biomass and waste could provide 10-40% of the future gas supply.23 Using hydrogen in the gas network could make this more efficient and avoid the additional methanation step. Alternatively, the biogas may be best used in the transport sector to provide a low-carbon, energy dense fuels for heavy duty vehicles.
Decarbonisation – 100% hydrogen
Going straight to 100% hydrogen in the gas main would remove the need for potentially multiple interventions to domestic boilers as the blend of hydrogen in the system increased. Metropolitan areas provide a potentially attractive opportunity to convert the gas network, as many of the pipes have been converted to plastic.24 The Leeds H21 City Gate project25 is looking at the feasibility of converting a city-scale gas network to 100% hydrogen, to deliver decarbonised domestic and commercial heat. This is not unprecedented, as the gas network was converted from Town Gas to Natural Gas in the 1960s-80s. An extensive network of control valves means sections can be segregated to allow the conversion to be phased.
17 HSE 2015 18 IEA GHG 200319 ITM 201320 Sansom & Strbac 201221 Over 16,000 tonnes of hydrogen22 IEA GHG 2003 23 National Grid 201624 Crowther 201125 H21 2016
12 Hydrogen in the energy system
Text Box 3.1: Methanation, ammonia and methanol
Reacting hydrogen with CO2 to produce synthetic-methane would make the hydrogen easier to transport and could ‘drop-in’ to the existing infrastructure. The higher volumetric energy density could also be attractive for options such as a fuel for HGV transport.
However, the practical benefit of not having to convert systems to take hydrogen, needs to be balanced with the technical challenges and limitations of methanation. Additional processing means it consumes more primary energy than a hydrogen pathway, which is not compensated for by an improved efficiency of the end-use technology. Understanding the carbon benefits will require a system approach.
Low-carbon hydrogen will be essential. Methanation also needs a pure source of CO2, which would mean industrial sources would have to be cleaned up before use.
Capturing CO2 from the atmosphere and combining it with hydrogen from electrolysis, would help make the process low carbon, but would be expensive. Supplying the hydrogen from biomass combined with CCS could make the process carbon negative. Both options would be limited by the amount of biomass or electricity generation capacity available to produce the hydrogen.
A system that supplied the hydrogen from natural gas and then converted it to synthetic-methane using CO2 captured from the atmosphere, would have to be compared to the costs
and efficiencies of running an ambient CO2 capture system connected directly to CO2 storage.
Audi are developing an ‘e-gas’ system, where synthetic methane is produced from combining hydrogen, from electrolysis of variable wind power, with CO2 from a bio-methane plant. The plant produces about 1,000 tonnes/yr of synthetic CNG, which could be used in transport or injected into the gas grid. The 6.5 MW power-to-gas plant in Germany, run by ETOGAS,26 has an efficiency of 54%, although overall it could rise to 70%27 if the waste heat is used in the bio-methane plant.
To provide any carbon benefit, the syn-methane would have to displace a higher carbon fuel, unless the CO2 from its combustion is recaptured, which restricts it to large stationary applications; hydrogen systems do not have this requirement and would suit distributed and mobile uses.
Atmospheric or biological sources of CO2 reduce the requirement for recapture, but the energy input to obtain the CO2 would add to the inefficiency of the pathway, compared to a pure hydrogen route.
The use of ammonia and methanol as fuels presents similar benefits and challenges, although both are hard to handle safely. Ammonia production from stranded renewables at 100s MW scale is close to being commercially viable, in some locations,28 although this is unlikely in the UK. Ammonia supply could switch between markets, such as fertilizer production and CHP, or transport. Storing hydrogen in liquid ammonia is also much cheaper than high pressure gaseous storage.
Hydrogen in the energy system 13
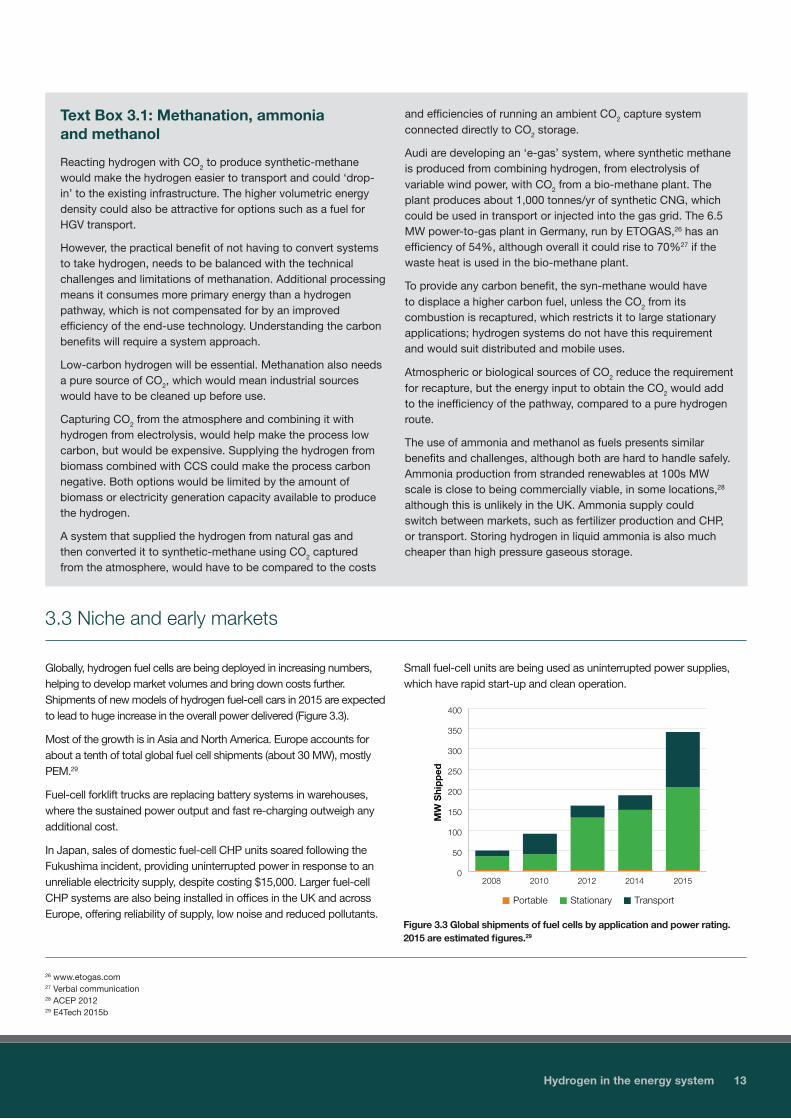
Globally, hydrogen fuel cells are being deployed in increasing numbers, helping to develop market volumes and bring down costs further. Shipments of new models of hydrogen fuel-cell cars in 2015 are expected to lead to huge increase in the overall power delivered (Figure 3.3).
Most of the growth is in Asia and North America. Europe accounts for about a tenth of total global fuel cell shipments (about 30 MW), mostly PEM.29
Fuel-cell forklift trucks are replacing battery systems in warehouses, where the sustained power output and fast re-charging outweigh any additional cost.
In Japan, sales of domestic fuel-cell CHP units soared following the Fukushima incident, providing uninterrupted power in response to an unreliable electricity supply, despite costing $15,000. Larger fuel-cell CHP systems are also being installed in offices in the UK and across Europe, offering reliability of supply, low noise and reduced pollutants.
Small fuel-cell units are being used as uninterrupted power supplies, which have rapid start-up and clean operation.
3.3 Niche and early markets
26 www.etogas.com 27 Verbal communication28 ACEP 2012 29 E4Tech 2015b
0
50
100
150
200
250
300
350
400
2008 2010 2012 2014 2015
MW
Shi
pp
ed
Portable Stationary Transport
Figure 3.3 Global shipments of fuel cells by application and power rating. 2015 are estimated figures.29

Hydrogen Fuel Cell vehicles offer users a service comparable to conventional liquid fuelled vehicles, with greater range and quicker refuelling times than battery electric vehicles, which could prove attractive to consumers. It could also help decarbonise the challenging area of HGVs and buses.
Hydrogen could be burned in an adapted internal combustion engine, but a more efficient option is fuel-cell vehicles. Improvements in reliability and cost mean that more models are being developed, but it may be several years before the total cost of ownership becomes comparable to an electric vehicle.34
The number of Fuel Cell Electric Vehicles in use globally is increasing, with three car manufacturers offering hydrogen fuel-cell models for sale or lease. Toyota’s ambition is to have tens of thousands on the road by 2020. However, most vehicles are part of demonstration projects, as the refuelling infrastructure needed to give reassurance to the passenger market, is still developing.
Globally about 200 refuelling points have been built. California and Norway are developing hydrogen highways, to provide refuelling points between major cities. In the UK a network of hydrogen
filling stations is being developed, serviced either by tankers or on-site electrolysers. A strategic partnership between Shell and UK electrolyser manufacturer, ITM Power, is developing refuelling stations, many with electrolysers that can provide balancing services to the electricity grid and taking advantage of low-priced electricity to reduce the cost of the hydrogen.
Hydrogen buses are currently being trialled across Europe, with 57 running on hydrogen fuel cells with plans for over 90 by end of 2017.35 Globally, about 200 HFCEV buses that are already operating, with Ballard Power Systems signing a deal to supply fuel cells for 300 buses in China.36 These early projects are using small electrolyser facilities for refuelling, but these could expand to provide services for passenger vehicles.
For freight, the size of the on-board hydrogen tanks, along with the additional cost and weight, restricts their driving range. Early use is likely to be in depot-based Back-to-Base vehicles, which will benefit from quick refuelling times; the low emissions and ability to do long duty cycles make them attractive in cities and facilities such as airports. Long-distance haulage will be more challenging.
3.4 Transport
14 Hydrogen in the energy system
Molten Carbonate Fuel Cell
Molten Carbonate Fuel Cells are attracting interest as they could be developed to capture CO2 from flue gases. The fuel cell uses the CO2 as the proton carrier to generate electricity. When released the CO2 is concentrated and easily separated.30 Connected to a power station the system could reduce flue gas CO2 by 90%31 and possibly at a lower cost than other technologies, such as amine scrubbing. In August 2015, the US DoE funded a pilot capture project with a 2 MW fuel cell that will capture 60 tonnes of CO2 per day.32
The hydrogen to fuel the fuel-cell will require a separate reformer unit, taking a supply of methane from the power station. The advantage over other capture systems is that the captured CO2 is part of the fuel-cell operation and produces additional electricity, rather than being a parasitic load. The unit may also be able to operate flexibly, so if there is no CO2 supply, the fuel cell can be switched off and hydrogen from the reformer (which is harder to operate flexibly) can be diverted to other markets. The overall efficiency of the fuel cell is expected to be about 60%.33
30 IEA 201531 FuelCell Energy promotional material32 US DoE 201533 Takizawa K 200634 McKinsey 2008
35 Clean Hydrogen in European Cities Project (CHIC) http://chic-project.eu/fuel-cell-buses-in-europe
36 Ballard 201537 CEPA 201538 CFCP 2014
Text Box 3.2: California
Three primary objectives for 2030 of reducing greenhouse gas emissions by 40%, improving air quality and reducing petroleum dependence by 50%, have driven California’s legislation to promote the deployment of zero emission vehicles and the necessary infrastructure.
Several state and national public-private partnerships have been established to ensure the deployment of refuelling stations and vehicles. This is supported by a detailed roadmap outlining the necessary refuelling network.
By the end of 2016 a state-wide network of 51 refuelling stations, co-funded by the state, is expected to be operational, capable of fuelling 13,500 HFCVs.37 State funding reached $91 million between
2009 and 2014. Legislation requires further state investment of $20 million per year, for subsequent refuelling stations, until at least 100 have been built. This includes O&M grants up to $100,000 per year for three years for developers, to compensate for initial negative revenues. More innovative market interventions are expected to balance the financial risks against the need for geographical coverage, to support the uptake of HFCVs.
To meet the state target of 1.5 million zero-emission vehicles on the road by 2025, early HFCV vehicles sales are supported by rebates of $5,000.
Two-thirds of the hydrogen production is expected to come from natural gas, with renewables making up the remainder. This is expected to deliver well-to-wheel carbon emission reductions of 65% compared to that of a 2020 model petrol vehicle.38
39 DECC 2013a40 DECC 2013b41 Wilson G 2013 42 Source: Sansom & Strbac 201243 Sansom 2014, Eyre & Baruah 2015
Hydrogen in the energy system 15
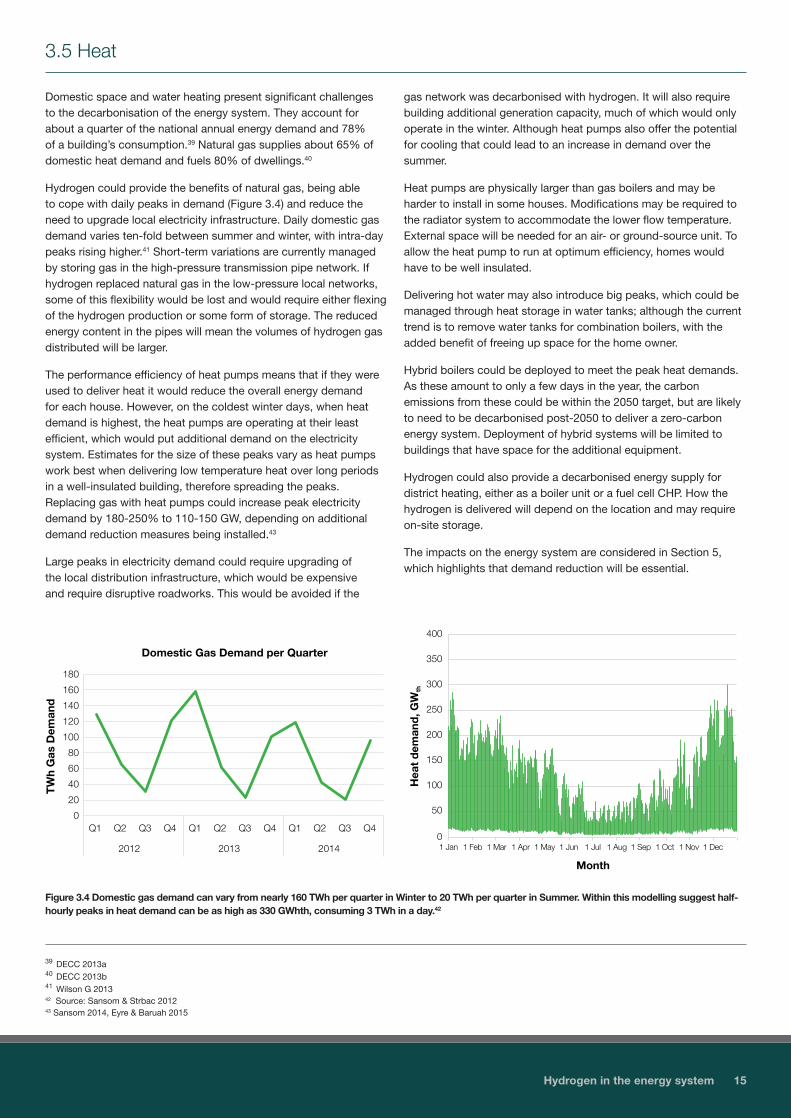
Domestic space and water heating present significant challenges to the decarbonisation of the energy system. They account for about a quarter of the national annual energy demand and 78% of a building’s consumption.39 Natural gas supplies about 65% of domestic heat demand and fuels 80% of dwellings.40
Hydrogen could provide the benefits of natural gas, being able to cope with daily peaks in demand (Figure 3.4) and reduce the need to upgrade local electricity infrastructure. Daily domestic gas demand varies ten-fold between summer and winter, with intra-day peaks rising higher.41 Short-term variations are currently managed by storing gas in the high-pressure transmission pipe network. If hydrogen replaced natural gas in the low-pressure local networks, some of this flexibility would be lost and would require either flexing of the hydrogen production or some form of storage. The reduced energy content in the pipes will mean the volumes of hydrogen gas distributed will be larger.
The performance efficiency of heat pumps means that if they were used to deliver heat it would reduce the overall energy demand for each house. However, on the coldest winter days, when heat demand is highest, the heat pumps are operating at their least efficient, which would put additional demand on the electricity system. Estimates for the size of these peaks vary as heat pumps work best when delivering low temperature heat over long periods in a well-insulated building, therefore spreading the peaks. Replacing gas with heat pumps could increase peak electricity demand by 180-250% to 110-150 GW, depending on additional demand reduction measures being installed.43
Large peaks in electricity demand could require upgrading of the local distribution infrastructure, which would be expensive and require disruptive roadworks. This would be avoided if the
gas network was decarbonised with hydrogen. It will also require building additional generation capacity, much of which would only operate in the winter. Although heat pumps also offer the potential for cooling that could lead to an increase in demand over the summer.
Heat pumps are physically larger than gas boilers and may be harder to install in some houses. Modifications may be required to the radiator system to accommodate the lower flow temperature. External space will be needed for an air- or ground-source unit. To allow the heat pump to run at optimum efficiency, homes would have to be well insulated.
Delivering hot water may also introduce big peaks, which could be managed through heat storage in water tanks; although the current trend is to remove water tanks for combination boilers, with the added benefit of freeing up space for the home owner.
Hybrid boilers could be deployed to meet the peak heat demands. As these amount to only a few days in the year, the carbon emissions from these could be within the 2050 target, but are likely to need to be decarbonised post-2050 to deliver a zero-carbon energy system. Deployment of hybrid systems will be limited to buildings that have space for the additional equipment.
Hydrogen could also provide a decarbonised energy supply for district heating, either as a boiler unit or a fuel cell CHP. How the hydrogen is delivered will depend on the location and may require on-site storage.
The impacts on the energy system are considered in Section 5, which highlights that demand reduction will be essential.
3.5 Heat
0
20
40
60
80
100
120
140
160
180
Q1 Q2 Q3 Q4 Q1 Q2 Q3 Q4 Q1 Q2 Q3 Q4
2012 2013 2014
TW
h G
as D
eman
d
Domestic Gas Demand per Quarter
Figure 3.4 Domestic gas demand can vary from nearly 160 TWh per quarter in Winter to 20 TWh per quarter in Summer. Within this modelling suggest half-hourly peaks in heat demand can be as high as 330 GWhth, consuming 3 TWh in a day.42
Hea
t d
eman
d, G
Wth
Month
400
350
300
250
200
150
100
50
0 1 Jan 1 Feb 1 Mar 1 Apr 1 May 1 Jun 1 Jul 1 Aug 1 Sep 1 Oct 1 Nov 1 Dec
44 ERP 201545 Source: Ford 2014, Luo 2015, ERP 2011
16 Hydrogen in the energy system
Text Box 3.3: Hydrogen heating options
Hydrogen could be used to produce heat by burning in a boiler, similar to a gas boiler, or used in a fuel-cell CHP unit.
Gas boilers can burn a mix of hydrogen and natural gas, but the burner will need to be modified to manage the higher temperature and different flame behaviour. At higher blends the temperature increase means it would be safer, for domestic users, to replace the whole boiler.
New catalytic burners are being developed that could reduce the flame temperature, so as to manage the NOx emissions. But
these may still require replacing the boiler.
Hydrogen boilers are similar in size to existing gas boilers, so can be installed with little disruption. They offer the consumer familiar operation.
Hydrogen fuel-cell CHP units produce heat and electricity. The heat production efficiency is lower than a boiler but has the benefit of producing electricity. A secondary boiler may be needed to meet peak heat or hot water demands, depending on how the unit is configured. Fuel cells currently require higher purity hydrogen than boilers, so filters may be required to reduce contaminants.
Hydrogen could provide auxiliary services to the electricity grid, either balancing services or frequency control. Electrolysers can utilise surplus electricity, provide rapid, frequency response services.
ITM Power is demonstrating Power-to-Gas using electrolysers for balancing the electricity grid, with the hydrogen injected into the gas grid or sold to markets, such as transport. Electrolysers can be located according to electricity network constraints or near to hydrogen markets. Variable renewables can use electrolysers to condition their output and potentially increase their value. Trials are being run in Germany, where gas quality and regulations allow a higher percentage of hydrogen in the gas grid.
The potentially sustained offtake for hydrogen means they could have a very-high availability compared to other electricity grid management options. Selling the hydrogen reduces dependence on uncertain payments for grid services, but the cost of the hydrogen is very dependent on the price of the electricity.
Alternatively, hydrogen could be used to store large amounts of energy for long periods, for example in salt caverns. Some stores could provide Short-term Operating Reserve (STOR) services, sustaining prolonged high-power output.
An ETI proposal uses salt caverns to store hydrogen that could be burned in a gas turbine to meet electricity grid demands. The store would allow hydrogen to be produced continuously, at peak efficiency and at low cost, from a coal or biomass gasifier with CCS. The generator turbines can be scaled according to grid needs. Any surplus hydrogen could be sold to other markets.
For storage systems the costs and utilisation rates are more important than efficiency. The cost per unit of energy stored is low compared to other options for storing electricity. However, with a round-trip efficiency about half that of other options using the stored hydrogen for power generation only makes sense at the TWh scale with low utilisation rates, such as inter-seasonal storage. It could also be used to provide extended power generation through periods of low wind or renewables output, which can last for two weeks, amounting to several TWh.44
In grid balancing, value comes from the service it can provide and it competes against the cost of similar systems. By capturing energy from variable renewables, its value comes from arbitrage.
3.6 Grid management services and energy storage
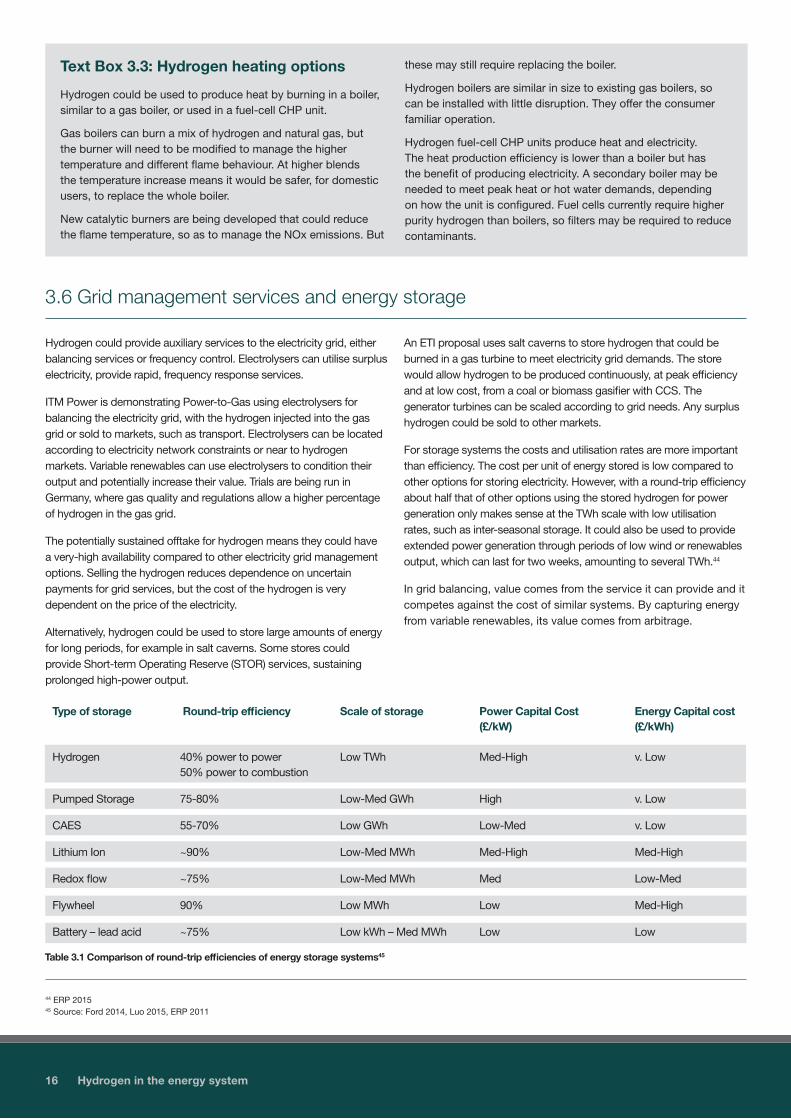
Table 3.1 Comparison of round-trip efficiencies of energy storage systems45
Type of storage Round-trip efficiency Scale of storage Power Capital Cost Energy Capital cost (£/kW) (£/kWh)
Hydrogen 40% power to power Low TWh Med-High v. Low 50% power to combustion
Pumped Storage 75-80% Low-Med GWh High v. Low
CAES 55-70% Low GWh Low-Med v. Low
Lithium Ion ~90% Low-Med MWh Med-High Med-High
Redox flow ~75% Low-Med MWh Med Low-Med
Flywheel 90% Low MWh Low Med-High
Battery – lead acid ~75% Low kWh – Med MWh Low Low

Hydrogen in the energy system 17
The properties of hydrogen mean it presents very different safety challenges compared to methane or liquid fuels, such as how it burns and ignites and the need to odourise it. Understanding is also needed as to how users might handle and interact with new appliances and a hydrogen supply, including how to prevent its potential misuse, such as for recreational purposes.
New standards, regulations and procedures will be needed, along with safety control and monitoring equipment. Vehicle mechanics and gas maintenance staff will need to be trained and new safety devices installed in workshops.
Like methane hydrogen is odourless and would require chemical odorants to make leaks detectable. A significant challenge is to find a chemical that stays mixed with hydrogen, as current odorants would not work. Odorants could also contaminate fuel cells and would need to be filtered out, unless the fuel cell can be made tolerant, or a suitable chemical developed.
Hydrogen burns with an almost invisible flame. Cooking burners could include compounds that would make the flame more visible. Similar controls would be needed for other appliances, such as gas fires. It has been suggested that it may be safer to remove gas appliances, other than boilers, and replace gas cooking hobs with electric induction units.
Hydrogen ignites across a much wider range of concentrations in air than methane. Both ignite at 4-5% by volume, but whereas methane would not ignite above 15%, hydrogen will ignite up to 75%. At about 30% hydrogen the energy required to ignite it is about a tenth of natural gas, which could be a small spark. Outdoor locations, such as a refuelling station, hydrogen rises so will disperse quickly.
The HyHouse project46 investigated the implications of leaks of different gases within a domestic property. It found that hydrogen dispersed and did not reach expected concentrations, with the energy content not exceeding a methane leak. It concluded that the risks associated with a hydrogen leak, and impacts of any explosion or fire, were broadly similar to that of natural gas. Further work is needed to understand the implications of leaks in a confined space. Detection and management of leaks and ventilation requirements need to be clearly defined to prevent significant build ups.
Understanding will also be needed of the behaviour of hydrogen if it escapes from underground pipes, and whether it disperses through the ground or accumulates in voids. This is particularly important in metropolitan areas where there is a diversity of underground utility services, and where underground explosions from gas leaks already occur.
3.7 Safety
The degree of purity of hydrogen varies between the production processes and the fuel used by the process. Electrolysers produce a very pure supply, but hydrogen from SMR and gasification contains small quantities of impurities, which vary depending on the fuel supply.
Contaminants do not present a problem for burners, but some fuel cells are less tolerant, such as PEM cells, which require a very pure supply. This sensitivity to impurities may present a challenge for bulk production of hydrogen, particularly if SMR is used. It has also been suggested that contaminants may come from the pipe network.
Filters are being developed but tend to be specific to particular contaminants, which in SMR hydrogen vary depending on the gas supply. Connecting sensitive fuel-cells to a hydrogen network, such as a vehicle refuelling stations or domestic fuel-cell CHP units, may therefore require complex filters or very pure hydrogen supply.
3.8 Purity of hydrogen
46 DECC 2015b

47 HySafe BRHS 2005.48 Various sources - Roads2HyCom 200949 HHV, Dodds 201250 Saur 201151 H21 201652 IEA 2007 53 Jechura 201554 Bayham et al 2015
18 Production and storage
4 Production and storage«
Despite being abundant hydrogen is not readily available and requires a primary energy input to produce it from water or hydrocarbons, either chemically, electro-chemically or biologically.
Current production is almost entirely from fossil fuels (Figure 4.1): 48% Steam Methane Reforming of natural gas (SMR), 30% partial oxidation of oil and 18% coal gasification.47 The 4% from electrolysis delivers very high-purity hydrogen, but is more expensive. Steam methane reforming is a well-established process and produces the lowest-cost, high purity hydrogen. Coal is a lower cost feedstock but has higher CAPEX.
Early markets could be supplied by current industrial capacity or using electrolysis to take advantage of low-price, surplus electricity, although there is a limit to how much might be available (see Text Box 4.1)
Demand for reliable, bulk hydrogen supplies, is likely to be met using lower-cost SMR. Storage will be needed to meet variations in supply and demand, and allow production throughout the year to meet winter peaks. It will also be necessary if variable renewables are used, to capture summer sun and wind.
Production will also need to be low or zero carbon. Hydrogen production from fossil fuels will increase the overall CO2 emissions. CCS will therefore be essential.
The efficiency of production affects the exposure to feedstock price variability, and the overall energy security of its primary energy/feedstock supply. Most processes are expected to improve (Figure 4.2), with electrolysers achieving 85%-95% from the current 70%-75% for both small and medium sized plants.49 The cost of hydrogen from smaller units is expected to be higher because of the relative capital costs.50
SMR efficiency is currently about 70-75% (HHV), with suggestions that it could increase to about 80% by 2030. A figure of 74%, including CCS, is adopted in this report, although H21 adopt a cautious 68%, uncertain about developments.51 Adding CCS is expected to reduce the efficiency of SMR by about 5-10 percentage points,52 although others suggest it could still achieve 80%,53 and possibly higher using chemical looping with CCS.54
Future technologies, such as solar and very-high temperature nuclear, generally have lower efficiencies, but are low carbon and do not increase dependency on fossil fuels. The development of solar technologies is likely to lead to an international trade in hydrogen.
0%
10%
20%
30%
40%
50%
60%
70%
80%
90%
100%
SMR+CCS Coal gasification
+ CCS
Electrolysis Biomassgasification
Solar –CSTower
Solar –hybrid PV
Nuclear –VHTR
Future technologies 18%
Coal gasification
4%Electrolysis
48%Steam methane
reforming(SMR)
Global hydrogenproduction by
process
30%Partial oxidation
of oil
Figure 4.1 Global hydrogen production by process. 96% is produced from hydro-carbon sources.
Figure 4.2 Production efficiencies (HHV), primary energy source to hydrogen fuel, with error bars.48 Future technologies (on right) are in development and include very-high temperature cracking of water, where maximum efficiency is limited by the process. Hybrid solar PV cells claim a pilot scale efficiency of 24%: the maximum is hard to predict.
Production and storage 19
55 Lemus & Duart 201056 Dodds 201257 $2.00-$4.00 delivered and dispensed, USDRIVE June 2013 Hydrogen Production Technical Team Roadmap58 Argonne National Lab 200359 ITM 201360 Dodds 2012 61 Green 2010 62 ERP 2015a63 ITM 2013 64 Load factors of 12% and 30% respectively65 80% efficient electrolyser
Assessments of the future costs of hydrogen vary widely, with some suggesting the costs of the various technologies converging around 2030,55 while others see SMR remaining the cheapest option out to 2050,56 even with CCS. Large-scale SMR in the US currently produces hydrogen at about $0.05/kWh ($2.00/kgH2).57 Adding Carbon Capture and Storage (CCS) could increase the cost of hydrogen by as much as 35%, capturing between 60% and 90% of CO2.
58
Electrolysers are much more expensive and are currently limited in scale. RD&D is expected to decrease CAPEX by about 6% per year.59 Refuelling stations in London deliver hydrogen from electrolysis at £0.25/kWh (£10/kgH2),but are aiming at below £0.18/kWh (£7/kgH2), making refuelling cheaper than petrol, although the taxation is different.
The price of the primary energy is an important factor for many processes in determining the cost of the hydrogen produced. This makes them vulnerable to future price variations.
For electrolysis, the electricity price can vary greatly, with surplus electricity from renewables offering the potential of low-cost
hydrogen. Linking it to grid management could provide additional service revenue. While this may keep production costs down, the low load-factor on the electrolysers will increase the capital burden.60 Intermittent operation could also reduce their efficiency and possibly create heat management and safety issues.
However, it is unclear how much ‘surplus’ electricity will be available – see Text Box 4.1. Electrolysers will be competing with other grid management options, such as storage and demand-side response. Understanding the potential volumes of hydrogen that could be produced from grid balancing and energy storage will require whole system modelling, with high temporal resolution.
Increasing the load factor on the electrolysers would, most likely, require building additional electricity generating capacity, thereby increasing the cost of the electricity. This may be partially offset as the demand for electricity from electrolysers could increase the load factor for existing thermal electricity generators, thereby reducing their costs.61
4.1 Cost of production
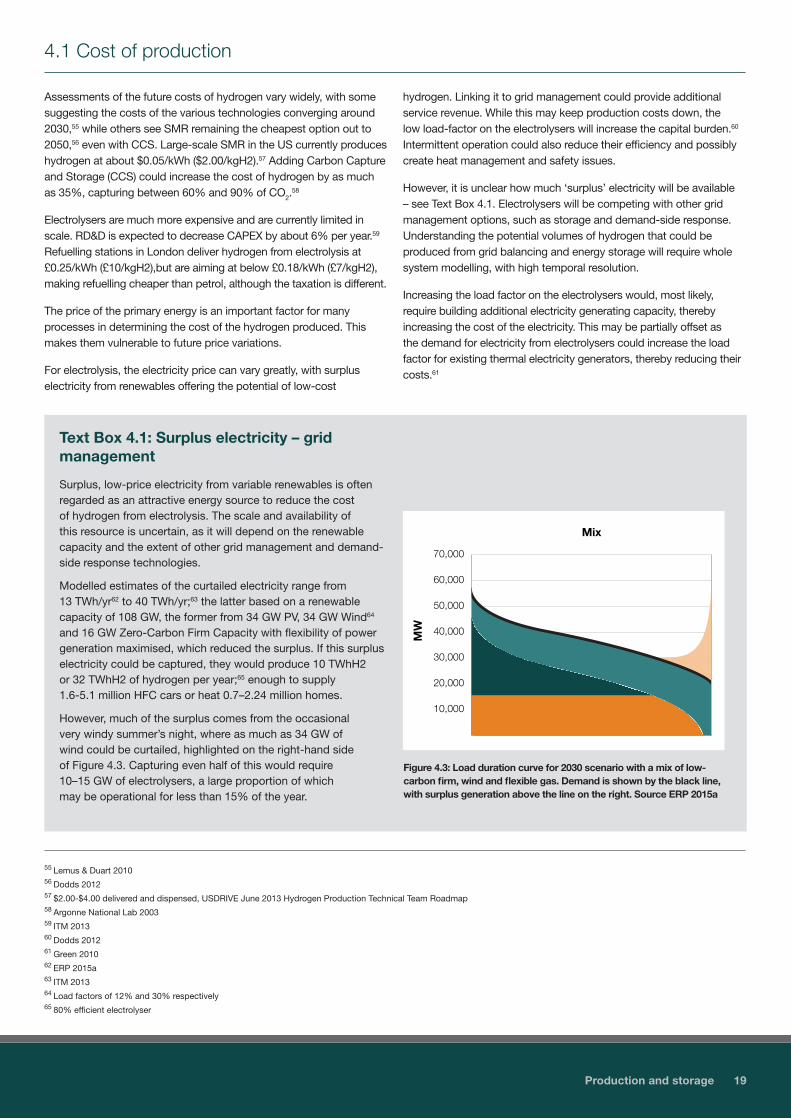
Text Box 4.1: Surplus electricity – grid management
Surplus, low-price electricity from variable renewables is often regarded as an attractive energy source to reduce the cost of hydrogen from electrolysis. The scale and availability of this resource is uncertain, as it will depend on the renewable capacity and the extent of other grid management and demand-side response technologies.
Modelled estimates of the curtailed electricity range from 13 TWh/yr62 to 40 TWh/yr;63 the latter based on a renewable capacity of 108 GW, the former from 34 GW PV, 34 GW Wind64 and 16 GW Zero-Carbon Firm Capacity with flexibility of power generation maximised, which reduced the surplus. If this surplus electricity could be captured, they would produce 10 TWhH2 or 32 TWhH2 of hydrogen per year;65 enough to supply 1.6-5.1 million HFC cars or heat 0.7–2.24 million homes.
However, much of the surplus comes from the occasional very windy summer’s night, where as much as 34 GW of wind could be curtailed, highlighted on the right-hand side of Figure 4.3. Capturing even half of this would require 10–15 GW of electrolysers, a large proportion of which may be operational for less than 15% of the year.
Mix
MW
70,000
60,000
50,000
40,000
30,000
20,000
10,000
Figure 4.3: Load duration curve for 2030 scenario with a mix of low-carbon firm, wind and flexible gas. Demand is shown by the black line, with surplus generation above the line on the right. Source ERP 2015a

66 ETI 201567 http://www.idealhy.eu/ part of the EU Fuel Cell and Hydrogen Joint Undertaking (FCH JU)68 Based on population numbers and average occupancy and energy use69 At a load factor of 90%, allowing for annual maintenance70 Leeds H21 project proposes 4 x 250 MW SMR units, but would include commercial and industrial demand71 DECC 2013 Domestic heat + industrial
20 Production and storage
If hydrogen is used for heat then large-scale storage will be required for two reasons, 1) to balance production with demand on a daily basis, and 2) for seasonal storage of hydrogen, ranging from a few days/weeks to a few months. The capacity required will depend on the configuration and operating regime, and the relative costs of the storage and production facilities.
On a daily basis the current gas transmission system provides some short-term, intra-day flexibility, through variations in pressure, or ‘linepack’. The gas system also manages pressure with supplies from storage and gas fields. A hydrogen transmission system would have to be designed and operated differently. Its lower energy density could reduce the range of flexibility available from pressure changes in the pipes, so supply management would be more dependent on external stores to provide the flexibility.
On a seasonal basis, large volumes of storage would allow production throughout the year, reducing the need to build large production capacity that would operate only in the winter. SMRs have limited ability to flex output, whereas renewables will depend on the supply available. In theory, hydrogen electrolysed from renewables in the summer could be stored to meet winter heat demand (see Text Box 4.1).
Large scale storage could be developed for grid management and flexible power station options.66 Wind farms could use hydrogen storage to alleviate connection constraints: Offshore hydrogen production would allow turbines to overcome any connection and grid constraints and continue to operate, with the hydrogen either piped ashore or converted back to electricity.
The main options for storing large volumes of hydrogen are salt caverns or depleted gas fields. Capacities range from tens of GWh to a few TWh of hydrogen, suitable for managing hourly and weekly variations between supply and demand for domestic heat, or monthly if enough caverns were utilised.
Onsite tanks could store a few MWh of compressed hydrogen. Liquefaction would raise the energy density from 1.4 kWh/litre at 700 bar to 2.3 kWh/litre as a liquid, but to do so can require as much as 30% of its energy content, making it more suitable for long distance shipping. The IDEALHY project is aiming to reduce this to 15%.67
Operational need
Seasonal variations in domestic heat demand means that using hydrogen would require large volumes of hydrogen storage. The capital cost and load factors of SMRs would be balanced with the cost of storage. Large volumes of storage would allow fewer SMRs to run continuously at maximum efficiency, whereas, if storage was restricted, a larger fleet of SMRs would be needed to meet peak winter demands, but they would operate with a lower load factor, as some would stand idle through the summer.
For example, a city the size of Leeds would require about 4.5 TWh of hydrogen per year.68 This would require a total SMR capacity of 530 MWH2 if at maximum efficiency,69 along with 800 GWh of hydrogen storage. Limiting storage to 150 GWhH2 would increase SMR capacity by 50% to 800 MW,70 operating with an average load factor of about 60%.
Table 2 illustrates this if full UK heat demand was switched to hydrogen or just seventeen metropolitan areas (see Section 7). At a national level as little as 54 GW of SMR could be used, but it would require 75 TWhH2 of storage, more than is currently being planned, plus any strategic reserve. A 25% increase in SMR capacity would reduce storage to 30 TWhH2.
The economics and load factors could be improved if hydrogen was used for transport and industry, which have a more consistent demand throughout the year. This would allow some operational flexibility between the various markets, reducing the capital burden.
4.2 Large-scale hydrogen storage
SMR capacity Storage capacity
Full UK heat demand 424 TWh H2/yr71
SMR run continuously 54 GW H2 75 TWh H2 (>90% load factor)
SMR at 1.4 x average demand 68 GW H2 30 TWh H2 (~70% load factor)
SMR meet peaks 80 GW H2 11 TWh H2 (~60% load factor)
Metropolitan demand 84 TWh H2
SMR run continuously 10 GW H2 13 TWh H2
SMR meet peaks 14 GW H2 2 TWh H2
Table 2 SMR Capacity versus Storage. Running SMRs continuously with only 1 month downtime per year for maintenance would reduce capital costs, but increase need for inter-seasonal storage. Storage capacity does not include any Strategic Reserve, which could be as natural gas or hydrogen.

Production and storage 21
UK Capacity
The UK currently has 4.3 billion m3 of underground natural gas storage, of which 3.5 billion m3 is in depleted offshore gas fields, such as Rough, with the rest in salt caverns. A further 11.4 billion m3 has been identified,73 which would increase the UK’s strategic reserve of natural gas from the current 20 days of average consumption to 60 days,74 holding about 160 TWh of gas. If used for hydrogen, with its lower energy density, this would store about 55 TWh.
Most of the future storage that has been identified is in salt caverns. The main locations for developing these are Teesside, East Yorkshire, Cheshire Basin and Weald Basin. Teesside salt reserves are shallower so the caverns can only operate at a pressures of around 45 bar, storing only 24 GWh in three 150,000 m3 caverns. The UK has a number of deeper caverns in Cheshire that can take higher pressures, with the deeper ones in East Yorkshire and Weald potentially operating at about 200 bar. Deeper, high pressure
caverns would be more expensive, due to the higher construction cost, top-side facilities and larger compressors.
Intra-day storage is more expensive to operate than long-term stores, as it has to manage regular changes in volume and direction of flow. H21 analysis suggests two intra-day caverns, storing a total of 11.1 GWhH2, could cost £77 million, compared to seven inter-seasonal caverns costing £289 million, for 854 GWhH2. ETI estimates the capital costs for similar sized intra-day stores could be twice this, with high-pressure (270 bar) stores costing nearly seven times as much, even compared with intra-day storage. These costs are still low compared to other options outlined in Table 3.1.
Storage in depleted gas fields needs further analysis to understand the suitability and capacity available and the implications of contamination from the remaining gas. Hydrogen is expected to permeate the rock more easily than natural gas.75 Biological fouling may be a problem, which could contaminate the hydrogen with hydrogen sulphide and methane.76
Processes that can produce large volumes of decarbonised hydrogen could become a priority if hydrogen is used to meet heat demand. Alternative primary energy sources could be used along with the potential for international trade in hydrogen to develop.
Various technologies are in development including highly efficient SMR, biomass and waste gasification. Other zero-carbon production technologies include high and very-high temperature nuclear reactors, biological production, and solar technologies.
Various proposals have been made to improve the efficiency of SMR. Most focus on the reuse of process heat to improve the CO2 capture processes. Chemical looping has also been proposed which could reduce the energy input and therefore the efficiency of the process. It is unclear when it will be commercially available.
Catalysts could also be used to crack methane. A process being developed by the Hazer Group77 in Australia proposes using supper-heating iron ore to crack methane. The benefit of the process is that the CO2 produced is in the solid form of graphite, which could then be sold to other markets, such as lithium ion batteries. Further development is needed to understand costs and energy and iron ore requirements.
Solar and nuclear thermal cracking
At temperatures around 1,000oC water can be ‘cracked’ to make hydrogen, aided by chemical reactions, such as the iodine-sulphur process (IS-process). These thermo-chemical processes are still in development, and will require special materials to withstand the temperatures. Two sources have been proposed, Generation IV Very-High Temperature reactors and concentrated solar towers.
Very-High Temperature (VHT) nuclear reactors are at the pilot plant stage and the IS-process at lab-scale. Assessments suggest efficiencies of 52% could be achieved at 900oC falling to 43% at 850oC.78 IAEA analysis suggests 2,400 MWth VHT nuclear reactors could produce 8.5 TWh H2 per year (216,000 tonnes) at a process efficiency of 45%: co-generation of electricity may be possible, but it is not specified in the assessment. Assuming the materials can be developed to deliver reliable production the IAEA HEEP model suggests hydrogen could be produced at $5-6/kg. Delivering the 84 TWh for the seventeen cities identified in Section 7, would require about 24 GWth of Very-High Temperature Generation IV reactors, and 240 GWth for the E4Tech Full Scenario. For contrast, current generation nuclear reactors connected to electrolysers (80% efficiency) would require about 13 GWe and 130 GWe, respectively.
4.3 Future technologies
72 Crowther ME 2011b 73 BGS 2011 74 Based on 2014 & 2015 gas consumption data DUKES 201675 Stone, Velhuis, Richardson 2009 76 HyUnder 201377 http://www.hazergroup.com.au/78 GA 2003

Very-high temperature concentrated solar tower technology for hydrogen production is at an early stage. The EU funded Hydrosol-Plant project is building a 750 kWth solar tower with the aim of starting operations in 2016. A further pre-commercial plant would follow in early 2020’s. Current assessments indicate a cost of hydrogen between €5.4/kgH2 and €20.3/kgH2.79 If it follows the development timeline of molten-salt solar towers for power production, then it may be 15 years before commercial projects.
Little data is available on efficiencies, with a University of Boulder project suggesting an overall efficiency for solar collector and process of 20%, producing 1.44 TWh of H2 per year (36,500 tonnes) from a 1,200 acre site.80 If achievable, the UK’s domestic heat and transport demand could be delivered using hydrogen81 from about 1,109 sq miles in an area of high insolation (about twice the size of Greater London).
Water consumption may be a concern in some areas. To produce this volume of hydrogen the stoichiometric water demand amounts to 73 billion litres per year, which is more than six times the amount of water evaporated per year from a power station the size of Drax.82
Solar technologies are being developed to produce hydrogen either through high-efficiency PV units linked to electrolysers, or through photoelectrochemical splitting of water (artificial photosynthesis). Laboratory developments of semiconductor panels for artificial photosynthesis, similar to PV cells, have recently achieved efficiencies of 14%. NREL estimate that efficiencies of 25% will be needed to bring hydrogen costs to below $2/kg.83 An alternative configuration, in Japan, using high-efficiency PVs linked to an electrochemical cell has demonstrated efficiencies of 24%. Material costs, durability and efficiencies will all need to improve to make the hydrogen cost competitive.
Solar options would avoid the dependency on fossil fuels for the hydrogen source. Areas with high solar potential could lead to the development of a global trade.
Waste and biomass
Concerns about dependence on imported on energy might lead to the exploitation of domestic energy sources, such as waste, which could be converted to bio-gas or hydrogen. Analysis by National Grid suggest this could amount to up to 120 TWh.84
International trade
Interest in international trade is already developing. Japan is exploring opportunities to import hydrogen, from places such as Norway and Australia. Both have potentially extensive renewable energy resources. But analysis in Hydrogen by SINTEF,85 suggests that it may be more efficient, in the first instance, to exploit their gas resource combined with CCS. Japan’s limited CO2 storage capability means it makes more sense to import hydrogen than do the reforming themselves. Australia may use its coal resources,86 and in the long-term develop solar production.
Initial suggestions are Norway could ship 225,000 tonnes H2 a year to Japan, and possibly to European markets. Other producers could develop, potentially using solar power to produce hydrogen, either through advanced panels or using solar concentrators.
Transporting the hydrogen to the UK would require liquefaction, similar to LNG. The cost of moving energy in this way is lower than through electricity cables. However, liquefaction of hydrogen could require between 15% and 30% of its energy content,87 putting an additional burden on the provider. Some energy could be recovered when decompressing during unloading, which would effectively increase the overall amount of energy transported.
22 Production and storage
79 Lorentzou 2014 80 Deign J 2013 & Muhich CL et al 2015 81 as proposed by E4Tech 2015 Full Contribution Scenario for CCC – see Section 4 82 Drax 2013 83 NREL 2014 84 National Grid 2016a85 http://gemini.no/en/2015/04/liquid-wind-and-gas-to-japan/ http://blog.sintefenergy.com/energy-efficiency/hydrogen-cars-the-role-of-fossil-fuels-and-ccs-in-a-cleaner-transport-
system/ 86 http://www.greencarcongress.com/2013/09/20130928-khi.html 87 http://www.idealhy.eu/

Efficiency and demand for hydrogen 23
5 Efficiency and demand for hydrogen«
Much of the focus for hydrogen has been on reducing the cost of production, few studies consider the implications of delivering increasing volumes of hydrogen particularly on primary energy supply and associated CO2 production.
Early markets could be supplied with surplus hydrogen from industry or from electrolysis using low-priced electricity. But while production costs from fossil fuels remain low, SMR or gasification is likely to be used to meet any demand for large volumes of hydrogen. How and when this happens will depend on policy decisions, for example, using it for domestic heat would change the demand profile.
Improvements in conversion efficiency and maximising opportunities to integrate hydrogen into the energy system will lessen the impacts, but demand for large volumes will require building dedicated production capacity and managing any associated CO2 production.
The lower efficiency of hydrogen pathways has implications for energy security, which could lock-in imports of either hydrogen or natural gas.
5.1 Heat
For heat, electric pathways are on average much more efficient than gas or hydrogen (Figure 5.1). Electric heat pumps leverage the electrical energy to deliver greater heat output than the primary input. The additional production step for hydrogen reduces the overall efficiency, compared to a gas system, by as much as 25 percentage points.
However, while the overall energy consumption has implications for energy security, the design of the heat system will be determined by how winter peaks are managed, which affects system resilience and costs. Figure 5.1 illustrates a heat pump with coefficient of performance (CoP) of 2.5 (250%), but in very cold weather CoP could reduce to 1.0, making it less efficient than a hydrogen boiler. The cold weather would also increase heat demand. During these periods the demand on the electricity system would increase (see Section 3.4). The size of these peaks would be determined by the extent that buildings were insulated to improve the operational efficiency of the heat pumps.
Managing winter peaks with hydrogen would be easier, as it could be stored, like gas. Storing electricity is much more expensive, so peak demand is likely to be met using dedicated generation capacity.
Using small fuel-cell CHPs in each home could improve the efficiency, capturing the heat from the fuel cell. Although the heat efficiency is lower than a condensing gas boiler, it is compensated by electricity production that is more efficient than a thermal gas generator, so the overall efficiency is higher. However, this should be compared to a heat pump system or district CHP. The latter could be decarbonised efficiently using a fuel-cell supplied with hydrogen.
Figure 5.1: Percentage Heat output after efficiency losses: natural gas or electricity supply to Electric Heat Pump (CoP 2.5) or Hydrogen Boiler.88
68
0
50
100
150
200
Wind / Nuclear Electrolyser Transmission H2 Boiler Useful output
Heat – Wind/Nuclear, electolyser to H2 Boiler
Heat – Gas to Condensing Boiler
87
0
20
40
60
80
100
120
Gas Trans & distrib Gas boiler Useful output
0
20
40
60
80
100
120
Gas CCGT Trans & distrib Heat pump Heat output
Heat – Gas (LHV) CCGT with CCS to Heat pump
119
63
0
20
40
60
80
100
120
Gas SMR Transmission H2 Boiler Useful output
Heat – Gas SMR with CCS to H2 Boiler
0
50
100
150
200
250
Wind / Nuclear Trans & distrib Heat pump Heat output
233
Heat – Wind/Nuclear to Heat pump
88 Assumptions can be found in Glossary
68
0
50
100
150
200
Wind / Nuclear Electrolyser Transmission H2 Boiler Useful output
Heat – Wind/Nuclear, electolyser to H2 Boiler
Heat – Gas to Condensing Boiler
87
0
20
40
60
80
100
120
Gas Trans & distrib Gas boiler Useful output
0
20
40
60
80
100
120
Gas CCGT Trans & distrib Heat pump Heat output
Heat – Gas (LHV) CCGT with CCS to Heat pump
119
63
0
20
40
60
80
100
120
Gas SMR Transmission H2 Boiler Useful output
Heat – Gas SMR with CCS to H2 Boiler
0
50
100
150
200
250
Wind / Nuclear Trans & distrib Heat pump Heat output
233
Heat – Wind/Nuclear to Heat pump

24 Efficiency and demand for hydrogen
5.2 Transport
From a system perspective the energy supply chains for hydrogen fuel-cell vehicles (FCEV) are less efficient than either battery electric vehicles (BEV) or current fossil fuels (Figure 5.2). Hydrogen could become more efficient than oil, through improvements in electric motors and fuel cell efficiency. But a step change in the process efficiency of SMR or electrolysis will be required if it is to equal a battery electric system.89
These system challenges need to be balanced with the user benefits of hydrogen vehicles compared to electric, particularly around recharging and range (see Section 3.3). Availability of the refuelling and recharging facilities that fulfil the user needs will be an important determinant for market take up, as will be the economics of the options.
Figure 5.2 Energy requirement in Wh of primary energy per km of different energy supply chains, sourced from natural gas, low-carbon generation or petrol. All start with the energy consumption per km for each vehicle type. These are illustrative and subject to variation, for example compression to 700 bar rather than 350 bar requires 12%90 more energy, but allows more hydrogen to be carried. (Note, hydrogen compression is an energy input rather than loss and may be met by grid electricity.)
89 Waller et al 201490 Quantum Technologies 2004
571
210
0
100
200
300
400
500
600
700
800
Gas CCGT Trans & distrib
Charger Battery BEV
Transport – Gas (LHV) CCGT with CCS, to BEV
688
433
0
100
200
300
400
500
600
700
800
Gas SMR H2 Pipe Compressor FCEV
Transport – Gas (LHV) SMR with CCS to FCEV
616
0 100 200 300 400 500 600 700 800
Petrol Distribution ICE Engine
Transport – Petrol to ICE
293 210
0
100
200
300
400
500
600
700
800
Wind / Nuclear Trans & distrib
Charger Battery BEV
Transport – Wind / Nuclear to BEV
655
433
0
100
200
300
400
500
600
700
800
Wind / Nuclear Electrolyzer H2 pipe Compressor FCEV
Transport – Wind / Nuclear to FCEV
629
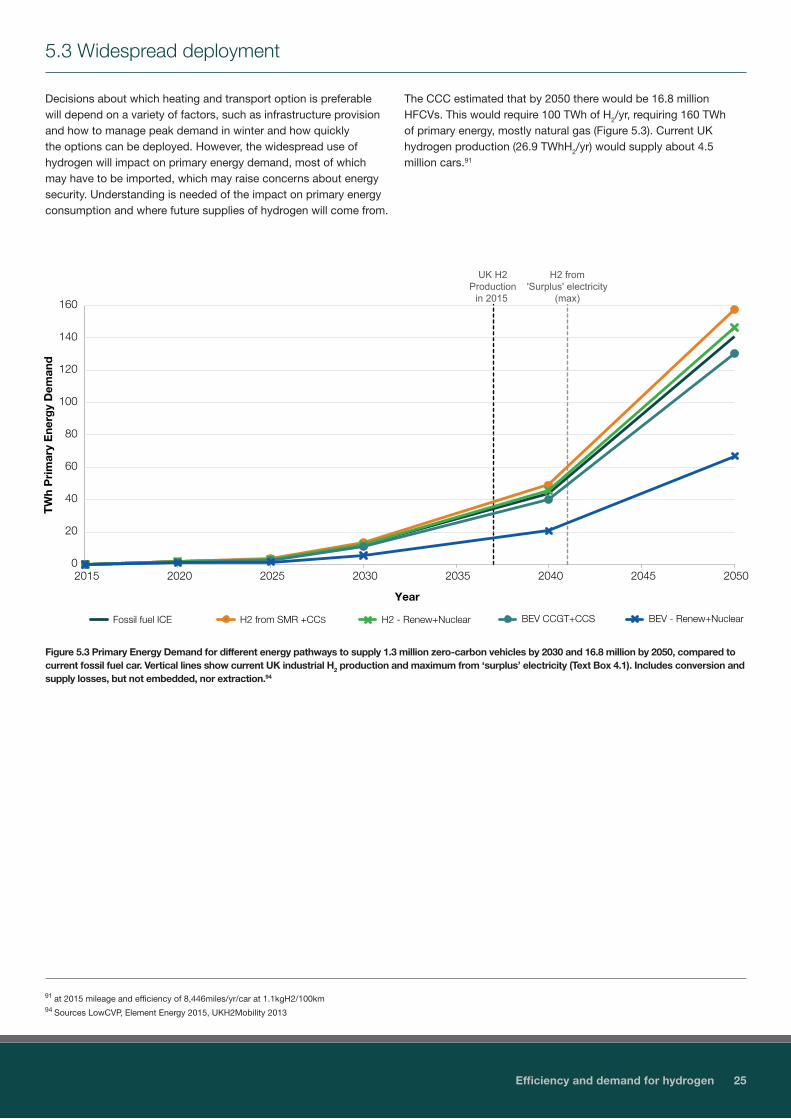
Efficiency and demand for hydrogen 25
5.3 Widespread deployment
Decisions about which heating and transport option is preferable will depend on a variety of factors, such as infrastructure provision and how to manage peak demand in winter and how quickly the options can be deployed. However, the widespread use of hydrogen will impact on primary energy demand, most of which may have to be imported, which may raise concerns about energy security. Understanding is needed of the impact on primary energy consumption and where future supplies of hydrogen will come from.
The CCC estimated that by 2050 there would be 16.8 million HFCVs. This would require 100 TWh of H2/yr, requiring 160 TWh of primary energy, mostly natural gas (Figure 5.3). Current UK hydrogen production (26.9 TWhH2/yr) would supply about 4.5 million cars.91
0
20
40
60
80
100
120
140
160
2015 2020 2025 2030 2035 2040 2045 2050
TW
h P
rim
ary
Ene
rgy
Dem
and
Year
Total Primary energy demand transport: various end use vehicle tech
Fossil fuel ICE H2 from SMR +CCS H2 - Renew+Nuclear BEV CCGT+CCS BEV - Renew+Nuclear
UK H2Production
in 2015
H2 from 'Surplus' electricity
(max)
Figure 5.3 Primary Energy Demand for different energy pathways to supply 1.3 million zero-carbon vehicles by 2030 and 16.8 million by 2050, compared to current fossil fuel car. Vertical lines show current UK industrial H2 production and maximum from ‘surplus’ electricity (Text Box 4.1). Includes conversion and supply losses, but not embedded, nor extraction.94
91 at 2015 mileage and efficiency of 8,446miles/yr/car at 1.1kgH2/100km94 Sources LowCVP, Element Energy 2015, UKH2Mobility 2013
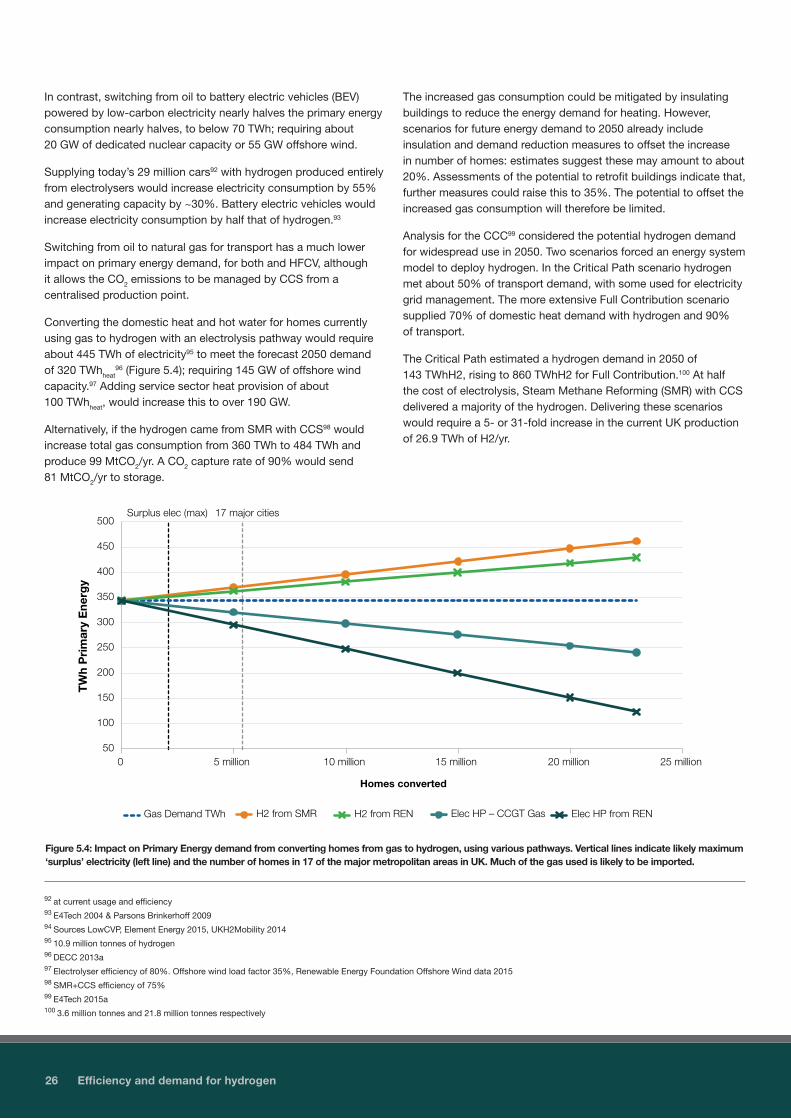
26 Efficiency and demand for hydrogen
In contrast, switching from oil to battery electric vehicles (BEV) powered by low-carbon electricity nearly halves the primary energy consumption nearly halves, to below 70 TWh; requiring about 20 GW of dedicated nuclear capacity or 55 GW offshore wind.
Supplying today’s 29 million cars92 with hydrogen produced entirely from electrolysers would increase electricity consumption by 55% and generating capacity by ~30%. Battery electric vehicles would increase electricity consumption by half that of hydrogen.93
Switching from oil to natural gas for transport has a much lower impact on primary energy demand, for both and HFCV, although it allows the CO2 emissions to be managed by CCS from a centralised production point.
Converting the domestic heat and hot water for homes currently using gas to hydrogen with an electrolysis pathway would require about 445 TWh of electricity95 to meet the forecast 2050 demand of 320 TWhheat
96 (Figure 5.4); requiring 145 GW of offshore wind capacity.97 Adding service sector heat provision of about 100 TWhheat, would increase this to over 190 GW.
Alternatively, if the hydrogen came from SMR with CCS98 would increase total gas consumption from 360 TWh to 484 TWh and produce 99 MtCO2/yr. A CO2 capture rate of 90% would send 81 MtCO2/yr to storage.
The increased gas consumption could be mitigated by insulating buildings to reduce the energy demand for heating. However, scenarios for future energy demand to 2050 already include insulation and demand reduction measures to offset the increase in number of homes: estimates suggest these may amount to about 20%. Assessments of the potential to retrofit buildings indicate that, further measures could raise this to 35%. The potential to offset the increased gas consumption will therefore be limited.
Analysis for the CCC99 considered the potential hydrogen demand for widespread use in 2050. Two scenarios forced an energy system model to deploy hydrogen. In the Critical Path scenario hydrogen met about 50% of transport demand, with some used for electricity grid management. The more extensive Full Contribution scenario supplied 70% of domestic heat demand with hydrogen and 90% of transport.
The Critical Path estimated a hydrogen demand in 2050 of 143 TWhH2, rising to 860 TWhH2 for Full Contribution.100 At half the cost of electrolysis, Steam Methane Reforming (SMR) with CCS delivered a majority of the hydrogen. Delivering these scenarios would require a 5- or 31-fold increase in the current UK production of 26.9 TWh of H2/yr.
50
100
150
200
250
300
350
400
450
500
0 5 million 10 million 15 million 20 million 25 million
TW
h P
rim
ary
Ene
rgy
Total Primary energy demand domestic heat: various end use heat tech
Gas Demand TWh H2 from SMR H2 from REN Elec HP – CCGT Gas Elec HP from REN
17 major cities Surplus elec (max)
Homes converted
Figure 5.4: Impact on Primary Energy demand from converting homes from gas to hydrogen, using various pathways. Vertical lines indicate likely maximum ‘surplus’ electricity (left line) and the number of homes in 17 of the major metropolitan areas in UK. Much of the gas used is likely to be imported.
92 at current usage and efficiency93 E4Tech 2004 & Parsons Brinkerhoff 200994 Sources LowCVP, Element Energy 2015, UKH2Mobility 201495 10.9 million tonnes of hydrogen96 DECC 2013a97 Electrolyser efficiency of 80%. Offshore wind load factor 35%, Renewable Energy Foundation Offshore Wind data 2015 98 SMR+CCS efficiency of 75%99 E4Tech 2015a100 3.6 million tonnes and 21.8 million tonnes respectively
50
100
150
200
250
300
350
400
450
500
0 5 million 10 million 15 million 20 million 25 million
TW
h P
rim
ary
Ene
rgy
Total Primary energy demand domestic heat: various end use heat tech
Gas Demand TWh H2 from SMR H2 from REN Elec HP – CCGT Gas Elec HP from REN
17 major cities Surplus elec (max)
Homes converted

101 Based wind data for last 3 years of offshore wind from Elexon BM reports 102 At 35% load factor, from Renewable Energy Foundation.103 Electrolyser efficiency 77%.104 SMR efficiency 73% including CCS.
Efficiency and demand for hydrogen 27
0
200
400
600
800
1,000
1,200
1,400
1,600
2014 2050 FullContrib Scenario
2050 CriticalGas Domestic
2050 CriticalElec Domestic
TW
H o
f G
as a
nd O
il D
eman
d
Energy Demand for Gas and Road Transport Oil
Oil In Road Transport
Transport H2
Hydrogen
Domestic
Iron & Steel
Other industries
Losses
Other final users
Heat Generation
Figure 5.6 Widespread deployment of hydrogen will increase national primary energy demand. Chart shows total UK gas consumption in 2014 plus the current oil consumption for transport that is mostly converted to hydrogen in E4Tech Scenario. Excluding Electricity Generation, using hydrogen leads to a 50% increase in primary energy demand, a majority of which is used to deliver domestic heat.
Using wind power would require about 400 GW of off-shore capacity (Figure 5.5). About 250 GW of electrolysers to capture the 1,100 TWh of electricity: wind variability means load factors on the electrolysers of below 25% for about 50 GW, with a further 50 GW at less than 50%.101 Hydrogen storage will be required to balance supply with demand.
A fleet of SMRs would also require storage. Running continuously throughout the year would require about 140 TWh hydrogen storage. Building more SMR units to meet variations in seasonal demand would reduce the need for storage: rough calculations suggest this could be reduced by 60% by increasing SMR capacity by a quarter, but their average load factor would reduce to about 70%.
*or 160 GW of Thermal Generation capacity
CO2 to be managed ~
200 Mt
164
Gas Demand1173 TWh
SMRs103 GW
186
40
143
Wind400 GW*
Electricity Demand1,117 TWh
Electrolysers250 GW Hydrogen
860 TWh
60
14
Figure 5.5: Two hydrogen production pathways to meet demand in E4Tech Full Contribution Scenario (860 TWh H2) and Critical Path (143 TWh H2). Both assume even demand throughout year: electricity capacity and hydrogen production capacity would increase if storage was not available to manage seasonal variations. Top pathway requires about 400 GW of offshore wind,102 over 1,100 TWh of electricity, with about 250 GW of electrolysers.103 Lower pathway, uses 1,173 TWh of natural gas, about 100 GW of SMR104 capacity, with over 200 MtCO2 managed with CCS.
The SMRs would produce about 200 MtCO2/yr, a volume equivalent to the natural gas extracted from the North Sea at its peak around 1999. This figure does not include any emissions that might come from the power sector. By contrast, the CCC Central 2050 scenario estimates a total of 95 MtCO2 going to storage from the whole economy. Total storage capacity for the UK is estimated to be about 78 Gt, of which 12 Gt has a high probability of being available. CO2 production over 200 Mt/yr would fill this by the end of the century.
In terms of the impact on overall oil and gas demand, the Full Contribution scenario significantly increased consumption, Figure 5.6. Heat has the biggest impact and would substantially increase gas demand. The Critical Path transport-focussed-scenario, would decrease primary energy demand, the amount depending on whether the remaining energy demand is met by gas or electricity.
With the need to make hydrogen zero-carbon (see Section 6), some of the demand could be met by imports, as an international trade develops. This zero-carbon hydrogen could be produced using solar energy in countries with high insolation and land availability (see Section 4.3).

28 Carbon emissions
6 Carbon emissions«
As with electricity, most of the greenhouse gas emissions from hydrogen come from the production process. Using fossil fuels as the primary energy source are the main source of emissions, from the conversion process and upstream extraction. The higher flame temperature when burning hydrogen, could lead to an increase in NOx, but can be managed.
Capturing the carbon emissions from fossil fuels will be essential to help decarbonise hydrogen and is being demonstrated on SMR in Port Arthur, Texas, achieving rates over 90%.105 The location of SMR will be determined by the cost of access to CO2 stores and the cost of delivering the hydrogen. Capture on small distributed SMR is likely to be expensive unless a CO2 network is available. As noted in section 4, access to large-scale hydrogen storage will also be a determining factor.
6.1 Comparison with other energy pathways
For both transport and heat the amount of carbon emissions is dependent on the primary energy source. The efficiency of the supply chain is also important, particularly where grid electricity is used to produce hydrogen, where the additional electrolysis step increases the energy demand and any upstream emissions. This could be reduced if the electrolysers could be operated to utilise only very low carbon electricity, such as wind or nuclear, but this is subject to sufficient quantities of generation being available, and/or storage.
Transport
Both BEVs and HFCVs produce lower emissions than current average internal combustion engine (ICE) vehicles. If gas is used as the primary energy supply, either for electricity or hydrogen, CCS will be needed to bring BEVs and FCEVs below future ICE and hybrid technologies (<90 gCO2/km).106 However, even with 90% CO2 capture from CCS, about half the total emissions are from upstream extraction, depending on how and where the gas is extracted and transported.
For electricity pathways, using average grid carbon intensity, emissions from HFCVs are nearly twice BEVs. This does not account for factors such as charging or producing hydrogen when grid-mix emissions are low.108 However, it indicates that SMR with CCS (90% capture) could be used to meet early demand for bulk hydrogen with low emissions.
Domestic heat
Converting natural gas to hydrogen would increase the overall volume of CO2 produced by about 30%. A CCS capture rate of 90% would reduce the CO2 emitted by about three-quarters, delivering hydrogen at a carbon intensity of about 50 gCO2/kWhH2. The efficiency of heat pumps, averaged across the year, means overall emissions are lower than for hydrogen production.
Producing hydrogen from electricity requires grid carbon intensity of below 150 gCO2/kWhe to achieve overall CO2 emission reductions, and below about 40 gCO2/kWhe to improve on SMR with CCS. At a grid carbon intensity of 100 gCO2/kWhe the carbon intensity of hydrogen would be about 125 gCO2/kWhH2.
HFCV: SMR no CCS
HFCV: SMR+CCS
BEV: Grid Mix
BEV: gas CCGT no CCS
BEV: gas CCGT+CCS
Average ICE parc 2015
HFCV: Grid Mix Elec
0
50
100
150
200
250
0 50 100 150 200 250 300 350 400 450 500
Car
bo
n E
mis
sio
ns –
gC
O2/
km
Electricty Grid Mix – gCO2/kWhe
Figure 6.1: Comparative carbon emissions for transport using different energy pathways, with gas or electricity as primary energy source. Average future ICE parc emissions could drop below 100 gCO2/km. Average electricity grid intensity 2014 = 400 gCO2/kWh.107 Note – figures include upstream extraction emissions, neither include any embedded emissions from vehicles or supporting infrastructure.
105 IEA GHG 2015106 J RC 2011 & ERP 2016107 DUKES 2016108 See ERP 2016 Transport report for further discussion

Carbon emissions 29
Achieving a reduction of 80% below current gas boilers, requires hydrogen from SMR to have a CO2 capture rate of over 94%, delivering hydrogen at about 40 gCO2/kWhH2 (Figure 6.2). Using CCGT with CCS for heat pumps requires capture of 88%. Delivering the same reduction with grid electricity, requires a carbon intensity of less than 33 gCO2/kWhe for hydrogen and electrolysis, or 113 gCO2/kWhe for electric heat pumps.
If it is assumed that zero-carbon hydrogen could be produce in the UK, using imported natural gas,109 and a CCS capture rate of 100%
CO2, achieving an 80% reduction in emissions would require about 18 million of the 23 million homes currently on gas to be switched to hydrogen by 2050. If the Leeds project is operational by 2030, this would require the equivalence of 3 similar sized cities to be converted each subsequent year.
With recent announcements, following the Paris Climate Agreement, about the intention of moving to zero emissions in the decades after 2050, hydrogen will need to be decarbonised or offset with negative-emission technologies.
H2: G
rid Elec
Elec-Heat Pump: Grid Elec
Elec-Heat Pump: CCGT+ 90% CCS
H2: SMR+ 90% CCS
Gas Boiler
H2: SMR no CCS
Elec-Heat Pump: CCGT
80% target
0.0
0.5
1.0
1.5
2.0
2.5
3.0
3.5
4.0
4.5
5.0
0 50 100 150 200 250 300 350 400 450 500
CO
2 em
issi
ons
per h
ouse
per
yea
r - to
nnes
CO
2
Carbon intensity of grid electricity – grams CO2/kWhe
Figure 6.2: Comparative carbon emissions for heat using different energy pathways and primary energy sources. Grid mix in 2014 = 400 gCO2/kWh. For hydrogen from SMR, a 94% capture rate would bring it in line with the 2050 target of 80% emission reduction. It is important to note that at 90% capture, half of the emissions are from upstream extraction and would not contribute directly to UK total.
~80% target
0
5
10
15
20
25
0 5 million 10 million 15 million 20 million 25 million
Mill
ion
tonn
es C
O2
Homes converted from gas
Impact of residual CO2 emissions from hydrogen from SMR for converting domestic heat:
H2 from SMR+CCS
Total CO2 H2-SMR+90% CCS + Gas + upstream
Total CO2 H2-SMR+100% CCS + Gas + upstream
100% Capture
Total CO2 H2-SMR+100%CCS, + Gas, No Upstream
No upstream
Figure 6.3: Impact of residual CO2 emissions to atmosphere from hydrogen from SMR, for different CO2 capture rates and upstream emissions. A CO2 capture rate of 100% on SMR for hydrogen would leave about 9 MtCO2 from upstream emissions. Discounting upstream emissions and ensuring 100% CO2 capture from SMR, would mean an 80% emission reduction could be achieved from switching about 18 million homes from gas to zero-carbon hydrogen. Including upstream emissions, with a 90% capture rate, would not meet the target.110
109 So upstream emissions do not accrue to UK110 Note: some sector emission reductions since 1990 mean 2050 target may be a few percent lower than 80%.

30 Carbon emissions
6.2 Certification of green hydrogen
Defining low-carbon or ‘green’ hydrogen would provide clarity for decarbonising production and could support more expensive technologies, such as electrolysis. It may also be important if an international market develops, although the producer may be responsible for any carbon emissions.
A universal definition of low-carbon would be difficult, as decarbonisation is dependent on how the hydrogen is produced and what it is displacing. Several attempts are being made across Europe, UK and industry bodies, but with differing underlying objectives and thresholds, definitions of system boundaries and assumptions about processes.111 For example, some initiatives exclude hydrogen from non-renewable sources, others include ecological or sustainability criteria.
A standard would allow comparison with other decarbonisation efforts and could be used to set objectives for decarbonising the gas grid. However, different end-use technologies use different amounts of hydrogen to deliver the same energy service, such as hydrogen boilers, fuel-CHP units or district heating units. It may be easier to define at point of production, avoiding the difficulties of assessing the various efficiencies of the end use technologies. Electric vehicles face a similar challenge, as the time of charging currently has a significant impact on the vehicle emissions.
If the early standard is set too high it risks restricting the development of hydrogen. A standard could increase over time, in line with carbon budgets, dropping close to zero post 2050. For example, set too low and electrolysers may not be able to source sufficient low-carbon electricity, or ‘surplus’ renewables, and would be dependent on the carbon intensity of the grid. Set too high and it risks developing supply chains that are incompatible with emission reduction targets.
Emissions from large-scale production processes, particularly SMR, will be subject to other legislation, such as EU ETS or carbon tax. Other processes, such as electrolysis could be subject to the carbon intensity of the grid electricity, over which it may have little control. Restricting electrolysers to lower carbon electricity could affect their economics, although “green electricity” contracts could be negotiated to improve operation.
111 Dodds 2016
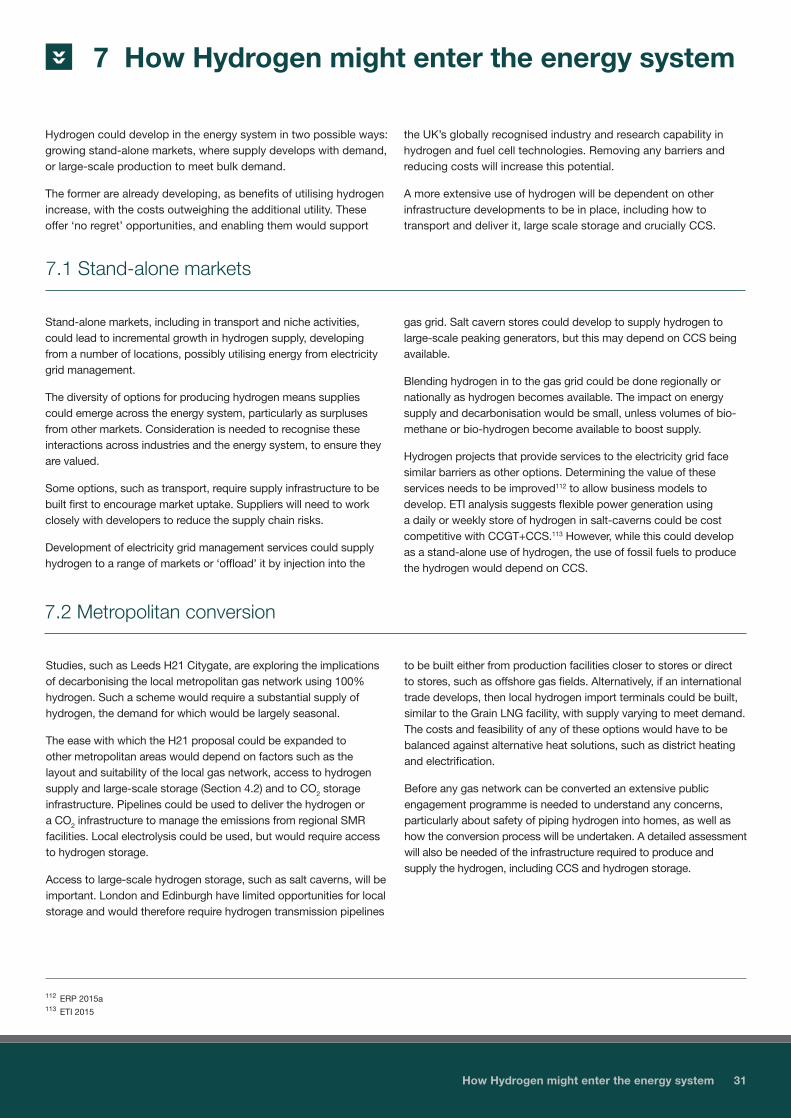
How Hydrogen might enter the energy system 31
7 How Hydrogen might enter the energy system«
Hydrogen could develop in the energy system in two possible ways: growing stand-alone markets, where supply develops with demand, or large-scale production to meet bulk demand.
The former are already developing, as benefits of utilising hydrogen increase, with the costs outweighing the additional utility. These offer ‘no regret’ opportunities, and enabling them would support
the UK’s globally recognised industry and research capability in hydrogen and fuel cell technologies. Removing any barriers and reducing costs will increase this potential.
A more extensive use of hydrogen will be dependent on other infrastructure developments to be in place, including how to transport and deliver it, large scale storage and crucially CCS.
7.1 Stand-alone markets
Stand-alone markets, including in transport and niche activities, could lead to incremental growth in hydrogen supply, developing from a number of locations, possibly utilising energy from electricity grid management.
The diversity of options for producing hydrogen means supplies could emerge across the energy system, particularly as surpluses from other markets. Consideration is needed to recognise these interactions across industries and the energy system, to ensure they are valued.
Some options, such as transport, require supply infrastructure to be built first to encourage market uptake. Suppliers will need to work closely with developers to reduce the supply chain risks.
Development of electricity grid management services could supply hydrogen to a range of markets or ‘offload’ it by injection into the
gas grid. Salt cavern stores could develop to supply hydrogen to large-scale peaking generators, but this may depend on CCS being available.
Blending hydrogen in to the gas grid could be done regionally or nationally as hydrogen becomes available. The impact on energy supply and decarbonisation would be small, unless volumes of bio-methane or bio-hydrogen become available to boost supply.
Hydrogen projects that provide services to the electricity grid face similar barriers as other options. Determining the value of these services needs to be improved112 to allow business models to develop. ETI analysis suggests flexible power generation using a daily or weekly store of hydrogen in salt-caverns could be cost competitive with CCGT+CCS.113 However, while this could develop as a stand-alone use of hydrogen, the use of fossil fuels to produce the hydrogen would depend on CCS.
7.2 Metropolitan conversion
Studies, such as Leeds H21 Citygate, are exploring the implications of decarbonising the local metropolitan gas network using 100% hydrogen. Such a scheme would require a substantial supply of hydrogen, the demand for which would be largely seasonal.
The ease with which the H21 proposal could be expanded to other metropolitan areas would depend on factors such as the layout and suitability of the local gas network, access to hydrogen supply and large-scale storage (Section 4.2) and to CO2 storage infrastructure. Pipelines could be used to deliver the hydrogen or a CO2 infrastructure to manage the emissions from regional SMR facilities. Local electrolysis could be used, but would require access to hydrogen storage.
Access to large-scale hydrogen storage, such as salt caverns, will be important. London and Edinburgh have limited opportunities for local storage and would therefore require hydrogen transmission pipelines
to be built either from production facilities closer to stores or direct to stores, such as offshore gas fields. Alternatively, if an international trade develops, then local hydrogen import terminals could be built, similar to the Grain LNG facility, with supply varying to meet demand. The costs and feasibility of any of these options would have to be balanced against alternative heat solutions, such as district heating and electrification.
Before any gas network can be converted an extensive public engagement programme is needed to understand any concerns, particularly about safety of piping hydrogen into homes, as well as how the conversion process will be undertaken. A detailed assessment will also be needed of the infrastructure required to produce and supply the hydrogen, including CCS and hydrogen storage.
112 ERP 2015a113 ETI 2015
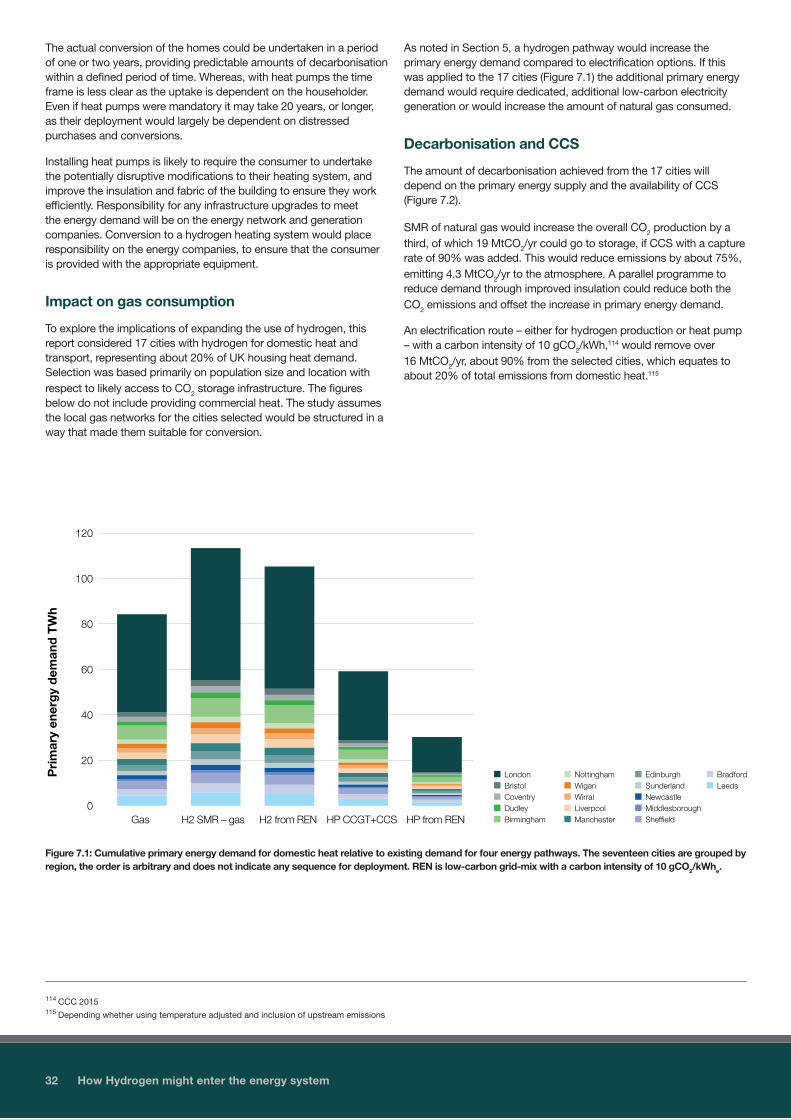
32 How Hydrogen might enter the energy system
The actual conversion of the homes could be undertaken in a period of one or two years, providing predictable amounts of decarbonisation within a defined period of time. Whereas, with heat pumps the time frame is less clear as the uptake is dependent on the householder. Even if heat pumps were mandatory it may take 20 years, or longer, as their deployment would largely be dependent on distressed purchases and conversions.
Installing heat pumps is likely to require the consumer to undertake the potentially disruptive modifications to their heating system, and improve the insulation and fabric of the building to ensure they work efficiently. Responsibility for any infrastructure upgrades to meet the energy demand will be on the energy network and generation companies. Conversion to a hydrogen heating system would place responsibility on the energy companies, to ensure that the consumer is provided with the appropriate equipment.
Impact on gas consumption
To explore the implications of expanding the use of hydrogen, this report considered 17 cities with hydrogen for domestic heat and transport, representing about 20% of UK housing heat demand. Selection was based primarily on population size and location with respect to likely access to CO2 storage infrastructure. The figures below do not include providing commercial heat. The study assumes the local gas networks for the cities selected would be structured in a way that made them suitable for conversion.
As noted in Section 5, a hydrogen pathway would increase the primary energy demand compared to electrification options. If this was applied to the 17 cities (Figure 7.1) the additional primary energy demand would require dedicated, additional low-carbon electricity generation or would increase the amount of natural gas consumed.
Decarbonisation and CCS
The amount of decarbonisation achieved from the 17 cities will depend on the primary energy supply and the availability of CCS (Figure 7.2).
SMR of natural gas would increase the overall CO2 production by a third, of which 19 MtCO2/yr could go to storage, if CCS with a capture rate of 90% was added. This would reduce emissions by about 75%, emitting 4.3 MtCO2/yr to the atmosphere. A parallel programme to reduce demand through improved insulation could reduce both the CO2 emissions and offset the increase in primary energy demand.
An electrification route – either for hydrogen production or heat pump – with a carbon intensity of 10 gCO2/kWh,114 would remove over 16 MtCO2/yr, about 90% from the selected cities, which equates to about 20% of total emissions from domestic heat.115
114 CCC 2015115 Depending whether using temperature adjusted and inclusion of upstream emissions
0
20
40
60
80
100
120
Gas H2 SMR – gas H2 from REN HP CCGT+CCS HP from REN
Pri
mar
y en
erg
y d
eman
d T
Wh
Cummulative primary energy demand for heat supply from major cities
London Bristol Coventry Dudley Birmingham
Nottingham Wigan Wirral Liverpool Manchester
Edinburgh Sunderland Newcastle Middlesborough Sheffield
Bradford Leeds
Figure 7.1: Cumulative primary energy demand for domestic heat relative to existing demand for four energy pathways. The seventeen cities are grouped by region, the order is arbitrary and does not indicate any sequence for deployment. REN is low-carbon grid-mix with a carbon intensity of 10 gCO2/kWhe.
0
20
40
60
80
100
120
Gas H2 SMR – gas H2 from REN HP CCGT+CCS HP from REN
Pri
mar
y en
erg
y d
eman
d T
Wh
Cummulative primary energy demand for heat supply from major cities
London Bristol Coventry Dudley Birmingham
Nottingham Wigan Wirral Liverpool Manchester
Edinburgh Sunderland Newcastle Middlesborough Sheffield
Bradford Leeds

How Hydrogen might enter the energy system 33
The volumes of CO2 from SMRs could help the development of CCS, leveraging other emitters to develop a sufficient supply. Proposals by the Teesside Collective116 suggest hydrogen production could act as an anchor project, tying in other smaller industrial emitters.
Leeds H21 calculate total CO2 going to storage of 1.4 MtCO2/yr and assume a day one cost of £40/tonne. ETI analysis suggest a supply of about 3-5 MtCO2/yr is required to provide cost effective disposal of between £11 and £17/tonne.117 This would add about £0.0025–£0.004 /kWh to the cost of hydrogen supplied, which for an average house would equate to about £40-£60/house/yr.
Based on calculations for this report, enlarging the network to neighbouring populations, such as Bradford, Sheffield and Nottingham would raise it to 2.8 MtCO2/yr; adding a hydrogen supply for all the passenger cars in the cities would increase supply by about 1 MtCO2/yr.
The Leeds H21 project indicates that it could be operational between 2025 and 2030. Expansion to other metropolitan areas, would require similar technical assessments and public engagement, but could be accelerated by learning from the first city conversion. Alternatively, investment may wait to see the outcomes of the first project, which would delay subsequent projects until mid-2030s. The price control periods for the gas network companies may also delay developments from starting.
CO2 toStorage;19 Mt
CO2 toStorage;10 Mt
0
2
4
6
8
10
12
14
16
18
20
22
24
26
Gas H2 SMR+CCS
Residual CO2 H2 from REN HP CCGT+CCS
Residual CO2 HP-REN
Mill
ions
to
nnes
CO
2
Cummulative CO2 production for heat supply from major cities by fuel
CO2 to Storage London Bristol Coventry Dudley Birmingham
Nottingham
Wigan
Wirral Liverpool Manchester Edinburgh Sunderland
Newcastle
Middlesborough
Sheffield
Bradford
Leeds
Figure 7.2: Cumulative total of CO2 emitted from heat provision to seventeen major metropolitan areas, via different energy pathways. Residual CO2 is the amount emitted to the atmosphere from 90% CCS capture and upstream extraction emissions. No demand reduction from insulation is assumed and based on 2016 housing numbers. Quantities would increase if transport and local industrial emissions were included.
116 Teesside Collective 2015117 ETI 2016
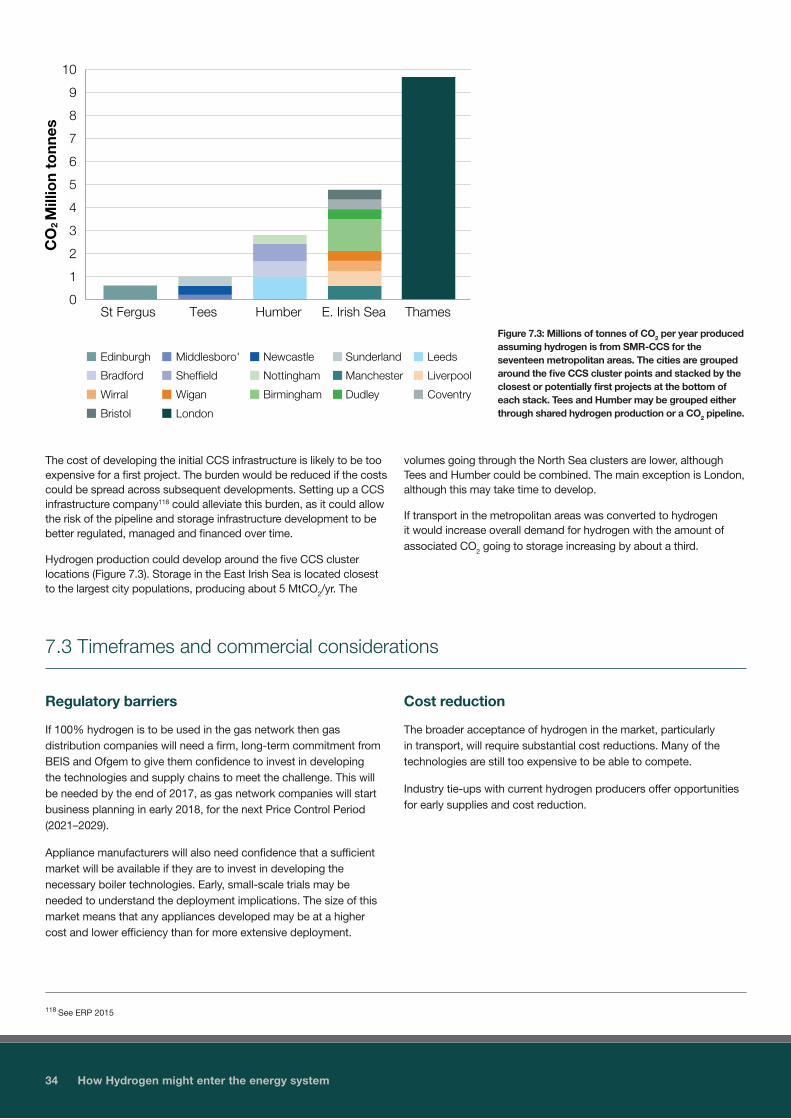
34 How Hydrogen might enter the energy system
0
1
2
3
4
5
6
7
8
9
10
St Fergus Tees Humber E. Irish Sea Thames
CO
2 M
illio
n to
nnes
CO2 from hydrogen for heat through each cluster by city
Edinburgh Middlesboro' Newcastle Sunderland Leeds
Bradford Sheffield Nottingham Manchester Liverpool
Wirral Wigan Birmingham Dudley Coventry
Bristol London
Figure 7.3: Millions of tonnes of CO2 per year produced assuming hydrogen is from SMR-CCS for the seventeen metropolitan areas. The cities are grouped around the five CCS cluster points and stacked by the closest or potentially first projects at the bottom of each stack. Tees and Humber may be grouped either through shared hydrogen production or a CO2 pipeline.
The cost of developing the initial CCS infrastructure is likely to be too expensive for a first project. The burden would be reduced if the costs could be spread across subsequent developments. Setting up a CCS infrastructure company118 could alleviate this burden, as it could allow the risk of the pipeline and storage infrastructure development to be better regulated, managed and financed over time.
Hydrogen production could develop around the five CCS cluster locations (Figure 7.3). Storage in the East Irish Sea is located closest to the largest city populations, producing about 5 MtCO2/yr. The
volumes going through the North Sea clusters are lower, although Tees and Humber could be combined. The main exception is London, although this may take time to develop.
If transport in the metropolitan areas was converted to hydrogen it would increase overall demand for hydrogen with the amount of associated CO2 going to storage increasing by about a third.
118 See ERP 2015
7.3 Timeframes and commercial considerations
Regulatory barriers
If 100% hydrogen is to be used in the gas network then gas distribution companies will need a firm, long-term commitment from BEIS and Ofgem to give them confidence to invest in developing the technologies and supply chains to meet the challenge. This will be needed by the end of 2017, as gas network companies will start business planning in early 2018, for the next Price Control Period (2021–2029).
Appliance manufacturers will also need confidence that a sufficient market will be available if they are to invest in developing the necessary boiler technologies. Early, small-scale trials may be needed to understand the deployment implications. The size of this market means that any appliances developed may be at a higher cost and lower efficiency than for more extensive deployment.
Cost reduction
The broader acceptance of hydrogen in the market, particularly in transport, will require substantial cost reductions. Many of the technologies are still too expensive to be able to compete.
Industry tie-ups with current hydrogen producers offer opportunities for early supplies and cost reduction.

UK Capability 35
8 UK capability«
The UK has some significant capabilities in fuel cell technologies, hydrogen systems and CCS, within its research community and industry, including successful university spin out companies. The UK is well placed for the growing global market for Proton Exchange Membrane (PEM) fuel cells market, with Johnson Matthey supplying a significant proportion of the PEM fuel cell membrane market.
However, the biggest market for UK companies and expertise is overseas where most of the technology integration is done. The research base could benefit from ensuring that it is able to address the needs of this wider industry, to help make the UK an attractive place for inward investment.
With global markets in hydrogen technologies growing, a strategic position is needed to capitalise on the new opportunities as they emerge. At present the UK is regarded as a fast follower, with valuable, but somewhat niche and fragmented capability. The UK has undertaken several EU funded FCH-JU projects with the then Technology Strategy Board (now Innovate UK). While useful, a coordinated approach is needed to capture the benefits and learning from these projects.
Technology development and innovation
In the short to medium term pilot projects and demonstrations are required focussed on understanding how the various markets for hydrogen will interact and the implications for scale up of the technology. Pilot and demonstration projects are needed to understand how hydrogen systems will work, that will test a range of applications and develop an evidence base for their further expansion. Projects should also seek to utilise existing facilities so as to avoid redundancy.
Support is needed for the current market entrants that will help scale up production and bring down costs. Where fuel cells and hydrogen technologies are entering the market there is a need to ensure that they are being incentivised. Significant cost reductions can be made from scaling up production that will have benefits for broader fuel cell development.
Coordination is also needed of the R&D and innovation chain to ensure effort is aligned towards the current challenges in the technology. While developing technologies that will be valuable in the future is likely to be of value, much can be gained from ensuring that the outcomes of demonstration and pilot projects are coordinated and acted upon and used to inform future programmes.
Integrated role in the energy system
Aside from the bulk production and use of hydrogen, for example for heat, hydrogen could play an integrated role in the energy system, with potentially valuable cross-sector opportunities. A strategic approach is needed that includes the wider energy and industrial sectors so as to identify mutually beneficial opportunities to reduce costs and improve efficiencies through integration.
Addressing this requires developing a much better understanding of the role that hydrogen could play. This should include understanding how the technologies interact along with a vision of where the hydrogen will come from and the volumes needed. The recent road mapping exercise undertaken by Innovate UK will be important in developing the vision.
A strategy for hydrogen should also consider the industrial opportunities to support and develop its expertise and build on the progress made over the last two decades by previous R&D investments, particularly in fuel cells. Such an approach will also reduce the cycle of hype that has affected hydrogen and provide greater certainty to the market.
36 Conclusions
9 Conclusions«
Hydrogen has a range of potential uses across the energy system. Once produced, it can be applied to a range of different applications, including transport, energy storage, grid flexibility and industrial and domestic heat. Beyond the energy system hydrogen could also be used to provide a feedstock for the chemical industry beyond its current applications.
Hydrogen fuel cells are already being deployed commercially in some niche applications competing with incumbent technologies on service, price and with acceptable reliability. These are fuelled mainly by hydrogen from locally reformed natural gas. Increasing sales are helping to develop market volumes and bring down costs further.
In many applications hydrogen can offer similar services as other energy technologies and pathways, but they have widely differing impacts on how the energy system would develop. In some significant areas hydrogen systems can provide additional utility, such as energy storage and transport. While the main challenge is to make hydrogen options cost competitive, what is important is the need to understand how these additional utilities and its flexibility can be utilised in the wider energy system.
Hydrogen supply
The residual carbon emissions from CCS and from upstream fossil fuel extraction will need to be addressed if climate change targets are to be met. If a majority of the gas to produce hydrogen is imported it will reduce the impact on UK emissions and will mean that using hydrogen for heating could contribute to meeting 2050 targets.
As emission targets reduce to zero, in the decades after 2050, residual emissions from CCS in the UK will need to be addressed. Global efforts will need to continue to reduce emissions from fossil fuel extraction. The volumes of hydrogen produced from electrolysis is likely to be constrained by the amount of generating capacity that can be built.
Large-scale use of hydrogen, such as for heat and transport, will mean the UK is likely to continue to import natural gas until late into this century. Imports of zero-carbon hydrogen could replace supplies of natural gas. An assessment of the strategic impact on energy security would help identify any appropriate long-term measures.
An understanding is needed of the volume of hydrogen that are likely to be required and how the supply will be decarbonised. All sources should be considered including hydrogen from biological sources and waste. This needs to consider the overall environmental impact of the systems and the timeframe with which decarbonisation is required.
A strategic vision will provide guidance to the market and help provide longer term security for investment in hydrogen technologies and guidance for how the infrastructure could develop.
System level approach
Hydrogen has often been criticised for being an inefficient way of using energy, but a system approach should be taken, when comparing it with other options, that takes into account the flexibility of hydrogen and how it can supply multiple markets. Hydrogen should therefore be evaluated on the cost effectiveness of the overall system and its potential environmental impacts, primarily carbon reduction. Efficiency is important but primarily to reduce system costs and improve its carbon effectiveness.
A better understanding of the commercial and investment implications for deploying hydrogen and adopting an integrated systems approach. For transport deploying the supply infrastructure ahead of market demand carries significant risks. For heat the practicalities of deploying hydrogen could offer a lower risk pathway, outweighing any additional costs of an end-use conversion programme, compared to an electrification pathway.
A joined up approach is required that can identify the opportunities to integrate hydrogen production with the various uses. Hydrogen could deliver services to several aspects of the energy system, but significant efficiencies and cost savings could come from the integration of these various hydrogen sources and applications. Some options are being driven by the additional utility that hydrogen systems can offer. Understanding is needed of how they could integrate with other hydrogen options and their impact on the broader energy system.

Conclusions 37
If hydrogen is to contribute to decarbonisation of the energy system a number of challenges need to be addressed. The most significant of which are:
1. Business planning for the next price control period (2021-2029), will start in early 2018. Regulators will need to be able to give by gas distribution companies an indication as to whether hydrogen could be considered an acceptable route to decarbonise the gas system. Otherwise, projects will require special exceptions if they are to proceed before 2030.
2. A detailed understanding of future demand for hydrogen, in transport, heating and industry.
a. This analysis can be used to identify production requirements, CCS infrastructure development, hydrogen storage needs and transmission system.
b. Understanding the timeframes for delivery will be important.
3. Quantification of large-scale storage requirements, feasibility and costs, for heat provision (intra-day and seasonal stores) and grid management.
4. Understanding of the potential to import hydrogen and the infrastructure and location implications.
a. This includes understanding the development of zero-carbon hydrogen production and the timeframes by which it might become cost-effective.
5. Reducing the cost of fuel cell systems through R&D and the development of market volumes. Market entrants need support to scale up production and bring down costs.
a. Allowing up to 3% of hydrogen in the gas network is regarded as safe and would help enable development of systems that can utilise ‘surplus’ wind.
6. Reducing the cost of fuel cell systems, through R&D and market development.
7. Improving mobile storage could reduce costs and increase energy density of small units.
8. Analysis of how hydrogen could interact with various markets and the implications for scale up of the technology. Pilot and demonstration projects are needed to understand the interactions and test a range of applications.
a. Coordinate and focus R&D and innovation efforts on key challenges: outcomes of pilot and demonstration projects should be coordinated, to inform future programmes.
9. Engage with publics in order to understand and address concerns around acceptability that need to be addressed.
10. A robust safety system supported by meaningful regulation, which addresses the different characteristics of hydrogen.

38 References
References«ACEP 2012 Stranded Renewable Energy Resources of Alaska: A Preliminary Overview of Opportunities and Challenges to Development National Renewable Energy Laboratory and Alaska Center for Energy and Power
Argonne National Laboratory 2003 Hydrogen from steam-methane reforming with CO2 capture Molburg JC & Doctor RD "
Ballard 2015 http://ballard.com/about-ballard/newsroom/news-releases/news09251501.aspx
Bayham SC, Tong A, Kathe M, Fan L-S 2015 Chemical looping technology for energy and chemical production WIREs 5 Issue 2 March/April 2016 http://onlinelibrary.wiley.com/doi/10.1002/wene.173/full
BGS 2008 Mineral Planning Factsheet: Underground Storage for DCLG – BGS Joint Minerals Project
BGS 2011 Memorandum submitted to The UK's Energy Supply: Security or Independence? Inquiry HoC Energy & Climate Change Select Committee Oct 2011 http://www.publications.parliament.uk/pa/cm201012/cmselect/cmenergy/1065/1065vw11.htm
City Mayors http://www.citymayors.com/gratis/uk_topcities.html
CCC 2015 The Fifth Carbon Budget: The next step towards a low-carbon economy Committee on Climate Change November 2015
CEPA 2015 2015 Annual Evaluation of Fuel Cell Electric Vehicle deployment and hydrogen fuel station network development. California Environmental Protection Agency, Air Resources Board
CFCP 2014 A California Roadmap: The Commercialization of Hydrogen Fuel Cell Vehicles California Fuel Cell Partnership July 2014
Crowther ME 2011 Hydrogen for grid-2-gas load balancing in future energy systems Presentation by Gastec at CRE Ltd 15 September 2011
Crowther M E 2011b Load balancing in future energy systems, GASTEC at CRE Ltd
DECC 2013a Future of heating: Meeting the challenge March 2013 URN 13D/033
DECC 2013b Future of heating: Meeting the challenge – supporting data spreadsheets
DECC 2015a Historical gas data: gas production and consumption 1882 to 2014 www.gov.uk/government/statistical-data-sets/historical-gas-data-gas-production-and-consumption-and-fuel-input-1882-to-2011
DECC 2015b HyHouse: Safety Issues Surrounding Hydrogen as an Energy Storage Vector Energy Storage Component Research & Feasibility, prepared by Kiwa Gastec for DECC June 2015
Deign J 2013 http://social.csptoday.com/technology/using-csp-make-hydrogen
Dodds 2012 Review of Hydrogen Production Methods SHEC WP6
Dodds P 2016 Development of a Green Hydrogen Standard for the UK Paul Dodds & Anthony Velaquez Presentation to All-Energy Conference 4 May 2016
DoE 2009 Energy requirements for hydrogen gas compression and liquefaction as related to vehicle storage needs DoE Hydrogen and Fuel Cells Program Record #9013 July 2009
Drax 2013 Annual Review of Environmental performance
DUKES 2016 Natural gas: Chapter 4, Digest of United Kingdom Energy Statistics Department for Business, Energy & Industrial Strategy
Element Energy, E4Tech, Pure 2006 Hydrogen Refuelling & Storage Infrastructure Information Resource for Highlands and Islands Enterprise
Element Energy 2013 Pathways to high penetration of electric vehicles Report for Committee on Climate Change
E4Tech 2004 A Strategic framework for hydrogen energy in the UK December 2004
E4Tech 2015a Scenarios for deployment of hydrogen in contributing to meeting carbon budgets and the 2050 target E4tech, UCL Energy Institute, University College London, Kiwa Gastec, for Committee on Climate Change October 2015
E4Tech 2015b The Fuel Cell Industry Review 2015 November 2015
Ekins P 2010 Hydrogen Energy: Economic and Social Challenges Edited by Paul Ekins"
ERP 2011 The future role for energy storage in the UK June 2011
ERP 2015a Managing Flexibility whilst Decarbonising the GB Electricity System
ERP 2015b Prospects for C-EOR in the UKCS Energy Research Partnership October 2015
ERP 2016 Energy options for transport: Deployment and implications Energy Research Partnership April 2016
ETI 2015 Hydrogen: The role of hydrogen storage in a clean responsive power system Energy Technology Institute Insight Report
ETI 2016 Progressing Development of the UK’s Strategic Carbon Dioxide Storage Resource Pale Blue Dot, Axis Well Technology, Costain for Energy Technologies Institute April 2016
Eyre N & Baruah P 2015 Uncertainties in future energy demand in UK residential heating Energy Policy 87 641-653
Ford R 2014 Wind-Hydrogen Systems in Scotland Masters Dissertation, University of Reading, unpublished
GA 2003 High Efficiency Generation of Hydrogen Fuels Using Nuclear Power: Final Technical Report General Atomics Dec 2003 GA-A24285
Green R, Hu H, Vasilakos N 2010 Turning the wind into hydrogen: The long-run impact on electricity prices and generating capacity Dept of Economics, University of Birmingham

H21 2016 Leeds City Gate Northern Gas Networks, Wales & West Utilities, Kiwa and Amec Foster Wheeler July 2016
HSE 2014 Major Hazard Safety Performance Indicators in Great Britain’s Onshore Gas and Pipelines Industry, Annual Report 2013/14 HSE, Hazardous Installations Directorate Gas & Pipelines Unit
HSE 2015 Injecting hydrogen into the gas network – a literature search Prepared by the Health and Safety Laboratory for the Health and Safety Executive
HySafe BRHS 2005 BRHS_Status_17_08_05
HyUnder 2013 Overview on all Known Underground Storage Technologies for Hydrogen Grant agreement 303417, Deliverable No. 3.1 European Commission, New Energy World JU
ICEPT 2016 Managing Heat System Decarbonisation: Comparing the impacts and costs of transitions in heat infrastructure MacLean K, Sansom R, Watson T, Gross R Imperial College Centre for Energy Policy and Technology
IEA 2007 Energy Technology Essentials ETE 05
IEA 2015 International status of molten carbonate fuel cells technology Advanced Fuel Cells Implementing Agreement Annex 23 – MCFC
IEA GHG 2003 Reduction of CO2 emissions by adding hydrogen to natural gas Report Number PH4/24
IEA GHG 2015 Understanding the potential of CCS in Hydrogen production Presentation by Santos S to Joint IEA GHG & IETS workshop March 2015
ITM 2013 Power-To-Gas A UK Feasibility Study Funded by Technology Strategy Board
Jechura J 2015 Hydrogen from Natural Gas via Steam Methane Reforming (SMR) Colorado School of Mines Presentation January 4, 2015
JRC 2011 Future Automotive Fuels and Powertrains in the European Context JRC, EUCAR, Concawe 2011
Lemus RG, Duart LMM 2010, Updated hydrogen production costs and parities for conventional and renewable technologies International Journal of Hydrogen Energy 35 (2010) 3929–3936
Lorentzou S 2014 Hydrosol technology evolution: past and present presentation to Hannover Messe 7-11 April 2014
LowCVP, Element Energy 2015 Transport Energy Infrastructure Roadmap to 2050: Hydrogen Roadmap Low Carbon Vehicle Partnership June 2015
Luo X, Jihong W, Dooner M, Clarke J 2015 Overview of current development in electrical energy storage technologies and the application potential in power system operation Applied Energy 137 (2015) 511-536
McKinsey 2008 Powertrains for Europe Element Energy
Muhich CL et al 2015 A review and perspective of efficient hydrogen generation via solar thermal water splitting WIREs Energy Environ 2015. Doi: 10.1002/wene.174
National Grid 2016a The future of gas: supply of renewable gas February 2016
National Grid 2016b Annual Report and Accounts 2015/16
NREL 2014 Deutsch T Semiconductor Materials for Photoelectrolysis Project ID: PD035
OGA 2016 Oil and Gas Production Projections UK Oil and Gas Authority February 2016
Ozarslan A 2012 Large-scale hydrogen energy storage in salt caverns Int’l Journal of Hydrogen Energy 37 (2012) 14265-14277
Parsons Brinckerhoff (2009) Powering the Future: Mapping our low-carbon path to 2050 December 2009
Parsons Brinckerhoff (2013) Electricity Generation Cost Model – 2013 Update of Non-Renewable Technologies Prepared for DECC April 2013 3512649A
Quantum Technology 2004 High Pressure Hydrogen Storage Systems Hydrogen and Fuel Cell Summit VIII June 2004
Roads2HyCom 2009 Fuel Cells and Hydrogen in a Sustainable Energy Economy Final Report of the ROADS2HYCOM PROJECT April 2009
Ricardo-AEA, 2013 An Economic Assessment of Low Carbon Vehicles
Sansom 2014 Decarbonising low grade heat for a low carbon future PhD Thesis, Imperial College October 2014
Sansom R & Strbac G 2012 The impact of future heat demand pathways on the economics of low carbon heating systems BIEE 9th Academic Conference 2012, Oxford
Saur G, Ramsden T 2011 Wind Electrolysis: Hydrogen Cost Optimization NREL TP-5600-50408 May 2011
Staffell I 2011 The Energy and Fuel Data Sheet March 2011 Revision 1 W1P1 http://www.academia.edu/1073990/The_Energy_and_Fuel_Data_Sheet
Stone, Velhuis, Richardson 2009 Underground Hydrogen Storage in the UK Geological Society of London
Takizawa K (2006) Molten Carbonate Fuel Cells Energy Carriers and Conversion Systems Vol 2. Kouichi Takizwaw, Tokyo Electric Power Company, Japan
Teesside Collective 2015 Blueprint for industrial CCS in the UK July 2015
UCL, 2013 A portfolio of powertrains for the UK: An energy systems analysis
UKH2Mobility 2013 Phase 1 Results April 2013
US DoE 2015 http://energy.gov/fe/articles/doe-selects-eight-projects-receive-funding-reducing-cost-c-capture-and-compression
Waller MG, Williams ED, Matteson SW, Trabold TA 2014 Current and theoretical maximum well-to-wheels exergy efficiency of options to power vehicles with natural gas Applied Energy 127 55-63
Wilson G et al 2013 Historical daily gas and electrical energy flows through Great Britain’s transmission networks and the decarbonisation of domestic heat. Energy Policy 61 pp301-305
References 39

ENERGY RESEARCH PARTNERSHIP
11 PRINCES’ GARDENS, LONDON SW7 1NA www.erpuk.org