Embed Size (px)
Citation preview
Aon Benfield Analytics | Impact Forecasting
Global Catastrophe Recap October 2015
Risk. Reinsurance. Human Resources.
Aon Benfield Analytics | Impact Forecasting
Table of Contents Executive Summary 3
United States 4
Remainder of North America 5
South America 6
Europe 6
Africa 6
Asia 7
Oceania 8
Appendix 9
Contact Information 16
Global Catastrophe Recap: October 2015 2
Aon Benfield Analytics | Impact Forecasting
Executive Summary Hurricane Patricia highlights active October for global tropical cyclone activity
Historic flooding inundates U.S. state of South Carolina; economic cost expected to top USD2.0 billion
Magnitude-7.5 earthquake leaves hundreds dead in Afghanistan and Pakistan
Major Hurricane Patricia became the strongest tropical cyclone ever recorded in the Western Hemisphere when its maximum sustained wind speeds reached 200 mph (325 kph) and its central pressure plummeted to 879 millibars. The storm eventually made landfall as a 165-mph (265-kph) Category 5 hurricane near Cuixmala, Mexico. At least 14 fatalities were attributed to the storm, though the level of devastation could have been substantially worse had the storm tracked even slightly to the north or south. Preliminary economic damage was estimated at USD300 million, though this figure is subject to change. Given low insurance penetration in the hardest-hit areas, insured losses were expected to be negligible.
Typhoon Mujigae became the costliest tropical cyclone of 2015 after making separate landfalls in China and the Philippines. At least 22 people were killed. Damage was extensive in China’s Hainan and Guangdong provinces as the government listed economic losses at CNY26.6 billion (USD4.2 billion).
Super Typhoon Koppu made landfall in the Philippines as a strong category 4 typhoon, killing at least 62 people and injuring 83 others. Nearly 150,000 homes were damaged or destroyed. Economic damage to agriculture and infrastructure alone was listed at PHP14 billion (USD306 million).
Major Hurricane Joaquin lashed the Bahamas before tracking past Bermuda. Severe damage was reported in several sparsely populated Bahamian islands. Total economic losses were estimated around USD100 million; while the insurance industry did not expect insured losses to exceed USD50 million.
Days of relentless record-setting rainfall caused by a complex atmospheric set-up brought tremendous flooding across the U.S. state of South Carolina, killing at least 19 people. The event left considerable inundation damage to residential and commercial properties, vehicles, and infrastructure following the more than two feet (610 millimeters) of rain that fell. Total economic losses were expected to minimally be USD2.0 billion. Insurers preliminarily reported roughly USD350 million in claims. Additional insured losses via NFIP and the USDA RMA crop insurance program were expected to be at least USD100 million.
Severe thunderstorms in the French Riviera impacted areas from Monaco to Fréjus, prompting massive flash flooding. At least 19 people were killed after several rivers and streams overflowed their banks. The French insurance industry expected payouts to reach up to EUR650 million (USD720 million) from 60,000 claims. Total economic losses were expected to exceed USD1.0 billion.
Major flooding was also recorded elsewhere in the U.S., Brazil, Guatemala, Italy, Algeria and Myanmar.
A major magnitude-7.5 earthquake struck northern Afghanistan on October 26, shaking a large swath of the country as well as portions of Tajikistan, Pakistan, and India. At least 403 people were confirmed dead and thousands of others were injured. Nearly 80,000 homes and structures were damaged or destroyed in Pakistan, with up to 16,000 impacted in Afghanistan.
Severe weather left damage resulting from tornadoes, hail and damaging straight-line winds during the month in parts of the U.S., Canada, China, and Australia.
Drought conditions worsened in Papua New Guinea as El Niño impacts intensified globally.
Global Catastrophe Recap: October 2015 3
Aon Benfield Analytics | Impact Forecasting
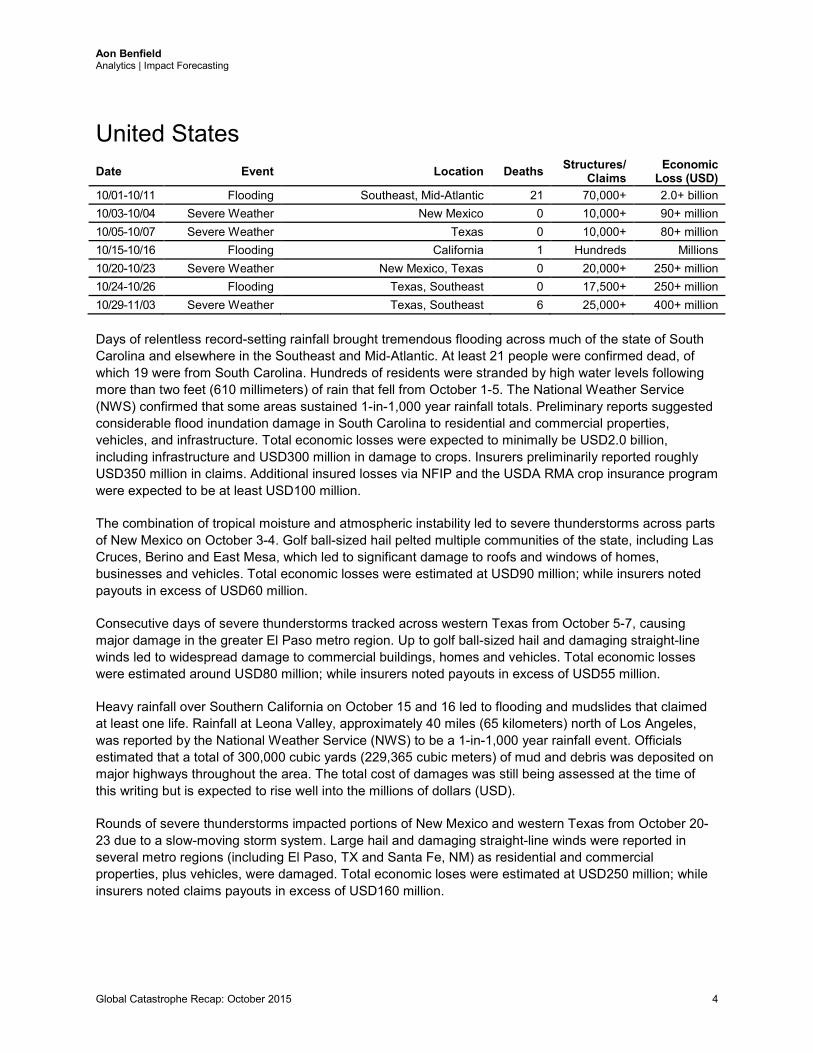
United States Date Event Location Deaths Structures/
Claims Economic
Loss (USD) 10/01-10/11 Flooding Southeast, Mid-Atlantic 21 70,000+ 2.0+ billion 10/03-10/04 Severe Weather New Mexico 0 10,000+ 90+ million 10/05-10/07 Severe Weather Texas 0 10,000+ 80+ million 10/15-10/16 Flooding California 1 Hundreds Millions 10/20-10/23 Severe Weather New Mexico, Texas 0 20,000+ 250+ million 10/24-10/26 Flooding Texas, Southeast 0 17,500+ 250+ million 10/29-11/03 Severe Weather Texas, Southeast 6 25,000+ 400+ million Days of relentless record-setting rainfall brought tremendous flooding across much of the state of South Carolina and elsewhere in the Southeast and Mid-Atlantic. At least 21 people were confirmed dead, of which 19 were from South Carolina. Hundreds of residents were stranded by high water levels following more than two feet (610 millimeters) of rain that fell from October 1-5. The National Weather Service (NWS) confirmed that some areas sustained 1-in-1,000 year rainfall totals. Preliminary reports suggested considerable flood inundation damage in South Carolina to residential and commercial properties, vehicles, and infrastructure. Total economic losses were expected to minimally be USD2.0 billion, including infrastructure and USD300 million in damage to crops. Insurers preliminarily reported roughly USD350 million in claims. Additional insured losses via NFIP and the USDA RMA crop insurance program were expected to be at least USD100 million.
The combination of tropical moisture and atmospheric instability led to severe thunderstorms across parts of New Mexico on October 3-4. Golf ball-sized hail pelted multiple communities of the state, including Las Cruces, Berino and East Mesa, which led to significant damage to roofs and windows of homes, businesses and vehicles. Total economic losses were estimated at USD90 million; while insurers noted payouts in excess of USD60 million.
Consecutive days of severe thunderstorms tracked across western Texas from October 5-7, causing major damage in the greater El Paso metro region. Up to golf ball-sized hail and damaging straight-line winds led to widespread damage to commercial buildings, homes and vehicles. Total economic losses were estimated around USD80 million; while insurers noted payouts in excess of USD55 million.
Heavy rainfall over Southern California on October 15 and 16 led to flooding and mudslides that claimed at least one life. Rainfall at Leona Valley, approximately 40 miles (65 kilometers) north of Los Angeles, was reported by the National Weather Service (NWS) to be a 1-in-1,000 year rainfall event. Officials estimated that a total of 300,000 cubic yards (229,365 cubic meters) of mud and debris was deposited on major highways throughout the area. The total cost of damages was still being assessed at the time of this writing but is expected to rise well into the millions of dollars (USD).
Rounds of severe thunderstorms impacted portions of New Mexico and western Texas from October 20-23 due to a slow-moving storm system. Large hail and damaging straight-line winds were reported in several metro regions (including El Paso, TX and Santa Fe, NM) as residential and commercial properties, plus vehicles, were damaged. Total economic loses were estimated at USD250 million; while insurers noted claims payouts in excess of USD160 million.
Global Catastrophe Recap: October 2015 4
Aon Benfield Analytics | Impact Forecasting
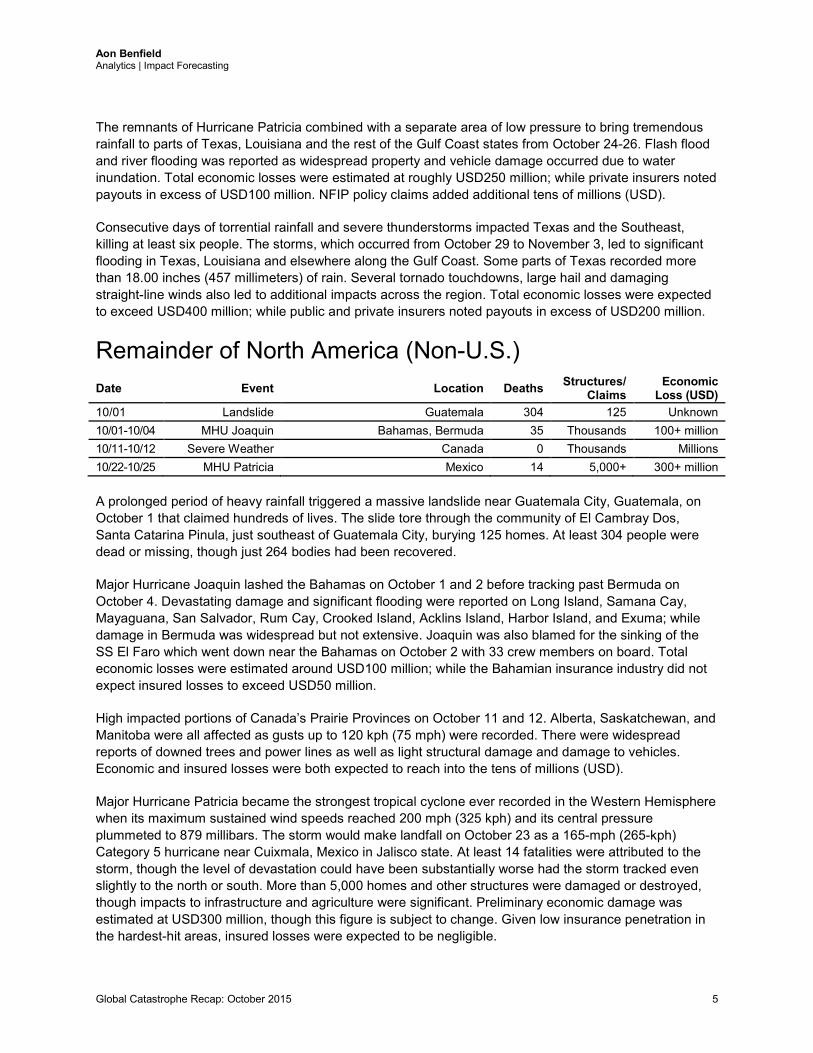
The remnants of Hurricane Patricia combined with a separate area of low pressure to bring tremendous rainfall to parts of Texas, Louisiana and the rest of the Gulf Coast states from October 24-26. Flash flood and river flooding was reported as widespread property and vehicle damage occurred due to water inundation. Total economic losses were estimated at roughly USD250 million; while private insurers noted payouts in excess of USD100 million. NFIP policy claims added additional tens of millions (USD).
Consecutive days of torrential rainfall and severe thunderstorms impacted Texas and the Southeast, killing at least six people. The storms, which occurred from October 29 to November 3, led to significant flooding in Texas, Louisiana and elsewhere along the Gulf Coast. Some parts of Texas recorded more than 18.00 inches (457 millimeters) of rain. Several tornado touchdowns, large hail and damaging straight-line winds also led to additional impacts across the region. Total economic losses were expected to exceed USD400 million; while public and private insurers noted payouts in excess of USD200 million.
Remainder of North America (Non-U.S.) Date Event Location Deaths Structures/
Claims Economic
Loss (USD) 10/01 Landslide Guatemala 304 125 Unknown 10/01-10/04 MHU Joaquin Bahamas, Bermuda 35 Thousands 100+ million 10/11-10/12 Severe Weather Canada 0 Thousands Millions 10/22-10/25 MHU Patricia Mexico 14 5,000+ 300+ million A prolonged period of heavy rainfall triggered a massive landslide near Guatemala City, Guatemala, on October 1 that claimed hundreds of lives. The slide tore through the community of El Cambray Dos, Santa Catarina Pinula, just southeast of Guatemala City, burying 125 homes. At least 304 people were dead or missing, though just 264 bodies had been recovered.
Major Hurricane Joaquin lashed the Bahamas on October 1 and 2 before tracking past Bermuda on October 4. Devastating damage and significant flooding were reported on Long Island, Samana Cay, Mayaguana, San Salvador, Rum Cay, Crooked Island, Acklins Island, Harbor Island, and Exuma; while damage in Bermuda was widespread but not extensive. Joaquin was also blamed for the sinking of the SS El Faro which went down near the Bahamas on October 2 with 33 crew members on board. Total economic losses were estimated around USD100 million; while the Bahamian insurance industry did not expect insured losses to exceed USD50 million.
High impacted portions of Canada’s Prairie Provinces on October 11 and 12. Alberta, Saskatchewan, and Manitoba were all affected as gusts up to 120 kph (75 mph) were recorded. There were widespread reports of downed trees and power lines as well as light structural damage and damage to vehicles. Economic and insured losses were both expected to reach into the tens of millions (USD).
Major Hurricane Patricia became the strongest tropical cyclone ever recorded in the Western Hemisphere when its maximum sustained wind speeds reached 200 mph (325 kph) and its central pressure plummeted to 879 millibars. The storm would make landfall on October 23 as a 165-mph (265-kph) Category 5 hurricane near Cuixmala, Mexico in Jalisco state. At least 14 fatalities were attributed to the storm, though the level of devastation could have been substantially worse had the storm tracked even slightly to the north or south. More than 5,000 homes and other structures were damaged or destroyed, though impacts to infrastructure and agriculture were significant. Preliminary economic damage was estimated at USD300 million, though this figure is subject to change. Given low insurance penetration in the hardest-hit areas, insured losses were expected to be negligible.
Global Catastrophe Recap: October 2015 5
Aon Benfield Analytics | Impact Forecasting
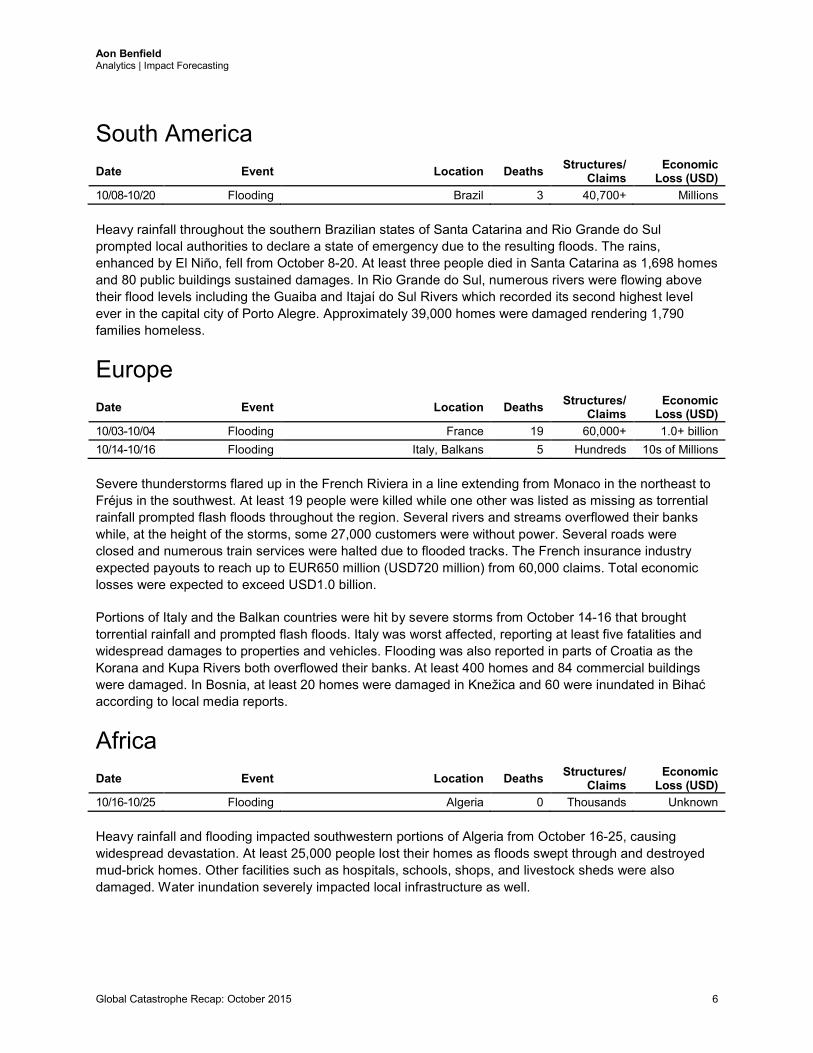
South America
Date Event Location Deaths Structures/ Claims
Economic Loss (USD)
10/08-10/20 Flooding Brazil 3 40,700+ Millions Heavy rainfall throughout the southern Brazilian states of Santa Catarina and Rio Grande do Sul prompted local authorities to declare a state of emergency due to the resulting floods. The rains, enhanced by El Niño, fell from October 8-20. At least three people died in Santa Catarina as 1,698 homes and 80 public buildings sustained damages. In Rio Grande do Sul, numerous rivers were flowing above their flood levels including the Guaiba and Itajaí do Sul Rivers which recorded its second highest level ever in the capital city of Porto Alegre. Approximately 39,000 homes were damaged rendering 1,790 families homeless.
Europe Date Event Location Deaths Structures/
Claims Economic
Loss (USD) 10/03-10/04 Flooding France 19 60,000+ 1.0+ billion 10/14-10/16 Flooding Italy, Balkans 5 Hundreds 10s of Millions Severe thunderstorms flared up in the French Riviera in a line extending from Monaco in the northeast to Fréjus in the southwest. At least 19 people were killed while one other was listed as missing as torrential rainfall prompted flash floods throughout the region. Several rivers and streams overflowed their banks while, at the height of the storms, some 27,000 customers were without power. Several roads were closed and numerous train services were halted due to flooded tracks. The French insurance industry expected payouts to reach up to EUR650 million (USD720 million) from 60,000 claims. Total economic losses were expected to exceed USD1.0 billion.
Portions of Italy and the Balkan countries were hit by severe storms from October 14-16 that brought torrential rainfall and prompted flash floods. Italy was worst affected, reporting at least five fatalities and widespread damages to properties and vehicles. Flooding was also reported in parts of Croatia as the Korana and Kupa Rivers both overflowed their banks. At least 400 homes and 84 commercial buildings were damaged. In Bosnia, at least 20 homes were damaged in Knežica and 60 were inundated in Bihać according to local media reports.
Africa Date Event Location Deaths Structures/
Claims Economic
Loss (USD) 10/16-10/25 Flooding Algeria 0 Thousands Unknown Heavy rainfall and flooding impacted southwestern portions of Algeria from October 16-25, causing widespread devastation. At least 25,000 people lost their homes as floods swept through and destroyed mud-brick homes. Other facilities such as hospitals, schools, shops, and livestock sheds were also damaged. Water inundation severely impacted local infrastructure as well.
Global Catastrophe Recap: October 2015 6
Aon Benfield Analytics | Impact Forecasting
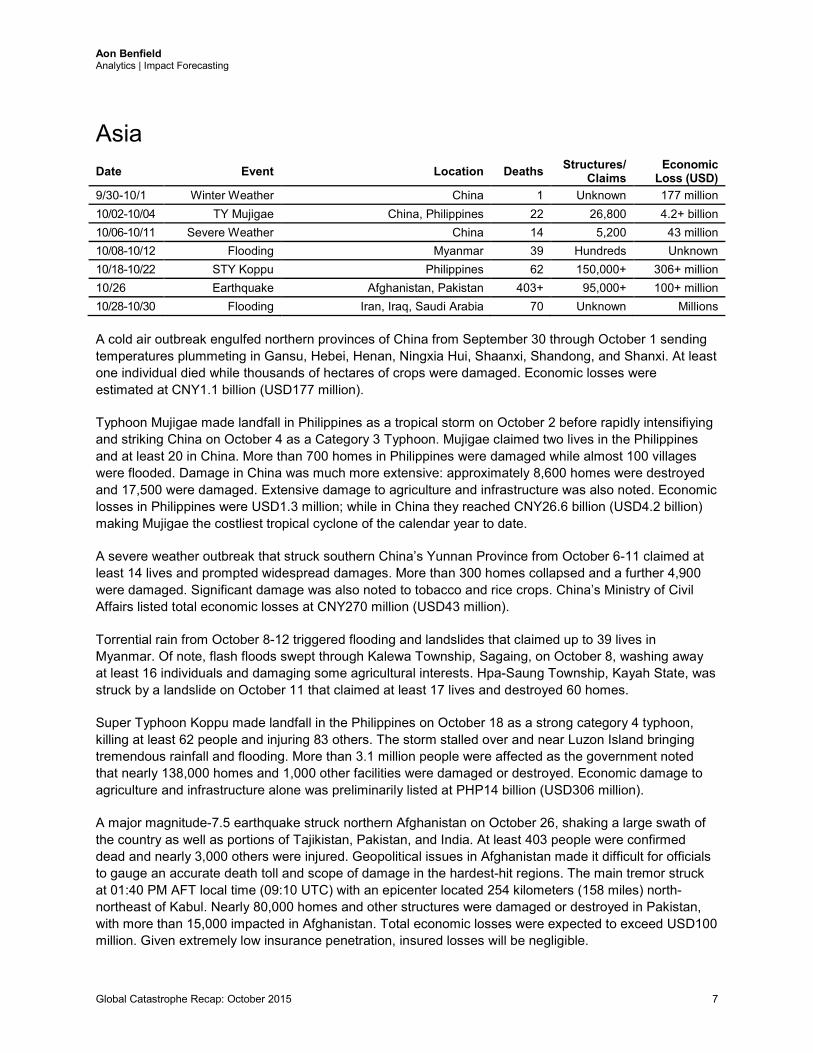
Asia Date Event Location Deaths Structures/
Claims Economic
Loss (USD) 9/30-10/1 Winter Weather China 1 Unknown 177 million 10/02-10/04 TY Mujigae China, Philippines 22 26,800 4.2+ billion 10/06-10/11 Severe Weather China 14 5,200 43 million 10/08-10/12 Flooding Myanmar 39 Hundreds Unknown 10/18-10/22 STY Koppu Philippines 62 150,000+ 306+ million 10/26 Earthquake Afghanistan, Pakistan 403+ 95,000+ 100+ million 10/28-10/30 Flooding Iran, Iraq, Saudi Arabia 70 Unknown Millions A cold air outbreak engulfed northern provinces of China from September 30 through October 1 sending temperatures plummeting in Gansu, Hebei, Henan, Ningxia Hui, Shaanxi, Shandong, and Shanxi. At least one individual died while thousands of hectares of crops were damaged. Economic losses were estimated at CNY1.1 billion (USD177 million).
Typhoon Mujigae made landfall in Philippines as a tropical storm on October 2 before rapidly intensifiying and striking China on October 4 as a Category 3 Typhoon. Mujigae claimed two lives in the Philippines and at least 20 in China. More than 700 homes in Philippines were damaged while almost 100 villages were flooded. Damage in China was much more extensive: approximately 8,600 homes were destroyed and 17,500 were damaged. Extensive damage to agriculture and infrastructure was also noted. Economic losses in Philippines were USD1.3 million; while in China they reached CNY26.6 billion (USD4.2 billion) making Mujigae the costliest tropical cyclone of the calendar year to date.
A severe weather outbreak that struck southern China’s Yunnan Province from October 6-11 claimed at least 14 lives and prompted widespread damages. More than 300 homes collapsed and a further 4,900 were damaged. Significant damage was also noted to tobacco and rice crops. China’s Ministry of Civil Affairs listed total economic losses at CNY270 million (USD43 million).
Torrential rain from October 8-12 triggered flooding and landslides that claimed up to 39 lives in Myanmar. Of note, flash floods swept through Kalewa Township, Sagaing, on October 8, washing away at least 16 individuals and damaging some agricultural interests. Hpa-Saung Township, Kayah State, was struck by a landslide on October 11 that claimed at least 17 lives and destroyed 60 homes.
Super Typhoon Koppu made landfall in the Philippines on October 18 as a strong category 4 typhoon, killing at least 62 people and injuring 83 others. The storm stalled over and near Luzon Island bringing tremendous rainfall and flooding. More than 3.1 million people were affected as the government noted that nearly 138,000 homes and 1,000 other facilities were damaged or destroyed. Economic damage to agriculture and infrastructure alone was preliminarily listed at PHP14 billion (USD306 million).
A major magnitude-7.5 earthquake struck northern Afghanistan on October 26, shaking a large swath of the country as well as portions of Tajikistan, Pakistan, and India. At least 403 people were confirmed dead and nearly 3,000 others were injured. Geopolitical issues in Afghanistan made it difficult for officials to gauge an accurate death toll and scope of damage in the hardest-hit regions. The main tremor struck at 01:40 PM AFT local time (09:10 UTC) with an epicenter located 254 kilometers (158 miles) north-northeast of Kabul. Nearly 80,000 homes and other structures were damaged or destroyed in Pakistan, with more than 15,000 impacted in Afghanistan. Total economic losses were expected to exceed USD100 million. Given extremely low insurance penetration, insured losses will be negligible.
Global Catastrophe Recap: October 2015 7
Aon Benfield Analytics | Impact Forecasting
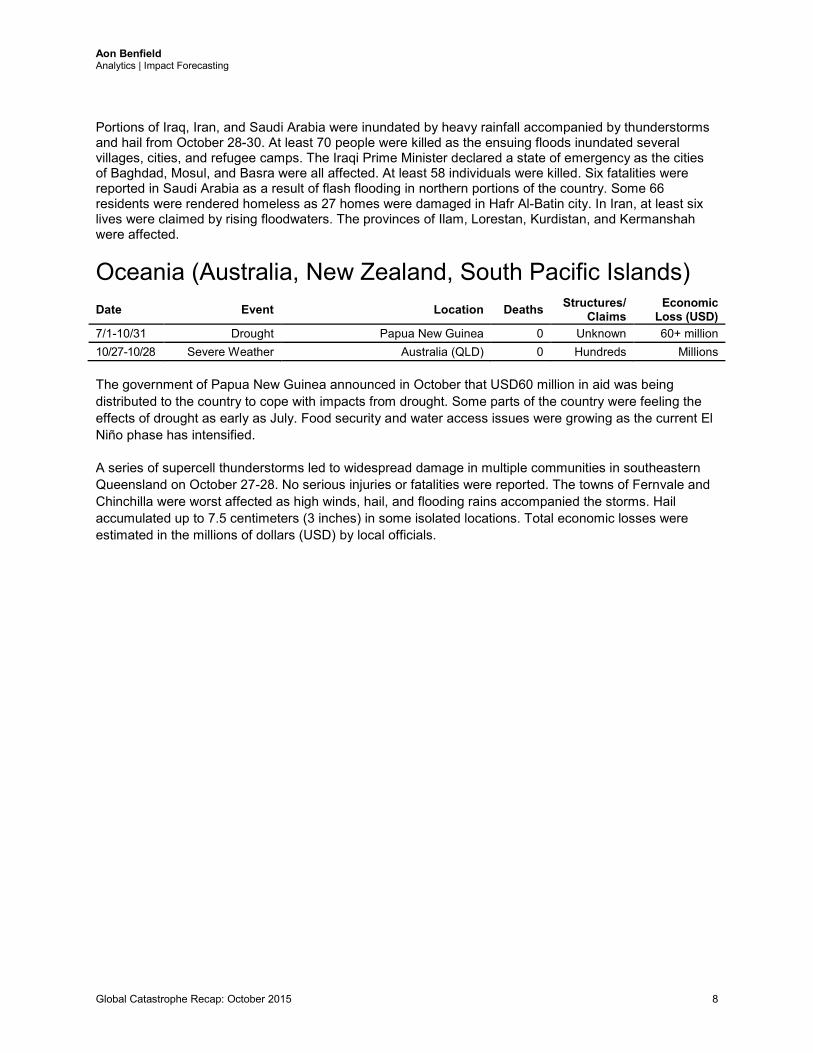
Portions of Iraq, Iran, and Saudi Arabia were inundated by heavy rainfall accompanied by thunderstorms and hail from October 28-30. At least 70 people were killed as the ensuing floods inundated several villages, cities, and refugee camps. The Iraqi Prime Minister declared a state of emergency as the cities of Baghdad, Mosul, and Basra were all affected. At least 58 individuals were killed. Six fatalities were reported in Saudi Arabia as a result of flash flooding in northern portions of the country. Some 66 residents were rendered homeless as 27 homes were damaged in Hafr Al-Batin city. In Iran, at least six lives were claimed by rising floodwaters. The provinces of Ilam, Lorestan, Kurdistan, and Kermanshah were affected.
Oceania (Australia, New Zealand, South Pacific Islands) Date Event Location Deaths Structures/
Claims Economic
Loss (USD) 7/1-10/31 Drought Papua New Guinea 0 Unknown 60+ million 10/27-10/28 Severe Weather Australia (QLD) 0 Hundreds Millions The government of Papua New Guinea announced in October that USD60 million in aid was being distributed to the country to cope with impacts from drought. Some parts of the country were feeling the effects of drought as early as July. Food security and water access issues were growing as the current El Niño phase has intensified.
A series of supercell thunderstorms led to widespread damage in multiple communities in southeastern Queensland on October 27-28. No serious injuries or fatalities were reported. The towns of Fernvale and Chinchilla were worst affected as high winds, hail, and flooding rains accompanied the storms. Hail accumulated up to 7.5 centimeters (3 inches) in some isolated locations. Total economic losses were estimated in the millions of dollars (USD) by local officials.
Global Catastrophe Recap: October 2015 8
Aon Benfield Analytics | Impact Forecasting
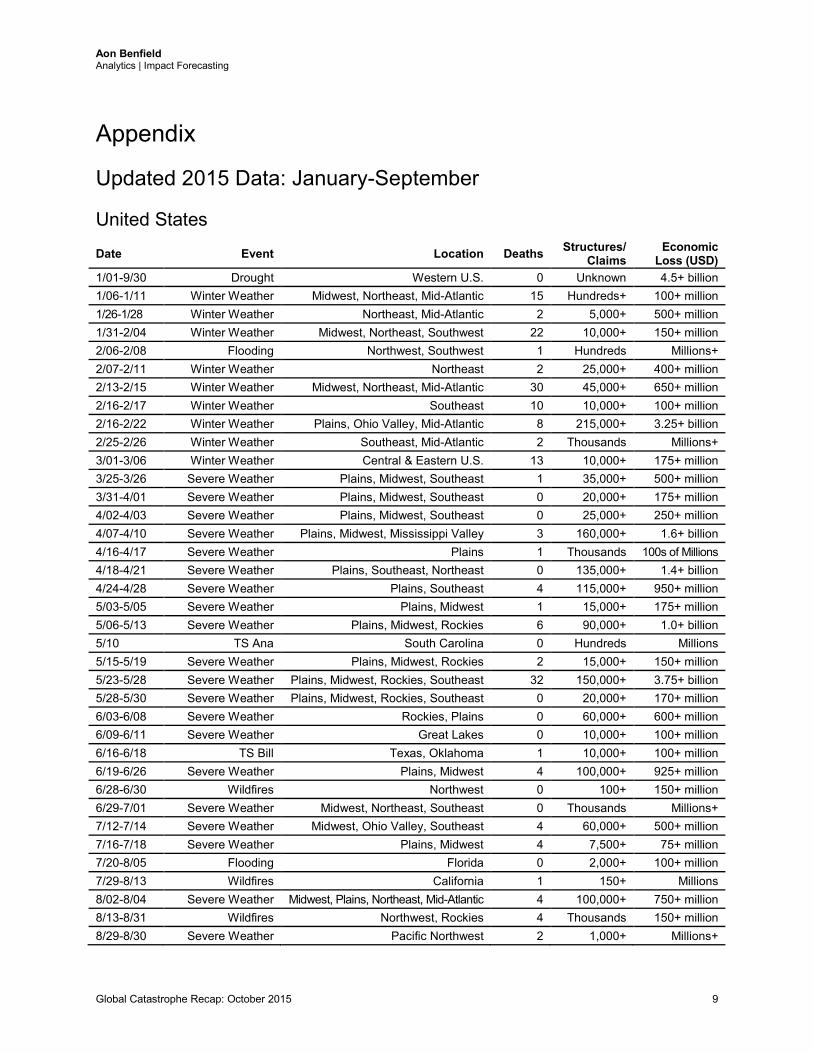
Appendix
Updated 2015 Data: January-September
United States
Date Event Location Deaths Structures/ Claims
Economic Loss (USD)
1/01-9/30 Drought Western U.S. 0 Unknown 4.5+ billion 1/06-1/11 Winter Weather Midwest, Northeast, Mid-Atlantic 15 Hundreds+ 100+ million 1/26-1/28 Winter Weather Northeast, Mid-Atlantic 2 5,000+ 500+ million 1/31-2/04 Winter Weather Midwest, Northeast, Southwest 22 10,000+ 150+ million 2/06-2/08 Flooding Northwest, Southwest 1 Hundreds Millions+ 2/07-2/11 Winter Weather Northeast 2 25,000+ 400+ million 2/13-2/15 Winter Weather Midwest, Northeast, Mid-Atlantic 30 45,000+ 650+ million 2/16-2/17 Winter Weather Southeast 10 10,000+ 100+ million 2/16-2/22 Winter Weather Plains, Ohio Valley, Mid-Atlantic 8 215,000+ 3.25+ billion 2/25-2/26 Winter Weather Southeast, Mid-Atlantic 2 Thousands Millions+ 3/01-3/06 Winter Weather Central & Eastern U.S. 13 10,000+ 175+ million 3/25-3/26 Severe Weather Plains, Midwest, Southeast 1 35,000+ 500+ million 3/31-4/01 Severe Weather Plains, Midwest, Southeast 0 20,000+ 175+ million 4/02-4/03 Severe Weather Plains, Midwest, Southeast 0 25,000+ 250+ million 4/07-4/10 Severe Weather Plains, Midwest, Mississippi Valley 3 160,000+ 1.6+ billion 4/16-4/17 Severe Weather Plains 1 Thousands 100s of Millions 4/18-4/21 Severe Weather Plains, Southeast, Northeast 0 135,000+ 1.4+ billion 4/24-4/28 Severe Weather Plains, Southeast 4 115,000+ 950+ million 5/03-5/05 Severe Weather Plains, Midwest 1 15,000+ 175+ million 5/06-5/13 Severe Weather Plains, Midwest, Rockies 6 90,000+ 1.0+ billion 5/10 TS Ana South Carolina 0 Hundreds Millions 5/15-5/19 Severe Weather Plains, Midwest, Rockies 2 15,000+ 150+ million 5/23-5/28 Severe Weather Plains, Midwest, Rockies, Southeast 32 150,000+ 3.75+ billion 5/28-5/30 Severe Weather Plains, Midwest, Rockies, Southeast 0 20,000+ 170+ million 6/03-6/08 Severe Weather Rockies, Plains 0 60,000+ 600+ million 6/09-6/11 Severe Weather Great Lakes 0 10,000+ 100+ million 6/16-6/18 TS Bill Texas, Oklahoma 1 10,000+ 100+ million 6/19-6/26 Severe Weather Plains, Midwest 4 100,000+ 925+ million 6/28-6/30 Wildfires Northwest 0 100+ 150+ million 6/29-7/01 Severe Weather Midwest, Northeast, Southeast 0 Thousands Millions+ 7/12-7/14 Severe Weather Midwest, Ohio Valley, Southeast 4 60,000+ 500+ million 7/16-7/18 Severe Weather Plains, Midwest 4 7,500+ 75+ million 7/20-8/05 Flooding Florida 0 2,000+ 100+ million 7/29-8/13 Wildfires California 1 150+ Millions 8/02-8/04 Severe Weather Midwest, Plains, Northeast, Mid-Atlantic 4 100,000+ 750+ million 8/13-8/31 Wildfires Northwest, Rockies 4 Thousands 150+ million 8/29-8/30 Severe Weather Pacific Northwest 2 1,000+ Millions+
Global Catastrophe Recap: October 2015 9
Aon Benfield Analytics | Impact Forecasting
Date Event Location Deaths Structures/ Claims
Economic Loss (USD)
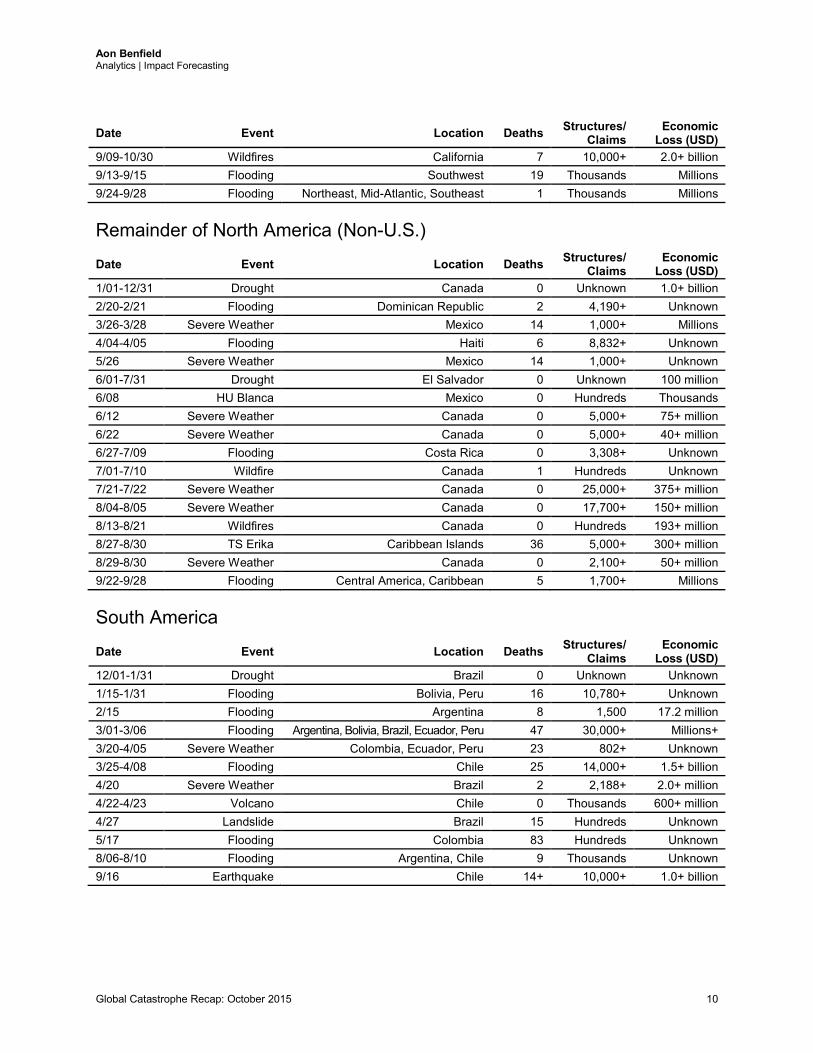
9/09-10/30 Wildfires California 7 10,000+ 2.0+ billion 9/13-9/15 Flooding Southwest 19 Thousands Millions 9/24-9/28 Flooding Northeast, Mid-Atlantic, Southeast 1 Thousands Millions
Remainder of North America (Non-U.S.)
Date Event Location Deaths Structures/ Claims
Economic Loss (USD)
1/01-12/31 Drought Canada 0 Unknown 1.0+ billion 2/20-2/21 Flooding Dominican Republic 2 4,190+ Unknown 3/26-3/28 Severe Weather Mexico 14 1,000+ Millions 4/04-4/05 Flooding Haiti 6 8,832+ Unknown 5/26 Severe Weather Mexico 14 1,000+ Unknown 6/01-7/31 Drought El Salvador 0 Unknown 100 million 6/08 HU Blanca Mexico 0 Hundreds Thousands 6/12 Severe Weather Canada 0 5,000+ 75+ million 6/22 Severe Weather Canada 0 5,000+ 40+ million 6/27-7/09 Flooding Costa Rica 0 3,308+ Unknown 7/01-7/10 Wildfire Canada 1 Hundreds Unknown 7/21-7/22 Severe Weather Canada 0 25,000+ 375+ million 8/04-8/05 Severe Weather Canada 0 17,700+ 150+ million 8/13-8/21 Wildfires Canada 0 Hundreds 193+ million 8/27-8/30 TS Erika Caribbean Islands 36 5,000+ 300+ million 8/29-8/30 Severe Weather Canada 0 2,100+ 50+ million 9/22-9/28 Flooding Central America, Caribbean 5 1,700+ Millions
South America
Date Event Location Deaths Structures/ Claims
Economic Loss (USD)
12/01-1/31 Drought Brazil 0 Unknown Unknown 1/15-1/31 Flooding Bolivia, Peru 16 10,780+ Unknown 2/15 Flooding Argentina 8 1,500 17.2 million 3/01-3/06 Flooding Argentina, Bolivia, Brazil, Ecuador, Peru 47 30,000+ Millions+ 3/20-4/05 Severe Weather Colombia, Ecuador, Peru 23 802+ Unknown 3/25-4/08 Flooding Chile 25 14,000+ 1.5+ billion 4/20 Severe Weather Brazil 2 2,188+ 2.0+ million 4/22-4/23 Volcano Chile 0 Thousands 600+ million 4/27 Landslide Brazil 15 Hundreds Unknown 5/17 Flooding Colombia 83 Hundreds Unknown 8/06-8/10 Flooding Argentina, Chile 9 Thousands Unknown 9/16 Earthquake Chile 14+ 10,000+ 1.0+ billion
Global Catastrophe Recap: October 2015 10
Aon Benfield Analytics | Impact Forecasting
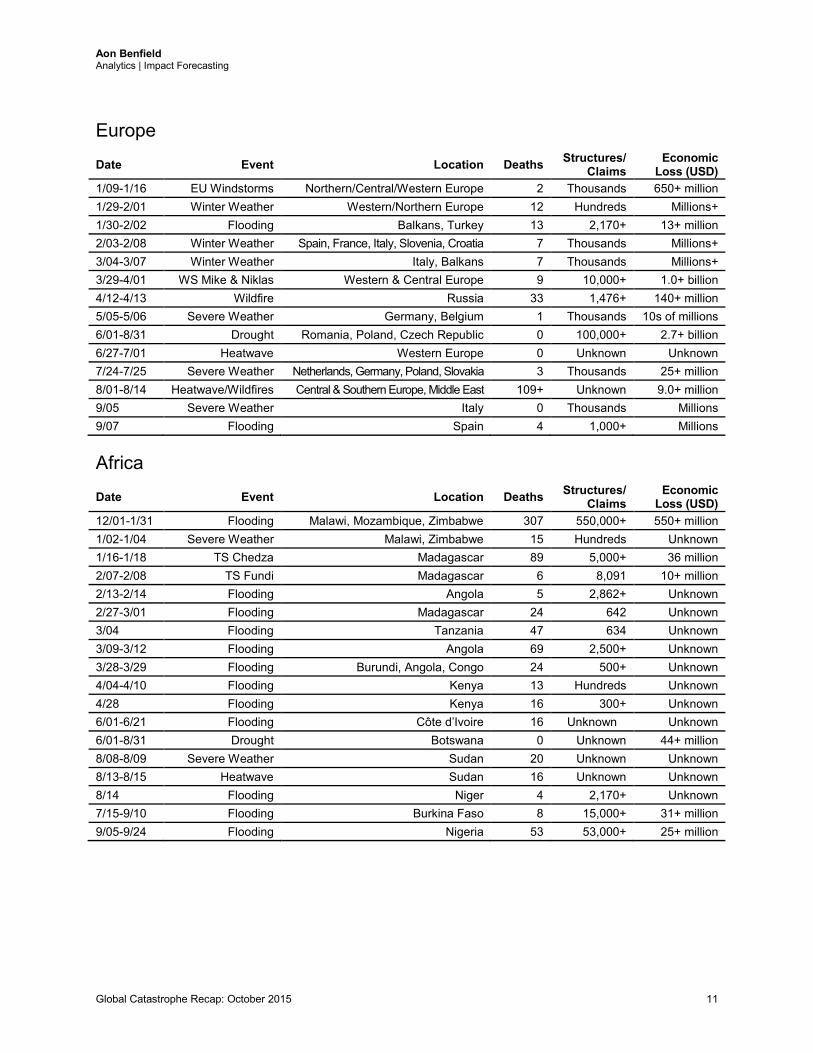
Europe
Date Event Location Deaths Structures/ Claims
Economic Loss (USD)
1/09-1/16 EU Windstorms Northern/Central/Western Europe 2 Thousands 650+ million 1/29-2/01 Winter Weather Western/Northern Europe 12 Hundreds Millions+ 1/30-2/02 Flooding Balkans, Turkey 13 2,170+ 13+ million 2/03-2/08 Winter Weather Spain, France, Italy, Slovenia, Croatia 7 Thousands Millions+ 3/04-3/07 Winter Weather Italy, Balkans 7 Thousands Millions+ 3/29-4/01 WS Mike & Niklas Western & Central Europe 9 10,000+ 1.0+ billion 4/12-4/13 Wildfire Russia 33 1,476+ 140+ million 5/05-5/06 Severe Weather Germany, Belgium 1 Thousands 10s of millions 6/01-8/31 Drought Romania, Poland, Czech Republic 0 100,000+ 2.7+ billion 6/27-7/01 Heatwave Western Europe 0 Unknown Unknown 7/24-7/25 Severe Weather Netherlands, Germany, Poland, Slovakia 3 Thousands 25+ million 8/01-8/14 Heatwave/Wildfires Central & Southern Europe, Middle East 109+ Unknown 9.0+ million 9/05 Severe Weather Italy 0 Thousands Millions 9/07 Flooding Spain 4 1,000+ Millions
Africa
Date Event Location Deaths Structures/ Claims
Economic Loss (USD)
12/01-1/31 Flooding Malawi, Mozambique, Zimbabwe 307 550,000+ 550+ million 1/02-1/04 Severe Weather Malawi, Zimbabwe 15 Hundreds Unknown 1/16-1/18 TS Chedza Madagascar 89 5,000+ 36 million 2/07-2/08 TS Fundi Madagascar 6 8,091 10+ million 2/13-2/14 Flooding Angola 5 2,862+ Unknown 2/27-3/01 Flooding Madagascar 24 642 Unknown 3/04 Flooding Tanzania 47 634 Unknown 3/09-3/12 Flooding Angola 69 2,500+ Unknown 3/28-3/29 Flooding Burundi, Angola, Congo 24 500+ Unknown 4/04-4/10 Flooding Kenya 13 Hundreds Unknown 4/28 Flooding Kenya 16 300+ Unknown 6/01-6/21 Flooding Côte d’Ivoire 16 Unknown Unknown 6/01-8/31 Drought Botswana 0 Unknown 44+ million 8/08-8/09 Severe Weather Sudan 20 Unknown Unknown 8/13-8/15 Heatwave Sudan 16 Unknown Unknown 8/14 Flooding Niger 4 2,170+ Unknown 7/15-9/10 Flooding Burkina Faso 8 15,000+ 31+ million 9/05-9/24 Flooding Nigeria 53 53,000+ 25+ million
Global Catastrophe Recap: October 2015 11
Aon Benfield Analytics | Impact Forecasting
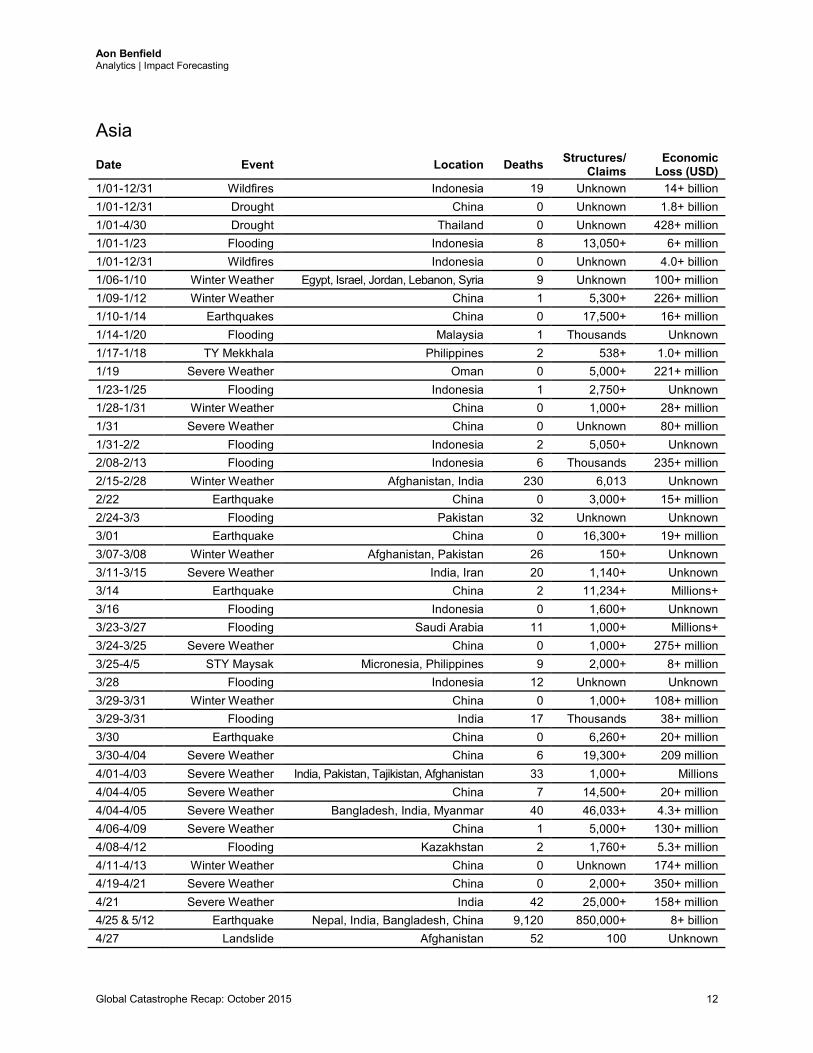
Asia
Date Event Location Deaths Structures/ Claims
Economic Loss (USD)
1/01-12/31 Wildfires Indonesia 19 Unknown 14+ billion 1/01-12/31 Drought China 0 Unknown 1.8+ billion 1/01-4/30 Drought Thailand 0 Unknown 428+ million 1/01-1/23 Flooding Indonesia 8 13,050+ 6+ million 1/01-12/31 Wildfires Indonesia 0 Unknown 4.0+ billion 1/06-1/10 Winter Weather Egypt, Israel, Jordan, Lebanon, Syria 9 Unknown 100+ million 1/09-1/12 Winter Weather China 1 5,300+ 226+ million 1/10-1/14 Earthquakes China 0 17,500+ 16+ million 1/14-1/20 Flooding Malaysia 1 Thousands Unknown 1/17-1/18 TY Mekkhala Philippines 2 538+ 1.0+ million 1/19 Severe Weather Oman 0 5,000+ 221+ million 1/23-1/25 Flooding Indonesia 1 2,750+ Unknown 1/28-1/31 Winter Weather China 0 1,000+ 28+ million 1/31 Severe Weather China 0 Unknown 80+ million 1/31-2/2 Flooding Indonesia 2 5,050+ Unknown 2/08-2/13 Flooding Indonesia 6 Thousands 235+ million 2/15-2/28 Winter Weather Afghanistan, India 230 6,013 Unknown 2/22 Earthquake China 0 3,000+ 15+ million 2/24-3/3 Flooding Pakistan 32 Unknown Unknown 3/01 Earthquake China 0 16,300+ 19+ million 3/07-3/08 Winter Weather Afghanistan, Pakistan 26 150+ Unknown 3/11-3/15 Severe Weather India, Iran 20 1,140+ Unknown 3/14 Earthquake China 2 11,234+ Millions+ 3/16 Flooding Indonesia 0 1,600+ Unknown 3/23-3/27 Flooding Saudi Arabia 11 1,000+ Millions+ 3/24-3/25 Severe Weather China 0 1,000+ 275+ million 3/25-4/5 STY Maysak Micronesia, Philippines 9 2,000+ 8+ million 3/28 Flooding Indonesia 12 Unknown Unknown 3/29-3/31 Winter Weather China 0 1,000+ 108+ million 3/29-3/31 Flooding India 17 Thousands 38+ million 3/30 Earthquake China 0 6,260+ 20+ million 3/30-4/04 Severe Weather China 6 19,300+ 209 million 4/01-4/03 Severe Weather India, Pakistan, Tajikistan, Afghanistan 33 1,000+ Millions 4/04-4/05 Severe Weather China 7 14,500+ 20+ million 4/04-4/05 Severe Weather Bangladesh, India, Myanmar 40 46,033+ 4.3+ million 4/06-4/09 Severe Weather China 1 5,000+ 130+ million 4/08-4/12 Flooding Kazakhstan 2 1,760+ 5.3+ million 4/11-4/13 Winter Weather China 0 Unknown 174+ million 4/19-4/21 Severe Weather China 0 2,000+ 350+ million 4/21 Severe Weather India 42 25,000+ 158+ million 4/25 & 5/12 Earthquake Nepal, India, Bangladesh, China 9,120 850,000+ 8+ billion 4/27 Landslide Afghanistan 52 100 Unknown
Global Catastrophe Recap: October 2015 12
Aon Benfield Analytics | Impact Forecasting
Date Event Location Deaths Structures/ Claims
Economic Loss (USD)
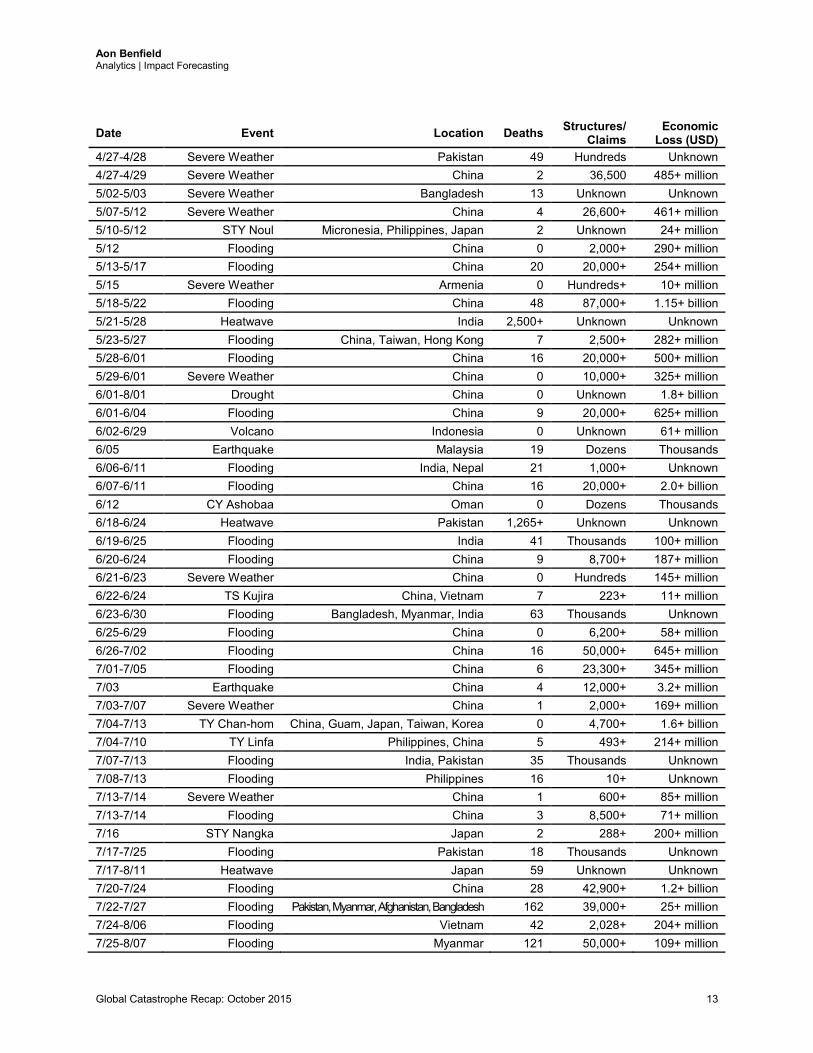
4/27-4/28 Severe Weather Pakistan 49 Hundreds Unknown 4/27-4/29 Severe Weather China 2 36,500 485+ million 5/02-5/03 Severe Weather Bangladesh 13 Unknown Unknown 5/07-5/12 Severe Weather China 4 26,600+ 461+ million 5/10-5/12 STY Noul Micronesia, Philippines, Japan 2 Unknown 24+ million 5/12 Flooding China 0 2,000+ 290+ million 5/13-5/17 Flooding China 20 20,000+ 254+ million 5/15 Severe Weather Armenia 0 Hundreds+ 10+ million 5/18-5/22 Flooding China 48 87,000+ 1.15+ billion 5/21-5/28 Heatwave India 2,500+ Unknown Unknown 5/23-5/27 Flooding China, Taiwan, Hong Kong 7 2,500+ 282+ million 5/28-6/01 Flooding China 16 20,000+ 500+ million 5/29-6/01 Severe Weather China 0 10,000+ 325+ million 6/01-8/01 Drought China 0 Unknown 1.8+ billion 6/01-6/04 Flooding China 9 20,000+ 625+ million 6/02-6/29 Volcano Indonesia 0 Unknown 61+ million 6/05 Earthquake Malaysia 19 Dozens Thousands 6/06-6/11 Flooding India, Nepal 21 1,000+ Unknown 6/07-6/11 Flooding China 16 20,000+ 2.0+ billion 6/12 CY Ashobaa Oman 0 Dozens Thousands 6/18-6/24 Heatwave Pakistan 1,265+ Unknown Unknown 6/19-6/25 Flooding India 41 Thousands 100+ million 6/20-6/24 Flooding China 9 8,700+ 187+ million 6/21-6/23 Severe Weather China 0 Hundreds 145+ million 6/22-6/24 TS Kujira China, Vietnam 7 223+ 11+ million 6/23-6/30 Flooding Bangladesh, Myanmar, India 63 Thousands Unknown 6/25-6/29 Flooding China 0 6,200+ 58+ million 6/26-7/02 Flooding China 16 50,000+ 645+ million 7/01-7/05 Flooding China 6 23,300+ 345+ million 7/03 Earthquake China 4 12,000+ 3.2+ million 7/03-7/07 Severe Weather China 1 2,000+ 169+ million 7/04-7/13 TY Chan-hom China, Guam, Japan, Taiwan, Korea 0 4,700+ 1.6+ billion 7/04-7/10 TY Linfa Philippines, China 5 493+ 214+ million 7/07-7/13 Flooding India, Pakistan 35 Thousands Unknown 7/08-7/13 Flooding Philippines 16 10+ Unknown 7/13-7/14 Severe Weather China 1 600+ 85+ million 7/13-7/14 Flooding China 3 8,500+ 71+ million 7/16 STY Nangka Japan 2 288+ 200+ million 7/17-7/25 Flooding Pakistan 18 Thousands Unknown 7/17-8/11 Heatwave Japan 59 Unknown Unknown 7/20-7/24 Flooding China 28 42,900+ 1.2+ billion 7/22-7/27 Flooding Pakistan, Myanmar, Afghanistan, Bangladesh 162 39,000+ 25+ million 7/24-8/06 Flooding Vietnam 42 2,028+ 204+ million 7/25-8/07 Flooding Myanmar 121 50,000+ 109+ million
Global Catastrophe Recap: October 2015 13
Aon Benfield Analytics | Impact Forecasting
Date Event Location Deaths Structures/ Claims
Economic Loss (USD)
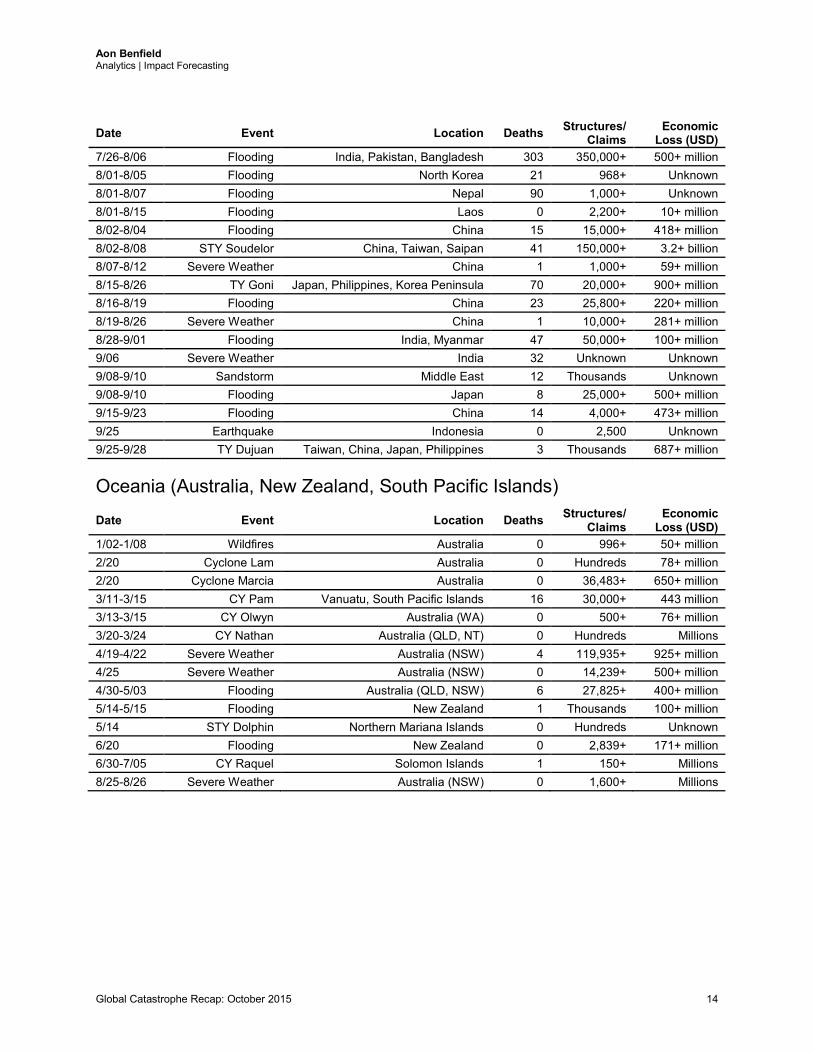
7/26-8/06 Flooding India, Pakistan, Bangladesh 303 350,000+ 500+ million 8/01-8/05 Flooding North Korea 21 968+ Unknown 8/01-8/07 Flooding Nepal 90 1,000+ Unknown 8/01-8/15 Flooding Laos 0 2,200+ 10+ million 8/02-8/04 Flooding China 15 15,000+ 418+ million 8/02-8/08 STY Soudelor China, Taiwan, Saipan 41 150,000+ 3.2+ billion 8/07-8/12 Severe Weather China 1 1,000+ 59+ million 8/15-8/26 TY Goni Japan, Philippines, Korea Peninsula 70 20,000+ 900+ million 8/16-8/19 Flooding China 23 25,800+ 220+ million 8/19-8/26 Severe Weather China 1 10,000+ 281+ million 8/28-9/01 Flooding India, Myanmar 47 50,000+ 100+ million 9/06 Severe Weather India 32 Unknown Unknown 9/08-9/10 Sandstorm Middle East 12 Thousands Unknown 9/08-9/10 Flooding Japan 8 25,000+ 500+ million 9/15-9/23 Flooding China 14 4,000+ 473+ million 9/25 Earthquake Indonesia 0 2,500 Unknown 9/25-9/28 TY Dujuan Taiwan, China, Japan, Philippines 3 Thousands 687+ million
Oceania (Australia, New Zealand, South Pacific Islands)
Date Event Location Deaths Structures/ Claims
Economic Loss (USD)
1/02-1/08 Wildfires Australia 0 996+ 50+ million 2/20 Cyclone Lam Australia 0 Hundreds 78+ million 2/20 Cyclone Marcia Australia 0 36,483+ 650+ million 3/11-3/15 CY Pam Vanuatu, South Pacific Islands 16 30,000+ 443 million 3/13-3/15 CY Olwyn Australia (WA) 0 500+ 76+ million 3/20-3/24 CY Nathan Australia (QLD, NT) 0 Hundreds Millions 4/19-4/22 Severe Weather Australia (NSW) 4 119,935+ 925+ million 4/25 Severe Weather Australia (NSW) 0 14,239+ 500+ million 4/30-5/03 Flooding Australia (QLD, NSW) 6 27,825+ 400+ million 5/14-5/15 Flooding New Zealand 1 Thousands 100+ million 5/14 STY Dolphin Northern Mariana Islands 0 Hundreds Unknown 6/20 Flooding New Zealand 0 2,839+ 171+ million 6/30-7/05 CY Raquel Solomon Islands 1 150+ Millions 8/25-8/26 Severe Weather Australia (NSW) 0 1,600+ Millions
Global Catastrophe Recap: October 2015 14
Aon Benfield Analytics | Impact Forecasting
Additional Report Details TD = Tropical Depression, TS = Tropical Storm, HU = Hurricane, TY = Typhoon, STY = Super Typhoon, CY = Cyclone
Fatality estimates as reported by public news media sources and official government agencies. Structures defined as any building – including barns, outbuildings, mobile homes, single or multiple family dwellings, and commercial facilities – that is damaged or destroyed by winds, earthquakes, hail, flood, tornadoes, hurricanes or any other natural-occurring phenomenon. Claims defined as the number of claims (which could be a combination of homeowners, commercial, auto and others) reported by various insurance companies through press releases or various public media outlets. Damage estimates are obtained from various public media sources, including news websites, publications from insurance companies, financial institution press releases and official government agencies. Damage estimates are obtained from various public media sources, including news websites, publications from insurance companies, financial institution press releases and official government agencies. Economic loss totals include any available insured loss estimates, which can be found in the corresponding event text.
Global Catastrophe Recap: October 2015 15
Aon Benfield Analytics | Impact Forecasting
Contact Information Adam Podlaha Head of Impact Forecasting Aon Benfield Analytics Impact Forecasting +44 (0) 20 7522 3820 [email protected] Steve Bowen Associate Director (Meteorologist) Aon Benfield Analytics Impact Forecasting +1.312.381.5883 [email protected] Claire Kennedy Senior Analyst (Meteorologist) Aon Benfield Analytics Impact Forecasting +65 6645 0110 [email protected]
Global Catastrophe Recap: October 2015 16
Aon Benfield Analytics | Impact Forecasting
About Aon Benfield
Aon Benfield, a division of Aon plc (NYSE: AON), is the world’s leading reinsurance intermediary and full-service capital advisor. We empower our clients to better understand, manage and transfer risk through innovative solutions and personalized access to all forms of global reinsurance capital across treaty, facultative and capital markets. As a trusted advocate, we deliver local reach to the world’s markets, an unparalleled investment in innovative analytics, including catastrophe management, actuarial and rating agency advisory. Through our professionals’ expertise and experience, we advise clients in making optimal capital choices that will empower results and improve operational effectiveness for their business. With more than 80 offices in 50 countries, our worldwide client base has access to the broadest portfolio of integrated capital solutions and services. To learn how Aon Benfield helps empower results, please visit aonbenfield.com. Copyright © by Impact Forecasting® No claim to original government works. The text and graphics of this publication are provided for informational purposes only. While Impact Forecasting® has tried to provide accurate and timely information, inadvertent technical inaccuracies and typographical errors may exist, and Impact Forecasting® does not warrant that the information is accurate, complete or current. The data presented at this site is intended to convey only general information on current natural perils and must not be used to make life-or-death decisions or decisions relating to the protection of property, as the data may not be accurate. Please listen to official information sources for current storm information. This data has no official status and should not be used for emergency response decision-making under any circumstances. Cat Alerts use publicly available data from the internet and other sources. Impact Forecasting® summarizes this publicly available information for the convenience of those individuals who have contacted Impact Forecasting® and expressed an interest in natural catastrophes of various types. To find out more about Impact Forecasting or to sign up for the Cat Reports, visit Impact Forecasting’s webpage at impactforecasting.com. Copyright © by Aon plc.
All rights reserved. No part of this document may be reproduced, stored in a retrieval system, or transmitted in any form or by any means, electronic, mechanical, photocopying, recording or otherwise. Impact Forecasting® is a wholly owned subsidiary of Aon plc.
Global Catastrophe Recap: October 2015 17