Embed Size (px)
Citation preview
October, 2013
PORTFOLIO
SECTOR ALLOCATION (%)
Past performance may or may not be sustained in future. Calculations are based on Growth Option NAV. Since inception returns are calculated on ̀ 10 invested at inception. Pankaj Murarka manages 2 schemes. Please refer to annexure on Page 14 for performance of all schemes managed by the fund manager.
1
SCHEME PERFORMANCE th(as on 30 September 2013)
FACTSHEETst 31 October 2013
Banks 19.72HDFC Bank 6.77ICICI Bank 5.94State Bank of India 4.54Kotak Mahindra Bank 1.62ING Vysya Bank 0.86Software 18.59Infosys 7.12Tata Consultancy Services 5.82CMC 1.94Oracle Financial Services Software 1.66Wipro 1.52Persistent Systems 0.53Pharmaceuticals 8.85Sun Pharmaceuticals Industries 3.17Sanofi India 2.50Cipla 2.02Lupin 1.16Consumer Non Durables 7.64ITC 7.64Finance 6.57HDFC 5.02IDFC 1.55Auto 6.10Maruti Suzuki India 2.88Tata Motors 2.35Mahindra & Mahindra 0.87Petroleum Products 5.06Reliance Industries 4.47
BPCL 0.59Construction Project 3.17Larsen & Toubro 3.17Oil 3.16ONGC 2.39Oil India 0.77Diversified Consumer Services 2.84Tree House Education And Accessories 2.84Telecom - Services 2.45Bharti Airtel 2.45Pesticides 2.20PI Industries 2.20Media & Entertainment 2.20Zee Entertainment Enterprises 1.69DQ Entertainment (International) 0.51Gas 1.96Gujarat State Petronet 1.00Indraprastha Gas 0.96Power 1.58NTPC 1.58Auto Ancillaries 1.10Exide Industries 1.10Minerals/Mining 0.84Coal India 0.84 Other Equity (less than 0.50% of the corpus) 1.12 Total Equity 95.16 Debt, Cash & Other Receivables 4.84Monthly Average AUM (` in crores) 595.39
Company Name % of
Assets
Company Name % of
Assets
Absolute
Return (%)
Absolute
Return (%)
Absolute
Return (%)
Sep 30, 2010 to
Sep 30, 2011
Sep 30, 2011 to
Sep 28, 2012
Sep 28, 2012 to
Sep 30, 2013
CAGR (%)
Since
Inception
Axis Equity Fund - Growth
CNX Nifty (Benchmark)
-18.57% 16.80% 8.54%
-18.02% 15.38% 0.56%
Current Value of
Investment if
` 10,000 was
invested on
inception date
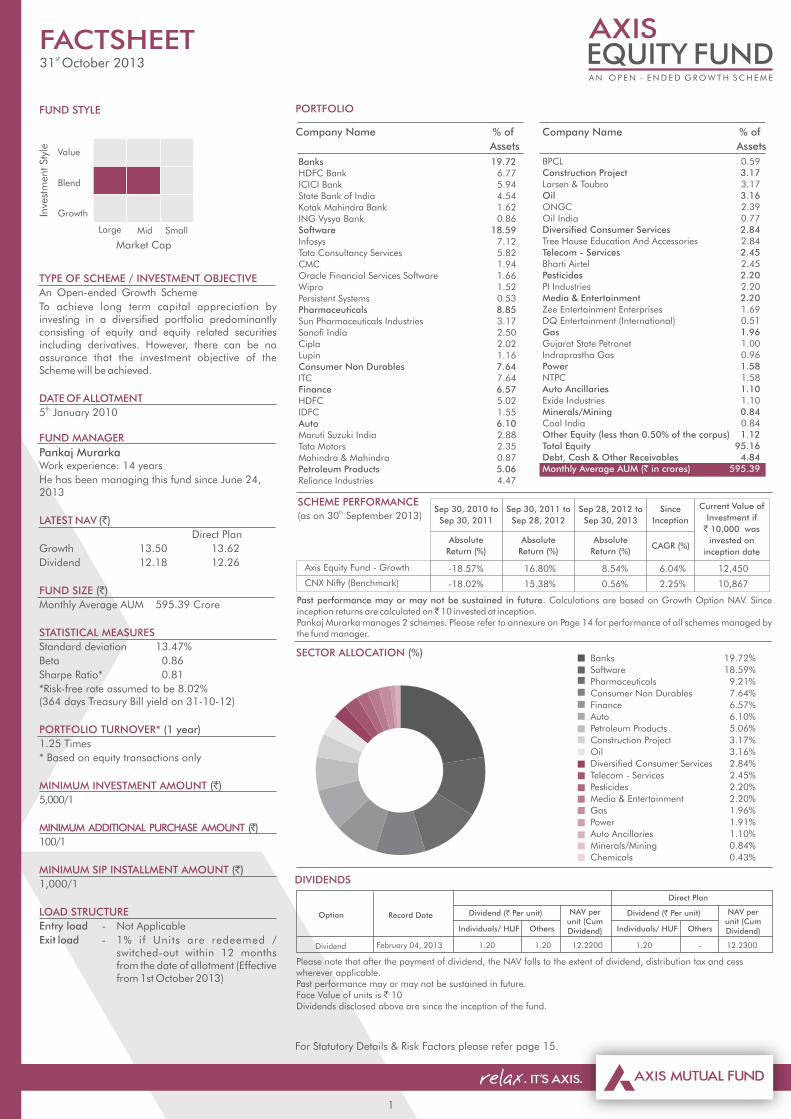
Banks 19.72%
Software 18.59%
Pharmaceuticals 9.21%
Consumer Non Durables 7.64%
Finance 6.57%
Auto 6.10%
Petroleum Products 5.06%
Construction Project 3.17%
Oil 3.16%
Diversified Consumer Services 2.84%
Telecom - Services 2.45%
Pesticides 2.20%
Media & Entertainment 2.20%
Gas 1.96%
Power 1.91%
Auto Ancillaries 1.10%
Minerals/Mining 0.84%
Chemicals 0.43%
FUND STYLE
TYPE OF SCHEME / INVESTMENT OBJECTIVE
An Open-ended Growth Scheme
To achieve long term capital appreciation by investing in a diversified portfolio predominantly consisting of equity and equity related securities including derivatives. However, there can be no assurance that the investment objective of the Scheme will be achieved.
DATE OF ALLOTMENTth5 January 2010
FUND MANAGER
Pankaj MurarkaWork experience: 14 years
He has been managing this fund since June 24, 2013
LATEST NAV (`)
Direct Plan
Growth 13.50 13.62
Dividend 12.18 12.26
FUND SIZE (`)
Monthly Average AUM 595.39 Crore
STATISTICAL MEASURES
Standard deviation 13.47%
Beta 0.86
Sharpe Ratio* 0.81
*Risk-free rate assumed to be 8.02% (364 days Treasury Bill yield on 31-10-12)
PORTFOLIO TURNOVER* (1 year)
1.25 Times
* Based on equity transactions only
MINIMUM INVESTMENT AMOUNT (`)
5,000/1
MINIMUM ADDITIONAL PURCHASE AMOUNT (̀ )
100/1
MINIMUM SIP INSTALLMENT AMOUNT (`)
1,000/1
LOAD STRUCTURE
Entry load - Not Applicable
Exit load - 1% if Units are redeemed / switched-out within 12 months from the date of allotment (Effective from 1st October 2013)
Value
Blend
GrowthInve
stm
ent Sty
le
Market Cap
Large Mid Small
For Statutory Details & Risk Factors please refer page 15.
DIVIDENDS
Record Date NAV per unit (Cum Dividend) Individuals/ HUF
Dividend (` Per unit)
Others
Option
Dividend February 04, 2013 1.20 1.20 12.2200 1.20 - 12.2300
NAV per unit (Cum Dividend) Individuals/ HUF
Dividend (` Per unit)
Others
Direct Plan
Please note that after the payment of dividend, the NAV falls to the extent of dividend, distribution tax and cess wherever applicable.Past performance may or may not be sustained in future. Face Value of units is ` 10Dividends disclosed above are since the inception of the fund.
6.04%
2.25%
12,450
10,867
PORTFOLIO
2
Software 17.85
Infosys 7.20
Tata Consultancy Services 5.02
Oracle Financial Services Software 3.54
Tech Mahindra 2.09
Consumer Non Durables 13.26
ITC 7.16
Colgate Palmolive (India) 3.10
United Spirits 3.00
Pharmaceuticals 12.71
Dr. Reddy's Laboratories 4.93
Sun Pharmaceuticals Industries 4.82
Lupin 2.96
Banks 11.89
HDFC Bank 6.30
Kotak Mahindra Bank 2.98
ICICI Bank 2.61
Auto 9.99
Tata Motors 5.03
Mahindra & Mahindra 4.96
Finance 9.00
HDFC 5.91
Mahindra & Mahindra Financial Services 3.08
Petroleum Products 6.86
Reliance Industries 6.86
Chemicals 4.20
Pidilite Industries 4.20
Telecom - Services 3.95
Idea Cellular 3.95
Media & Entertainment 3.32
Zee Entertainment Enterprises 3.32
Cement 3.05
Ultratech Cement 3.05
Construction Project 1.58
Larsen & Toubro 1.58
Total Equity 97.65
Cash & Other Receivables 2.34
Monthly Average AUM (` in crores) 121.33
Company Name % of
Assets
Company Name % of
Assets
SECTOR ALLOCATION (%)
FUND STYLE
TYPE OF SCHEME / INVESTMENT OBJECTIVE
An Open-Ended Equity Scheme
To generate long term capital appreciation by investing in a concentrated portfolio of equity & equity related instruments of up to 25 companies.
DATE OF ALLOTMENTth29 June 2012
FUND MANAGER
Sudhanshu AsthanaWork experience: 13 years
He has been managing this fund since 2nd September 2013
LATEST NAV (`)
Direct Plan
Growth 12.16 12.28
Dividend 12.17 12.23
FUND SIZE (`)
Monthly Average AUM 121.33 Crore
STATISTICAL MEASURES
Standard deviation 15.63%
Beta 0.98
Sharpe Ratio* 0.30
*Risk-free rate assumed to be 8.02% (364 days Treasury Bill yield on 31-10-12)
PORTFOLIO TURNOVER* (1 year)
0.76 Times
* Based on equity transactions only
MINIMUM INVESTMENT AMOUNT (`)
5,000/1
MINIMUM ADDITIONAL PURCHASE AMOUNT (̀ )
100/1
MINIMUM SIP INSTALLMENT AMOUNT (̀ )
1,000/1
LOAD STRUCTURE
Entry load - Not Applicable
Exit load - 3% if redeemed / switched - out up to 6 months from the date of allotment
2% if redeemed / switched - out after 6 months & up to 12 months from the date of allotment
1% if redeemed / switched - out after 12 months & up to 24 months from the date of allotment
Value
Blend
GrowthInve
stm
ent Sty
le
Market Cap
Large Mid Small
FACTSHEETst 31 October 2013
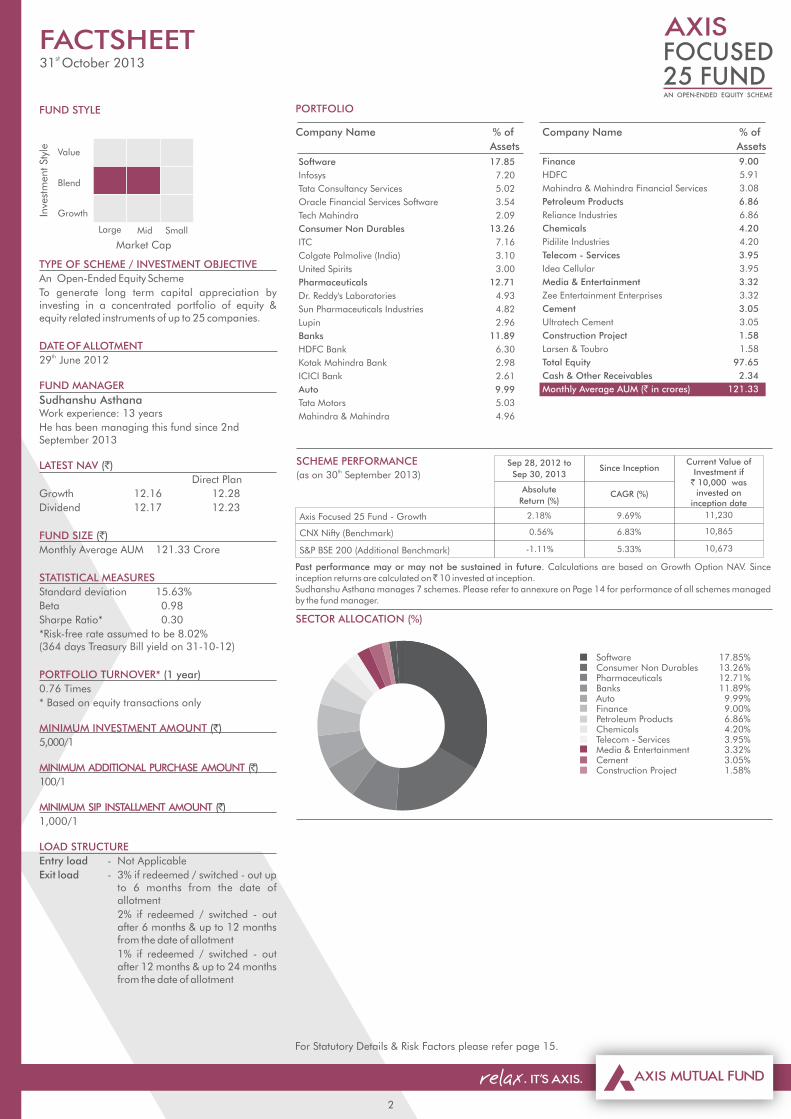
Software 17.85%Consumer Non Durables 13.26%Pharmaceuticals 12.71%Banks 11.89%Auto 9.99%Finance 9.00%Petroleum Products 6.86%Chemicals 4.20%Telecom - Services 3.95%Media & Entertainment 3.32%Cement 3.05%Construction Project 1.58%
For Statutory Details & Risk Factors please refer page 15.
Past performance may or may not be sustained in future. Calculations are based on Growth Option NAV. Since inception returns are calculated on ̀ 10 invested at inception.Sudhanshu Asthana manages 7 schemes. Please refer to annexure on Page 14 for performance of all schemes managed by the fund manager.
SCHEME PERFORMANCE th(as on 30 September 2013)
Axis Focused 25 Fund - Growth
CNX Nifty (Benchmark)
2.18%
Absolute
Return (%)CAGR (%)
Since Inception
9.69%
Sep 28, 2012 to
Sep 30, 2013
Current Value of Investment if
` 10,000 wasinvested on
inception date
11,230
0.56% 10,8656.83%
S&P BSE 200 (Additional Benchmark) -1.11% 10,6735.33%
PORTFOLIO
SECTOR ALLOCATION (%)
Past performance may or may not be sustained in future. Calculations are based on Growth Option NAV. Since inception returns are calculated on ̀ 10 invested at inception.Jinesh Gopani manages 7 schemes. Please refer to annexure on Page 14 for performance of all schemes managed by the fund manager.
SCHEME PERFORMANCE th(as on 30 September 2013)
Banks 14.62
HDFC Bank 7.06
Kotak Mahindra Bank 6.42
Indusind Bank 1.15
Finance 13.56
HDFC 6.21
Gruh Finance 2.58
Mahindra & Mahindra Financial Services 1.84
Sundaram Finance 1.49
Bajaj Finance 1.44
Software 13.28
Tata Consultancy Services 5.67
Tech Mahindra 3.21
Persistent Systems 2.54
Oracle Financial Services Software 1.87
Pharmaceuticals 10.83
Sun Pharmaceuticals Industries 3.92
Divis Laboratories 3.64
Sanofi India 1.28
TTK Healthcare 1.11
Cadila Healthcare 0.88
Auto 8.55
Maruti Suzuki India 3.24
Eicher Motors 3.10
Mahindra & Mahindra 2.21
Consumer Non Durables 8.14
ITC 5.79
Nestle India 1.42
Asian Paints 0.93
Consumer Durables 7.96
TTK Prestige 3.68
Symphony 2.36
Bata India 1.92
Construction Project 6.80
Larsen & Toubro 6.80
Auto Ancillaries 3.27
Motherson Sumi Systems 2.10
Wabco India 1.17
Pesticides 3.23
PI Industries 3.23
Industrial Products 2.68
Cummins India 2.68
Transportation 1.74
Gujarat Pipavav Port 1.74
Textile Products 1.49
Page Industries 1.49
Diversified Consumer Services 0.76
Tree House Education and Accessories 0.76
Hotels 0.53
Speciality Restaurants 0.53
Other Equity (less than 0.50% of the corpus) 0.70
Total Equity 98.16
Debt, Cash & Other Receivables 1.84
Monthly Average AUM (` in crores) 703.18
Company Name % of
Assets
Company Name % of
Assets
Please note that after the payment of dividend, the NAV falls to the extent of dividend, distribution tax and cess wherever applicable.Past performance may or may not be sustained in future. Face Value of units is 10`Dividends disclosed above are since the inception of the fund.
DIVIDENDS
August 7, 2012 0.80 0.80 12.1041
August 31, 2010 1.00 1.00 11.9703
Record Date NAV per unit (Cum Dividend)
Individuals/ HUF
Dividend ( Per unit)`
Others
Option
Dividend
3
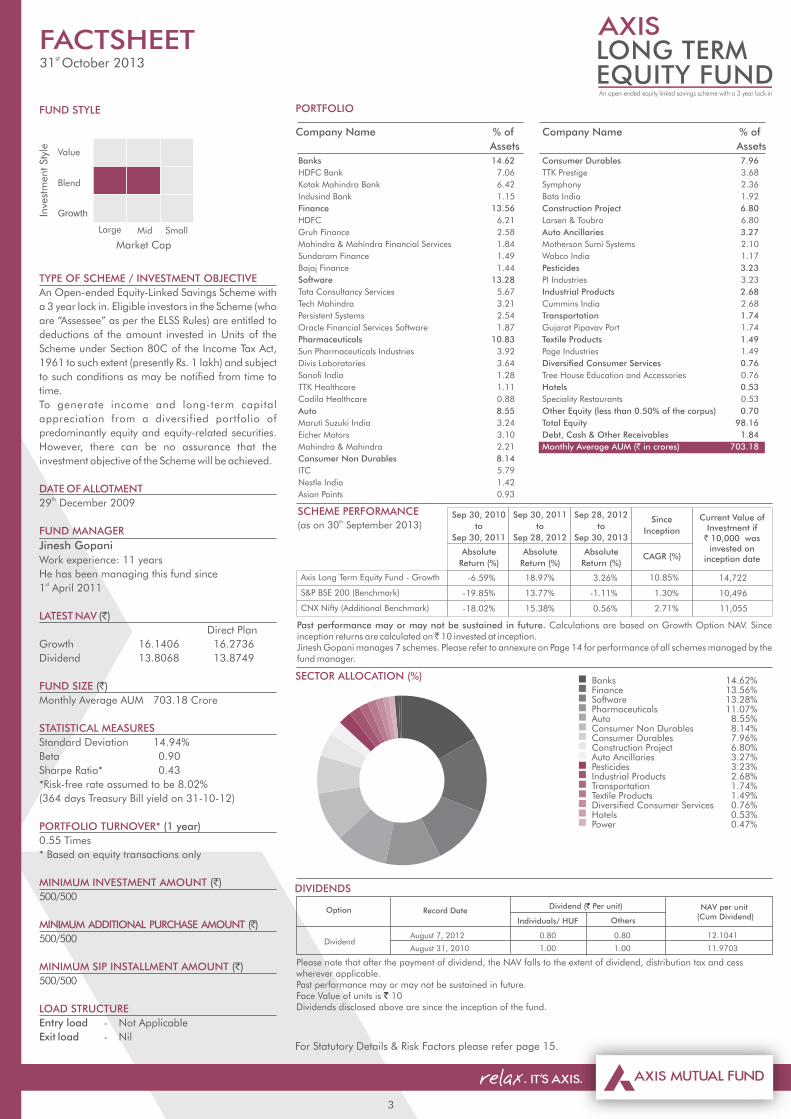
Banks 14.62%Finance 13.56%Software 13.28%Pharmaceuticals 11.07%Auto 8.55%Consumer Non Durables 8.14%Consumer Durables 7.96%Construction Project 6.80%Auto Ancillaries 3.27%Pesticides 3.23%Industrial Products 2.68%Transportation 1.74%Textile Products 1.49%Diversified Consumer Services 0.76%Hotels 0.53%Power 0.47%
FUND STYLE
TYPE OF SCHEME / INVESTMENT OBJECTIVE
An Open-ended Equity-Linked Savings Scheme with
a 3 year lock in. Eligible investors in the Scheme (who
are “Assessee” as per the ELSS Rules) are entitled to
deductions of the amount invested in Units of the
Scheme under Section 80C of the Income Tax Act,
1961 to such extent (presently Rs. 1 lakh) and subject
to such conditions as may be notified from time to
time.
To generate income and long-term capital
appreciation from a diversified portfolio of
predominantly equity and equity-related securities.
However, there can be no assurance that the
investment objective of the Scheme will be achieved.
DATE OF ALLOTMENTth29 December 2009
FUND MANAGER
Jinesh Gopani
Work experience: 11 years
He has been managing this fund since st1 April 2011
LATEST NAV (`)
Direct Plan
Growth 16.1406 16.2736
Dividend 13.8068 13.8749
FUND SIZE (`)
Monthly Average AUM 703.18 Crore
STATISTICAL MEASURES
Standard Deviation 14.94%
Beta 0.90
Sharpe Ratio* 0.43
*Risk-free rate assumed to be 8.02%
(364 days Treasury Bill yield on 31-10-12)
PORTFOLIO TURNOVER* (1 year)
0.55 Times
* Based on equity transactions only
MINIMUM INVESTMENT AMOUNT (`)
500/500
MINIMUM ADDITIONAL PURCHASE AMOUNT (̀ )
500/500
MINIMUM SIP INSTALLMENT AMOUNT (`)
500/500
LOAD STRUCTURE
Entry load - Not Applicable
Exit load - Nil
Value
Blend
GrowthInve
stm
ent Sty
le
Market Cap
Large Mid Small
FACTSHEETst 31 October 2013
Axis Long Term Equity Fund - Growth
S&P BSE 200 (Benchmark)
CNX Nifty (Additional Benchmark)
Absolute
Return (%)CAGR (%)
Since
Inception
-6.59%
-19.85%
-18.02%
Absolute
Return (%)
18.97%
13.77%
15.38%
Absolute
Return (%)
3.26%
-1.11%
0.56%
10.85%
1.30%
2.71%
Sep 30, 2010
to
Sep 30, 2011
Current Value of Investment if
` 10,000 wasinvested on
inception date
14,722
10,496
11,055
Sep 30, 2011
to
Sep 28, 2012
Sep 28, 2012
to
Sep 30, 2013
For Statutory Details & Risk Factors please refer page 15.
PORTFOLIO
4
Software 15.20Persistent Systems 5.00CMC 4.99Oracle Financial Services Software 1.97Hexaware Technologies 1.96Tech Mahindra 1.27Banks 15.03ING Vysya Bank 4.47Federal Bank 4.14Allahabad Bank 2.82Oriental Bank of Commerce 1.96United Bank Of India 0.93Union Bank of India 0.71Finance 8.47ICRA 2.41Sundaram Finance 1.76IDFC 1.56CRISIL 1.42Dewan Housing Finance Corporation 0.78Motilal Oswal Financial Services 0.54Pharmaceuticals 6.65Wyeth 2.36Torrent Pharmaceuticals 2.22Sanofi India 1.24IPCA Laboratories 0.84Consumer Non Durables 6.50Agro Tech Foods 3.28Zydus Wellness 2.47VST Industries 0.74Auto Ancillaries 5.22Exide Industries 1.99Amara Raja Batteries 1.93MRF 1.29Gas 4.83Indraprastha Gas 2.86Gujarat State Petronet 1.97Auto 4.75Eicher Motors 2.37VST Tillers Tractors 1.53SML Isuzu 0.86
Media & Entertainment 3.51DB Corp 2.20Entertainment Network (India) 1.31Pesticides 3.15UPL 1.69Rallis India 1.46Cement 2.27Century Textiles & Industries 1.36JK Lakshmi Cement 0.92Petroleum Products 1.98HPCL 1.98Chemicals 1.98Pidilite Industries 1.98Construction 1.92Sobha Developers 1.92Power 1.90Torrent Power 1.90Services 1.66Aditya Birla Nuvo 1.66Construction Project 1.38Engineers India 0.72Sadbhav Engineering 0.65Transportation 1.32Gujarat Pipavav Port 1.32Industrial Capital Goods 1.28ABB 0.72Thermax 0.56Industrial Products 1.23Jain Irrigation Systems 1.23Telecom - Services 1.13Idea Cellular 1.13Diversified Consumer Services 1.12MT Educare 1.12Oil 0.78Oil India 0.78Other Equity (less than 0.50% of the corpus) 1.82 Total Equity 95.06 Cash & Other Receivables 4.94Monthly Average AUM (` in crores) 235.18
Company Name % of
Assets
Company Name % of
Assets
SECTOR ALLOCATION (%)
Past performance may or may not be sustained in future. Calculations are based on Growth Option NAV. Since inception returns are calculated on ̀ 10 invested at inception. Pankaj Murarka manages 2 schemes. Please refer to annexure on Page 14 for performance of all schemes managed by the fund manager.
SCHEME PERFORMANCE th(as on 30 September 2013)
S&P BSE Midcap (Benchmark)
CNX Nifty (Additional Benchmark)
Axis Midcap Fund - Growth
CAGR (%)
7.79%
15.38%
21.58% 5.98%
-6.38%
1.91% 10,506
8,415
11,640
Since
Inception
Absolute
Return (%)
Sep 30, 2011 to
Sep 28, 2012
Current Value of Investment if
` 10,000 wasinvested on
inception date
FUND STYLE
TYPE OF SCHEME / INVESTMENT OBJECTIVE
An Open-Ended Equity Scheme
To achieve long term capital appreciation by investing predominantly in equity & equity related instruments of mid size companies. The focus of the fund would be to invest in relatively larger companies within this category.
DATE OF ALLOTMENTth18 February 2011
FUND MANAGER
Pankaj Murarka
Work experience: 14 years
He has been managing this fund since inception.
LATEST NAV (`)
Direct Plan
Growth 12.70 12.78
Dividend 12.68 12.77
FUND SIZE (`)
Monthly Average AUM 235.18 Crore
STATISTICAL MEASURES
Standard Deviation 19.22%
Beta 0.94
Sharpe Ratio* -0.19
*Risk-free rate assumed to be 8.02%(364 days Treasury Bill yield on 31-10-12)
PORTFOLIO TURNOVER* (1 year)
0.44 Times
* Based on equity transactions only
MINIMUM INVESTMENT AMOUNT (`)
5,000/1
MINIMUM ADDITIONAL PURCHASE AMOUNT (̀ )
100/1
MINIMUM SIP INSTALLMENT AMOUNT (`)
1,000/1
LOAD STRUCTURE
Entry load - Not Applicable
Exit load - 3% if redeemed / switched - out up to 6 months from the date of allotment
2% if redeemed / switched - out after 6 months & up to 12 months from the date of allotment
1% if redeemed / switched - out after 12 months & up to 24 months from the date of allotment
Value
Blend
GrowthInve
stm
ent Sty
le
Market Cap
Large Mid Small
FACTSHEETst 31 October 2013
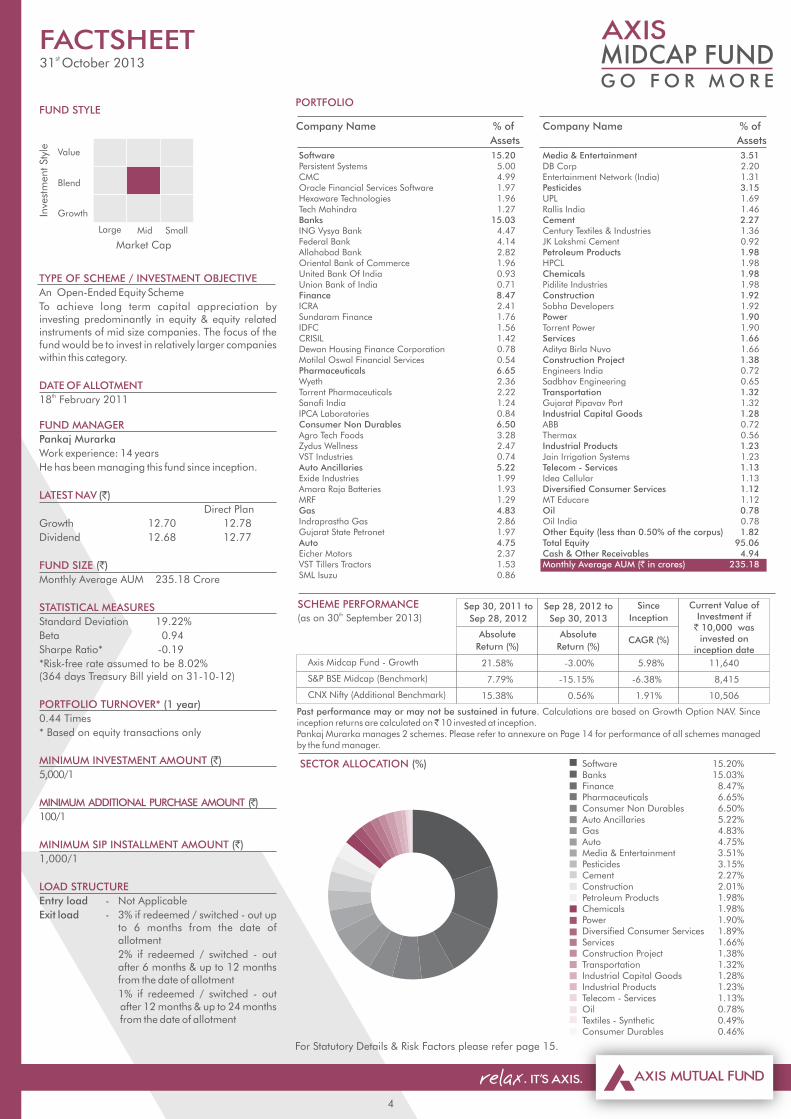
Software 15.20%Banks 15.03%Finance 8.47%Pharmaceuticals 6.65%Consumer Non Durables 6.50%Auto Ancillaries 5.22%Gas 4.83%Auto 4.75%Media & Entertainment 3.51%Pesticides 3.15%Cement 2.27%Construction 2.01%Petroleum Products 1.98%Chemicals 1.98%Power 1.90%Diversified Consumer Services 1.89%Services 1.66%Construction Project 1.38%Transportation 1.32%Industrial Capital Goods 1.28%Industrial Products 1.23%Telecom - Services 1.13%Oil 0.78%Textiles - Synthetic 0.49%Consumer Durables 0.46%
For Statutory Details & Risk Factors please refer page 15.
Sep 28, 2012 to
Sep 30, 2013
Absolute
Return (%)
-15.15%
0.56%
-3.00%

5
Please note that after the payment of dividend, the NAV falls to the extent of dividend, distribution tax and cess wherever applicable. Past performance may or may not be sustained in future. Face Value of units is 10. Dividends disclosed above `are since the inception of the fund. @ Based on debt portfolio only.
* For instruments with put/call option, the put/call date has been taken as the maturity date.& The yield to maturity given above is based on the portfolio of funds as on date given above. This should not be taken as an indication of the returns that maybe generated by the fund and the securities bought by the fund may or may not be held till their respective maturities.
Total Debt 25.65Government Bond 12.938.20% GOI SOV 3.888.97% GOI SOV 3.348.28% GOI SOV 2.867.16% GOI SOV 1.728.30% GOI SOV 1.13 Corporate Bond 12.72Reliance Gas Transportation CRISIL AAA 2.59Infrastructure Hindalco Industries CRISIL AA+ 2.42Tata Motors Finance CRISIL AA- 1.84Tata Power CRISIL AA- 1.39Reliance Ports & Terminals CRISIL AAA 1.25Shriram Transport Finance CRISIL AA 1.24Sesa Sterlite CRISIL AA+ 1.18Tata Steel CARE AA 0.50Indian Infrastructure Finance CRISIL AAA 0.30Total Equity 37.47Software 5.88Infosys 2.91Tata Consultancy Services 1.92Persistent Systems 1.05Consumer Non Durables 5.51ITC 1.56United Spirits 1.45Emami 1.35Glaxosmithkline Consumer Healthcare 1.15Pharmaceuticals 5.08Dr. Reddy's Laboratories Ltd 1.84Lupin 1.49Sun Pharmaceuticals Industries 1.01Sanofi India 0.74
PORTFOLIO
Company Name Rating % of
Assets
Company Name Rating % of
Assets
Past performance may or may not be sustained in future. Calculations are based on Growth Option NAV. Since inception returns are calculated on ̀ 10 invested at inception.R. Sivakumar manages 3 schemes & Sudhanshu Asthana manages 7 schemes. Please refer to annexure on Page 14 for performance of all schemes managed by the fund managers.
Finance 4.56HDFC 1.57IDFC 0.79Bajaj Holdings & Investment 0.78Sundaram Finance 0.76Max India 0.67Banks 3.43HDFC Bank 2.24Kotak Mahindra Bank 1.19Cement 2.59Ultratech Cement 1.33Ramco Cements 1.26Telecom - Services 2.45Bharti Airtel 1.48Idea Cellular 0.97Petroleum Products 2.05Reliance Industries 2.05Auto Ancillaries 1.84Motherson Sumi Systems 1.84Chemicals 1.47Pidilite Industries 1.47Pesticides 1.30PI Industries 1.30Industrial Capital Goods 0.73Thermax 0.73Construction Project 0.57Larsen & Toubro 0.57 Gold Exchange Traded Funds 29.80Axis Gold ETF 29.80 Net Current Assets 7.09Monthly Average AUM (` in crores) 820.85
SCHEME PERFORMANCE th(as on 30 September 2013)
Axis Triple Advantage Fund - Growth
CNX Nifty
Additional Benchmark
35% of CNX Nifty + 35% of Crisil Composite Bond Fund Index + 30% of INR Price of Gold (Benchmark)
DIVIDENDS
September 17, 2012 0.7047 0.6040 11.2694
September 21, 2011 0.7047 0.6040 10.9561
Record Date NAV per unit (Cum Dividend)
Individuals/ HUF
Dividend ( Per unit)`
Others
Option
Dividend
3.76%
-18.02%
Not Applicable
Absolute
Return (%)
Sep 30, 2010 to Sep 30, 2011
5.00%
Equity
Debt
Gold
Ass
et C
lass
Credit Quality
High Mid Low
FUND STYLE
TYPE OF SCHEME / INVESTMENT OBJECTIVE
An Open-ended Hybrid Fund
To generate long term capital appreciation by investing in a diversified portfolio of equity and equity related instruments, fixed income instruments & gold exchange traded funds.
DATE OF ALLOTMENTrd23 August 2010
FUND MANAGER
R. SivakumarWork experience: 13 years
He has been managing the fund since th14 September 2010
Sudhanshu AsthanaWork experience: 13 years
He has been managing this fund since st1 April 2011
LATEST NAV (`)
Direct Plan
Growth 12.8513 12.9298
Dividend 11.0680 11.1347
FUND SIZE (`)
Monthly Average AUM 820.85 Crore
@AVERAGE MATURITY *
8.94 years
@MODIFIED DURATION *
4.89 years
&YIELD TO MATURITY
9.61%
MINIMUM INVESTMENT AMOUNT (`)
5,000/1
MINIMUM ADDITIONAL PURCHASE AMOUNT (̀ )
100/1
MINIMUM SIP INSTALLMENT AMOUNT (`)
1,000/1
LOAD STRUCTURE
Entry load - Not applicable
Exit load - 1% if redeemed / switched - out within 2 years from the date of allotment
FACTSHEETst 31 October 2013
For Statutory Details & Risk Factors please refer page 15.
COMPOSITION BY ASSET (%)
29.80%
COMPOSITION BY RATING @(%)
37.47%
6.79%
Equity
Gold Exchange Traded Funds CRISIL AAA
SOV+
Money Market Instruments
Government Bond
50.41%
14.05%
CRISIL AA-
12.58%
CRISIL AA+
12.93%
7.09%
16.16%Corporate Bond
CRISIL AA/ CARE AA
+ Includes Net Current Assets
12.72%
14.85%
15.38%
Absolute
Return (%)
Sep 30, 2011 to Sep 28, 2012
14.70%
-0.12%
0.56%
Absolute
Return (%)
Sep 28, 2012 to Sep 30, 2013
-1.07%
CAGR (%)
Since
Inception
Current Value of Investment if
` 10,000 wasinvested on
inception date
6.82%
1.10%
7.21%
12,276
10,346
12,416
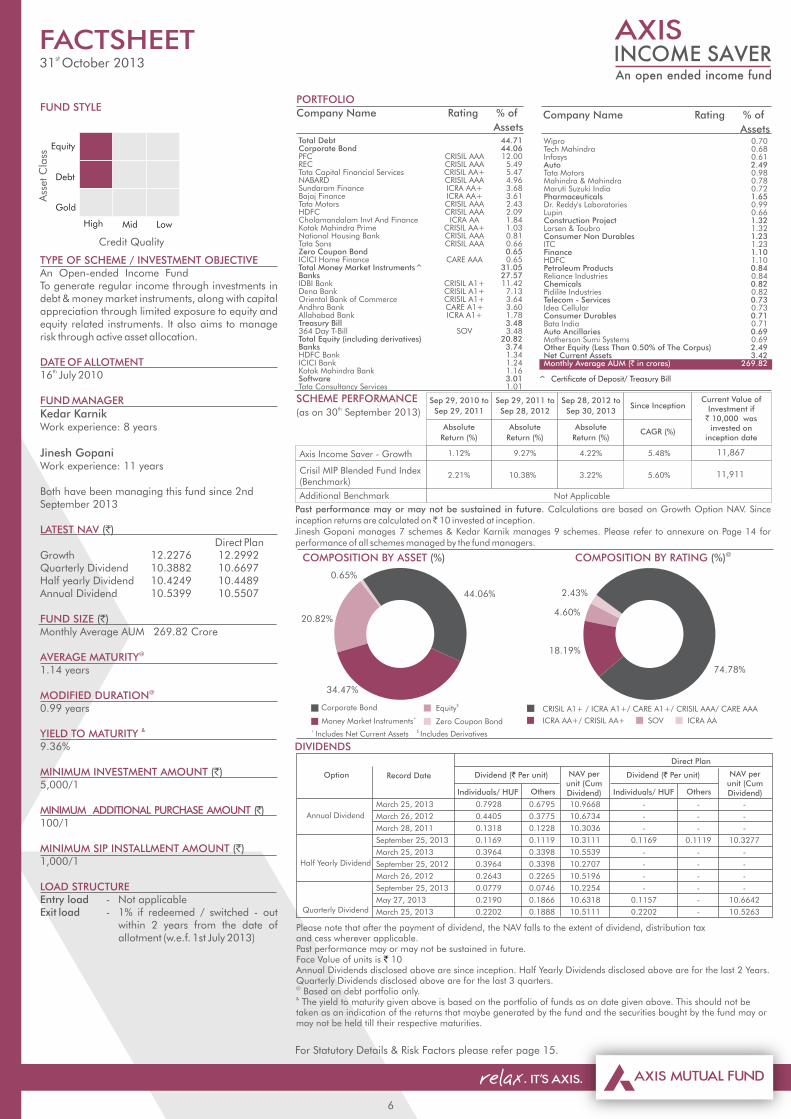
Total Debt 44.71Corporate Bond 44.06PFC CRISIL AAA 12.00REC CRISIL AAA 5.49Tata Capital Financial Services CRISIL AA+ 5.47NABARD CRISIL AAA 4.96Sundaram Finance ICRA AA+ 3.68Bajaj Finance ICRA AA+ 3.61Tata Motors CRISIL AAA 2.43HDFC CRISIL AAA 2.09Cholamandalam Invt And Finance ICRA AA 1.84Kotak Mahindra Prime CRISIL AA+ 1.03National Housing Bank CRISIL AAA 0.81Tata Sons CRISIL AAA 0.66 Zero Coupon Bond 0.65ICICI Home Finance CARE AAA 0.65 Total Money Market Instruments^ 31.05Banks 27.57IDBI Bank CRISIL A1+ 11.42Dena Bank CRISIL A1+ 7.13Oriental Bank of Commerce CRISIL A1+ 3.64Andhra Bank CARE A1+ 3.60Allahabad Bank ICRA A1+ 1.78 Treasury Bill 3.48364 Day T-Bill SOV 3.48 Total Equity (including derivatives) 20.82Banks 3.74HDFC Bank 1.34ICICI Bank 1.24Kotak Mahindra Bank 1.16Software 3.01Tata Consultancy Services 1.01
COMPOSITION BY ASSET (%)
$EquityCorporate Bond
PORTFOLIO
Company Name Rating % of
Assets
Company Name Rating % of
Assets
Past performance may or may not be sustained in future. Calculations are based on Growth Option NAV. Since inception returns are calculated on ̀ 10 invested at inception.Jinesh Gopani manages 7 schemes & Kedar Karnik manages 9 schemes. Please refer to annexure on Page 14 for performance of all schemes managed by the fund managers.
6
Wipro 0.70Tech Mahindra 0.68Infosys 0.61Auto 2.49Tata Motors 0.98Mahindra & Mahindra 0.78Maruti Suzuki India 0.72Pharmaceuticals 1.65Dr. Reddy's Laboratories 0.99Lupin 0.66Construction Project 1.32Larsen & Toubro 1.32Consumer Non Durables 1.23ITC 1.23Finance 1.10HDFC 1.10Petroleum Products 0.84Reliance Industries 0.84Chemicals 0.82Pidilite Industries 0.82Telecom - Services 0.73Idea Cellular 0.73Consumer Durables 0.71Bata India 0.71Auto Ancillaries 0.69Motherson Sumi Systems 0.69 Other Equity (Less Than 0.50% of The Corpus) 2.49 Net Current Assets 3.42Monthly Average AUM (` in crores) 269.82
Please note that after the payment of dividend, the NAV falls to the extent of dividend, distribution taxand cess wherever applicable.Past performance may or may not be sustained in future.Face Value of units is 10`Annual Dividends disclosed above are since inception. Half Yearly Dividends disclosed above are for the last 2 Years. Quarterly Dividends disclosed above are for the last 3 quarters.@ Based on debt portfolio only.& The yield to maturity given above is based on the portfolio of funds as on date given above. This should not be taken as an indication of the returns that maybe generated by the fund and the securities bought by the fund may or may not be held till their respective maturities.
DIVIDENDS
+Money Market Instruments
34.47%
44.06%
0.65%
COMPOSITION BY RATING @(%)
74.78%
March 25, 2013 0.7928 0.6795 10.9668 - - -
March 26, 2012 0.4405 0.3775 10.6734 - - -
March 28, 2011 0.1318 0.1228 10.3036 - - -
September 25, 2013 0.1169 0.1119 10.3111 0.1169 0.1119 10.3277
March 25, 2013 0.3964 0.3398 10.5539 - - -
September 25, 2012 0.3964 0.3398 10.2707 - - -
March 26, 2012 0.2643 0.2265 10.5196 - - -
September 25, 2013 0.0779 0.0746 10.2254 - - -
May 27, 2013 0.2190 0.1866 10.6318 0.1157 - 10.6642
March 25, 2013 0.2202 0.1888 10.5111 0.2202 - 10.5263
Record Date NAV per unit (Cum Dividend) Individuals/ HUF
Dividend ( Per unit)`
Others
Annual Dividend
Option
Half Yearly Dividend
Quarterly Dividend
ICRA AA+/ CRISIL AA+
CRISIL A1+ / ICRA A1+/ CARE A1+/ CRISIL AAA/ CARE AAA
SCHEME PERFORMANCE th(as on 30 September 2013)
18.19%
2.43%
SOV
20.82%
Zero Coupon Bond
Axis Income Saver - Growth
Crisil MIP Blended Fund Index(Benchmark)
Additional Benchmark
1.12%
Not Applicable
Absolute
Return (%)CAGR (%)
Since InceptionSep 29, 2010 to
Sep 29, 2011
Current Value of Investment if
` 10,000 wasinvested on
inception date
11,867
2.21% 11,911
Equity
Debt
Gold
Ass
et C
lass
Credit Quality
High Mid Low
FUND STYLE
TYPE OF SCHEME / INVESTMENT OBJECTIVE An Open-ended Income FundTo generate regular income through investments in debt & money market instruments, along with capital appreciation through limited exposure to equity and equity related instruments. It also aims to manage risk through active asset allocation.
DATE OF ALLOTMENTth16 July 2010
FUND MANAGER
Kedar KarnikWork experience: 8 years
Jinesh GopaniWork experience: 11 years
Both have been managing this fund since 2nd September 2013
LATEST NAV (`) Direct PlanGrowth 12.2276 12.2992Quarterly Dividend 10.3882 10.6697Half yearly Dividend 10.4249 10.4489Annual Dividend 10.5399 10.5507
FUND SIZE (`)Monthly Average AUM 269.82 Crore
@AVERAGE MATURITY1.14 years
@MODIFIED DURATION0.99 years
&YIELD TO MATURITY 9.36%
MINIMUM INVESTMENT AMOUNT (`)5,000/1
MINIMUM ADDITIONAL PURCHASE AMOUNT (̀ )100/1
MINIMUM SIP INSTALLMENT AMOUNT (`)1,000/1
LOAD STRUCTUREEntry load - Not applicableExit load - 1% if redeemed / switched - out within 2 years from the date of allotment (w.e.f. 1st July 2013)
FACTSHEETst 31 October 2013
For Statutory Details & Risk Factors please refer page 15.
^ Certificate of Deposit/ Treasury Bill
+ Includes Net Current Assets
NAV per unit (Cum Dividend) Individuals/ HUF Others
Dividend ( Per unit)`
Direct Plan
$ Includes Derivatives
4.60%
ICRA AA
9.27%
Absolute
Return (%)
Sep 29, 2011 to
Sep 28, 2012
10.38%
4.22%
Absolute
Return (%)
Sep 28, 2012 to
Sep 30, 2013
3.22%
5.48%
5.60%
COMPOSITION BY ASSET (%)
7
COMPOSITION BY RATING (%)
PORTFOLIO
Company Name Rating % of
Assets
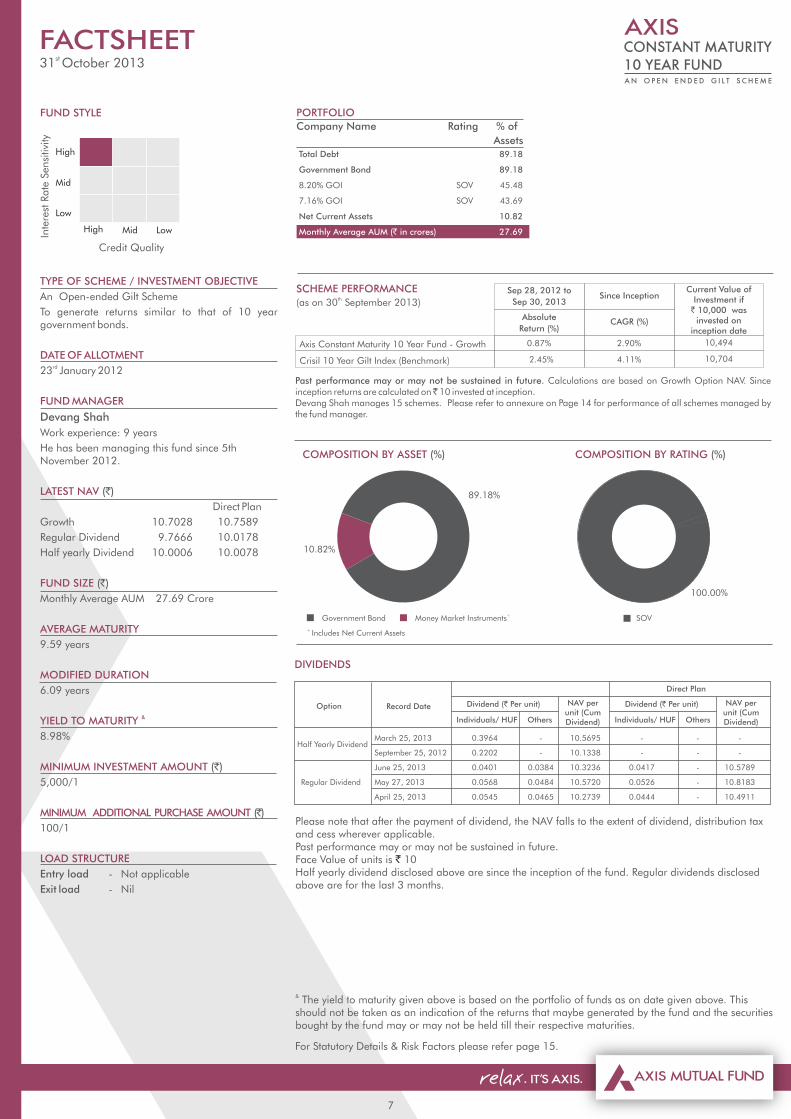
SOV
100.00%
89.18%
10.82%
Government Bond+
Money Market Instruments
DIVIDENDS
Please note that after the payment of dividend, the NAV falls to the extent of dividend, distribution taxand cess wherever applicable.Past performance may or may not be sustained in future.Face Value of units is 10`Half yearly dividend disclosed above are since the inception of the fund. Regular dividends disclosed above are for the last 3 months.
Record Date NAV per unit (Cum Dividend) Individuals/ HUF
Dividend (` Per unit)
Others
Regular Dividend
Option
Half Yearly DividendMarch 25, 2013 0.3964 - 10.5695 - - -
September 25, 2012 0.2202 - 10.1338 - - -
June 25, 2013 0.0401 0.0384 10.3236 0.0417 - 10.5789
May 27, 2013 0.0568 0.0484 10.5720 0.0526 - 10.8183
April 25, 2013 0.0545 0.0465 10.2739 0.0444 - 10.4911
FUND STYLE
TYPE OF SCHEME / INVESTMENT OBJECTIVE
An Open-ended Gilt Scheme
To generate returns similar to that of 10 year government bonds.
DATE OF ALLOTMENTrd23 January 2012
FUND MANAGER
Devang Shah
Work experience: 9 years
He has been managing this fund since 5th November 2012.
LATEST NAV (`)
Direct Plan
Growth 10.7028 10.7589
Regular Dividend 9.7666 10.0178
Half yearly Dividend 10.0006 10.0078
FUND SIZE (`)
Monthly Average AUM 27.69 Crore
AVERAGE MATURITY
9.59 years
MODIFIED DURATION
6.09 years
&YIELD TO MATURITY
8.98%
MINIMUM INVESTMENT AMOUNT (`)
5,000/1
MINIMUM ADDITIONAL PURCHASE AMOUNT (̀ )
100/1
LOAD STRUCTURE
Entry load - Not applicable
Exit load - Nil
High
Mid
Low
Inte
rest
Rate
Sensi
tivi
ty
Credit Quality
High Mid Low
FACTSHEETst 31 October 2013
Total Debt 89.18
Government Bond 89.18
8.20% GOI SOV 45.48
7.16% GOI SOV 43.69
Net Current Assets 10.82
Monthly Average AUM (` in crores) 27.69
For Statutory Details & Risk Factors please refer page 15.
& The yield to maturity given above is based on the portfolio of funds as on date given above. This should not be taken as an indication of the returns that maybe generated by the fund and the securities bought by the fund may or may not be held till their respective maturities.
+ Includes Net Current Assets
NAV per unit (Cum Dividend) Individuals/ HUF
Dividend (` Per unit)
Others
Direct Plan
Past performance may or may not be sustained in future. Calculations are based on Growth Option NAV. Since inception returns are calculated on ̀ 10 invested at inception.Devang Shah manages 15 schemes. Please refer to annexure on Page 14 for performance of all schemes managed by the fund manager.
SCHEME PERFORMANCE th(as on 30 September 2013)
Axis Constant Maturity 10 Year Fund - Growth
Crisil 10 Year Gilt Index (Benchmark)
0.87%
Absolute
Return (%)CAGR (%)
Since Inception
2.90%
Sep 28, 2012 to
Sep 30, 2013
Current Value of Investment if
` 10,000 wasinvested on
inception date
10,494
2.45% 10,7044.11%
PORTFOLIO
Company Name Rating % of
Assets
Company Name Rating % of
Assets
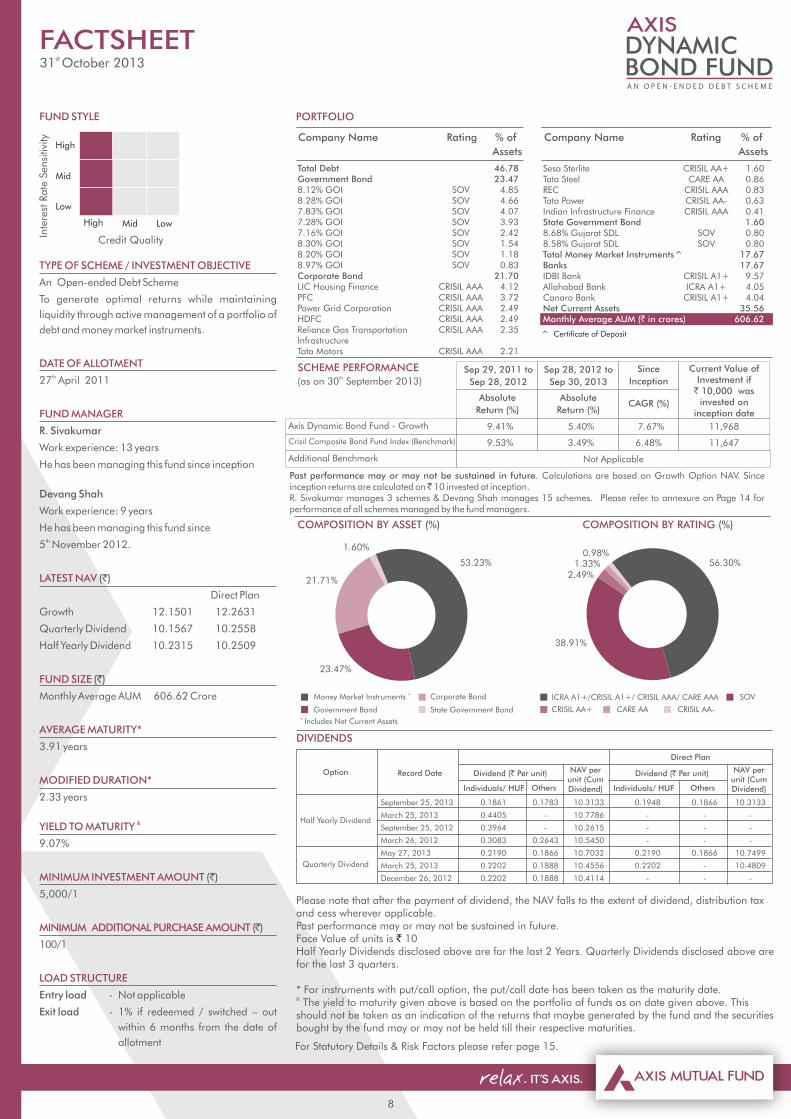
Sesa Sterlite CRISIL AA+ 1.60Tata Steel CARE AA 0.86REC CRISIL AAA 0.83Tata Power CRISIL AA- 0.63Indian Infrastructure Finance CRISIL AAA 0.41State Government Bond 1.608.68% Gujarat SDL SOV 0.808.58% Gujarat SDL SOV 0.80 Total Money Market Instruments^ 17.67Banks 17.67IDBI Bank CRISIL A1+ 9.57Allahabad Bank ICRA A1+ 4.05Canara Bank CRISIL A1+ 4.04 Net Current Assets 35.56Monthly Average AUM (` in crores) 606.62
Total Debt 46.78Government Bond 23.478.12% GOI SOV 4.858.28% GOI SOV 4.667.83% GOI SOV 4.077.28% GOI SOV 3.937.16% GOI SOV 2.428.30% GOI SOV 1.548.20% GOI SOV 1.188.97% GOI SOV 0.83 Corporate Bond 21.70LIC Housing Finance CRISIL AAA 4.12PFC CRISIL AAA 3.72Power Grid Corporation CRISIL AAA 2.49HDFC CRISIL AAA 2.49Reliance Gas Transportation CRISIL AAA 2.35InfrastructureTata Motors CRISIL AAA 2.21
COMPOSITION BY ASSET (%) COMPOSITION BY RATING (%)
8
State Government Bond
1.60%
Please note that after the payment of dividend, the NAV falls to the extent of dividend, distribution taxand cess wherever applicable.Past performance may or may not be sustained in future.Face Value of units is 10`Half Yearly Dividends disclosed above are for the last 2 Years. Quarterly Dividends disclosed above are for the last 3 quarters.
* For instruments with put/call option, the put/call date has been taken as the maturity date.& The yield to maturity given above is based on the portfolio of funds as on date given above. This should not be taken as an indication of the returns that maybe generated by the fund and the securities bought by the fund may or may not be held till their respective maturities.
DIVIDENDS
September 25, 2013 0.1861 0.1783 10.3133 0.1948 0.1866 10.3133
March 25, 2013 0.4405 - 10.7786 - - -
September 25, 2012 0.3964 - 10.2615 - - -
March 26, 2012 0.3083 0.2643 10.5450 - - -
May 27, 2013 0.2190 0.1866 10.7032 0.2190 0.1866 10.7499
March 25, 2013 0.2202 0.1888 10.4556 0.2202 - 10.4809
December 26, 2012 0.2202 0.1888 10.4114 - - -
Record Date NAV per unit (Cum Dividend) Individuals/ HUF
Dividend (` Per unit)
Others
Half Yearly Dividend
Option
53.23%
Quarterly Dividend
1.33%
Government Bond
56.30%
CRISIL AA+
38.91%
Past performance may or may not be sustained in future. Calculations are based on Growth Option NAV. Since inception returns are calculated on ̀ 10 invested at inception.R. Sivakumar manages 3 schemes & Devang Shah manages 15 schemes. Please refer to annexure on Page 14 for performance of all schemes managed by the fund managers.
Inte
rest
Rate
Sensi
tivi
ty
Credit Quality
High Mid Low
FUND STYLE
TYPE OF SCHEME / INVESTMENT OBJECTIVE
An Open-ended Debt Scheme
To generate optimal returns while maintaining
liquidity through active management of a portfolio of
debt and money market instruments.
DATE OF ALLOTMENTth27 April 2011
FUND MANAGER
R. Sivakumar
Work experience: 13 years
He has been managing this fund since inception
Devang Shah
Work experience: 9 years
He has been managing this fund sinceth5 November 2012.
LATEST NAV (`)
Direct Plan
Growth 12.1501 12.2631
Quarterly Dividend 10.1567 10.2558
Half Yearly Dividend 10.2315 10.2509
FUND SIZE (`)
Monthly Average AUM 606.62 Crore
AVERAGE MATURITY*
3.91 years
MODIFIED DURATION*
2.33 years
&YIELD TO MATURITY
9.07%
MINIMUM INVESTMENT AMOUNT (`)
5,000/1
MINIMUM ADDITIONAL PURCHASE AMOUNT ( )̀
100/1
LOAD STRUCTURE
Entry load - Not applicable
Exit load - 1% if redeemed / switched – out
within 6 months from the date of
allotment
High
Mid
Low
23.47%
Corporate Bond
FACTSHEETst 31 October 2013
For Statutory Details & Risk Factors please refer page 15.
+ Includes Net Current Assets
^ Certificate of Deposit
21.71%
ICRA A1+/CRISIL A1+/ CRISIL AAA/ CARE AAA
NAV per unit (Cum Dividend) Individuals/ HUF Others
Dividend (` Per unit)
Direct Plan
CARE AA
SCHEME PERFORMANCE th(as on 30 September 2013)
Crisil Composite Bond Fund Index (Benchmark)
Additional Benchmark
Axis Dynamic Bond Fund - Growth
CAGR (%)
9.53%
9.41% 7.67%
6.48%
Not Applicable
11,647
11,968
Since
Inception
Absolute
Return (%)
Sep 29, 2011 to
Sep 28, 2012
Current Value of Investment if
` 10,000 wasinvested on
inception date
Sep 28, 2012 to
Sep 30, 2013
Absolute
Return (%)
3.49%
5.40%
2.49%
SOV+Money Market Instruments
0.98%
CRISIL AA-
9
COMPOSITION BY ASSET (%) COMPOSITION BY RATING (%)
PORTFOLIO
Company Name Rating % of
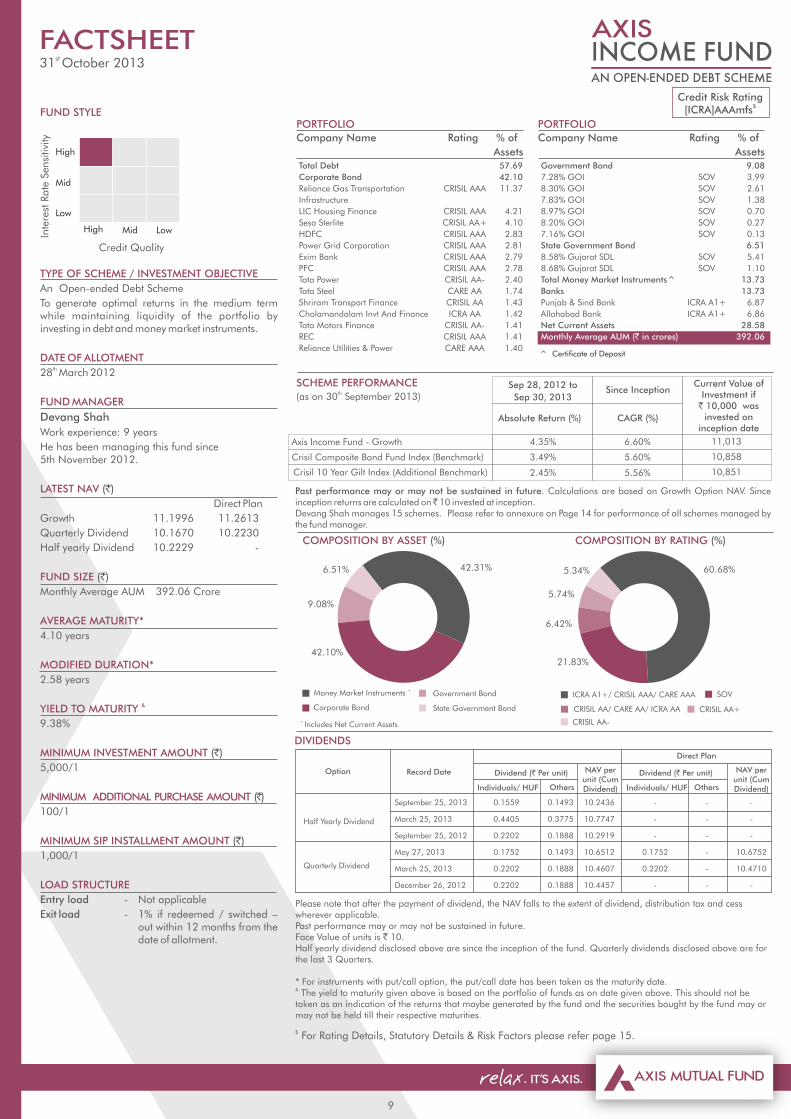
Assets Total Debt 57.69
Corporate Bond 42.10
Reliance Gas Transportation CRISIL AAA 11.37
Infrastructure
LIC Housing Finance CRISIL AAA 4.21
Sesa Sterlite CRISIL AA+ 4.10
HDFC CRISIL AAA 2.83
Power Grid Corporation CRISIL AAA 2.81
Exim Bank CRISIL AAA 2.79
PFC CRISIL AAA 2.78
Tata Power CRISIL AA- 2.40
Tata Steel CARE AA 1.74
Shriram Transport Finance CRISIL AA 1.43
Cholamandalam Invt And Finance ICRA AA 1.42
Tata Motors Finance CRISIL AA- 1.41
REC CRISIL AAA 1.41
Reliance Utilities & Power CARE AAA 1.40
ICRA A1+/ CRISIL AAA/ CARE AAA
21.83%
+Money Market Instruments Government Bond
42.10%
42.31%
SOV
60.68%
DIVIDENDS
PORTFOLIO
Company Name Rating % of
Assets Government Bond 9.08
7.28% GOI SOV 3.99
8.30% GOI SOV 2.61
7.83% GOI SOV 1.38
8.97% GOI SOV 0.70
8.20% GOI SOV 0.27
7.16% GOI SOV 0.13
State Government Bond 6.51
8.58% Gujarat SDL SOV 5.41
8.68% Gujarat SDL SOV 1.10
Total Money Market Instruments^ 13.73
Banks 13.73
Punjab & Sind Bank ICRA A1+ 6.87
Allahabad Bank ICRA A1+ 6.86
Net Current Assets 28.58
Monthly Average AUM (` in crores) 392.06
6.42%
5.74%
5.34%
CRISIL AA/ CARE AA/ ICRA AA
CRISIL AA-
CRISIL AA+
Please note that after the payment of dividend, the NAV falls to the extent of dividend, distribution tax and cess wherever applicable.Past performance may or may not be sustained in future.Face Value of units is ` 10.Half yearly dividend disclosed above are since the inception of the fund. Quarterly dividends disclosed above are for the last 3 Quarters.
* For instruments with put/call option, the put/call date has been taken as the maturity date.& The yield to maturity given above is based on the portfolio of funds as on date given above. This should not be taken as an indication of the returns that maybe generated by the fund and the securities bought by the fund may or may not be held till their respective maturities.
September 25, 2013 0.1559 0.1493 10.2436 - - -
March 25, 2013 0.4405 0.3775 10.7747 - - -
September 25, 2012 0.2202 0.1888 10.2919 - - -
May 27, 2013 0.1752 0.1493 10.6512 0.1752 - 10.6752
March 25, 2013 0.2202 0.1888 10.4607 0.2202 - 10.4710
December 26, 2012 0.2202 0.1888 10.4457 - - -
Record Date NAV per unit (Cum Dividend) Individuals/ HUF
Dividend (` Per unit)
Others
Quarterly Dividend
Option
Half Yearly Dividend
Credit Quality
High Mid Low
FUND STYLE
TYPE OF SCHEME / INVESTMENT OBJECTIVE
An Open-ended Debt Scheme
To generate optimal returns in the medium term while maintaining liquidity of the portfolio by investing in debt and money market instruments.
DATE OF ALLOTMENTth28 March 2012
FUND MANAGER
Devang Shah
Work experience: 9 years
He has been managing this fund since 5th November 2012.
LATEST NAV (`)
Direct Plan
Growth 11.1996 11.2613
Quarterly Dividend 10.1670 10.2230
Half yearly Dividend 10.2229 -
FUND SIZE (`)
Monthly Average AUM 392.06 Crore
AVERAGE MATURITY*
4.10 years
MODIFIED DURATION*
2.58 years
&YIELD TO MATURITY
9.38%
MINIMUM INVESTMENT AMOUNT (`)
5,000/1
MINIMUM ADDITIONAL PURCHASE AMOUNT (̀ )
100/1
MINIMUM SIP INSTALLMENT AMOUNT (`)
1,000/1
LOAD STRUCTURE
Entry load - Not applicable
Exit load - 1% if redeemed / switched – out within 12 months from the date of allotment.
High
Mid
Low
Inte
rest
Rate
Sensi
tivi
tyFACTSHEET
st 31 October 2013
$ For Rating Details, Statutory Details & Risk Factors please refer page 15.
^ Certificate of Deposit
+ Includes Net Current Assets
State Government Bond
Credit Risk Rating$[ICRA]AAAmfs
Individuals/ HUF
Dividend (` Per unit)
Others
NAV per unit (Cum Dividend)
Direct Plan
6.51%
Corporate Bond
Past performance may or may not be sustained in future. Calculations are based on Growth Option NAV. Since inception returns are calculated on ̀ 10 invested at inception.Devang Shah manages 15 schemes. Please refer to annexure on Page 14 for performance of all schemes managed by the fund manager.
SCHEME PERFORMANCE th(as on 30 September 2013)
Absolute Return (%)
Sep 28, 2012 to
Sep 30, 2013
CAGR (%)
Since Inception
5.60%
Axis Income Fund - Growth
Crisil Composite Bond Fund Index (Benchmark)
4.35%
3.49%
6.60%
Current Value of Investment if
` 10,000 wasinvested on
inception date
11,013
10,858
Crisil 10 Year Gilt Index (Additional Benchmark) 5.56%2.45% 10,851
9.08%
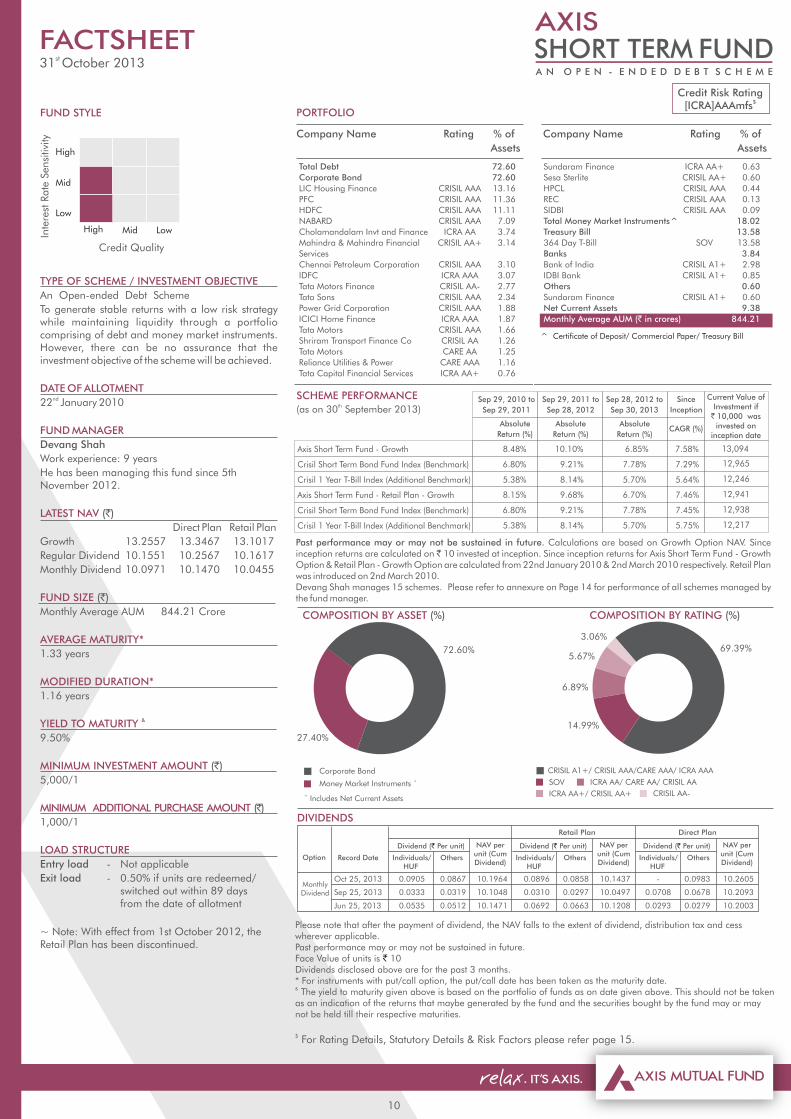
Total Debt 72.60
Corporate Bond 72.60
LIC Housing Finance CRISIL AAA 13.16
PFC CRISIL AAA 11.36
HDFC CRISIL AAA 11.11
NABARD CRISIL AAA 7.09
Cholamandalam Invt and Finance ICRA AA 3.74
Mahindra & Mahindra Financial CRISIL AA+ 3.14
Services
Chennai Petroleum Corporation CRISIL AAA 3.10
IDFC ICRA AAA 3.07
Tata Motors Finance CRISIL AA- 2.77
Tata Sons CRISIL AAA 2.34
Power Grid Corporation CRISIL AAA 1.88
ICICI Home Finance ICRA AAA 1.87
Tata Motors CRISIL AAA 1.66
Shriram Transport Finance Co CRISIL AA 1.26
Tata Motors CARE AA 1.25
Reliance Utilities & Power CARE AAA 1.16
Tata Capital Financial Services ICRA AA+ 0.76
COMPOSITION BY ASSET (%)
PORTFOLIO
Company Name Rating % of
Assets
Company Name Rating % of
Assets
Past performance may or may not be sustained in future. Calculations are based on Growth Option NAV. Since inception returns are calculated on ̀ 10 invested at inception. Since inception returns for Axis Short Term Fund - Growth Option & Retail Plan - Growth Option are calculated from 22nd January 2010 & 2nd March 2010 respectively. Retail Plan was introduced on 2nd March 2010.Devang Shah manages 15 schemes. Please refer to annexure on Page 14 for performance of all schemes managed by the fund manager.
Credit Risk Rating$[ICRA]AAAmfs
Please note that after the payment of dividend, the NAV falls to the extent of dividend, distribution tax and cess wherever applicable.Past performance may or may not be sustained in future. Face Value of units is 10`Dividends disclosed above are for the past 3 months. * For instruments with put/call option, the put/call date has been taken as the maturity date.& The yield to maturity given above is based on the portfolio of funds as on date given above. This should not be taken as an indication of the returns that maybe generated by the fund and the securities bought by the fund may or may not be held till their respective maturities.
SCHEME PERFORMANCE th(as on 30 September 2013)
DIVIDENDS
10
Sundaram Finance ICRA AA+ 0.63
Sesa Sterlite CRISIL AA+ 0.60
HPCL CRISIL AAA 0.44
REC CRISIL AAA 0.13
SIDBI CRISIL AAA 0.09
Total Money Market Instruments^ 18.02
Treasury Bill 13.58
364 Day T-Bill SOV 13.58
Banks 3.84
Bank of India CRISIL A1+ 2.98
IDBI Bank CRISIL A1+ 0.85
Others 0.60
Sundaram Finance CRISIL A1+ 0.60
Net Current Assets 9.38
Monthly Average AUM (` in crores) 844.21
72.60%
+Money Market Instruments
Corporate Bond
COMPOSITION BY RATING (%)
69.39%
Absolute
Return (%)
Absolute
Return (%)
Sep 29, 2010 to
Sep 29, 2011
CAGR (%)
Since
Inception
CRISIL A1+/ CRISIL AAA/CARE AAA/ ICRA AAA
Sep 29, 2011 to
Sep 28, 2012
Individuals/HUF
Record Date
Dividend ( Per unit)`
Others
NAV per unit (Cum Dividend)
Monthly Dividend
Option
Oct 25, 2013 0.0905 0.0867 10.1964 0.0896 0.0858 10.1437 - 0.0983 10.2605
Sep 25, 2013 0.0333 0.0319 10.1048 0.0310 0.0297 10.0497 0.0708 0.0678 10.2093
Jun 25, 2013 0.0535 0.0512 10.1471 0.0692 0.0663 10.1208 0.0293 0.0279 10.2003
Current Value of Investment if
` 10,000 wasinvested on
inception date
Crisil 1 Year T-Bill Index (Additional Benchmark)
Axis Short Term Fund - Growth
Crisil Short Term Bond Fund Index (Benchmark)
Axis Short Term Fund - Retail Plan - Growth
Crisil Short Term Bond Fund Index (Benchmark)
Crisil 1 Year T-Bill Index (Additional Benchmark)
8.48%
6.80%
5.38%
8.15%
6.80%
5.38%
7.58%
7.29%
5.64%
7.46%
7.45%
5.75%
10.10%
9.21%
8.14%
9.68%
9.21%
8.14%
13,094
12,965
12,246
12,941
12,938
12,217
14.99%
ICRA AA/ CARE AA/ CRISIL AA
CRISIL AA-
High
Mid
Low
Inte
rest
Rate
Sensi
tivi
ty
Credit Quality
High Mid Low
FUND STYLE
TYPE OF SCHEME / INVESTMENT OBJECTIVE
An Open-ended Debt Scheme
To generate stable returns with a low risk strategy while maintaining liquidity through a portfolio comprising of debt and money market instruments. However, there can be no assurance that the investment objective of the scheme will be achieved.
DATE OF ALLOTMENTnd22 January 2010
FUND MANAGER
Devang Shah
Work experience: 9 years
He has been managing this fund since 5th November 2012.
LATEST NAV (`)
Direct Plan Retail Plan
Growth 13.2557 13.3467 13.1017
Regular Dividend 10.1551 10.2567 10.1617
Monthly Dividend 10.0971 10.1470 10.0455
FUND SIZE (`)
Monthly Average AUM 844.21 Crore
AVERAGE MATURITY*
1.33 years
MODIFIED DURATION*
1.16 years
&YIELD TO MATURITY
9.50%
MINIMUM INVESTMENT AMOUNT (`)
5,000/1
MINIMUM ADDITIONAL PURCHASE AMOUNT (̀ )
1,000/1
LOAD STRUCTURE
Entry load - Not applicable
Exit load - 0.50% if units are redeemed/ switched out within 89 days from the date of allotment
~ Note: With effect from 1st October 2012, the Retail Plan has been discontinued.
6.89%
5.67%
3.06%
SOV
ICRA AA+/ CRISIL AA+
FACTSHEETst 31 October 2013
^ Certificate of Deposit/ Commercial Paper/ Treasury Bill
+ Includes Net Current Assets
$ For Rating Details, Statutory Details & Risk Factors please refer page 15.
Individuals/HUF
Others
Retail Plan
NAV per unit (Cum Dividend)
Individuals/HUF
Others
Direct Plan
NAV per unit (Cum Dividend)
Dividend ( Per unit)` Dividend ( Per unit)`
Absolute
Return (%)
Sep 28, 2012 to
Sep 30, 2013
6.85%
7.78%
5.70%
6.70%
7.78%
5.70%
27.40%
COMPOSITION BY ASSET (%) COMPOSITION BY RATING (%)
PORTFOLIO
Company Name Rating % of
Assets
DIVIDENDS
ICRA A1+ / CRISIL A1+ / CARE A1+
100.00%
11
+Money Market Instruments
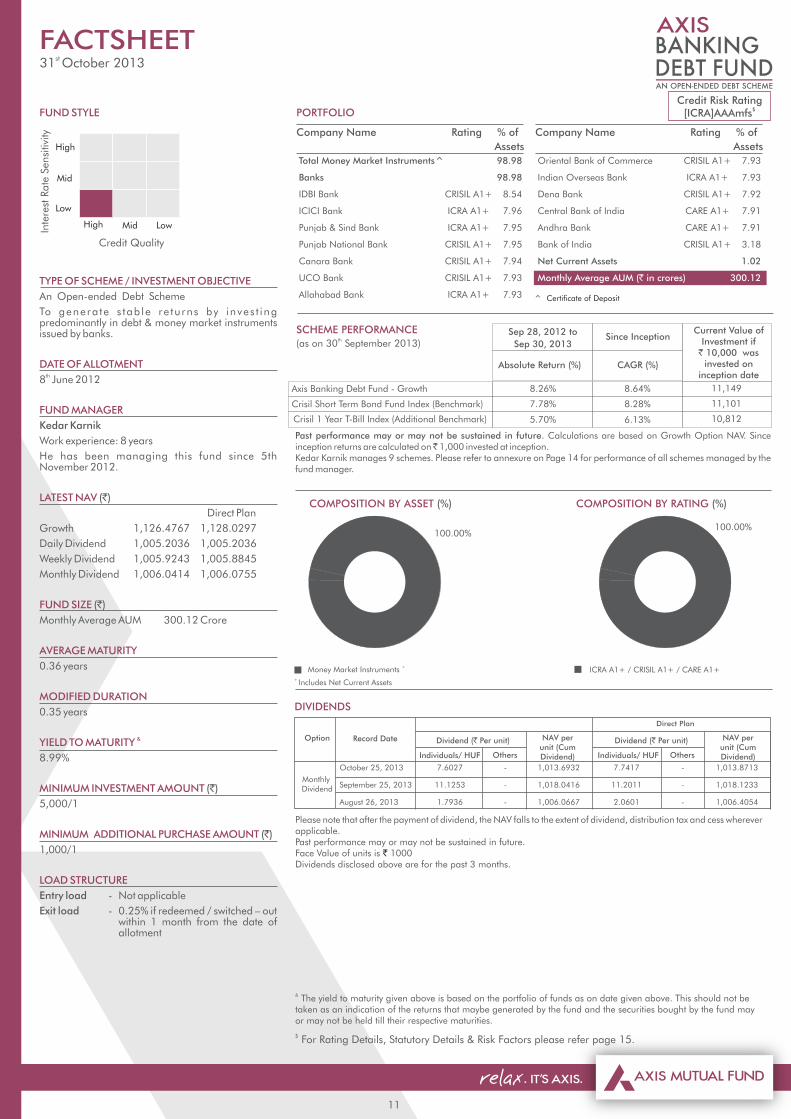
Total Money Market Instruments^ 98.98
Banks 98.98
IDBI Bank CRISIL A1+ 8.54
ICICI Bank ICRA A1+ 7.96
Punjab & Sind Bank ICRA A1+ 7.95
Punjab National Bank CRISIL A1+ 7.95
Canara Bank CRISIL A1+ 7.94
UCO Bank CRISIL A1+ 7.93
Allahabad Bank ICRA A1+ 7.93
Company Name Rating % of
Assets
Oriental Bank of Commerce CRISIL A1+ 7.93
Indian Overseas Bank ICRA A1+ 7.93
Dena Bank CRISIL A1+ 7.92
Central Bank of India CARE A1+ 7.91
Andhra Bank CARE A1+ 7.91
Bank of India CRISIL A1+ 3.18
Net Current Assets 1.02
Monthly Average AUM (` in crores) 300.12
Please note that after the payment of dividend, the NAV falls to the extent of dividend, distribution tax and cess wherever applicable.Past performance may or may not be sustained in future. Face Value of units is 1000`Dividends disclosed above are for the past 3 months.
& The yield to maturity given above is based on the portfolio of funds as on date given above. This should not be taken as an indication of the returns that maybe generated by the fund and the securities bought by the fund may or may not be held till their respective maturities.
High
Low
Inte
rest
Rate
Sensi
tivi
ty
Credit Quality
High Mid Low
FUND STYLE
TYPE OF SCHEME / INVESTMENT OBJECTIVE
An Open-ended Debt Scheme
To genera te s tab le re tu rns by inves t ing predominantly in debt & money market instruments issued by banks.
DATE OF ALLOTMENTth8 June 2012
FUND MANAGER
Kedar Karnik
Work experience: 8 years
He has been managing this fund since 5th November 2012.
LATEST NAV (`)
Direct Plan
Growth 1,126.4767 1,128.0297
Daily Dividend 1,005.2036 1,005.2036
Weekly Dividend 1,005.9243 1,005.8845
Monthly Dividend 1,006.0414 1,006.0755
FUND SIZE (`)
Monthly Average AUM 300.12 Crore
AVERAGE MATURITY
0.36 years
MODIFIED DURATION
0.35 years
&YIELD TO MATURITY
8.99%
MINIMUM INVESTMENT AMOUNT (`)
5,000/1
MINIMUM ADDITIONAL PURCHASE AMOUNT (`)
1,000/1
LOAD STRUCTURE
Entry load - Not applicable
Exit load - 0.25% if redeemed / switched – out within 1 month from the date of allotment
Mid
FACTSHEETst 31 October 2013
100.00%
Credit Risk Rating$[ICRA]AAAmfs
$ For Rating Details, Statutory Details & Risk Factors please refer page 15.
+ Includes Net Current Assets
October 25, 2013 7.6027 - 1,013.6932 7.7417 - 1,013.8713
September 25, 2013 11.1253 - 1,018.0416 11.2011 - 1,018.1233
August 26, 2013 1.7936 - 1,006.0667 2.0601 - 1,006.4054
Direct Plan
Record Date NAV per unit (Cum Dividend) Individuals/ HUF
Dividend (` Per unit)
Others
Monthly Dividend
Option
Individuals/ HUF Others
NAV per unit (Cum Dividend)
Dividend (` Per unit)
^ Certificate of Deposit
Past performance may or may not be sustained in future. Calculations are based on Growth Option NAV. Since inception returns are calculated on ̀ 1,000 invested at inception.Kedar Karnik manages 9 schemes. Please refer to annexure on Page 14 for performance of all schemes managed by the fund manager.
SCHEME PERFORMANCE th(as on 30 September 2013)
Absolute Return (%)
Sep 28, 2012 to
Sep 30, 2013
CAGR (%)
Since Inception
8.28%
Axis Banking Debt Fund - Growth
Crisil Short Term Bond Fund Index (Benchmark)
8.26%
7.78%
8.64%
Current Value of Investment if
` 10,000 wasinvested on
inception date
11,149
11,101
Crisil 1 Year T-Bill Index (Additional Benchmark) 6.13%5.70% 10,812
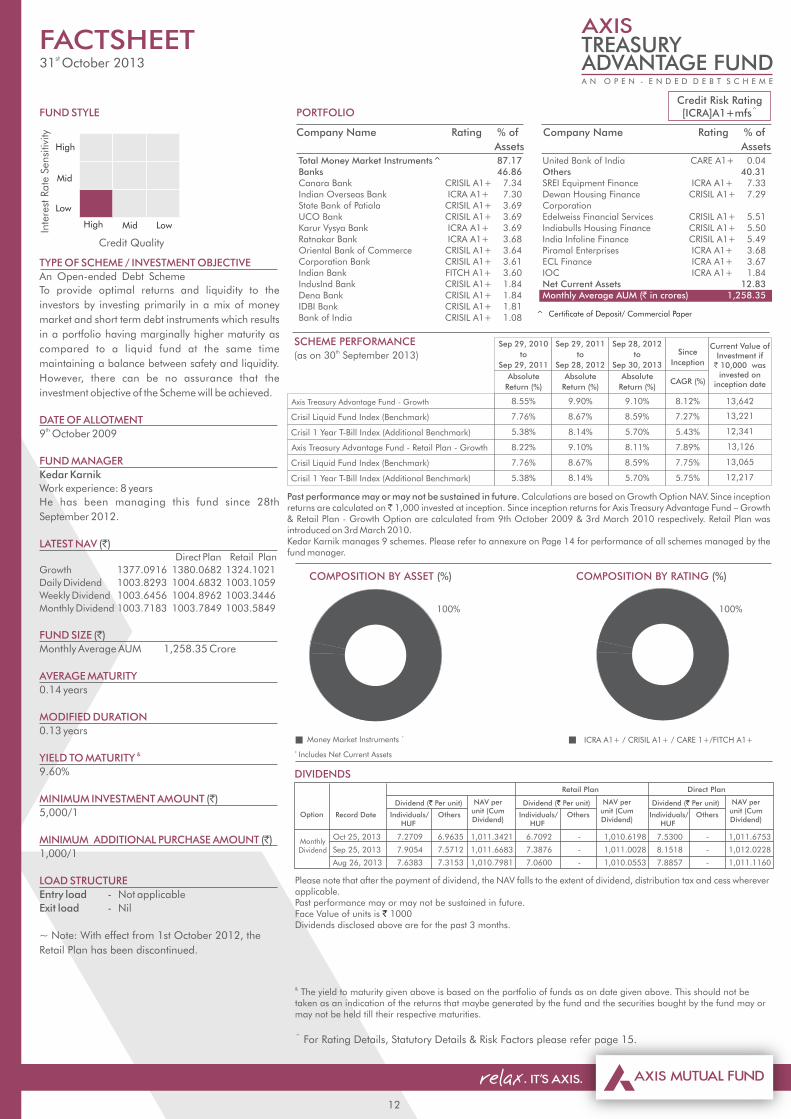
Total Money Market Instruments^ 87.17Banks 46.86Canara Bank CRISIL A1+ 7.34Indian Overseas Bank ICRA A1+ 7.30State Bank of Patiala CRISIL A1+ 3.69UCO Bank CRISIL A1+ 3.69Karur Vysya Bank ICRA A1+ 3.69Ratnakar Bank ICRA A1+ 3.68Oriental Bank of Commerce CRISIL A1+ 3.64Corporation Bank CRISIL A1+ 3.61Indian Bank FITCH A1+ 3.60IndusInd Bank CRISIL A1+ 1.84Dena Bank CRISIL A1+ 1.84IDBI Bank CRISIL A1+ 1.81Bank of India CRISIL A1+ 1.08
SCHEME PERFORMANCE th(as on 30 September 2013)
Credit Risk Rating^[ICRA]A1+mfs
COMPOSITION BY ASSET (%) COMPOSITION BY RATING (%)
PORTFOLIO
Company Name Rating % of
Assets
Company Name Rating % of
Assets
Past performance may or may not be sustained in future. Calculations are based on Growth Option NAV. Since inception returns are calculated on ̀ 1,000 invested at inception. Since inception returns for Axis Treasury Advantage Fund – Growth & Retail Plan - Growth Option are calculated from 9th October 2009 & 3rd March 2010 respectively. Retail Plan was introduced on 3rd March 2010.Kedar Karnik manages 9 schemes. Please refer to annexure on Page 14 for performance of all schemes managed by the fund manager.
Please note that after the payment of dividend, the NAV falls to the extent of dividend, distribution tax and cess wherever applicable.Past performance may or may not be sustained in future. Face Value of units is 1000`Dividends disclosed above are for the past 3 months.
& The yield to maturity given above is based on the portfolio of funds as on date given above. This should not be taken as an indication of the returns that maybe generated by the fund and the securities bought by the fund may or may not be held till their respective maturities.
DIVIDENDS
ICRA A1+ / CRISIL A1+ / CARE 1+/FITCH A1+
United Bank of India CARE A1+ 0.04 Others 40.31SREI Equipment Finance ICRA A1+ 7.33Dewan Housing Finance CRISIL A1+ 7.29Corporation Edelweiss Financial Services CRISIL A1+ 5.51Indiabulls Housing Finance CRISIL A1+ 5.50India Infoline Finance CRISIL A1+ 5.49Piramal Enterprises ICRA A1+ 3.68ECL Finance ICRA A1+ 3.67IOC ICRA A1+ 1.84 Net Current Assets 12.83Monthly Average AUM (` in crores) 1,258.35
12
100%
+Money Market Instruments
CAGR (%)
Since
Inception
Current Value of Investment if
` 10,000 wasinvested on
inception date
Crisil 1 Year T-Bill Index (Additional Benchmark)
Axis Treasury Advantage Fund - Growth
Crisil Liquid Fund Index (Benchmark)
Axis Treasury Advantage Fund - Retail Plan - Growth
Crisil Liquid Fund Index (Benchmark)
Crisil 1 Year T-Bill Index (Additional Benchmark)
Absolute
Return (%)
Sep 29, 2010
to
Sep 29, 2011
8.55%
7.76%
5.38%
13,642
13,221
12,341
13,126
13,065
12,217
High
Low
Inte
rest
Rate
Sensi
tivi
ty
Credit Quality
High Mid Low
FUND STYLE
TYPE OF SCHEME / INVESTMENT OBJECTIVE
An Open-ended Debt Scheme
To provide optimal returns and liquidity to the
investors by investing primarily in a mix of money
market and short term debt instruments which results
in a portfolio having marginally higher maturity as
compared to a liquid fund at the same time
maintaining a balance between safety and liquidity.
However, there can be no assurance that the
investment objective of the Scheme will be achieved.
DATE OF ALLOTMENTth9 October 2009
FUND MANAGER
Kedar Karnik
Work experience: 8 years
He has been managing this fund since 28th
September 2012.
LATEST NAV (`) Direct Plan Retail Plan
Growth 1377.0916 1380.0682 1324.1021
Daily Dividend 1003.8293 1004.6832 1003.1059
Weekly Dividend 1003.6456 1004.8962 1003.3446
Monthly Dividend 1003.7183 1003.7849 1003.5849
FUND SIZE (`)
Monthly Average AUM 1,258.35 Crore
AVERAGE MATURITY
0.14 years
MODIFIED DURATION
0.13 years
&YIELD TO MATURITY
9.60%
MINIMUM INVESTMENT AMOUNT (`)
5,000/1
MINIMUM ADDITIONAL PURCHASE AMOUNT (`)
1,000/1
LOAD STRUCTURE
Entry load - Not applicable
Exit load - Nil
~ Note: With effect from 1st October 2012, the
Retail Plan has been discontinued.
Mid
FACTSHEETst 31 October 2013
Absolute
Return (%)
Sep 29, 2011
to
Sep 28, 2012
9.90%
8.67%
8.14%
9.10%
8.67%
8.14%
Absolute
Return (%)
Sep 28, 2012
to
Sep 30, 2013
9.10%
8.59%
5.70%
8.11%
8.59%
5.70%
8.12%
7.27%
5.43%
7.89%
7.75%
5.75%
^ Certificate of Deposit/ Commercial Paper
+ Includes Net Current Assets
^ For Rating Details, Statutory Details & Risk Factors please refer page 15.
Individuals/HUF
Record Date
Dividend ( Per unit)`
Others
NAV per unit (Cum Dividend)
Monthly Dividend
Option Individuals/HUF
Others
Retail Plan
NAV per unit (Cum Dividend)
Individuals/HUF
Others
Direct Plan
NAV per unit (Cum Dividend)
Dividend ( Per unit)` Dividend ( Per unit)`
Oct 25, 2013 7.2709 6.9635 1,011.3421 6.7092 - 1,010.6198 7.5300 - 1,011.6753
Sep 25, 2013 7.9054 7.5712 1,011.6683 7.3876 - 1,011.0028 8.1518 - 1,012.0228
Aug 26, 2013 7.6383 7.3153 1,010.7981 7.0600 - 1,010.0553 7.8857 - 1,011.1160
8.22%
7.76%
5.38%
100%
SCHEME PERFORMANCE th(as on 30 September 2013)
PORTFOLIO
Credit Risk Rating^[ICRA]A1+mfs
Company Name Rating % of
Assets
Company Name Rating % of
Assets
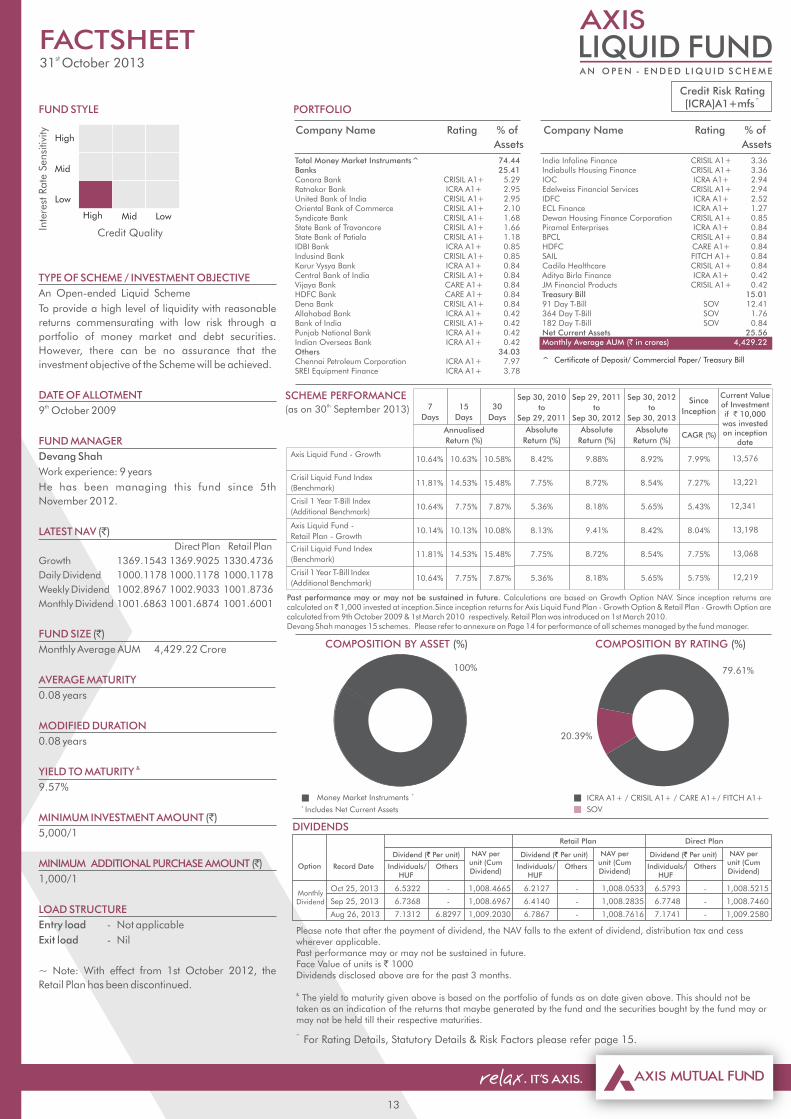
India Infoline Finance CRISIL A1+ 3.36Indiabulls Housing Finance CRISIL A1+ 3.36IOC ICRA A1+ 2.94Edelweiss Financial Services CRISIL A1+ 2.94IDFC ICRA A1+ 2.52ECL Finance ICRA A1+ 1.27Dewan Housing Finance Corporation CRISIL A1+ 0.85Piramal Enterprises ICRA A1+ 0.84BPCL CRISIL A1+ 0.84HDFC CARE A1+ 0.84SAIL FITCH A1+ 0.84Cadila Healthcare CRISIL A1+ 0.84Aditya Birla Finance ICRA A1+ 0.42JM Financial Products CRISIL A1+ 0.42Treasury Bill 15.0191 Day T-Bill SOV 12.41364 Day T-Bill SOV 1.76182 Day T-Bill SOV 0.84 Net Current Assets 25.56Monthly Average AUM (` in crores) 4,429.22
Total Money Market Instruments^ 74.44Banks 25.41Canara Bank CRISIL A1+ 5.29Ratnakar Bank ICRA A1+ 2.95United Bank of India CRISIL A1+ 2.95Oriental Bank of Commerce CRISIL A1+ 2.10Syndicate Bank CRISIL A1+ 1.68State Bank of Travancore CRISIL A1+ 1.66State Bank of Patiala CRISIL A1+ 1.18IDBI Bank ICRA A1+ 0.85Indusind Bank CRISIL A1+ 0.85Karur Vysya Bank ICRA A1+ 0.84Central Bank of India CRISIL A1+ 0.84Vijaya Bank CARE A1+ 0.84HDFC Bank CARE A1+ 0.84Dena Bank CRISIL A1+ 0.84Allahabad Bank ICRA A1+ 0.42Bank of India CRISIL A1+ 0.42Punjab National Bank ICRA A1+ 0.42Indian Overseas Bank ICRA A1+ 0.42 Others 34.03Chennai Petroleum Corporation ICRA A1+ 7.97SREI Equipment Finance ICRA A1+ 3.78
COMPOSITION BY ASSET (%)
Past performance may or may not be sustained in future. Calculations are based on Growth Option NAV. Since inception returns are calculated on ̀ 1,000 invested at inception.Since inception returns for Axis Liquid Fund Plan - Growth Option & Retail Plan - Growth Option are calculated from 9th October 2009 & 1st March 2010 respectively. Retail Plan was introduced on 1st March 2010.Devang Shah manages 15 schemes. Please refer to annexure on Page 14 for performance of all schemes managed by the fund manager.
& The yield to maturity given above is based on the portfolio of funds as on date given above. This should not be taken as an indication of the returns that maybe generated by the fund and the securities bought by the fund may or may not be held till their respective maturities.
ICRA A1+ / CRISIL A1+ / CARE A1+/ FITCH A1+
13
+Money Market Instruments
8.42%
7.75%
5.36%
CAGR (%)
Since
Inception
Sep 30, 2010
to
Sep 29, 2011
Absolute
Return (%)
Axis Liquid Fund - Growth
Crisil Liquid Fund Index
(Benchmark)
Crisil 1 Year T-Bill Index
(Additional Benchmark)
10.64%
11.81%
10.64%
10.14%
11.81%
10.64%
10.58%
15.48%
7.87%
10.08%
15.48%
7.87%
7
Days
15
Days
30
Days
Annualised
Return (%)
Crisil 1 Year T-Bill Index
(Additional Benchmark)
Crisil Liquid Fund Index
(Benchmark)
Axis Liquid Fund -
Retail Plan - Growth
Current Valueof Investment if ` 10,000was investedon inception
date
100%
COMPOSITION BY RATING (%)
20.39%
High
Mid
Low
Inte
rest
Rate
Sensi
tivi
ty
Credit Quality
High Mid Low
FUND STYLE
TYPE OF SCHEME / INVESTMENT OBJECTIVE
An Open-ended Liquid Scheme
To provide a high level of liquidity with reasonable
returns commensurating with low risk through a
portfolio of money market and debt securities.
However, there can be no assurance that the
investment objective of the Scheme will be achieved.
DATE OF ALLOTMENTth9 October 2009
FUND MANAGER
Devang Shah
Work experience: 9 years
He has been managing this fund since 5th
November 2012.
LATEST NAV (`)
Direct Plan Retail Plan
Growth 1369.1543 1369.9025 1330.4736
Daily Dividend 1000.1178 1000.1178 1000.1178
Weekly Dividend 1002.8967 1002.9033 1001.8736
Monthly Dividend 1001.6863 1001.6874 1001.6001
FUND SIZE (`)
Monthly Average AUM 4,429.22 Crore
AVERAGE MATURITY
0.08 years
MODIFIED DURATION
0.08 years
&YIELD TO MATURITY
9.57%
MINIMUM INVESTMENT AMOUNT (`)
5,000/1
MINIMUM ADDITIONAL PURCHASE AMOUNT ( )̀
1,000/1
LOAD STRUCTURE
Entry load - Not applicable
Exit load - Nil
~ Note: With effect from 1st October 2012, the
Retail Plan has been discontinued.
FACTSHEETst 31 October 2013
Sep 29, 2011
to
Sep 30, 2012
Sep 30, 2012
to
Sep 30, 2013
Absolute
Return (%)
Absolute
Return (%)
9.88%
8.72%
8.18%
9.41%
8.72%
8.18%
8.92%
8.54%
5.65%
8.42%
8.54%
5.65%
7.99%
7.27%
8.04%
7.75%
5.75%
5.43%
13,576
13,221
12,341
13,198
13,068
12,219
+ Includes Net Current Assets
^ Certificate of Deposit/ Commercial Paper/ Treasury Bill
^ For Rating Details, Statutory Details & Risk Factors please refer page 15.
Individuals/HUF
Record Date
Dividend ( Per unit)`
Others
NAV per unit (Cum Dividend)
Monthly Dividend
Option Individuals/HUF
Others
Retail Plan
NAV per unit (Cum Dividend)
Individuals/HUF
Others
Direct Plan
NAV per unit (Cum Dividend)
Dividend ( Per unit)` Dividend ( Per unit)`
Oct 25, 2013 6.5322 - 1,008.4665 6.2127 - 1,008.0533 6.5793 - 1,008.5215
Sep 25, 2013 6.7368 - 1,008.6967 6.4140 - 1,008.2835 6.7748 - 1,008.7460
Aug 26, 2013 7.1312 6.8297 1,009.2030 6.7867 - 1,008.7616 7.1741 - 1,009.2580
DIVIDENDS
8.13%
7.75%
5.36%
79.61%
SOV
10.63%
14.53%
7.75%
10.13%
14.53%
7.75%
Please note that after the payment of dividend, the NAV falls to the extent of dividend, distribution tax and cess wherever applicable.Past performance may or may not be sustained in future. Face Value of units is ` 1000Dividends disclosed above are for the past 3 months.
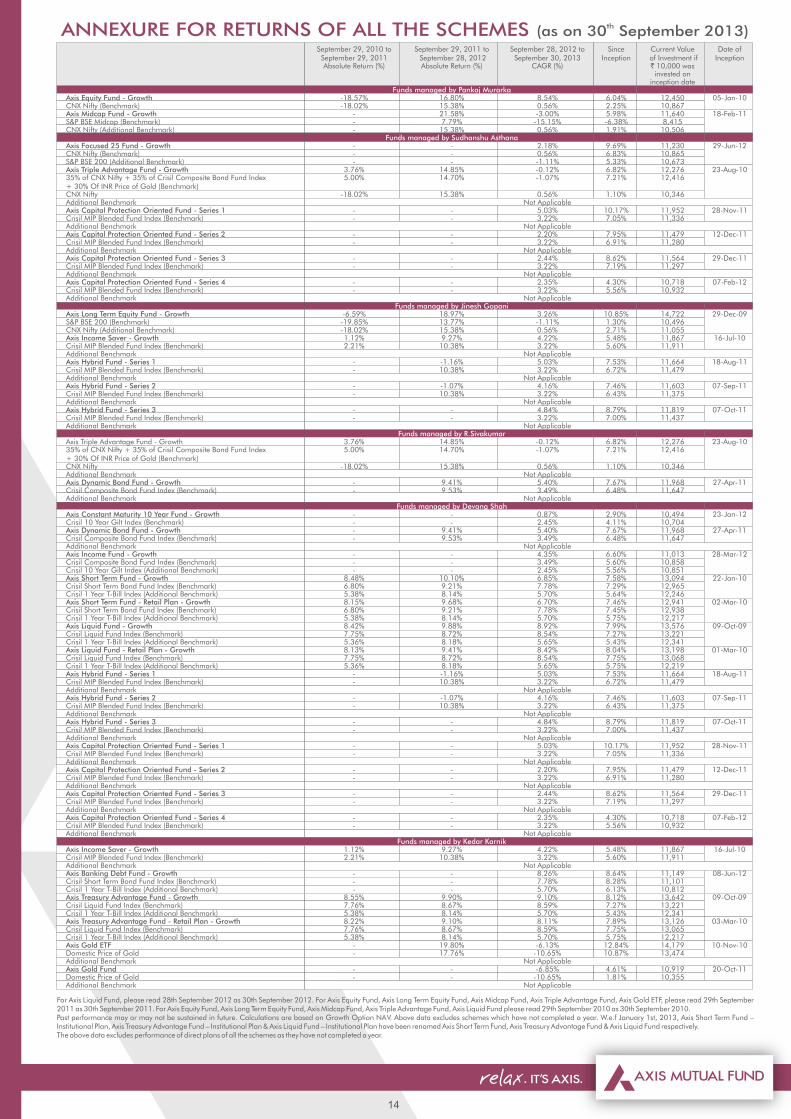
ANNEXURE FOR RETURNS OF ALL THE SCHEMES th(as on 30 September 2013)
14
For Axis Liquid Fund, please read 28th September 2012 as 30th September 2012. For Axis Equity Fund, Axis Long Term Equity Fund, Axis Midcap Fund, Axis Triple Advantage Fund, Axis Gold ETF, please read 29th September 2011 as 30th September 2011. For Axis Equity Fund, Axis Long Term Equity Fund, Axis Midcap Fund, Axis Triple Advantage Fund, Axis Liquid Fund please read 29th September 2010 as 30th September 2010.Past performance may or may not be sustained in future. Calculations are based on Growth Option NAV. Above data excludes schemes which have not completed a year. W.e.f January 1st, 2013, Axis Short Term Fund – Institutional Plan, Axis Treasury Advantage Fund – Institutional Plan & Axis Liquid Fund – Institutional Plan have been renamed Axis Short Term Fund, Axis Treasury Advantage Fund & Axis Liquid Fund respectively.The above data excludes performance of direct plans of all the schemes as they have not completed a year.
September 29, 2010 to September 29, 2011 to September 28, 2012 to Since Current Value Date of September 29, 2011 September 28, 2012 September 30, 2013 Inception of Investment if Inception Absolute Return (%) Absolute Return (%) CAGR (%) ` 10,000 was invested on inception date Funds managed by Pankaj Murarka Axis Equity Fund - Growth -18.57% 16.80% 8.54% 6.04% 12,450 05-Jan-10CNX Nifty (Benchmark) -18.02% 15.38% 0.56% 2.25% 10,867 Axis Midcap Fund - Growth - 21.58% -3.00% 5.98% 11,640 18-Feb-11S&P BSE Midcap (Benchmark) - 7.79% -15.15% -6.38% 8,415 CNX Nifty (Additional Benchmark) - 15.38% 0.56% 1.91% 10,506 Funds managed by Sudhanshu Asthana Axis Focused 25 Fund - Growth - - 2.18% 9.69% 11,230 29-Jun-12CNX Nifty (Benchmark) - - 0.56% 6.83% 10,865 S&P BSE 200 (Additional Benchmark) - - -1.11% 5.33% 10,673 Axis Triple Advantage Fund - Growth 3.76% 14.85% -0.12% 6.82% 12,276 23-Aug-1035% of CNX Nifty + 35% of Crisil Composite Bond Fund Index 5.00% 14.70% -1.07% 7.21% 12,416 + 30% Of INR Price of Gold (Benchmark)CNX Nifty -18.02% 15.38% 0.56% 1.10% 10,346 Additional Benchmark Not Applicable Axis Capital Protection Oriented Fund - Series 1 - - 5.03% 10.17% 11,952 28-Nov-11Crisil MIP Blended Fund Index (Benchmark) - - 3.22% 7.05% 11,336 Additional Benchmark Not Applicable Axis Capital Protection Oriented Fund - Series 2 - - 2.20% 7.95% 11,479 12-Dec-11Crisil MIP Blended Fund Index (Benchmark) - - 3.22% 6.91% 11,280 Additional Benchmark Not Applicable Axis Capital Protection Oriented Fund - Series 3 - - 2.44% 8.62% 11,564 29-Dec-11Crisil MIP Blended Fund Index (Benchmark) - - 3.22% 7.19% 11,297 Additional Benchmark Not Applicable Axis Capital Protection Oriented Fund - Series 4 - - 2.35% 4.30% 10,718 07-Feb-12Crisil MIP Blended Fund Index (Benchmark) - - 3.22% 5.56% 10,932 Additional Benchmark Not Applicable Funds managed by Jinesh Gopani Axis Long Term Equity Fund - Growth -6.59% 18.97% 3.26% 10.85% 14,722 29-Dec-09S&P BSE 200 (Benchmark) -19.85% 13.77% -1.11% 1.30% 10,496 CNX Nifty (Additional Benchmark) -18.02% 15.38% 0.56% 2.71% 11,055 Axis Income Saver - Growth 1.12% 9.27% 4.22% 5.48% 11,867 16-Jul-10Crisil MIP Blended Fund Index (Benchmark) 2.21% 10.38% 3.22% 5.60% 11,911 Additional Benchmark Not Applicable Axis Hybrid Fund - Series 1 - -1.16% 5.03% 7.53% 11,664 18-Aug-11Crisil MIP Blended Fund Index (Benchmark) - 10.38% 3.22% 6.72% 11,479 Additional Benchmark Not Applicable Axis Hybrid Fund - Series 2 - -1.07% 4.16% 7.46% 11,603 07-Sep-11Crisil MIP Blended Fund Index (Benchmark) - 10.38% 3.22% 6.43% 11,375 Additional Benchmark Not Applicable Axis Hybrid Fund - Series 3 - - 4.84% 8.79% 11,819 07-Oct-11Crisil MIP Blended Fund Index (Benchmark) - - 3.22% 7.00% 11,437 Additional Benchmark Not Applicable Funds managed by R.Sivakumar Axis Triple Advantage Fund - Growth 3.76% 14.85% -0.12% 6.82% 12,276 23-Aug-1035% of CNX Nifty + 35% of Crisil Composite Bond Fund Index 5.00% 14.70% -1.07% 7.21% 12,416 + 30% Of INR Price of Gold (Benchmark)CNX Nifty -18.02% 15.38% 0.56% 1.10% 10,346 Additional Benchmark Not Applicable Axis Dynamic Bond Fund - Growth - 9.41% 5.40% 7.67% 11,968 27-Apr-11Crisil Composite Bond Fund Index (Benchmark) - 9.53% 3.49% 6.48% 11,647 Additional Benchmark Not Applicable Funds managed by Devang Shah Axis Constant Maturity 10 Year Fund - Growth - - 0.87% 2.90% 10,494 23-Jan-12Crisil 10 Year Gilt Index (Benchmark) - - 2.45% 4.11% 10,704 Axis Dynamic Bond Fund - Growth - 9.41% 5.40% 7.67% 11,968 27-Apr-11Crisil Composite Bond Fund Index (Benchmark) - 9.53% 3.49% 6.48% 11,647 Additional Benchmark Not Applicable Axis Income Fund - Growth - - 4.35% 6.60% 11,013 28-Mar-12Crisil Composite Bond Fund Index (Benchmark) - - 3.49% 5.60% 10,858 Crisil 10 Year Gilt Index (Additional Benchmark) - - 2.45% 5.56% 10,851 Axis Short Term Fund - Growth 8.48% 10.10% 6.85% 7.58% 13,094 22-Jan-10Crisil Short Term Bond Fund Index (Benchmark) 6.80% 9.21% 7.78% 7.29% 12,965 Crisil 1 Year T-Bill Index (Additional Benchmark) 5.38% 8.14% 5.70% 5.64% 12,246 Axis Short Term Fund - Retail Plan - Growth 8.15% 9.68% 6.70% 7.46% 12,941 02-Mar-10Crisil Short Term Bond Fund Index (Benchmark) 6.80% 9.21% 7.78% 7.45% 12,938 Crisil 1 Year T-Bill Index (Additional Benchmark) 5.38% 8.14% 5.70% 5.75% 12,217 Axis Liquid Fund - Growth 8.42% 9.88% 8.92% 7.99% 13,576 09-Oct-09Crisil Liquid Fund Index (Benchmark) 7.75% 8.72% 8.54% 7.27% 13,221 Crisil 1 Year T-Bill Index (Additional Benchmark) 5.36% 8.18% 5.65% 5.43% 12,341 Axis Liquid Fund - Retail Plan - Growth 8.13% 9.41% 8.42% 8.04% 13,198 01-Mar-10Crisil Liquid Fund Index (Benchmark) 7.75% 8.72% 8.54% 7.75% 13,068 Crisil 1 Year T-Bill Index (Additional Benchmark) 5.36% 8.18% 5.65% 5.75% 12,219 Axis Hybrid Fund - Series 1 - -1.16% 5.03% 7.53% 11,664 18-Aug-11Crisil MIP Blended Fund Index (Benchmark) - 10.38% 3.22% 6.72% 11,479 Additional Benchmark Not Applicable Axis Hybrid Fund - Series 2 - -1.07% 4.16% 7.46% 11,603 07-Sep-11Crisil MIP Blended Fund Index (Benchmark) - 10.38% 3.22% 6.43% 11,375 Additional Benchmark Not Applicable Axis Hybrid Fund - Series 3 - - 4.84% 8.79% 11,819 07-Oct-11Crisil MIP Blended Fund Index (Benchmark) - - 3.22% 7.00% 11,437 Additional Benchmark Not Applicable Axis Capital Protection Oriented Fund - Series 1 - - 5.03% 10.17% 11,952 28-Nov-11Crisil MIP Blended Fund Index (Benchmark) - - 3.22% 7.05% 11,336 Additional Benchmark Not Applicable Axis Capital Protection Oriented Fund - Series 2 - - 2.20% 7.95% 11,479 12-Dec-11Crisil MIP Blended Fund Index (Benchmark) - - 3.22% 6.91% 11,280 Additional Benchmark Not Applicable Axis Capital Protection Oriented Fund - Series 3 - - 2.44% 8.62% 11,564 29-Dec-11Crisil MIP Blended Fund Index (Benchmark) - - 3.22% 7.19% 11,297 Additional Benchmark Not Applicable Axis Capital Protection Oriented Fund - Series 4 - - 2.35% 4.30% 10,718 07-Feb-12Crisil MIP Blended Fund Index (Benchmark) - - 3.22% 5.56% 10,932 Additional Benchmark Not Applicable Funds managed by Kedar Karnik Axis Income Saver - Growth 1.12% 9.27% 4.22% 5.48% 11,867 16-Jul-10Crisil MIP Blended Fund Index (Benchmark) 2.21% 10.38% 3.22% 5.60% 11,911 Additional Benchmark Not Applicable Axis Banking Debt Fund - Growth - - 8.26% 8.64% 11,149 08-Jun-12Crisil Short Term Bond Fund Index (Benchmark) - - 7.78% 8.28% 11,101 Crisil 1 Year T-Bill Index (Additional Benchmark) - - 5.70% 6.13% 10,812 Axis Treasury Advantage Fund - Growth 8.55% 9.90% 9.10% 8.12% 13,642 09-Oct-09Crisil Liquid Fund Index (Benchmark) 7.76% 8.67% 8.59% 7.27% 13,221 Crisil 1 Year T-Bill Index (Additional Benchmark) 5.38% 8.14% 5.70% 5.43% 12,341 Axis Treasury Advantage Fund - Retail Plan - Growth 8.22% 9.10% 8.11% 7.89% 13,126 03-Mar-10Crisil Liquid Fund Index (Benchmark) 7.76% 8.67% 8.59% 7.75% 13,065 Crisil 1 Year T-Bill Index (Additional Benchmark) 5.38% 8.14% 5.70% 5.75% 12,217 Axis Gold ETF - 19.80% -6.13% 12.84% 14,179 10-Nov-10Domestic Price of Gold - 17.76% -10.65% 10.87% 13,474 Additional Benchmark Not Applicable Axis Gold Fund - - -6.85% 4.61% 10,919 20-Oct-11Domestic Price of Gold - - -10.65% 1.81% 10,355 Additional Benchmark Not Applicable
$ Rating Details (Axis Income Fund, Axis Short Term Fund & Axis Banking Debt Fund)Schemes with this rating are considered to have the highest degree of safety regarding timely receipt of payments from the
investments that they have made. This rating should however, not be construed as an indication of the performance of the
Mutual Fund scheme or of volatility in its returns. The rating should not be treated as a recommendation to buy, sell or hold
units issued by the Mutual Fund.
^ Rating Details (Axis Treasury Advantage Fund and Axis Liquid Fund)
Schemes with this rating are considered to have very strong degree of safety regarding timely receipt of payments from
the investments that they have made. This rating should however, not be construed as an indication of the performance of
the Mutual Fund scheme or of volatility in its returns. The rating should not be treated as a recommendation to buy, sell or
hold units issued by the Mutual Fund.
Axis Asset Management Company Limited (Axis AMC) signed an agreement with an offshore fund manager to provide
Non - binding advisory and related services in respect of offshore funds investing in India in February 2013. Axis AMC
commenced providing non - binding investment advisory services in respect of a specific fund w.e.f. September 10, 2013.
Mr. Pankaj Murarka (Fund Manager) shall be providing the investment advice on behalf of Axis AMC. Mr. Murarka is the
fund manager of Axis Equity Fund and Axis Midcap Fund. Axis AMC shall continue to provide market wide advisory
services, sharing of research and analytical information etc. to the offshore fund manager. In compliance with the SEBI
Circular dated February 28, 2012, the AMC shall ensure that it appropriately addresses the issue of conflict of interest, if
any, where the fund manager managing the schemes of Axis Mutual Fund is providing non-binding advisory and related
services.
Statutory Details & Disclaimers : Axis Mutual Fund has been established as a Trust under the Indian Trusts Act, 1882, sponsored by Axis Bank Ltd. (liability
restricted to ` 1 Lakh). Trustee: Axis Mutual Fund Trustee Limited Investment Manager: Axis Asset Management
Company Limited (the AMC). Risk Factors: Axis Bank Limited is not liable or responsible for any loss or shortfall resulting
from the operation of any of the mutual fund schemes launched by the AMC. Mutual Fund Investments are subject to
market risks, read all scheme related documents carefully.
To know more about us, please refer to our website.
15
FACTSHEETst 31 October 2013
https://online.axismf.com