Embed Size (px)
Citation preview
An Edhec Risk and Asset Management Research Centre Publication
January 2005
Edhec Funds of Hedge FundsReporting Survey
A Return-Based Approach to Funds of Hedge Funds Reporting

Summary
Published in France, January 2005, Copyright© Edhec 2005The opinions expressed in this survey are the sole responsibility of the authors
Introduction 1
About the Authors 2
Executive summary 4
Preamble 8
The specific characteristics of hedge fund performance 12Biases in hedge fund performance measurement 12Liquidity and credit risks 13Non-linear exposures to risk factors 14Extreme risks 15Dynamic exposures to risk factors 16
Edhec recommendations for Fund of Hedge Fund Reporting 18The frequency of publication 18The granularity of the monthly activity report 18Risk and return indicators 19
Risk and return analysis 20Risk-adjusted return analysis 21Beta and correlation analysis 22
Presentation of the principal indicators 26Analysis of the distribution function 26
Skewness 26Kurtosis 26The Bera Jarque test 26
Analysis of the auto-correlation coefficients 26The Ljung-Box test 26The Herfindahl index 27Method for correcting auto-correlation coefficients 27
The Omega 28From the Sharpe ratio to the Sharpe-Omega ratio 29
The Sharpe ratio 29The Sortino ratio 29The Sharpe - Omega ratio 30
From M2 to Alternative Style Risk Adjusted Performance (ASRAP) 30From Maximum Drawdown to the Style VaR 31
Maximum drawdown 31Value-at-Risk (VaR) 31Cornish-Fisher VaR 32Incremental and component Cornish-Fisher VaR 32Beyond VaR 33Style VaR 34
Conclusion of the consultation period 36Profile of the respondents 37Granularity and frequency 40Return analysis 41
Edhec Hedge Fund Indices: The Index of Indices Approach 42Risk analysis 44Risk-adjusted return analysis 46Beta and correlation analysis 48Conclusion 50Appendix 51
Appendix I 52Appendix II 53
Edhec Risk and Asset Management Research Centre 58
Edhec Funds of Hedge Funds Reporting Survey 1
EDHEC FUNDS OF HEDGE FUNDS REPORTING SURVEY - A RETURN-BASED APPROACH TO FUNDS OF HEDGE FUNDS REPORTING
Since it was set up, in 2001, the Edhec Risk and
Asset Management Research Centre has made
a point of conducting research that is both
independent and pragmatic.
The concern to render our research work relevant
and operational led us, in 2003, to publish the
first studies on the policies of the European asset
management industry. The Edhec European
Asset Management Practices survey allowed a
comparison to be established between the aca-
demic state-of-the-art in the area of portfolio
management and risks, and the practices of
European managers.
This study was completed in the same year by a
review of the state-of-the-art and the practices
of European alternative multimanagers, the
Edhec European Alternative Multimanagement
Practices survey.
In drawing up the latter report, we were able to
observe the gap that exists between the con-
clusions of the academic research work and the
practices of multimanagers in measuring and
reporting on the performance and risks of
funds or portfolios of hedge funds. This obser-
vation led us to carry out research and a survey
on this fundamental dimension of the relation-
ship between investors and managers: the
Edhec Funds of Hedge Funds Reporting Survey.
The analyses, conclusions and recommendations
that we are presenting today are the fruit of
both an investigation and a thorough dialogue
with alternative investment professionals. We
hope that they will help to stimulate and nour-
ish discussions between investors, managers
and regulatory authorities, in a mutual concern
to make information on hedge funds reliable.
I would like to thank all the members of the
Edhec Risk and Asset Management Research
Centre team who helped to produce this sur-
vey, particularly Mathieu Vaissié, who coordi-
nated the contributions of the authors and
synthesised the comments of the considerable
number of professionals who reacted to our
proposals.
Noël Amenc, Professor of Finance
Director of the Edhec Risk and Asset ManagementResearch Centre
Introduction

Edhec Funds of Hedge Funds Reporting Survey2
EDHEC FUNDS OF HEDGE FUNDS REPORTING SURVEY - A RETURN-BASED APPROACH TO FUNDS OF HEDGE FUNDS REPORTING
About the Authors
We would like to express our gratitude to Laurent Favre, Con Keating, Xavier Lépine, François-Serge Lhabitant, Jean Christophe
Meyfredi and Nicolas Rousselet for their precious comments and suggestions. The opinions expressed in this document and any
errors or omissions are the sole responsibility of the authors.
Philippe Malaise is a professor of finance at the Edhec Graduate School of Business. He is also
Research Director at the Edhec Risk and Asset Management Research Centre. Philippe has extensive
professional experience in asset management and financial IT, which has included setting up and man-
aging software publishing companies producing trading room and portfolio management software.
Mathieu Vaissié is a Research Engineer at the Edhec Risk and Asset Management Research Centre
and a PhD candidate in Finance at University Paris 9 Dauphine. He specialises in multi-factor mod-
els and their use for benchmarking hedge fund returns. Mathieu is in charge of the Indexes &
Benchmarking section of the Edhec-Risk web site.
Noël Amenc, PhD, is professor of finance at the Edhec Graduate School of Business, where he
heads the Risk and Asset Management Research Centre. He has conducted active research in the
fields of quantitative equity management, portfolio performance analysis and active asset allocation,
resulting in numerous academic and practitioner articles and books. He is an Associate Editor of the
Journal of Alternative Investments and Senior Academic Fellow of the Europlace Institute of Finance.

Executive summary

Over the last four years, Edhec has been devel-
oping a series of research programmes in the
area of risk and asset management with the
permanent objective of responding to the inter-
ests of the various industry actors and sponsors
that have been supporting the initiative. The
Edhec Funds of Hedge Funds Reporting Survey
was written in this spirit. It is the first study
conducted worldwide comparing and contrast-
ing suggestions from the industry (buy side and
sell side) and academic recommendations on
the sensitive issue of investor information.
In the first section of this publication, we carry
out a review of the literature to identify the
consensus that has been reached in the acade-
mic world on the risk profile of hedge funds.
We highlight the fact that even though the
specific features of the risk profile of hedge
funds have been widely discussed in the litera-
ture, market participants tend to understate
their importance, and remain strongly impreg-
nated by traditional world investment prac-
tices. In the light of our study on the specific
risk profile of hedge funds, we show the extent
to which performance measures traditionally
used by market participants (investors and fund
managers alike), such as the Sharpe ratio, face
limitations when it comes to assessing the per-
formance of alternative investments. In this
respect, we argue that due to the exposure to
multiple sources of risk, and due to the dynam-
ic and non-linear nature of the relationships
with risk factors, traditional risk-adjusted per-
formance measures fail to account properly for
the risk profile of hedge funds, and as a result
fail to assess their performance accurately. Yet,
as illustrated in Edhec (2003)I, a large majority
of investors still prefer indicators such as the
Sharpe ratio (82%), the Sortino ratio (58%) or
even the information ratio (49%) to monitor
hedge fund performance.
In the following sections of this publication,
we make a number of suggestions with regard
to the content of the activity report and pre-
sent the principal indicators. We first suggest
opting for a monthly publication frequency
and list a number of indicators covering the
whole spectrum of the risk and return dimen-
sion definitions. We thus give a number of
measures accounting for normal risks (e.g.
Volatility), extreme risks (e.g. Modified Value-
at-Risk) and loss risks (e.g. Maximum
Drawdown) with the corresponding risk-
adjusted performance indicators so that
investors, whatever their preferences, can be
provided with relevant information. In this
respect, it is worth noting that all this infor-
mation can be obtained through a return-
based analysis that is carried out by simply
analysing FoHFs’ historical returns. As a result,
with the approach suggested in this publica-
tion, managers can provide investors with
valuable information on their fund perfor-
mance and risk profile without disclosing
detailed positions. We thus argue that it is pos-
sible to satisfy investor requirements for infor-
mation without challenging managers’
requirements for secrecy. We also propose to
include original risk-adjusted indicators, such
as the Omega ratio, which are specifically
designed to account for the non-normal
return distributions of hedge funds. We finally
suggest that the activity report should include
detailed information on the fund’s key return
drivers in the form of style and factor analysis,
so that investors can optimally mix alternative
Edhec Funds of Hedge Funds Reporting Survey4
EDHEC FUNDS OF HEDGE FUNDS REPORTING SURVEY - A RETURN-BASED APPROACH TO FUNDS OF HEDGE FUNDS REPORTING
Executive summary
I - Cf. Edhec European Alternative Multimanagement Practices Survey, 2003

investments with their traditional portfolio.
We argue that such information is essential,
since an increasing proportion of investors are
using hedge funds to improve the diversification
of their portfolio.
In the final sections of this publication, we
analyse the answers to the questionnaire, and
confront investor and fund manager opinions
on what the future content of the monthly
activity report should be. Despite some slight
differences, investors and fund managers tend
to agree on the definition of the relevant
information. This finding contrasts sharply
with what is usually said on the conflict of
interest between investors and fund managers.
Nevertheless, as one might have expected,
investors tend to ask for more details than
fund managers. In this respect, we suggest fit-
ting the degree of detail to the level of granu-
larity (i.e. detailed information at the FoHF
level and succinct information at the fund
level) in order to reach a good compromise
between the information needs of investors
and the constraints of fund managers.
According to both investors and fund man-
agers, traditional performance measures have
their place in the hedge fund activity report of
tomorrow. The Sharpe ratio is considered to be
important to very important by 77% of the
fund managers and 79% of the investors.
However, it is worth noting that new perfor-
mance measures, which are better suited for
alternative investments, are gaining accep-
tance, demonstrating the interest of market
participants in rationalising the performance
evaluation and attribution process. Indeed, the
Omega ratio is already considered to be impor-
tant to very important by 57% of fund man-
agers and 48% of investors. In the same vein,
it seems that market participants are progres-
sively accepting the idea that hedge fund
returns are driven by beta and alpha drivers
since many of them are looking for relative
returns. We believe that this shift from an
absolute return paradigm to a relative return
paradigm is a major step forward for the future
development of the alternative investment
industry. However, it brings new challenges in
terms of reporting to investors. Investors will
be increasingly demanding with regard to
information on the underlying risk factors of
FoHF. For this reason we suggest including sta-
tic and dynamic style/factor analysis in the
monthly activity report so that investors can
either study the diversification properties or
measure the relative returns of FoHF.
As a conclusion, there is still a long way to go
before investors in the alternative arena can
be provided with relevant information on a
monthly basis. Nevertheless, we can at least
say that the results that we have obtained are
encouraging. Investors and fund managers
are heading in the same direction and they
have chosen the right direction, in that they
tend to suit their investment practices to the
specific features of alternative investment.
While only 20% of fund managers include VaR
measures in their reporting to account for
extreme risks (see Edhec (2003)II), 40% of fund
managers consider that robust indicators such
as Beyond VaR should be included in their
reporting in the future. The same observation
holds for risk-adjusted performance indica-
tors. While only 4% of fund managers (see
Edhec (2003)III) currently use the Omega ratio,
57% of them consider that an indicator of
that kind should be part of their monthly
activity reports in the future.
Edhec Funds of Hedge Funds Reporting Survey 5
EDHEC FUNDS OF HEDGE FUNDS REPORTING SURVEY - A RETURN-BASED APPROACH TO FUNDS OF HEDGE FUNDS REPORTING
Executive summary
Edhec Funds of Hedge Funds Reporting Survey
II - Cf. Edhec European Alternative Multimanagement Practices Survey, 2003III - Cf. Edhec European Alternative Multimanagement Practices Survey, 2003

6
EDHEC FUNDS OF HEDGE FUNDS REPORTING SURVEY - A RETURN-BASED APPROACH TO FUNDS OF HEDGE FUNDS REPORTING
Edhec Funds of Hedge Funds Reporting Survey

Preamble

8
EDHEC FUNDS OF HEDGE FUNDS REPORTING SURVEY - A RETURN-BASED APPROACH TO FUNDS OF HEDGE FUNDS REPORTING
Alternative investment has experienced a two-
stage development process in the past fifty
years. Initially, there was a long period of incu-
bation, during which only a few wealthy pri-
vate investors bought shares in hedge funds in
a search for absolute performance. The burst-
ing of the Internet bubble then broadened the
range of subscribers. Since all investors were
looking for investments that were liable to
improve the diversification of their portfolio,
they naturally turned to hedge funds. The mas-
sive arrival of institutional investors and the
diversification of the risk profiles of final
investors allowed an in-depth examination of
the management practices in the alternative
universe to take place, highlighting risk control
in particular. The initial work that aimed to
rationalise and, above all, to standardise these
management practices, was carried out under
the impetus of the Investor Risk Committee
(IRC), set up by the International Association of
Financial Engineers.
This work is all the more important in that the
risk-taking and control that should result
from it form, essentially, the basis of alterna-
tive investment. Even the so-called non-direc-
tional alternative strategies, i.e. those that are
not directly subject to market risk, are exposed
to multiple risk factors such as volatility risk,
credit risk, liquidity risk, etc. (cf. Amenc et al.
(2003)1). It is therefore true to say that correct
assessment and rigorous monitoring of risks
are requisite conditions for a hedge fund to
function well. It is thus vital for investors to
ensure that the funds in which they have
invested or in which they wish to invest
(again) have adequate control over the risks
being run. However, in spite of this obvious
fact, investors are rarely in a position to
implement satisfactory risk monitoring and
control. The main reason put forward relates
to the low level of information generally pro-
vided by hedge funds. A study carried out
recently by Edhec involving 61 European mul-
timanagers (cf. Edhec (2003)2) shows that,
while 84% of the firms questioned include a
volatility calculation in their monthly activity
report (69% also include a Sharpe ratio, 22%
a Sortino ratio and 20% a Value-at-Risk cal-
culation), none provides a truly robust mea-
sure of the extreme risks, even though this is
a measure that represents an element of
information that is capital for all investors.
(See graph 1)
Besides, the inadequacies of the monthly
activity reports published by funds of hedge
funds (hereafter FoHF in the text) do not stop
there. Numerous studies have posed the ques-
tion of the relative performance of hedge
funds compared to traditional asset classes.
Many have concluded that there was condi-
tional and unconditional outperformance
from strategies, thereby feeding the myth of
“absolute return strategies.” On the basis of
this observation, researchers and investors
have tried to highlight the eventual persis-
tence of hedge fund performance so as to jus-
tify the usefulness of stock picking.
Paradoxically, the results obtained are largely
favourable for the allocation and risk manage-
ment process. While no study has been able to
produce tangible proof with regard to the per-
sistence of hedge fund performance beyond a
6-month horizon, some have underlined the sta-
bility of the funds’ risk profile (cf. Kat and
Menexe (2003)3 or Mozes and Herzberg (2003)4),
0
20
40
60
80
100
Vola
tility
Shar
pe R
atio
Perf
orm
ance
rela
tive
to a
ben
chm
ark
Styl
e an
alys
isSo
rtin
o Ra
tioVa
R es
timat
ion
Leve
rage
eff
ect
Cond
ition
al b
etas
No
answ
erM
easu
rem
ent o
f the
opt
ion
char
acte
ristic
s of
fund
retu
rns
84
69
62
47
22 20 2016
74 4
%
M2 o
r SRA
P ra
tios
Graph 1
Which indicators and informationdo European FoHF use for reportingto their clients?
1 - Amenc, N., Martellini, L. and Vaissié, M., 2003, Benefits and Risks of Alternative Investment Strategies, Journal of Asset Management, Vol.4, N°2,p.96-118.2 - Cf. Edhec European Alternative Multimanagement Practices Survey, 20033 - Kat, H. and Menexe, F., 2003, Persistence in Hedge Fund Performance: The True Value of Track Record, Journal of Alternative Investments,Spring 2003, Vol.5, N°4, p.66-724 - Mozes, H. A. and Herzberg, M., 2003, The Persistence of Hedge Fund Risk: Evidence and Implications for Investors, Journal of AlternativeInvestments, Fall 2003, Vol.6, N°2, p.22-42
Preamble
Source: Edhec European Alternative MultimanagementPractices Survey, 2003
Edhec Funds of Hedge Funds Reporting Survey 9
EDHEC FUNDS OF HEDGE FUNDS REPORTING SURVEY - A RETURN-BASED APPROACH TO FUNDS OF HEDGE FUNDS REPORTING
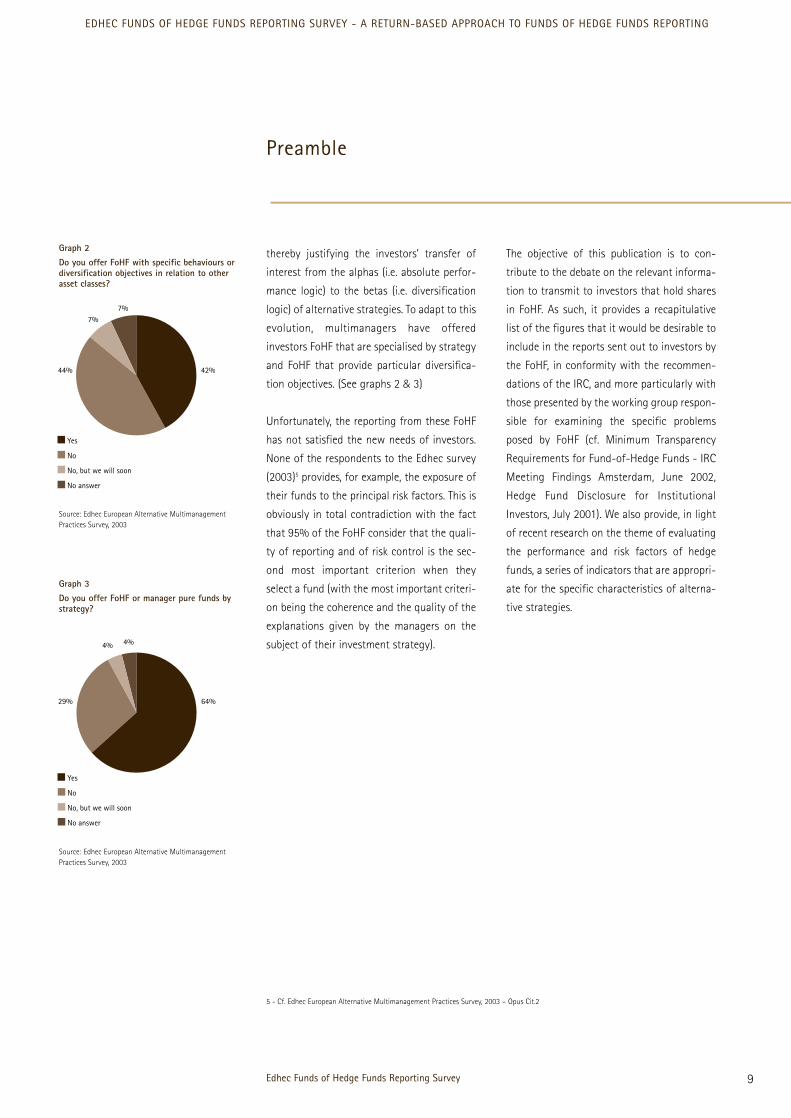
Graph 3
Do you offer FoHF or manager pure funds bystrategy?
thereby justifying the investors’ transfer of
interest from the alphas (i.e. absolute perfor-
mance logic) to the betas (i.e. diversification
logic) of alternative strategies. To adapt to this
evolution, multimanagers have offered
investors FoHF that are specialised by strategy
and FoHF that provide particular diversifica-
tion objectives. (See graphs 2 & 3)
Unfortunately, the reporting from these FoHF
has not satisfied the new needs of investors.
None of the respondents to the Edhec survey
(2003)5 provides, for example, the exposure of
their funds to the principal risk factors. This is
obviously in total contradiction with the fact
that 95% of the FoHF consider that the quali-
ty of reporting and of risk control is the sec-
ond most important criterion when they
select a fund (with the most important criteri-
on being the coherence and the quality of the
explanations given by the managers on the
subject of their investment strategy).
The objective of this publication is to con-
tribute to the debate on the relevant informa-
tion to transmit to investors that hold shares
in FoHF. As such, it provides a recapitulative
list of the figures that it would be desirable to
include in the reports sent out to investors by
the FoHF, in conformity with the recommen-
dations of the IRC, and more particularly with
those presented by the working group respon-
sible for examining the specific problems
posed by FoHF (cf. Minimum Transparency
Requirements for Fund-of-Hedge Funds - IRC
Meeting Findings Amsterdam, June 2002,
Hedge Fund Disclosure for Institutional
Investors, July 2001). We also provide, in light
of recent research on the theme of evaluating
the performance and risk factors of hedge
funds, a series of indicators that are appropri-
ate for the specific characteristics of alterna-
tive strategies.
Preamble
Yes
No
No, but we will soon
No answer
4% 4%
64%29%
5 - Cf. Edhec European Alternative Multimanagement Practices Survey, 2003 – Opus Cit.2
Graph 2
Do you offer FoHF with specific behaviours ordiversification objectives in relation to otherasset classes?
Yes
No
No, but we will soon
No answer
7%7%
42%44%
Source: Edhec European Alternative MultimanagementPractices Survey, 2003
Source: Edhec European Alternative MultimanagementPractices Survey, 2003

10
EDHEC FUNDS OF HEDGE FUNDS REPORTING SURVEY - A RETURN-BASED APPROACH TO FUNDS OF HEDGE FUNDS REPORTING
Edhec Funds of Hedge Funds Reporting Survey

The specific characteristics of hedge
fund performance

12
EDHEC FUNDS OF HEDGE FUNDS REPORTING SURVEY - A RETURN-BASED APPROACH TO FUNDS OF HEDGE FUNDS REPORTING
The specific characteristicsof hedge fund performance
Hedge funds employ dynamic investment
strategies and enjoy a high degree of freedom
with regard to the instruments that they can
hold in their portfolio (stocks, bonds, deriva-
tive instruments, real estate, works of art, etc.).
To that can be added the possibility of engag-
ing in short selling of securities and using the
leverage effect. As stressed by Fung & Hsieh
(1997)6, alternative strategies are infinitely
more complex than those of traditional funds
(i.e. generally of buy-and-hold type) because it
is no longer sufficient to identify the markets
in which the funds are present (location fac-
tor), it is also necessary to identify their net
exposure and leverage (strategy factor).
Whether it involves the strategic and/or tacti-
cal portfolio allocation process, risk-adjusted
performance measurement or performance
attribution, it is essential to be able to avail of
both performance and risk indicators that are
reliable. The opaque nature of hedge funds,
and also the technical complexity of the
strategies that they employ, make this difficult.
On this subject, numerous articles have high-
lighted the weaknesses of the traditional risk
and performance measurement indicators
within the framework of evaluating the perfor-
mance of hedge funds (cf. Lo (2001)7, Spurgin
(2001)8 or Brooks and Kat (2002)9, etc.).
Biases in hedge fund performance measurement
The measurement of hedge fund performance
is made difficult by the presence of various
biases. As Fung and Hsieh (2000 & 2002)10&11
underline, some biases, such as the survivor-
ship and selection biases, relate to the very
nature of the alternative universe (natural
biases), others, such as the backfilling or multi-
period sampling biases, relate to the way in
which the main hedge fund databases are con-
structed or the way in which the data is used
(spurious biases). All these biases tend to arti-
ficially and significantly overestimate the per-
formance of hedge funds (e.g. Fung and Hsieh
(2000 & 2002)12 value the survivorship and
instant history biases at 4.4% per year13) and to
underestimate the risks (i.e. mean risk and
extreme risk). It is therefore difficult, for
investors, to obtain accurate information with
tools that are based on biased estimators of
the risk and return. However, this is the case
for traditional performance measurement
tools such as the Sharpe/Treynor/Sortino ratios
or traditional risk measurement tools such as
volatility / Value-at-Risk (VaR). We should
note, on this topic, that in order to solve the
bias problems and also, above all, to provide a
solution to the lack of representativity with
which the various hedge fund indices available
on the market are confronted, the Edhec Risk
and Asset Management Research Centre
launched indices of hedge fund indices at the
beginning of 200314. For want of reliable data, it
is necessary to correct the estimation of the
6 - Fung, W. and Hsieh, D. A., 1997, Empirical Characteristics of Dynamic Trading Strategies: The Case of Hedge Funds, Review of Financial Studies,Summer 1997, Vol.10, N°2, p.275-302.7 - Lo, A., 2001, Risk Management for Hedge Funds: Introduction and Overview, Financial Analysts Journal, Nov/Dec 2001, Vol. 57, Issue 6, p.16-33.8 - Spurgin, R., 2001, How to Game your Sharpe Ratio, Journal of Alternative Investments, Winter 2001, Vol. 4, N°3, p.38-46.9 - Brooks, C. and Kat, H., 2002, The Statistical Properties of Hedge Fund Returns and their Implications for Investors, Journal of AlternativeInvestments, Fall 2002, Vol.5, N°2, p.26-44.10 - Fung, W. and Hsieh, D. A., 2000, Performance Characteristics of Hedge Funds and Commodity Funds: Natural versus Spurious Biases, Journalof Financial and Quantitative Analysis, Vol.35, Issue 3, p.291-307.11 - Fung, W. and Hsieh, D. A., 2002, Benchmark of Hedge Fund Performance, Information Content and Measurement Biases, Financial AnalystsJournal, Jan/Feb 2002, Vol.58, N°1, p.22-34.12 - Cf. Fung and Hsieh (2000 & 2002) – Opus Cit. 10 & 1113 - It is interesting to note that a working paper by Posthuma and van der Sluis, A Reality Check on Hedge Fund Returns (2003), values the instant history bias alone at 4.35% for the whole TASS database, and at 6.34% for the long short equity funds.14 - Thanks to an original construction method based on principal component analysis (PCA), the Edhec indices allow both the representativitydimension to be maximised and the biases to be minimised. They therefore provide investors with better quality information.
13
EDHEC FUNDS OF HEDGE FUNDS REPORTING SURVEY - A RETURN-BASED APPROACH TO FUNDS OF HEDGE FUNDS REPORTING
hedge fund performance and risk ex-post to
account for the impact of the different biases
mentioned above.
Liquidity and credit risks
Hedge funds are exposed to a large number of
risk factors. Among all these sources of risk,
the liquidity and credit risks should be consid-
ered with care. These two sources of risks are
very closely related in the minds of investors,
especially since the LTCM affair. Taking the
interdependence between the credit and liq-
uidity risks into account should notably lead to
a modelling of the consequences of using the
leverage effect in arbitrage operations. Today,
however, with the exception of highly academ-
ic research, such as that on the application of
mathematical network theory to the construc-
tion of systemic measures of credit and liquid-
ity risks15, professionals do not have robust and
simple microeconomic results at their disposal
in this area. It will nevertheless be necessary to
attempt to take the interdependence of these
two risk factors into account in extreme risk
calculations (scenarios, stress tests, etc.).
Some authors (cf. Asness, Krail and Liew (2000)16,
Brooks and Kat (2002)17, Lo (2001)18, Okunev
and White (2004)19, Getmansky, Lo and
Makarov (2003)20, etc.) have highlighted the
fact that hedge funds tend to invest in instru-
ments that are fairly illiquid. Consequently,
when there is no market price available, the
calculation of a fund’s net asset value can pose
a problem. The choice of the method for valu-
ing illiquid positions then comes down to the
hedge fund managers. They can therefore take
advantage of this leeway to manipulate the
prices so as to smooth the performance of
their fund. If that is the case, the auto-correla-
tion coefficient of the return series will be sig-
nificant and the analysis will yet again be
biased. The volatility of the fund performance
will be underestimated (by up to 100% accord-
ing to Okunev and White (2004)21). In the same
way, the correlation coefficient of the perfor-
mances of the fund and traditional assets, and
the exposure to certain risk factors, will tend to
be underestimated. Investors then overesti-
mate the diversification potential and the level
of performance that the fund provides. Lo
(2001)22 therefore suggests the use of a signif-
icance test for the auto-correlation coeffi-
cients, the Ljung-Box test, to estimate the liq-
uidity risk. When the latter is significant, it is
necessary to correct the return series of the
fund or the index before estimating its perfor-
mance and risk. To this end, Geltner (199123,
199324) proposes a method that is widely used
in the real estate sector, which allows the first
order auto-correlation to be eliminated.
Okunev and White (2004)25 recently proposed a
method that is more general, and much more
sophisticated, which aims to correct the auto-
correlation coefficients up to the nth order.
An alternative solution involves no longer cor-
recting the return series directly, but modifying
the measurement tool itself, as proposed, for
The specific characteristics of hedge fund performance
15 - Notably Watts, D. and Strogatz, S., June 1998, Collective dynamics of ‘small-world’ networks, Nature, Vol. 393, n° 6, p.440-442, and Watts, D.,1999, Small worlds: the dynamics of networks between order and randomness, Princeton University Press.16 - Asness, C., Krail, R. and Liew, J., 2000, Do Hedge Funds Hedge?, Journal of Portfolio Management, Fall 2001, Vol.28, N°1, p.6-19.17 - Brooks and Kat (2002) – Opus Cit. 918 - Cf. Lo (2001) – Opus Cit. 719 - Okunev, J. and White D., 2004, An Analysis of the Risk Factors Underlying Hedge Fund Returns, in Intelligent Hedge Fund Investing, Ed. B.Schachter, Pub. RiskBooks.20 - Getmansky, M., Lo, A. and Makarov, I., 2003, An Econometric Model of Serial Correlation and Illiquidity in Hedge Funds Returns, 2003, WorkingPaper 4288-03, MIT.21 - Cf. Okunev and White (2004) – Opus Cit. 1922 - Cf. Lo (2001) – Opus Cit. 723 - Geltner, D., 1991, Smoothing in Appraisal-Based Returns, Journal of Real Estate Finance and Economics, Vol.4, p.327-345.24 - Geltner, D., 1993, Estimating Market Values from Appraised Values without Assuming an Efficient Market, Journal of Real Estate Research,Vol.8, p.325-345.25 - Cf. Okunev and White (2004) – Opus Cit. 19

14
EDHEC FUNDS OF HEDGE FUNDS REPORTING SURVEY - A RETURN-BASED APPROACH TO FUNDS OF HEDGE FUNDS REPORTING
The specific characteristics of hedge fund performance
example, by Asness et al. (2000)26, Lo (2002)27 or
Getmansky et al. (2003)28 with their extensions
to the Sharpe ratio.
Non-linear exposures to riskfactors
Most of the performance evaluation methods
that are currently used are based on mono- or
multi-factor linear models (cf. the CAPM, the
Fama/French 3-factor model, the Carhart 4-fac-
tor model, APT, etc.). The effectiveness of these
models depends, amongst other things, on the
linearity of the relationships between the
dependent variable and the explanatory vari-
ables. Unfortunately, three factors contribute to
the non-linearity of the exposure of hedge fund
performance to the various risk factors:
• First of all, most hedge funds use market
timing or risk factor timing. The hedge funds
take up a position in a given market or take a
long position on a particular risk factor if they
anticipate a rise for that factor, and unwind
their positions or take a short position when
they anticipate a fall. Their exposure is there-
fore sensitive to the evolution of the factors.
• In addition, hedge funds hold assets in their
portfolio whose exposures to the different risk
factors are not linear. This is the case for the
derivative instruments that they hold for
either leverage effect reasons or hedging pur-
poses. As a result, their exposure to certain
risk factors (market, volatility, raw materials,
interest rates, etc.) is non-linear.
• Finally, the remuneration system for hedge
funds is made up of a fixed part (i.e. manage-
ment fees) and a variable part (i.e. incentive
fees). It is therefore an asymmetric form of
remuneration because the variable part pre-
sents a profile that is similar to that of a call
option on the fund performance (with the
strike price being equal to the “hurdle rate”
specified in the contract). Since the perfor-
mances of hedge funds are published net of
fees by the databases, this introduces, de
facto, a non-linear component.
Since the exposures to the risk factors are not
linear, it is important, in measuring the sensi-
tivity of fund performance to the different risk
factors identified, to analyse at the same time
the unconditional and conditional correla-
tions (cf. Amenc et al. (2003)29). This will allow
the diversification potential that the fund pro-
vides during normal and volatile market phas-
es to be evaluated. Unfortunately, only 16% of
the fund managers questioned include infor-
mation of that kind in their reporting (cf.
Edhec (2003)30).
Numerous authors have explored the non-lin-
earity of the exposure of hedge fund perfor-
mance to risk factors and have underlined the
problems that it leads to within the frame-
work of multi-factor analysis (Fung and Hsieh
(1997 & 2000)31, Edwards and Caglayan
(2001)32, Lo (2001)33, Dor et al. (2003)34, Amin
and Kat (2003)35, Liang (2004)36 and Agarwal
and Naik (2004)37). They have come up with
different suggestions for capturing the share
26 - Cf. Asness et al. (2000) – Opus Cit. 1627 - Lo, A., 2002, The Statistics of Sharpe Ratio, Financial Analysts Journal, Vol.58, Issue 4, p.36-50.28 - Cf. Getmansky et al. (2003) – Opus Cit. 2029 - Cf. Amenc et al. (2003) – Opus Cit. 130 - Cf. Edhec (2003) – Opus Cit. 231 - Cf. Fung and Hsieh (1997 & 2000) – Opus Cit. 6 & 1032 - Edwards, F. and Caglayan, M., 2001, Hedge Fund and Commodity Fund Investment Styles in Bull and Bear Markets, Journal of PortfolioManagement, Vol. 27, N°4, p. 97-108.33 - Cf. Lo (2001) – Opus Cit. 734 - Dor, A., Jagannathan, R., and I. Meier 2003, Understanding Mutual Fund and Hedge Fund Styles Using Return Based Style Analysis, Journal ofInvestment Management, Vol.1, N°1, p.94-134.35 - Amin, G. and Kat, H., 2003, Hedge Fund Performance 1990 – 2000: Do the Money Machines Really Add Value?, Journal of Financial andQuantitative Analysis, Vol.38, N°2, June 2003.36 - Liang, B., 2004, On the Performance of Alternative Investments: CTAs, Hedge Funds, and FoHF, Journal of Investment Management, Vol.2, N°4.37 - Agarwal, V., Naik, N., 2004, Risks and Portfolio Decisions Involving Hedge Funds, Review of Financial Studies, Spring, Vol.17, N°1, p.63-98.

15
EDHEC FUNDS OF HEDGE FUNDS REPORTING SURVEY - A RETURN-BASED APPROACH TO FUNDS OF HEDGE FUNDS REPORTING
of non-linearity, i.e. the strategy factor, of
hedge fund returns. To this end, some propose
introducing implicit factors (Fung and Hsieh
(1997)38) or option strategies (Agarwal and
Naik (2004)39); others suggest using hedge
fund indices in order to adapt Sharpe’s
(1992)40 style analysis to the alternative uni-
verse (cf. Agarwal (2000)41, Lhabitant (2001)42
and Dor et al. (2003)43). Finally, there are those
who suggest using models that are capable of
taking the so-called “phase locking” phenom-
ena into account (cf. Lo (2001)44).
Extreme risks
Most traditional performance and risk mea-
surement tools are based on a common
assumption: that the return distribution func-
tion of the asset being evaluated is normal. In
that case, the risk of an asset is only charac-
terised by the second order moment of its
return distribution function (i.e. the standard
deviation or volatility). However, numerous
studies have highlighted the significance of
the third and fourth order moments of the
hedge fund return distribution functions
(respectively, the skewness and kurtosis coef-
ficients). In view of the sensitivity of investors
to the third and fourth order moments (cf.
Scott and Horvath (1980)45), hedge fund per-
formance cannot be analysed within a
mean/variance framework. Based on that
observation, tools such as the Sharpe ratio or
the VaR (unless the VaR is calculated on the
basis of historical data or with Monte Carlo
simulations based on non-normal distribu-
tions) only partially integrate the risk to which
investors are exposed. However, as the Edhec
study (2003)46 shows, most European multi-
managers only use those kinds of indicators in
their reporting. The Bera Jarque test (1987)47
allows for an evaluation of the extent to
which the distribution function observed is
removed from a normal distribution. It there-
fore indirectly evaluates the investors’ risk of
being wrong when they use a traditional per-
formance measurement tool in their invest-
ment management process. To make up for
that, it is essential to integrate the third and
fourth order moments of the distribution
function in the risk analysis. That is the case
for certain performance and/or risk indicators
such as the Cornish-Fisher VaR, the Sharpe-
Omega ratio (cf. Kazemi et al. (2004)48),
Keating and Shadwick’s Omega (2002)49 or the
ASRAP presented in the present document.
Unfortunately, the study carried out by Edhec
shows that only 4% of multimanagers give
any importance to the Omega (and only 2% to
the BVaR) when they select a fund.
The specific characteristics of hedge fund performance
38 - Cf. Fung and Hsieh (1997) – Opus Cit. 639 - Cf. Agarwal and Naik (2004) – Opus Cit. 3740 - Sharpe, W., 1992, Asset Allocation: Management Style and Performance Measurement, Journal of Portfolio Management, Winter 1992, Vol. 18,p.7-19.41 - Agarwal, V., 2000, Generalized Style Analysis of Hedge-funds, Journal of Asset Management, July 2000, Vol.1, N°1, p.93-109.42 - Lhabitant, F.S., 2001, Assessing Market Risk for Hedge Funds and Hedge Funds Portfolios, Journal of Risk Finance, Spring 2001, p.1-17.43 - Dor et al. (2003) – Opus Cit. 3444 - Cf. Lo (2001) – Opus Cit. 745 - Scott, R. and Horvath, P.A., 1980, On the Direction of Preference for Moments of Higher Orders than the Variance, Journal of Finance, Sept80,Vol.35, p.915-919 46 - Cf. Edhec (2003) – Opus Cit. 247 - Bera, A.K. and Jarque, C.M., 1981, An Efficient Large Sample Test for Normality of Observations and Regression Residuals, Australian NationalUniversity, Working Papers in Econometrics 40, Canberra.48 - Kazemi, H., Schneeweis, T. and Gupta, R., 2004, Omega as a Performance Measure, Journal of Performance Measurement, Spring 2004, Vol.8, N°3.49 - Keating, C. and Shadwick, W., 2002, A Universal Performance Measure, Journal of Performance Measurement, Spring 2002, Vol.6, N°3, p.59-84.

16
EDHEC FUNDS OF HEDGE FUNDS REPORTING SURVEY - A RETURN-BASED APPROACH TO FUNDS OF HEDGE FUNDS REPORTING
Dynamic exposures to risk factors
Hedge funds invest in a wide variety of instru-
ments. They are therefore exposed to different
risk factors (market, volatility, liquidity, credit,
etc.). If we consider that for each alternative
strategy there is a corresponding set of under-
lying risk factors, the best funds, for a given
strategy, are those that successfully manage
to over- or underweight their exposure to the
different risk factors in accordance with mar-
ket conditions. As a result of this tactical fac-
tor allocation strategy, the hedge funds’ expo-
sure to the risk factors evolves over time. In
addition, since the markets are relatively effi-
cient, there is not an infinite number of arbi-
trage opportunities. To maintain their perfor-
mance, therefore, some hedge funds tend to
grab opportunities that arise, even if this
makes them deviate from the strategy that
they claim to follow. This occasional change in
style, which is called “style drift” (cf. Lhabitant
(2001)50) by investors, also leads to a variation
in the exposures to the risk factors. As a result,
the exposure of hedge funds to risk factors is
doubly dynamic (cf. Brealey and Kaplanis
(2001)51 and Lo (2001)52).
The standard multi-factor models do not
allow the dynamics of the exposures to risk
factors to be taken into account, because the
stability of the coefficients is one of the cen-
tral assumptions of these models. They restrict
themselves to measuring the average expo-
sure to the different risk factors during the
analysis period. This naturally distorts the
evaluation of the risk-adjusted performance
of hedge funds. A natural solution is to divide
the return series being analysed into various
sub-periods and to use the factor model on
those different sub-samples to study the
dynamics of the exposures to the risk factors.
The paradox with this method is that it seeks
to capture dynamics with a model that
includes an assumption on the stability of the
coefficients. A more elegant solution is to use
models that allow the coefficients of the
model to vary over time. The use of condition-
al beta evaluation models that aim to resolve
this problem is currently being examined in
numerous research studies (cf. Kat and Miffre
(2002)53, Schneeweis and Kazemi (2003)54,
Gupta et al. (2003)55 and Gregoriou (2003)56).
The specific characteristics of hedge fund performance
50 - Cf. Lhabitant (2001) – Opus Cit. 4251 - Brealey, R., Kaplanis, E., 2001, Hedge Funds and Financial Stability: An Analysis of their Factor Exposures, International Finance, Vol. 4, N°2,2001, p.161-187.52 - Cf. Lo (2001) – Opus Cit. 753 - Kat, H., and Miffre, J., 2002, Performance Evaluation and Conditioning Information: The Case of Hedge Funds, Working Paper, The AlternativeInvestment Research Centre.54 - Kazemi, H. and Schneeweis, T., 2003, Conditional Performance of Hedge Funds, Working Paper, CISDM.55 - Gupta, B., Cerrahoglu, B. and Daglioglu, A., 2003, Hedge Fund Strategy Performance: Using Conditional Approaches, Journal of AlternativeInvestments, Winter, Vol.6, Issue 3, p.7-24.56 - Gregoriou, G., 2003, Performance Evaluation of Funds of Hedge Funds Using Conditional Alphas and Betas, Derivatives Use, Trading &Regulation, Vol.8, N°4, p.324-344.

Edhec recommendations
for funds of hedgefunds reporting

Edhec Funds of Hedge Funds Reporting Survey18
EDHEC FUNDS OF HEDGE FUNDS REPORTING SURVEY - A RETURN-BASED APPROACH TO FUNDS OF HEDGE FUNDS REPORTING
Edhec recommendations for fund of hedge fund reporting
Graph 4
How frequently is reporting carried out?
57 - Cf. Edhec (2003) – Opus Cit. 2
The lack of transparency of hedge funds is
widely regarded as the last major obstacle to
the industrialisation of alternative investment.
In that respect, the following questions come
up again and again: what should the granu-
larity of hedge funds’ reporting be? What
publication frequency is appropriate? These
questions are certainly relevant, but the
debate on the transparency of hedge funds
often fails to emphasise the right issue. One
has to bear in mind that transparency is not
an objective per se, it is simply a means. The
aim is to reach a level of information that is
sufficient to allow investors to feel comfort-
able when investing in a hedge fund. It does
not involve wondering about the metaphysics
of transparency but is simply a response to a
practical problem: “What is the minimum level
of information that investors require in order
to evaluate the risk-adjusted performance of
hedge funds?” If we can answer this question,
we will know whether a compromise between
the constraints of hedge funds and the
requirements of investors can be envisaged.
The frequency of publication
The frequency of publication generally depends
on the portfolio turnover and the difficulties in
pricing the positions held. With regard to
FoHFs, monthly periodicity seems technically
possible and commercially acceptable, as is
confirmed by 87% of the multimanagers who
participated in the Edhec survey (2003)57 (See
graph 4). While high turnover trading strategies
such as CTAs’ discretionary active strategies
can value their positions on a daily basis, the
same is not true of medium/long-term strate-
gies like distressed debt, which hold less liquid
assets. Therefore monthly periodicity for
reporting may be a good trade-off. In its June
2002 report on the minimal transparency
requirements for FoHF, the IRC specifies the
data that it is appropriate to publish on a
monthly basis. The data that could or should
be included in a monthly report is enumerat-
ed below and the data that has been given a
special mention by the IRC is indicated.
The granularity of the monthlyactivity report
The data that is generally disclosed by hedge
funds does not allow investors to manage the
risks to which they are exposed. All investors,
especially institutional investors, therefore
agree that greater transparency is necessary.
However, one question remains to be
answered: can hedge funds provide investors
with a sufficient level of information without
putting themselves in danger? To answer that,
it is necessary to know the minimal level of
information required by institutional investors
to implement risk control tools. Investors
must be able to assess the level of risk and
performance of the fund at time t, but also
follow its evolution through time and under
varying market conditions. For that purpose,
do investors need full disclosure of the hedge
fund’s positions (portfolio-based approach) or
can they make do with data aggregated by
strategy, by asset class or by sector (return-
based approach)?
As far as the disclosure of individual fund
positions is concerned, the opinions are fairly
clear-cut because the members of the IRC all
agree that they can only be revealed when the
Daily
Weekly
Monthly
Quarterly
Half-yearly
No answer
9%4% 5%
15%
16%
87%
Source: Edhec European Alternative MultimanagementPractices Survey, 2003

Edhec Funds of Hedge Funds Reporting Survey 19
EDHEC FUNDS OF HEDGE FUNDS REPORTING SURVEY - A RETURN-BASED APPROACH TO FUNDS OF HEDGE FUNDS REPORTING
Edhec recommendationsfor fund of hedge fund reporting
positions are no longer held. Besides, they add
that any information for which disclosure
could potentially have a negative impact on
the fund does not have to be revealed by the
manager, even to the investors who receive
the reports. Indeed, full disclosure would
appear to be the ultimate inefficient solution
since most investors would not have enough
time to process a large amount of information
and, at the same time, the costs implied by
such reports would significantly reduce the
funds’ performance.
On the other hand, there is no argument that
could justify the non-disclosure of the FoHF
allocation (weights by type of strategy and by
hedge fund with a full weighting history from
the start). The IRC working group on FoHFs
specifies that information of that kind should
be communicated to investors every month.
On the subject of risk and return indicators,
the IRC also suggests completing the aggre-
gate results obtained at the FoHF level
through an analytical presentation:
• at the strategy type (relative value, event
driven, etc.) and/or sub-strategy level (market
neutral, fixed-income arbitrage, convertible
arbitrage, deal arbitrage, distressed, long/short
equity hedged/non-hedged, etc.);
• at the asset group level (sector, country, cur-
rency, management style, etc.) or by any com-
bination of analysis criteria that is relevant
with regard to the FoHF’s sources of return.
Risk and return indicators
The indicators that we shall now present will
complete the basic information that is usually
communicated by the FoHF each time a report
is published, whatever its frequency (net asset
value per share*, net assets* (allows redemp-
tion/subscription flows, which are rarely dis-
closed outside of the annual report, to be
monitored) and strategic allocation (weight of
each strategy and each fund relative to the
FoHF’s net assets)).
N.B. - *As far as the problems posed by the pricing of positions areconcerned, FoHFs have to make sure that the pricing rules defined byeach single hedge fund in which they invest are compliant with theSEC’s recommendations (see guidance on fair value pricing for funds)and that they are applied correctly. In that respect, procedures aimed atchecking that pricing rules are actually applied should be mentioned ina special section of the client report.
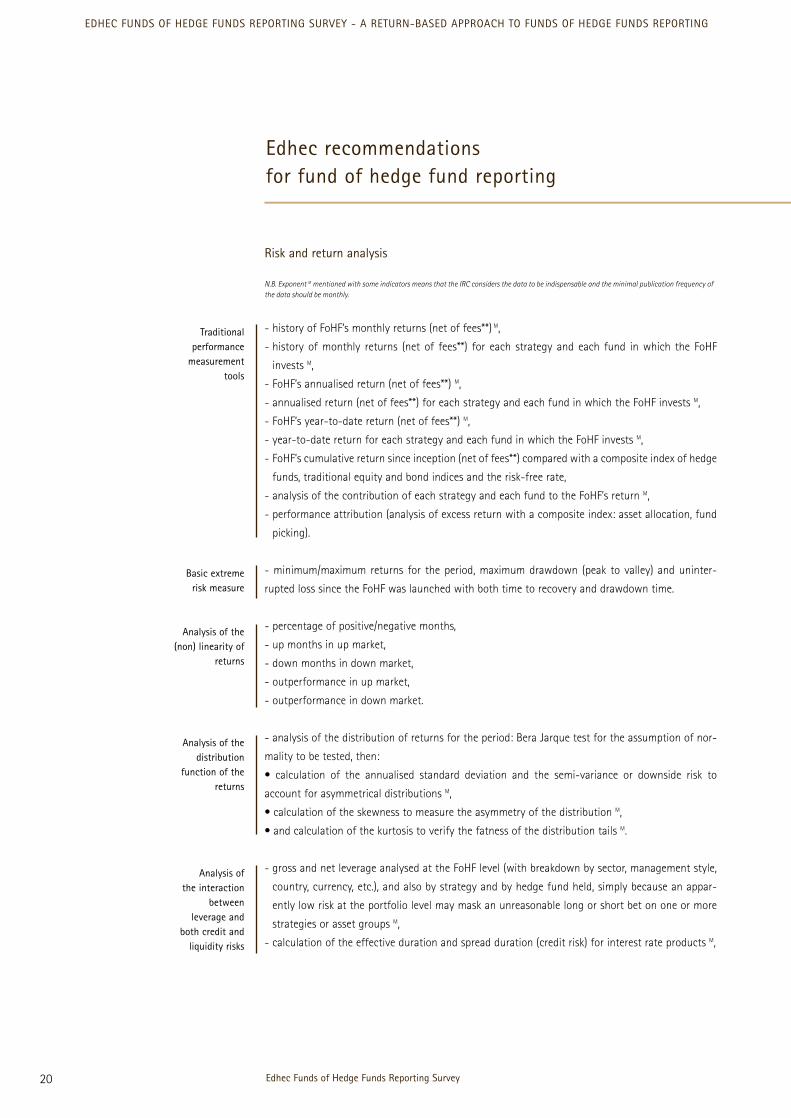
Risk and return analysis
N.B. Exponent M mentioned with some indicators means that the IRC considers the data to be indispensable and the minimal publication frequency ofthe data should be monthly.
- history of FoHF’s monthly returns (net of fees**) M,
- history of monthly returns (net of fees**) for each strategy and each fund in which the FoHF
invests M,
- FoHF’s annualised return (net of fees**) M,
- annualised return (net of fees**) for each strategy and each fund in which the FoHF invests M,
- FoHF’s year-to-date return (net of fees**) M,
- year-to-date return for each strategy and each fund in which the FoHF invests M,
- FoHF’s cumulative return since inception (net of fees**) compared with a composite index of hedge
funds, traditional equity and bond indices and the risk-free rate,
- analysis of the contribution of each strategy and each fund to the FoHF’s return M,
- performance attribution (analysis of excess return with a composite index: asset allocation, fund
picking).
- minimum/maximum returns for the period, maximum drawdown (peak to valley) and uninter-
rupted loss since the FoHF was launched with both time to recovery and drawdown time.
- percentage of positive/negative months,
- up months in up market,
- down months in down market,
- outperformance in up market,
- outperformance in down market.
- analysis of the distribution of returns for the period: Bera Jarque test for the assumption of nor-
mality to be tested, then:
• calculation of the annualised standard deviation and the semi-variance or downside risk to
account for asymmetrical distributions M,
• calculation of the skewness to measure the asymmetry of the distribution M,
• and calculation of the kurtosis to verify the fatness of the distribution tails M.
- gross and net leverage analysed at the FoHF level (with breakdown by sector, management style,
country, currency, etc.), and also by strategy and by hedge fund held, simply because an appar-
ently low risk at the portfolio level may mask an unreasonable long or short bet on one or more
strategies or asset groups M,
- calculation of the effective duration and spread duration (credit risk) for interest rate products M,
Edhec Funds of Hedge Funds Reporting Survey20
EDHEC FUNDS OF HEDGE FUNDS REPORTING SURVEY - A RETURN-BASED APPROACH TO FUNDS OF HEDGE FUNDS REPORTING
Edhec recommendationsfor fund of hedge fund reporting
Basic extremerisk measure
Analysis of the(non) linearity of
returns
Analysis of thedistribution
function of thereturns
Traditional performance
measurementtools
Analysis of the interaction
between leverage and
both credit andliquidity risks

- liquidity risk evidenced by the auto-correlation coefficient, for which the degree of significance is
measured by the Ljung-Box58 statistical test,
- evaluation of the liquidity risk through the Herfindahl index (cf. Getmansky et al. (2003)59),
- liquidity ratio (cash/equity or cash+borrowing capacity, VaR/equity or cash+borrowing capacity,
worst historical drawdown/equity or cash+borrowing capacity, scenario derived market risk mea-
sure/equity or cash+borrowing capacity) M.
- stress test M to assess the impact on the FoHF’s NAV of a sudden and sharp change in market prices
(requires the application of identical stress scenarios to each hedge fund held),
- calculation of Style-VaR M (Lhabitant – Opus cit. 42), which provides a relevant measure of the risks
of extreme losses. This method is also particularly useful within the framework of a FoHF because
it allows the investment style of a fund to be clearly determined, dynamically and over time, irre-
spective of what the manager claims60,
- calculation of Cornish-Fisher VaR, together with Incremental and Component Cornish-Fisher VaR,
to assess the contribution of each strategy or asset group to the portfolio’s extreme risk,
- calculation of BVaR to estimate the mean value of the losses that exceed the VaR.
NB.- **Disclosure of gross and net FoHF returns should also be an opportunity to clarify the arrangements for applying incentive fees (the notion ofequalisation). Experience shows that, due to the number of equalisation methods and their complexity, few investors genuinely understand how thismechanism works, even though it is implemented by 75% of the funds administered in Europe with the aim of ensuring that performance commis-sions are spread equitably between all the investors.
Risk-adjusted return analysis
The following performance indicators should
be calculated both at the FoHF level and for
each type of strategy and fund in which the
FoHF invests:
• Sortino ratio: more relevant than the
Sharpe ratio when the return distribution is
skewed, particularly when it is left-skewed.
Even though it is defined from the same prin-
ciples, except that the risk-free rate is replaced
by the minimum acceptable return (MAR) tar-
geted by the FoHF and the denominator is the
standard deviation of the returns that are
below that return, the Sortino ratio takes
skewed distributions into account M.
• the Omega: this indicator was proposed
recently by Keating and Shadwick (2002)61. It
allows all the moments of the return distribu-
tion function of the asset being evaluated to
be taken into account in a very simple way.
21
EDHEC FUNDS OF HEDGE FUNDS REPORTING SURVEY - A RETURN-BASED APPROACH TO FUNDS OF HEDGE FUNDS REPORTING
Edhec recommendationsfor fund of hedge fund reporting
58 - Ljung, G.M. and Box, G.E.P., 1978, On a Measure of Lack of Fit in Time Series Models, Biometrika, Vol. 65, N°2, p.297-30359 - Cf. Getmansky et al. (2003) – Opus Cit. 2060 - An improvement to the calculation proposed by F.-S. Lhabitant would be a two-stage process (style analysis, extreme riskanalysis) which, in the 2nd stage, allows for the removal of the portfolio constraints and recovery of the independent nature ofthe residuals, which are essential for the reliability of the analysis. 61 - Cf. Keating and Shadwick (2002) – Opus Cit. 49
Analysis ofextreme risk

• Sharpe – Omega ratio: this indicator was proposed recently by Kazemi et al. (2004)62. It is an
extension to the Sharpe ratio and Keating and Shadwick’s Omega (2002)63. It presents the advan-
tage of taking all the moments of the return distribution function into account and providing an
intuitive measure of the risk-adjusted performance of a fund.
• Alternative-Style-Risk Adjusted Performance (ASRAP): this performance measure is an adaptation
of the SRAP to performance measurement in the alternative universe. The risk is no longer adjusted
by the volatility but by the Cornish-Fisher extension to the VaR.
Note that it is advisable for all of these indica-
tors to correct the return series first for the
auto-correlation problems mentioned above.
Please see below for more details on the
method used.
• Calmar and Sterling Ratios: the original fea-
ture of these two risk-adjusted performance
indicators is to use the maximum drawdown
to define the risk dimension. The Calmar ratio
is equal to the fund’s return divided by its
maximum drawdown while the Sterling ratio
is equal to the fund’s return divided by 10%
plus the average drawdown (generally calcu-
lated over the last three years).
Beta and correlation analysis
Since the exposure of hedge funds to the dif-
ferent risk factors is dynamic and, in certain
cases, non-linear, it is essential to carry out
the following analyses, both at the FoHF level
and for each type of strategy and each type of
fund in which the FoHF invests:
- static and dynamic style analysis, notably
using pure style indices (cf. the Edhec alterna-
tive indices64). This analysis presents the par-
ticular advantage of highlighting any eventu-
al style drift;
- analysis of correlations and conditional /
unconditional betas with traditional equity
and bond indices M,
- analysis of correlations and conditional /
unconditional betas with risk factors that are
appropriate for the strategy of the fund or FoHF;
- dynamic factor analysis to track the evolu-
tion of the exposure to the risk factors select-
ed for the strategy followed.
This analysis gives investors a better under-
standing of the risks to which they are
exposed, which in turn gives them a more
accurate measurement of the risk-adjusted
performance of the fund and the genuine
diversification potential that it offers.
For more demanding investors, one can
attempt to enhance reports by attempting to
assess the alpha generated by the FoHF
through multi-factor/multi-index models
(peer groups [cluster], implementation of
Edhec Funds of Hedge Funds Reporting Survey22
EDHEC FUNDS OF HEDGE FUNDS REPORTING SURVEY - A RETURN-BASED APPROACH TO FUNDS OF HEDGE FUNDS REPORTING
Edhec recommendationsfor fund of hedge fund reporting
New Indicators
62 - Kazemi et al. (2004) – Opus Cit. 4863 - Cf. Keating and Shadwick (2002) – Opus Cit. 4964 - The Edhec indices are composite portfolios of competing indices that provide good representativity and minimise the problems of purity. Adetailed presentation of the construction method for the Edhec indices, together with their performance history, can de downloaded fromwww.edhec-risk.com.
implicit and explicit multi-factor methods,
Amenc-Curtis-Martellini’s implicit / explicit
multi-index model).
All the above-mentioned indicators provide
exhaustive information in the area of applied
quantitative analysis and enable the FoHF to
build quality reports for final investors. In line
with the expectations of the IRC, such reports
measure the risks of a FoHF and check on their
evolution without the need for details on the
positions. Nonetheless, as relevant as it might
or might not be, the client report alone does
not suffice. It should never replace the classic
due diligence process (questionnaires, on-site
visits, discussions with the manager, etc.).
Thorough knowledge of the fund is essential to
make up for any eventual weaknesses in the
quantitative analysis (no tool, for example,
allows the impact of off-balance sheet opera-
tions to be measured. These operations are not
taken into account at all by 27% of the respon-
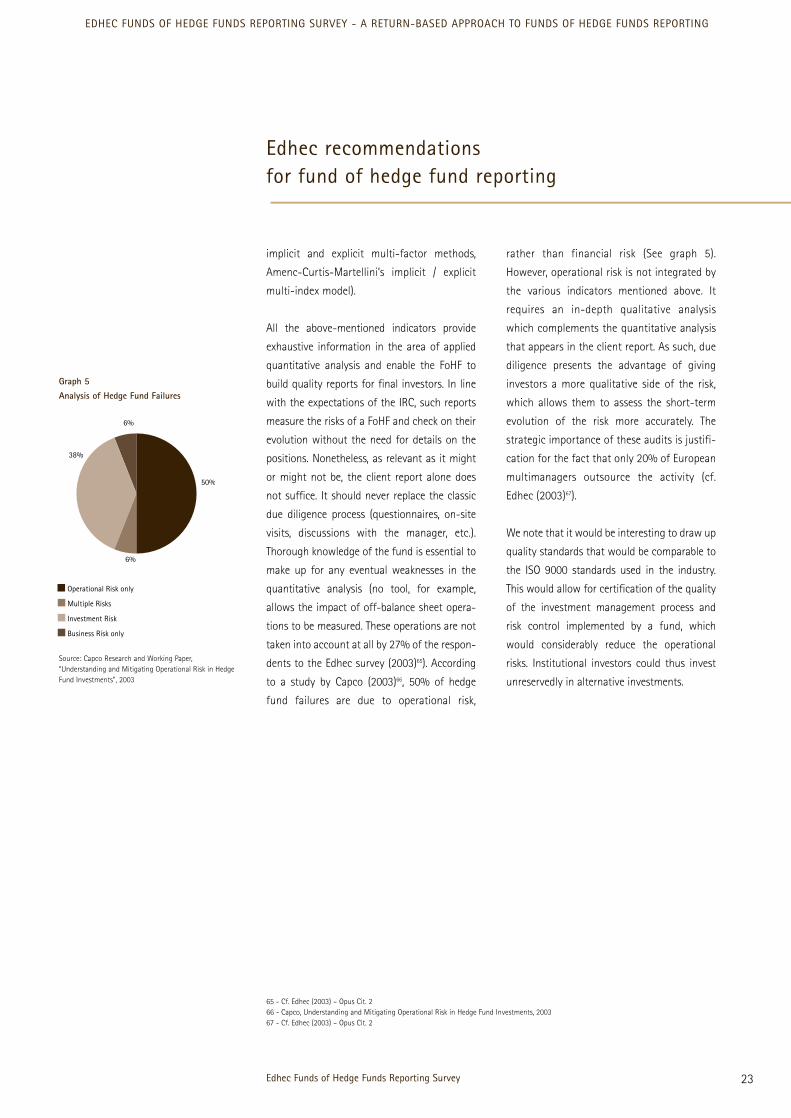
dents to the Edhec survey (2003)65). According
to a study by Capco (2003)66, 50% of hedge
fund failures are due to operational risk,
rather than financial risk (See graph 5).
However, operational risk is not integrated by
the various indicators mentioned above. It
requires an in-depth qualitative analysis
which complements the quantitative analysis
that appears in the client report. As such, due
diligence presents the advantage of giving
investors a more qualitative side of the risk,
which allows them to assess the short-term
evolution of the risk more accurately. The
strategic importance of these audits is justifi-
cation for the fact that only 20% of European
multimanagers outsource the activity (cf.
Edhec (2003)67).
We note that it would be interesting to draw up
quality standards that would be comparable to
the ISO 9000 standards used in the industry.
This would allow for certification of the quality
of the investment management process and
risk control implemented by a fund, which
would considerably reduce the operational
risks. Institutional investors could thus invest
unreservedly in alternative investments.
Edhec Funds of Hedge Funds Reporting Survey 23
EDHEC FUNDS OF HEDGE FUNDS REPORTING SURVEY - A RETURN-BASED APPROACH TO FUNDS OF HEDGE FUNDS REPORTING
Edhec recommendationsfor fund of hedge fund reporting
Graph 5
Analysis of Hedge Fund Failures
65 - Cf. Edhec (2003) – Opus Cit. 266 - Capco, Understanding and Mitigating Operational Risk in Hedge Fund Investments, 200367 - Cf. Edhec (2003) – Opus Cit. 2
Source: Capco Research and Working Paper,“Understanding and Mitigating Operational Risk in HedgeFund Investments”, 2003
Operational Risk only
Multiple Risks
Investment Risk
Business Risk only
6%
6%
50%
38%

24
EDHEC FUNDS OF HEDGE FUNDS REPORTING SURVEY - A RETURN-BASED APPROACH TO FUNDS OF HEDGE FUNDS REPORTING
Edhec Funds of Hedge Funds Reporting Survey

Presentation of theprincipal indicators

Analysis of the distributionfunction
The analysis of the distribution function
should never be limited to the first order
(mean) and second order (standard deviation)
moments. As we mentioned previously, hedge
fund returns are not normally distributed. It is
therefore essential to analyse the third order
(skewness) and fourth order (kurtosis)
moments.
SkewnessThe skewness indicator measures the return
distribution function’s asymmetry coefficient.
For an exhaustive series of N returns, the
skewness is equal to:
,
where ri corresponds to the ith return of the observed series of Nreturns, r is the mean of the returns, and σ the standard deviation.
Applied to a normal distribution, the skewness
would be equal to 0.
Kurtosis
The kurtosis allows the fatness of the distribution
tails to be assessed. A high level of kurtosis there-
fore means that there are extreme returns (outliers).
The kurtosis is calculated as follows:
with ri the ith of the observed series of N returns, r the mean of thereturns, and σ the standard deviation.
Applied to a normal distribution, the kurtosis would
be equal to 3. That is why we more commonly use
the excess kurtosis, i.e. the differential obtained
compared to a normal distribution, or:
-3
The Bera Jarque test
This indicator tests the normality of a distribution
function. It presents the advantage of simultane-
ously analysing the third and fourth order moments
of the distribution function.
where N is the number of observations. Under the assumption ofnormality, the BJ statistic follows a Chi-squared distribution with 2degrees of freedom.
Analysis of the auto-correlationcoefficients
The Ljung-Box test
Given that hedge funds take positions on assets
that are sometimes illiquid, their returns are liable
to be auto-correlated. In that case, it becomes diffi-
cult to measure the real exposure of hedge funds to
the different risk factors (market, volatility, credit,
etc.). The Ljung-Box test (1978)68 can be used to
assess the level of auto-correlation:
where N is the number of observations and θκ the κth order auto-correlation coefficient. Under the assumption that the auto-correla-tion coefficients of order 1 to m are null, the Q statistic follows aChi-squared distribution with m degrees of freedom.
Edhec Funds of Hedge Funds Reporting Survey26
EDHEC FUNDS OF HEDGE FUNDS REPORTING SURVEY - A RETURN-BASED APPROACH TO FUNDS OF HEDGE FUNDS REPORTING
Presentation of the principal indicators
68 - Cf. Ljung and Box (1978) - Opus Cit. 58

27
EDHEC FUNDS OF HEDGE FUNDS REPORTING SURVEY - A RETURN-BASED APPROACH TO FUNDS OF HEDGE FUNDS REPORTING
Presentation of the principal indicators
The Herfindahl index Taking the following system:
,
,
.
where R0t is the observed return of an asset, Rt the real return of
this fund and θt the auto-correlation coefficient of order t.
The auto-correlation coefficient of order m is
written as follows:
with
The Herfindahl index is between 0 and 1.
When it tends towards 1, the auto-correlation
(i.e. the liquidity risk) is low. The auto-correla-
tion is maximal when it tends towards 0.
Method for correcting auto-correlationcoefficientsNumerous methodologies have been proposed
to solve the problem of the auto-correlation
of the return series of certain assets: Blundell
and Ward (1987)69, Ross and Zisler (1991)70,
Geltner (1991 & 1993)71, Barkham and Geltner
(1994)72, Fisher et al. (1994)73, Brown and
Matysiak (1998)74, Cho et al. (2001)75 and
Okunev and White (2004)76.
In their analysis, Okunev and White (2004)77
show that only the first order auto-correlation
coefficients are systematically significant in
the case of alternative strategies (the second
order coefficients are only significant for some
of the indices that represent the convertible
arbitrage and fixed-income arbitrage strate-
gies). For simplicity purposes, we therefore
suggest correcting the first order auto-corre-
lation only, using the Geltner method (1991)78.
To do so, we simply consider that the return
observed at time t is equal to a linear combi-
nation of the real return recorded at t and the
return observed at t-1. It is thus easy to calcu-
late the real series of returns, because we have:
where Rt* is the return observed at t, Rt the return that was reallyrecorded at t, Rt-1* the return observed at (t-1) and a the first orderauto-correlation
We note that the evaluation of the risk-
adjusted performance of an asset for which
the return series is auto-correlated is liable
to be strongly biased. The same goes for the
evaluation of the exposures to the various
risk factors. We therefore suggest applying
the Geltner method (1991)79 presented
above before calculating the different per-
formance and risk indicators presented in
this document.
69 - Blundell, D. and Ward, C.W.R., 1987, Property Portfolio Allocation: A Multi Factor Model, Journal of Development Studies, N°4, p.145-156.70 - Ross, S.A. and Zisler, R., 1991, Risk and Return in Real Estate, Journal of Real Estate Finance and Economics, Vol.4, N°2, p.175-190.71 - Cf. Geltner (1991 & 1993) – Opus Cit. 23 & 2472 - Barkham, R. and Geltner, D., 1994, Unsmoothing British Valuation Based Returns without Assuming an Efficient Market, Journal of PropertyResearch, N°11, p.81-95.73 - Fisher, J.D., Geltner, D.M. and Webb R.B., 1994, Value Indices of Commercial Real Estate: A Comparison of Index Construction Methods, Journalof Real Estate Finance and Economics, N°9, p.137-164.74 - Brown, G.R. and Matysiak G.A., 1998, Valuation Smoothing without Temporal Aggregation, Journal of Property Research, N°15, p.89-103.75 - Cho, H., Kawaguchi, Y. and Shilling J.D., 2001, Unsmoothing Commercial Property Returns: A Revision to Fisher Geltner Webb’s UnsmoothingMethodology, Working Paper.76 - Cf. Okunev and White (2004) – Opus Cit. 1977 - Cf. Okunev and White (2004) – Opus Cit. 1978 - Cf. Geltner (1991) – Opus Cit. 2379 - Cf. Geltner (1991) – Opus Cit. 23

The Omega
Since hedge fund returns are not normally dis-
tributed, it is not appropriate to evaluate their
performance within a mean-variance frame-
work. The investor requires a performance
measurement tool that takes the first to fourth
order moments of the distribution function
into account. The Omega is therefore perfectly
suitable for evaluating the performance of
hedge funds because it considers the whole
distribution function of the asset that is being
evaluated. The main weakness of the Omega is
its sensitivity to the size of the sample because
at least 40-50 observations are necessary to
obtain relatively stable results.
where x is a random variable and F is the cumulative return distribu-tion function of the asset that is being evaluated. The constants a andb respectively represent the lower and upper boundaries of the distri-bution function. MAR corresponds to the minimal acceptable return.
We note that the choice of the MAR has par-
ticular importance in the calculation of the
Omega, because as Keating and Shadwick
(2002)80 stress, the classification of an asset
depends on this choice. Unfortunately there is
no absolute rule in this area. One thing is cer-
tain: the choice of the MAR has to be consis-
tent with the investors’ preferences.
The latter invest in FoHF for two reasons: to
improve their portfolio diversification (i.e.
exposure to various risk factors) and to limit
the risk of loss by taking advantage of the
manager’s skill in selecting the right funds (i.e.
preservation of capital). As a result, the MAR
can be set to the level of the risk-free rate.
In view of the lock-up periods imposed by
hedge funds and FoHF, investors are forced to
take their decisions in a multi-period frame-
work. Consequently, since they cannot redeem
their money whenever they want, they must
be sure that the current success of a fund is
not obtained at the expense of its future per-
formance. The success of a fund greatly
depends on its capacity to attract talented
managers. Given that managers’ remunera-
tion primarily depends on incentive fees, all
the returns below the hurdle rate (i.e. the
point above which funds are entitled to incen-
tive fees) tend to increase the probability that
the best managers will quit (i.e. diminishes the
fund’s future profit potential). It can therefore
be useful to account for the hurdle rate and
the high watermark provisions when setting
the MAR. We suggest integrating them into
the computation of the MAR as follows81:
where
where t corresponds to the month in which the MAR is computed,d is a dummy variable equal to 0 when the remuneration clause inthe fund contract does not include a high watermark provision and1 otherwise. Max NAVi is the highest historical level of the NAVthat served as a reference for calculating the incentive fees. CMGR(Compounded Monthly Growth Rate) is the actuarial growth rateenabling Max NAV to be reached between the MAR calculationdate (i.e. t) and the year end (i.e. 12). “Hurdle Rate” is the thresholdabove which the hedge fund is entitled to incentive fees.
Nonetheless, in order for each investor to be
able to compare, for a level of MAR that corre-
sponds to their own objectives, the Omega ratio
Edhec Funds of Hedge Funds Reporting Survey28
EDHEC FUNDS OF HEDGE FUNDS REPORTING SURVEY - A RETURN-BASED APPROACH TO FUNDS OF HEDGE FUNDS REPORTING
Presentation of the principal indicators
80 - Cf. Keating and Shadwick (2002) – Opus Cit. 4981 - We assume that the incentive fees are calculated at the end of the year (i.e. once a year).

of the FoHF with that of the reference indices
(for example, an equity index, a fixed-income
index and a portfolio corresponding to the
investor’s strategic allocation), we suggest that
the Omega function (i.e. the evolution of the
Omega ratio according to the level of the MAR)
be included in the FoHF’s monthly activity
report82. It would then be up to each investor to
identify the weight that corresponds to their
risk profile on the curve. It might also be inter-
esting to highlight the point that corresponds
to the value of the ratio that is calculated by
default, i.e. with a MAR obtained according to
the method presented above.
From the Sharpe ratio to theSharpe-Omega ratio
The Sharpe ratioThe Sharpe ratio intuitively measures the risk-
adjusted performance of an asset. It involves
measuring the excess return – or risk premium
– of a portfolio in relation to the risk-free rate,
compared to the total risk of the portfolio
measured by its standard deviation.
Sp
where E(Rp) denotes the portfolio’s expected return Rf denotes the return of the risk-free asset σ(Rp) denotes the standard deviation of the
portfolio’s returns
The main weakness of the Sharpe ratio is that
it takes the volatility as a measure of risk.
Since the hedge funds’ return distribution
function is asymmetrical, it is essential to take
the loss aversion of investors into account.
The Sortino ratio As a response to this criticism, Sortino pro-
posed his own ratio. It is defined like the
Sharpe ratio, but also allows the asymmetry of
the return distribution to be taken into
account by calling on the semi-variance. It
measures the excess return of a portfolio in
relation to a level of minimal acceptable
return (MAR), compared to the risk that is sit-
uated below the MAR only:
with RPt < MAR (MAR = monthly average minimal acceptablereturn), t = 1 to T (T being the total number of months for whichthe monthly return is situated below the MAR).
The Sortino ratio is perfectly suited to an
asymmetrical return distribution because, con-
trary to the measures that are based on the
standard deviation, the use of the semi-vari-
ance avoids one having to make an assump-
tion on the shape of the return distribution
function. Having said that, the measurement
of the downside risk (or the risk situated below
the MAR) is not problem-free. The main source
of error relates to the estimation of what
Sortino calls the location point. Given that the
MAR is determined in relation to this point, if
the location point is underestimated, then we
underestimate the downside risk and if the
location point is overestimated, we overesti-
mate the downside risk. The ratio is then
biased and does not allow the performance of
Edhec Funds of Hedge Funds Reporting Survey 29
EDHEC FUNDS OF HEDGE FUNDS REPORTING SURVEY - A RETURN-BASED APPROACH TO FUNDS OF HEDGE FUNDS REPORTING
Presentation of the principal indicators
82 - On this topic, we thank Con Keating for his astute advice and remarks.

Edhec Funds of Hedge Funds Reporting Survey30
EDHEC FUNDS OF HEDGE FUNDS REPORTING SURVEY - A RETURN-BASED APPROACH TO FUNDS OF HEDGE FUNDS REPORTING
the portfolio to be measured efficiently. For
that reason, we suggest, like for the Omega
ratio, the inclusion of the evolution of the
Sortino ratio according to the level of the MAR.
Moreover, we note that the practical applica-
tion of this ratio requires the portfolio’s return
distribution function to be determined. It is
thus necessary to turn to the historical data,
which can be biased if it is reported wrongly.
The Sharpe-Omega ratioThis ratio, which preserves the simplicity of
the Sharpe ratio and takes all the moments of
the distribution function into account, was
proposed recently by Kazemi et al. (2004)83.
The advantage of this indicator is that it pro-
vides the investor with the same information
as the Omega indicator while preserving the
spirit of the Sharpe ratio, hence the name, the
Sharpe – Omega ratio:
where P(MAR) represents the price of a European put option on theasset evaluated, with a maturity of 1 month and a strike price equalto the MAR.
We note that this means that the option pric-
ing method takes the fatness of the distribu-
tion tails of the hedge funds’ return distribu-
tion function into consideration. The Black &
Scholes method cannot therefore be applied.
From M2 to Alternative StyleRisk Adjusted Performance(ASRAP)
M2 (cf. Modigliani and Modigliani (1997)84) is an
indicator that allows the performance of all funds
to be measured in relation to the market portfo-
lio. An extension to this indicator, the Style Risk
Adjusted Performance, was proposed by Lobosco
(1999)85 to take the impact of the management
style of the asset being evaluated into account.
In M2 and the SRAP, the level of risk is fitted with
the volatility. However, as we have stressed on
several occasions, hedge fund risk is not limited to
the second order moment of their return distrib-
ution function; it is imperative to take the extreme
risks into account (i.e. third and fourth order
moments of the return distribution function).
To integrate the higher order moments, one
solution is to take the Cornish-Fisher VaR (see
below for a definition of the Cornish-Fisher
VaR) as a risk indicator. We obtain the follow-
ing indicator:
where IFOHF is a FoHF index and HF the hedge fund being analysed.As Fung and Hsieh (2002)86 suggest, the FoHF index offers the bestpossible approximation of the hedge fund universe. RHF and Rf arerespectively the mean return of the hedge fund and the risk-freerate. VaRCornish-Fisher (HF) and VaRCornish-Fisher (IFOHF) are respectively theVaR calculated according to the Cornish-Fisher extension of thefund being analysed and the FoHF index.
The ARAP thereby allows two funds that follow
the same strategy to be compared. If the two
funds follow different strategies, one simply
adapts the SRAP as follows:
ASRAP = ARAP (fund) – ARAP (style index).
The Alternative Style Risk Adjusted
Performance or ASRAP thus allows the RAP
and the SRAP to be adapted to performance
measurement in the alternative universe.
Presentation of the principal indicators
83 - Kazemi et al. (2004) – Opus Cit. 4884 - Modigliani, F. and Modigliani, L., 1997, Risk Adjusted Performance, Journal of Portfolio Management, Winter 1997, Vol.23, Issue 2, p.45-54.85 - Lobosco, A., 1999, Style Risk Adjusted Performance, Journal of Portfolio Management, Vol.25, N°3, Spring 1999, p.65-68.86 - Cf. Fung and Hsieh (2002) – Opus Cit. 11
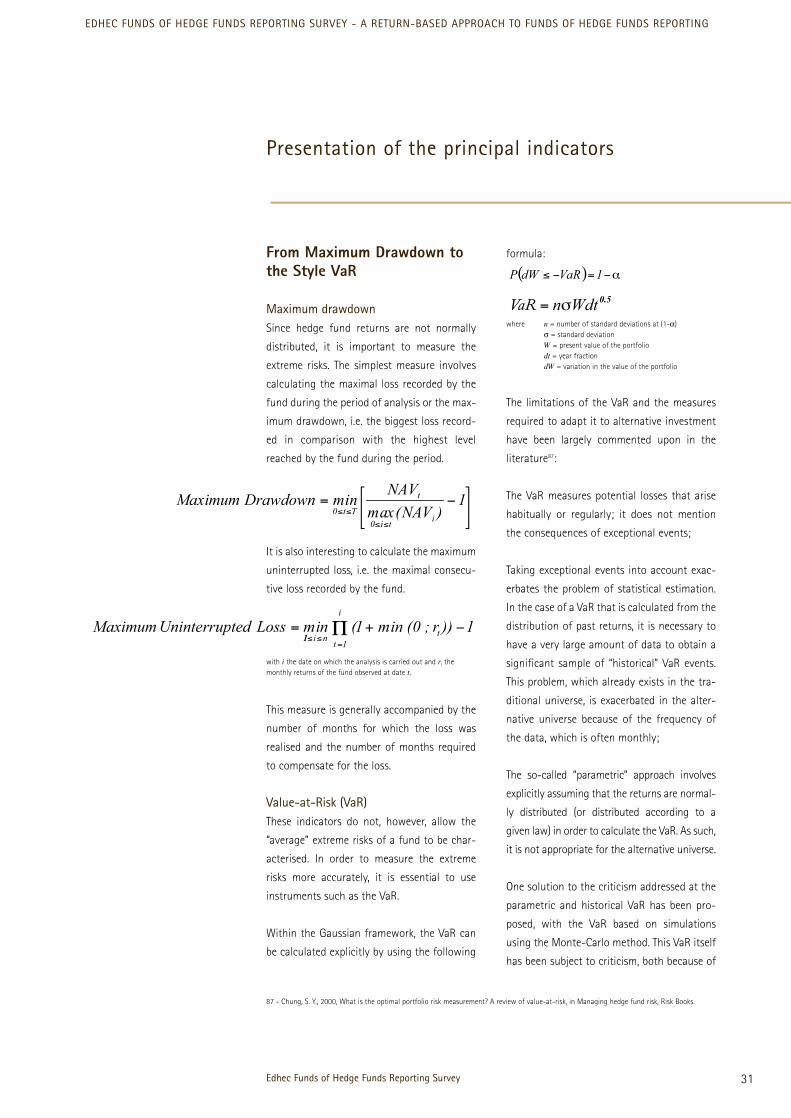
Edhec Funds of Hedge Funds Reporting Survey 31
EDHEC FUNDS OF HEDGE FUNDS REPORTING SURVEY - A RETURN-BASED APPROACH TO FUNDS OF HEDGE FUNDS REPORTING
From Maximum Drawdown tothe Style VaR
Maximum drawdownSince hedge fund returns are not normally
distributed, it is important to measure the
extreme risks. The simplest measure involves
calculating the maximal loss recorded by the
fund during the period of analysis or the max-
imum drawdown, i.e. the biggest loss record-
ed in comparison with the highest level
reached by the fund during the period.
It is also interesting to calculate the maximum
uninterrupted loss, i.e. the maximal consecu-
tive loss recorded by the fund.
with i the date on which the analysis is carried out and rt themonthly returns of the fund observed at date t.
This measure is generally accompanied by the
number of months for which the loss was
realised and the number of months required
to compensate for the loss.
Value-at-Risk (VaR)These indicators do not, however, allow the
“average” extreme risks of a fund to be char-
acterised. In order to measure the extreme
risks more accurately, it is essential to use
instruments such as the VaR.
Within the Gaussian framework, the VaR can
be calculated explicitly by using the following
formula:
where n = number of standard deviations at (1-α)σ = standard deviationW = present value of the portfoliodt = year fractiondW = variation in the value of the portfolio
The limitations of the VaR and the measures
required to adapt it to alternative investment
have been largely commented upon in the
literature87:
The VaR measures potential losses that arise
habitually or regularly; it does not mention
the consequences of exceptional events;
Taking exceptional events into account exac-
erbates the problem of statistical estimation.
In the case of a VaR that is calculated from the
distribution of past returns, it is necessary to
have a very large amount of data to obtain a
significant sample of “historical” VaR events.
This problem, which already exists in the tra-
ditional universe, is exacerbated in the alter-
native universe because of the frequency of
the data, which is often monthly;
The so-called “parametric” approach involves
explicitly assuming that the returns are normal-
ly distributed (or distributed according to a
given law) in order to calculate the VaR. As such,
it is not appropriate for the alternative universe.
One solution to the criticism addressed at the
parametric and historical VaR has been pro-
posed, with the VaR based on simulations
using the Monte-Carlo method. This VaR itself
has been subject to criticism, both because of
Presentation of the principal indicators
87 - Chung, S. Y., 2000, What is the optimal portfolio risk measurement? A review of value-at-risk, in Managing hedge fund risk, Risk Books.

Edhec Funds of Hedge Funds Reporting Survey32
EDHEC FUNDS OF HEDGE FUNDS REPORTING SURVEY - A RETURN-BASED APPROACH TO FUNDS OF HEDGE FUNDS REPORTING
the considerable size of the simulations
implemented, and therefore the amount of
calculation involved, and because it often uses
a normal distribution of the risk factor returns
(semi-parametric VaR). The resulting simplifi-
cation of the Monte-Carlo simulations contra-
dicts the goal of going beyond the unrealistic
initial framework of the parametric VaR.
Faced with these difficulties, investors and
managers have come up with interesting solu-
tions (stress testing, scenario analysis, more
complex modelling of the distribution tails
with extreme value theory). These "variations"
on the management and measurement of
extreme risks should, in our opinion, be popu-
larised and generalised and thereby permit a
relative appreciation of the parametric risk and
return measures. The latter are totally inappro-
priate for the alternative universe and this
approach would allow for better management
of the benefits of alternative diversification.
Cornish-Fisher VaR The Cornish-Fisher VaR is a pragmatic applica-
tion of the VaR calculation in a fat tail distrib-
ution environment (cf. Favre and Galeano
(2002)88). This method initially consists of calcu-
lating a VaR using a normal distribution formu-
la and then a Cornish-Fisher expansion to take
the skewness and excess kurtosis into account:
where Zc = the critical value of the probability (1- α)S = the skewnessK = the excess kurtosis (i.e. kurtosis minus 3)
The adjusted VaR is therefore equal to:
It should be noted that if the distribution is
normal, S and K are equal to zero and conse-
quently, z=Zc, and we come back to the
Gaussian VaR.
Incremental and component Cornish-Fisher VaRThe principle behind the incremental VaR is
the same as that of the marginal VaR. It
involves measuring the effect on the portfo-
lio’s VaR of a variation in the weight of asset i
in the composition of that portfolio. However,
in the case of the Marginal VaR, the goal is to
measure the impact of a marginal variation in
the weight of one of the instruments held in
the portfolio, while for the Incremental VaR it
involves assessing the impact of introducing a
new instrument into the portfolio. The relative
variation in the weight is therefore liable to be
much more significant in the case of the
Incremental VaR and thereby lead to a non-
linear variation in the portfolio’s VaR. The fol-
lowing formula gives an approximate value
for the Incremental VaR (IVaR)89:
Presentation of the principal indicators
88 - Favre, L. and Galeano J. A., 2002, Mean Modified Value-at-Risk Optimization with Hedge Funds, The Journal of AlternativeInvestments, Fall, Vol.5, N°2, p.21-2589 - Refer to Jorion, 2001, Value at Risk, McGraw Hill, for more detailed information on the Incremental VaR.

with
where p corresponds to the vector of the initial weights of the port-folio and a to the vector of the new positions. VaRp+a is the VaR ofthe portfolio after introducing new instruments and VaRp the VaRof the initial portfolio. Finally, (∆VaR)T is the transpose of the vectorof the marginal VaRs, which are defined as the partial derivatives ofthe VaR of the portfolio in relation to the variations in weights cau-sed by the introduction of new instruments.
Once the Incremental VaR has been calculated,
one simply multiplies by the weight that asset i
represents in the portfolio to obtain the
Component VaR. This Component VaR gives us
the contribution of asset i to the total VaR of
the portfolio. This tool is particularly useful for
gaining a good understanding of the risks of a
portfolio and therefore for managing them
better. For example, in a fund of funds, it allows
the strategy that increases or diminishes the
VaR to be determined; one just needs to know
the share allocated to each of the strategies.
We note an interesting property: the sum of
the Incremental VaRs is equal to the total VaR
of the portfolio (cf. formula above). Finally, the
VaR calculation method proposed by Cornish-
Fisher should be used to integrate the third
and fourth order moments of the distribution
function.
Beyond VaR
Unlike the VaR, which merely gives an indication of
the frequency of occurrence of a loss that exceeds
a certain fixed amount for a given confidence
interval, BVaR informs us on the frequency and
also the amount of the maximal loss beyond the
VaR (hence the name). It therefore involves calcu-
lating, for a given time horizon and confidence
threshold, the average loss that an investor is liable
to record beyond the VaR threshold. As shown by
Longin (2001)90, BVaR is applied both to portfolios
that include option instruments and those that
have fat distribution tails. From a statistical point
of view, this calculation is subject to very strong
statistical risk, given that it is only based on a very
small number of observations. On the other hand,
it is a risk measure that satisfies the property of
sub-additivity, i.e. that the risk of a portfolio is
lower than or equal to the sum of the risks of the
different positions that make up the portfolio (cf.
Artzner et al. (1999)91). Basak and Shapiro (1999)92
have shown that taking into account the first
order moment of the distribution of the losses
beyond the VaR was sufficient to obtain a satis-
factory loss profile. They conclude that taking
BVaR into account as a constraint in the allocation
process allows one to obtain strategies for which
the range of extreme risks is limited.
BVaR is especially useful when the return distribu-
tion function of a strategy has fat distribution tails.
In that case, the higher the VaR, the more the loss-
es beyond the VaR are dispersed. The difference
between the BVaR and the VaR tends towards
infinity. As a result, calculating the VaR alone is not
sufficient. Calculating the BVaR allows the disper-
sion to be taken into account and thus provides a
genuine measure of the risk of extreme losses.
In the case of a strategy that integrates option
instruments, i.e. with a non-linear return pro-
file, Vorst (2000)93 has shown that under certain
conditions the VaR calculated for linear posi-
tions could be equal to the VaR calculated for
Edhec Funds of Hedge Funds Reporting Survey 33
DISCUSSION PAPER - FUND OF HEDGE FUND REPORTING - A RETURN-BASED APPROACH TO FUND OF HEDGE FUND REPORTING
Presentation of the principal indicators
90 - Longin, F., 2001, Beyond the VAR, Journal of Derivatives, Summer 2001, Vol. 8, Issue 4, p.36.91 - Artzner, P., F. Delbean, Eber, J.-M and Heath, D., 1999, Coherent Measures of Risk, Mathematical Finance, July 1999, Vol. 9, Issue 3,p.203-228.92 - Basak, S., and Shapiro, A., 1999, Value-at-Risk Based Risk Management: Optimal Policies and Asset Prices, Working Paper, New YorkUniversity.93 - Vorst, T. 2000, Optimal Portfolios under a Value-at-Risk Constraint, Report 2001, Erasmus University, Rotterdam.

non-linear positions, even though the distribu-
tion profiles of the two types of positions are
completely different beyond the VaR. The non-
linear positions are characterised by a wide dis-
persion of extreme events and the greater the
leverage effect, the wider the dispersion.
Alternative strategies are characterised by fat
return distribution tails and the use of option
products that involve considerable leverage.
These characteristics make the use of BVaR
indispensable within the framework of esti-
mating extreme events.
Style VaR94
This firstly involves calculating the exposure of
the FoHF to a set of N alternative indices rep-
resenting the risk factors (if possible, choose
pure indices: composite indices drawn from
the various competing alternative indices), as
illustrated in the multi-factor model below:
RP = α + Σiβi.Xi + ε, the Xi (i = 1 to N) corre-
sponding to the returns of the N alternative
indices (one index for each type of strategy:
fixed-income arbitrage, convertible arbitrage,
market neutral, event driven, long/short, etc.).
The original feature of this model compared to
that of Sharpe (1992)95 can be found at the level
of the constraints imposed on the coefficients. To
take into account the fact that hedge funds use
leverage, the portfolio constraint is removed (i.e.
the sum of the coefficients can exceed 1). We
note that in Lhabitant (Opus cit. 42), the weight
positivity constraint is maintained because the
author considers that it is difficult, from an eco-
nomic point of view, to interpret a negative coef-
ficient on a style index. We also note that this
weight constraint causes the property of orthog-
onality between the regressors and the residuals
to be lost, in such a way that the decomposition
between specific and systematic risk is not exact
(a residual correlation term remains). Fortunately,
we can imagine removing the weight positivity
constraint to account for the fact that hedge
funds can sell securities short.
We then simultaneously apply to each index
its worst variation in order to analyse the
impact on the fund. We can thereby deduce
the Value at Market Risk:
Φi being in this equation the extreme quantile (percentile) of the performance of the alternative index i during a month, ρi,j
the correlation coefficient between the indices (covariance relativeto the product of their standard deviations)
Since the market risk (systematic risk due to the
styles) is evaluated in that way, we can deduce
the specific risk from this through the differ-
ence with the total risk of the fund (σ2p), or:
The percentile of the specific risk (VaSRp) can
be estimated, for a confidence interval set at
99%, at 2.33 * σε if we assume that the resid-
uals are normally distributed96.
From there, we can calculate the VaR of the fund:
Edhec Funds of Hedge Funds Reporting Survey34
DISCUSSION PAPER - FUND OF HEDGE FUND REPORTING - A RETURN-BASED APPROACH TO FUND OF HEDGE FUND REPORTING
Presentation of the principal indicators
34
94 - Cf. Lhabitant (Opus Cit. 42) for more detailed information on the method.95 - Cf. Sharpe (1992) – Opus Cit. 4096 - We note that this does not mean that the returns are normally distributed.

Conclusion of the consultation
period

Edhec Funds of Hedge Funds Reporting Survey36
EDHEC FUNDS OF HEDGE FUNDS REPORTING SURVEY - A RETURN-BASED APPROACH TO FUNDS OF HEDGE FUNDS REPORTING
The debate on FoHF reporting poses the ques-
tion of investor information. As such, it is very
much a part of the process of the institutional-
isation of the alternative investment industry.
What is the information that investors
absolutely must possess in order to measure
and manage the risks to which they are
exposed in a satisfactory way? The degree of
transparency necessary to obtain this relevant
information is the subject of considerable
debate. On the one hand there are those who,
on the pretext of better investor protection,
plead for the absolute transparency of hedge
funds, and on the other hand, those for whom
alternative investment, by its very nature, can-
not accommodate any transparency. Our posi-
tion is more nuanced.
In the first sections of this document we pro-
posed a series of risk-adjusted performance
and risk indicators that allow the specific char-
acteristics of the performance of alternative
strategies to be taken into account without
necessitating the disclosure of individual posi-
tions. Nonetheless, to allow investors to mea-
sure and manage the risks to which they are
exposed, it is essential for funds of hedge funds
to communicate details on their returns by
asset group, by management style, by sector, by
country, or by any other criterion that is con-
sidered to be relevant with regard to the
sources of return. That is not systematically the
case today. In the interest of investors (i.e. for
better risk management), but also in the inter-
est of the funds of hedge funds themselves (i.e.
to attract institutional investors), it is necessary
for the latter to make a move towards greater
transparency.
As such, our contribution is to propose a prag-
matic solution that allows final investors to be
offered relevant information without simulta-
neously placing FoHF at risk. However, estab-
lishing and imposing a standard monthly
report is not an easy task. It requires reconcili-
ation of the often-conflicting interests of mar-
ket participants (i.e. fund managers and
investors), and thus implies reaching a compro-
mise between their specific needs and con-
straints. By so doing, one can hope that in the
end they will all adhere to the project and abide
by standard rules. For this reason, we decided
to confront investor and manager perspectives
on the sensitive issue of the content of FoHF
reports. In other words, we asked for their def-
inition of relevant information. The following
section is dedicated to the analysis of the
insightful comments and suggestions we
received from 98 professionals, who sponta-
neously decided to take part in our examination
of FoHF reporting. These professionals work for
major traditional and alternative institutions,
representing over $1.1 trillion in assets under
management. The results we obtained should
thus provide an accurate reflection of the sen-
timents and investment practices of market
participants.
Conclusion of the consultation period

As can be seen from Panel A, FoHF managers
showed great interest in taking part in our
investigation into the definition of relevant
information. As a matter of fact, 61% of our
respondents were FoHF managers, and only
39% were investors. Information will definitely
be a key success factor for FoHF in the future,
which doubtless explains why FoHF managers
wanted to participate in discussions about
defining the content of FoHF reports. To avoid
any bias in our definition of the relevant infor-
mation, we will differentiate between man-
agers’ and investors’ answers when useful
points can be made. As regards the average size
of respondents, we can see in Panel A that the
breakdown is well balanced, with 34% small
funds (i.e. under $250m), 33% medium-sized
funds (i.e. from $250m to $1bn) and 33% large
funds (i.e. over $1bn). A large majority of
respondents appear to be experienced profes-
sionals, with 73% of them having at least 5
years of experience in the asset management
industry. We should thus benefit from their
awareness of the technical and theoretical chal-
lenges that the alternative industry is currently
facing with regard to investor information.
To make sure that our analysis would not be
biased due to the heterogeneity of respondents,
we further investigated the profile of the
investors and managers who took part in the
study. As can be seen from Panel B and Panel C,
our sample is relatively homogeneous in terms
of both fund size and respondent experience.
Edhec Funds of Hedge Funds Reporting Survey 37
EDHEC FUNDS OF HEDGE FUNDS REPORTING SURVEY - A RETURN-BASED APPROACH TO FUNDS OF HEDGE FUNDS REPORTING
Profile of the respondents
FoHF Manager
Investor
39%61%
> $5 bn
$1 bn to $5 bn
<$250 mn
$250 mn to $1 bn
34%
33%
21%
12%
> 15 years
5 to 15 years
< 5 years
27%
22%
51%
Panel A: Profile of the Respondents
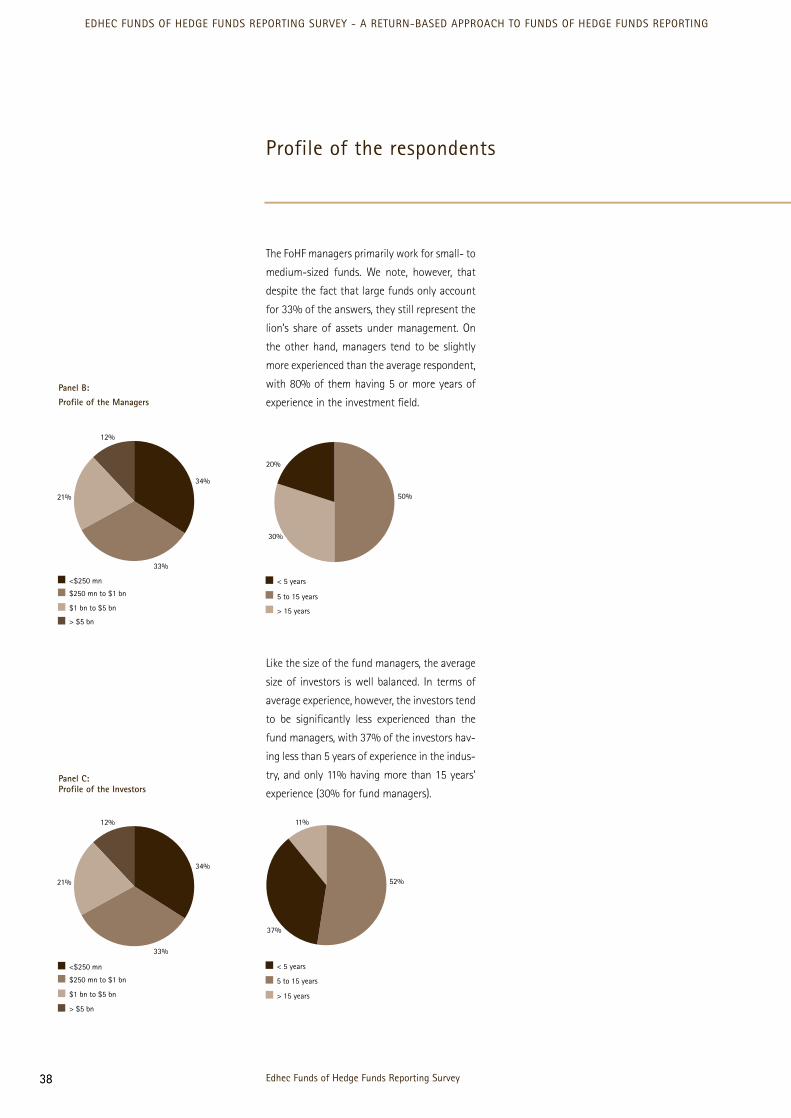
The FoHF managers primarily work for small- to
medium-sized funds. We note, however, that
despite the fact that large funds only account
for 33% of the answers, they still represent the
lion’s share of assets under management. On
the other hand, managers tend to be slightly
more experienced than the average respondent,
with 80% of them having 5 or more years of
experience in the investment field.
Like the size of the fund managers, the average
size of investors is well balanced. In terms of
average experience, however, the investors tend
to be significantly less experienced than the
fund managers, with 37% of the investors hav-
ing less than 5 years of experience in the indus-
try, and only 11% having more than 15 years’
experience (30% for fund managers).
Edhec Funds of Hedge Funds Reporting Survey38
EDHEC FUNDS OF HEDGE FUNDS REPORTING SURVEY - A RETURN-BASED APPROACH TO FUNDS OF HEDGE FUNDS REPORTING
Profile of the respondents
38
> $5 bn
$1 bn to $5 bn
$250 mn to $1 bn
<$250 mn
34%
12%
21%
33%
< 5 years
> 15 years
5 to 15 years
50%
20%
30%
Panel B:
Profile of the Managers
> $5 bn
$1 bn to $5 bn
$250 mn to $1 bn
<$250 mn
34%
12%
21%
33%
> 15 years
5 to 15 years
< 5 years
11%
37%
52%
Panel C: Profile of the Investors

Before going into more detail, and covering the
range of risk and performance indicators that
should be included in the activity report disclosed
to investors, the first question to answer concerns
the frequency of publication and the granularity
of the report. What is the best solution according
to investors and fund managers: an exhaustive
monthly report or a less detailed weekly report?
Which provides a better fit in terms of the needs
of investors and the capacity of managers?
In line with the findings of a previous study on
European multimanagement investment prac-
tices (see Edhec (2003)97), a large majority of
market participants, 67%, considers that the
monthly activity report can account for most of
the issues relating to the risk and return dimen-
sions. Surprisingly, however, fund managers
appear to be more demanding than investors in
terms of publication frequency. While 30% of
them doubt that monthly frequency is enough
to monitor risk properly, only 21% of the
investors think so. This result seems to contrast
with what is usually said on the insatiable need
for information of investors. One distinction
must however be made among fund managers.
Managers of small FoHF tend to be more inclined
to publish more frequent data (respectively 29%
and 13% of small and large fund managers con-
sider that monthly frequency is not enough),
especially to account for issues like intra-month
volatility or weekly drawdowns. The reluctance
of large funds to publish results on a weekly
basis is doubtless due to the operational limita-
tions inherent in cumbersome structures.
However, the answers suggest that while large
structures tend be less flexible, and as a result,
generally plead in favour of monthly frequency,
they tend at the same time to be more inclined
than small structures to give detailed reports,
with data aggregated at strategy or even fund
level. This is certainly due to their desire to take
advantage of their sophisticated IT systems in
order to set high entry barriers, especially
towards small- and medium-sized funds.
Interestingly, it turns out that this corresponds
precisely to the needs of investors. Indeed,
most of them appear to be looking for detailed
information rather than frequent information
(i.e. 79% of investors want information at fund
level, 74% at strategy group level and 63% at
strategy level). Some investors even ask for
details on the position pricing policy of under-
lying funds. However, it is worth noting that
most of them appear to be aware of the overkill
effect that too much information represents.
Collecting and processing large amounts of
information is time consuming and implies
huge costs for the fund (meaning lower net
returns for investors), whereas the marginal
utility for investors is relatively low since they
do not have the time to analyse this flow of
Edhec Funds of Hedge Funds Reporting Survey 39
EDHEC FUNDS OF HEDGE FUNDS REPORTING SURVEY - A RETURN-BASED APPROACH TO FUNDS OF HEDGE FUNDS REPORTING
Granularity and frequency
Illustration 7:
Do you see any acute issue as regards boththe risk and return dimensions that could notbe accounted for in a monthly activity report?
0
10
20
30
40
50
60
70
80
90
100
NoYes
27
67
30
63
21
74
%
All respondents FoHF Managers Investors
%
FoHF Managers
Investors
All Respondents
0
10
20
30
40
50
60
70
80
90
100
Othe
r
Asse
t Typ
e
Coun
try
Curr
ency
Stra
tegy
Gro
up
Stra
tegy
Fund
6755
43
74
20
13
32
7
14 1316
3733
42
80
90
0
63
79
60
4
Illustration 8:
How should information ideally be aggregatedin the monthly activity report?
97 - Edhec European Alternative Multimanagement Practices Survey, 2003 – Opus Cit.2

information. Fund managers place emphasis on
information aggregated by strategy (90%) and
to a lesser extent by strategy group (43%) and
by fund (60%). After these, aggregation at asset
type level is considered the most useful by
managers and investors (respectively 33% and
42%). However, as stressed by several partici-
pants, liquidity is an acute issue in the alterna-
tive arena; assets could thus be classified
according to their level of liquidity within strat-
egy groups or strategies (i.e. monthly, quarterly
and annually). Finally, aggregation at the cur-
rency or regional level is regarded as interest-
ing but not necessary.
Edhec Funds of Hedge Funds Reporting Survey40
EDHEC FUNDS OF HEDGE FUNDS REPORTING SURVEY - A RETURN-BASED APPROACH TO FUNDS OF HEDGE FUNDS REPORTING
Granularity and frequency
As a conclusion, most investors and managers ask for monthly frequency and reports including
principally three levels of aggregation, namely strategy group, strategy and fund. Many of them also
agree on the fact that detailed information should not be given for every single fund contained in
the portfolio. We thus suggest fitting the degree of granularity of the information to the aggrega-
tion level. In other words, we propose to increase the quantity of information at higher aggregation
levels (e.g. strategy group), and decrease it at lower aggregation levels (e.g. fund). We argue on the
other hand that a breakdown by asset type and level of liquidity should be given at the strategy
group level.

As expected, 100% of investors and fund man-
agers consider that monthly return figures
should be included in FoHF reports. More sur-
prising, however, is the lower level of interest of
investors and, to a lesser extent, fund managers,
in annual figures (76% on average consider
monthly figures to be very important versus
51% for annual figures). This is all the more sur-
prising in that investors and fund managers are
often forced to have up to annual investment
horizons. Indeed, due to both the significant
illiquidity caused by long lock-up and redemp-
tion periods and also funds’ illiquid underlying
positions, it is technically difficult to allow for
monthly or even quarterly entry and exit. It is
thus inconsistent and even dangerous for
investors and fund managers to focus on short-
term performance, because it forces fund man-
agers to maximize their short-term perfor-
mance, and it is well known that short-sighted
investment strategies rarely serve investors’
long-term interests. The same conclusion can be
drawn at the strategy and fund levels, with 31%
of respondents rating monthly returns as very
important, compared to 20% for annual returns.
Nevertheless, it is worth noting that investors
and fund managers, although they are more
inclined to receive monthly rather than annual
figures, appear in practice to be reluctant to
forgo detailed information on underlying fund
performance. As a result, only 20% of them
think that monthly returns should not be dis-
closed at fund and strategy levels.
.
Interestingly, while 97% (respectively 80%) of
fund managers consider that year-to-date
returns (respectively cumulative returns since
inception) are important to very important, only
79% (respectively 58%) of investors think so,
and 21% of them (respectively 42%) even think
that they are not important. This discrepancy of
appreciation is certainly due to the fact that
investors are expecting absolute returns, and
are thus less interested in cumulative returns or
YTD indicators (i.e. absolute returns systemati-
cally lead to positive YTD or cumulative returns).
Fund managers, however, emphasize these
measures, doubtless to stress the quality of their
management (i.e. to show that in the long run
profits outweigh losses). Nevertheless, on aver-
age, 90% of respondents think that such infor-
mation is important to very important, and
should thus be integrated in the report.
In the same vein, results indicate that 72% of
respondents consider that relative returns should
be disclosed in monthly activity reports. However,
this consensus masks the fact that investors are
more interested in absolute performance than
fund managers. While only 58% of investors are
interested in receiving the cumulative perfor-
mance of a fund relative to a benchmark, 80% of
managers consider that it is important to very
important information. This raises an important
issue. Hedge funds have historically been associ-
ated with the absolute return paradigm, but this
is not consistent with the very nature of hedge
funds. Hedge fund returns, like traditional invest-
ment vehicle returns, are influenced by beta and
alpha drivers. Beta drivers correspond to the fair
reward for exposures to risk factors, and alpha
drivers to the talent of the manager. There is
however a significant difference between tradi-
tional and alternative investment vehicles. While
the former generally follow buy-and-hold strate-
gies, the latter implement dynamic strategies. As
a result, hedge fund beta drivers are made up of
two distinct components, i.e. static and dynamic
beta drivers. It thus makes sense to calculate the
Edhec Funds of Hedge Funds Reporting Survey 41
EDHEC FUNDS OF HEDGE FUNDS REPORTING SURVEY - A RETURN-BASED APPROACH TO FUNDS OF HEDGE FUNDS REPORTING
Return analysis
Very Important
Very Important
Fund Managers
Important
Not Important
Irrelevant
7%
20%
27%
47%
Very Important
Important
Not Important
11%
42%
47%
Investors
Graph 9 and 10 How important, in your opinion, is the history of monthly returns?
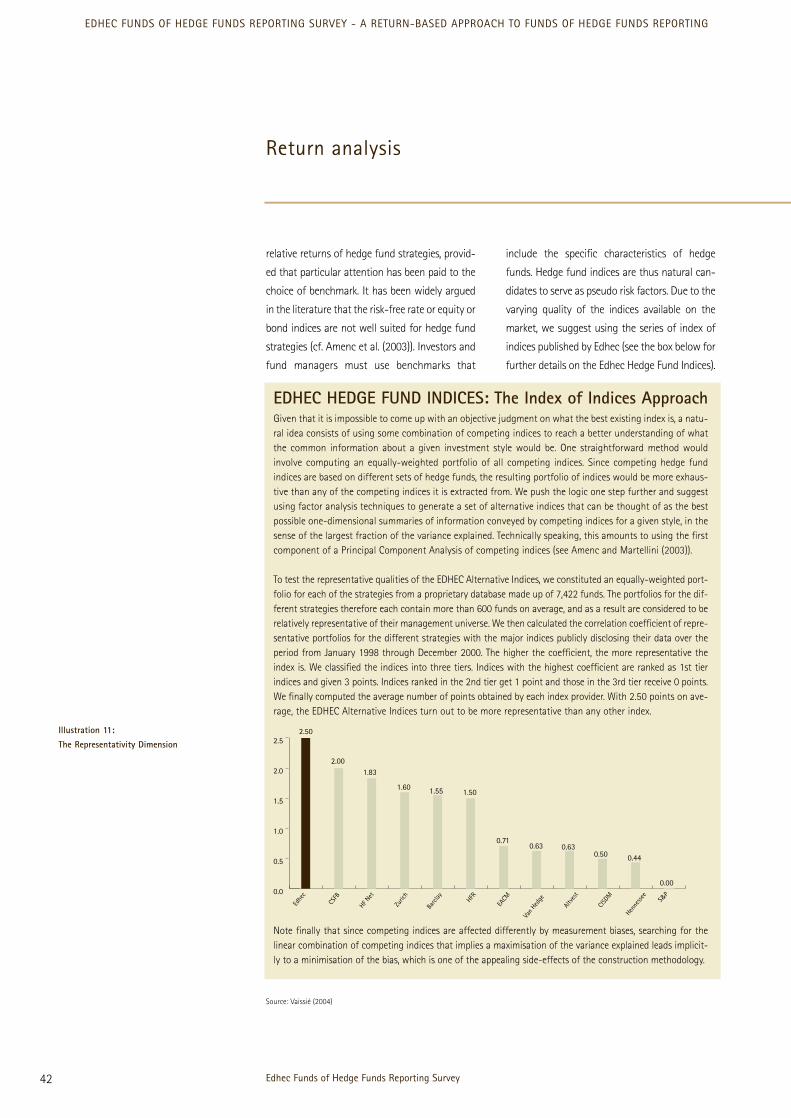
relative returns of hedge fund strategies, provid-
ed that particular attention has been paid to the
choice of benchmark. It has been widely argued
in the literature that the risk-free rate or equity or
bond indices are not well suited for hedge fund
strategies (cf. Amenc et al. (2003)). Investors and
fund managers must use benchmarks that
include the specific characteristics of hedge
funds. Hedge fund indices are thus natural can-
didates to serve as pseudo risk factors. Due to the
varying quality of the indices available on the
market, we suggest using the series of index of
indices published by Edhec (see the box below for
further details on the Edhec Hedge Fund Indices).
Edhec Funds of Hedge Funds Reporting Survey42
EDHEC FUNDS OF HEDGE FUNDS REPORTING SURVEY - A RETURN-BASED APPROACH TO FUNDS OF HEDGE FUNDS REPORTING
Return analysis
EDHEC HEDGE FUND INDICES: The Index of Indices Approach Given that it is impossible to come up with an objective judgment on what the best existing index is, a natu-ral idea consists of using some combination of competing indices to reach a better understanding of whatthe common information about a given investment style would be. One straightforward method wouldinvolve computing an equally-weighted portfolio of all competing indices. Since competing hedge fundindices are based on different sets of hedge funds, the resulting portfolio of indices would be more exhaus-tive than any of the competing indices it is extracted from. We push the logic one step further and suggestusing factor analysis techniques to generate a set of alternative indices that can be thought of as the bestpossible one-dimensional summaries of information conveyed by competing indices for a given style, in thesense of the largest fraction of the variance explained. Technically speaking, this amounts to using the firstcomponent of a Principal Component Analysis of competing indices (see Amenc and Martellini (2003)).
To test the representative qualities of the EDHEC Alternative Indices, we constituted an equally-weighted port-folio for each of the strategies from a proprietary database made up of 7,422 funds. The portfolios for the dif-ferent strategies therefore each contain more than 600 funds on average, and as a result are considered to berelatively representative of their management universe. We then calculated the correlation coefficient of repre-sentative portfolios for the different strategies with the major indices publicly disclosing their data over theperiod from January 1998 through December 2000. The higher the coefficient, the more representative theindex is. We classified the indices into three tiers. Indices with the highest coefficient are ranked as 1st tierindices and given 3 points. Indices ranked in the 2nd tier get 1 point and those in the 3rd tier receive 0 points.We finally computed the average number of points obtained by each index provider. With 2.50 points on ave-rage, the EDHEC Alternative Indices turn out to be more representative than any other index.
Note finally that since competing indices are affected differently by measurement biases, searching for thelinear combination of competing indices that implies a maximisation of the variance explained leads implicit-ly to a minimisation of the bias, which is one of the appealing side-effects of the construction methodology.
2.50
2.001.83
1.60 1.55 1.50
0.710.63 0.63
0.50 0.44
0.000.0
0.5
1.0
1.5
2.0
2.5
S&P
Henne
ssee
CISD
M
Altv
est
Van
Hedge
EACMHFR
Barcl
ay
Zuric
h
HF Net
CSFB
Edhe
c
Illustration 11:
The Representativity Dimension
Source: Vaissié (2004)

Again, investors and fund managers agree on the
need to integrate indicators like percentage of
positive and negative returns (respectively per-
centage of up/down months in up/down mar-
kets) in the monthly activity report (82% and
89% of respondents, respectively, think of this as
important to very important information).
Finally, in the alternative arena, like in the tradi-
tional world, the first step in the investment
process is to compare the investment opportuni-
ties available. However, since information is
somewhat sketchy when it comes to hedge funds
or FoHF, investors often have to compare apples
with pears. FoHF often have different track record
lengths, so it is difficult to attribute return differ-
ences to sample issues or to manager talent.
Better/worse performance between two FoHF
can be due to favourable/unfavourable momen-
tum in the strategy of one of the funds in a sub-
sample not covered by the other fund, or to the
manager’s skill/lack of skill. For this reason, sever-
al respondents have suggested including the
average performance of the FoHF over
12/24/36/48/60 trailing months, to ease the
screening process for investors.
Edhec Funds of Hedge Funds Reporting Survey 43
EDHEC FUNDS OF HEDGE FUNDS REPORTING SURVEY - A RETURN-BASED APPROACH TO FUNDS OF HEDGE FUNDS REPORTING
Return analysis
Very Important
Important
Not Important
Irrelevant
3%
17%
37%
43%
Fund Managers
Very Important
Important
Not Important
21%
37%
42%
Investors
Graph 12 and 13:
How important, in your opinion, are relative returns?
As a conclusion, monthly and annual returns should be given at all aggregation levels, from strate-
gy group to fund level. Historical returns, YTD or cumulative returns since inception should howe-
ver be reserved for strategy group and strategy levels in order to avoid any data overkill effect. The
same remark holds for performance that is conditional on equity and bond market conditions. This
information should for the same reason be calculated at the strategy group and strategy levels, not
at the fund level. Finally, as suggested by some of the respondents, performance at the FoHF level
over the last 12/24/36/60 months could also be included in the report to facilitate the comparison
of FoHF with different track records.

One of the central assumptions of modern port-
folio theory is that agents are risk averse. This is
confirmed by the fact that 100% of respondents
consider that risk measures such as volatility are
important to very important. Similarly, as high-
lighted in many empirical studies, investors are
particularly averse to loss. It is thus not surpris-
ing to find that 94% of respondents think that
it is important to very important to look at indi-
cators such as the maximum drawdown or
uninterrupted loss. Not surprisingly, investors
seem to be more concerned by losses than fund
managers, as is illustrated by the fact that 74%
of investors, compared to 57% of managers,
think that it is very important to include these
indicators in the monthly report.
Hedge funds tend to take advantage of the lever-
age effect and often invest in illiquid markets
with high default risk. As a result, extreme risks
are of major concern in the alternative arena. This
is well illustrated by the fact that 84% of respon-
dents think that it is important to very important
to look at the third and fourth order moments of
return distributions (i.e. skewness and kurtosis).
However, as many as 14% of respondents con-
tinue to neglect the fat tail effect, and consider
for example that the analysis of gross and net
leverage is not important or even irrelevant (30%
for managers versus 11% for investors).
Surprisingly, the Bera Jarque statistics, which aim
to assess the joint effect of third and fourth order
moments on the normality of the return distrib-
ution, are not important or even irrelevant for
57% of the respondents (52% for investors and
60% for managers). Again, investors seem much
more sensitive to extreme risks, and as a result,
much more demanding with regard to the infor-
mation disclosed on this issue in the monthly
report. Notwithstanding the fact that 76% of the
respondents consider that liquidity ratios provide
important to very important information, only
Edhec Funds of Hedge Funds Reporting Survey44
EDHEC FUNDS OF HEDGE FUNDS REPORTING SURVEY - A RETURN-BASED APPROACH TO FUNDS OF HEDGE FUNDS REPORTING
Risk analysis
Illustration 14:
How important, in your opinion, are the following extreme risk indicators?
0
10
20
30
40
50
No Answer
Very Important
Important
Not ImportantIrrelevant
Inve
stor
s
FoH
F M
anag
ers
All R
espo
nden
ts
Inve
stor
s
FoHF
Man
ager
s
All R
espo
nden
ts
Inve
stor
s
FoHF
Man
ager
s
All R
espo
nden
ts
4 4
7
3 3
0
5
10
4
10
13
7
0
5
11
16
12 1210
17
3
75
16
26
32
373735
31
37
32
37
43
3739
35
39
43 43 42
32
21
18
21
Style-VaR Cornish-Fisher VaR Beyond VaR

17% of fund managers think of it as very impor-
tant information, as opposed to 58% for
investors. In the same vein, while 32% of
investors consider stress tests to be very impor-
tant, only 23% of fund managers think so (on
average, however, 80% of respondents think of
it as important to very important). Results are
similar when it comes to Value-at-Risk (hence-
forth VaR) measures: 42% (respectively 11%,
16% and 26%) of investors think that it is very
important to have a Style VaR (respectively
Cornish Fisher, Incremental or Component VaR
and Beyond VaR) while only 3% (respectively
0%, 0% and 3%) of fund managers think so.
More worryingly, 18%, 16%, 39%, 49%, 51%
and 43%, respectively, consider that it is not
important or even irrelevant to insert liquidity
ratio, stress test, Style VaR, Cornish Fisher,
Incremental or Component VaR, and Beyond
VaR indicators in the report.
Edhec Funds of Hedge Funds Reporting Survey 45
EDHEC FUNDS OF HEDGE FUNDS REPORTING SURVEY - A RETURN-BASED APPROACH TO FUNDS OF HEDGE FUNDS REPORTING
Risk analysis
As a conclusion, even if investors seem to be more concerned by risk than fund managers, there is
a broad consensus on the fact that the whole spectrum of risk dimensions should be covered by
monthly reports, ranging from normal risks (e.g. volatility) to extreme risks (e.g. VaR measures) or
loss risks (e.g. minimum monthly return, maximum drawdown, uninterrupted loss). We argue that
this information should be available to investors at strategy group and strategy levels.

Return and risk are two sides of the same coin.
They must thus be examined in parallel. For this
purpose, a range of risk-adjusted performance
indicators has been proposed to investors and
fund managers. In line with the findings in
Edhec (2003)98, both investors and fund man-
agers generally use ratios that are inherited
from the traditional world. The Sharpe ratio and
the Sortino ratio are regarded as important to
very important by 78% and 74% of respondents
respectively. Even though it has been widely
argued that these traditional performance mea-
sures fail to account for the specific risk charac-
teristics of hedge funds, only 22% think that
these ratios provide unimportant or irrelevant
information. The Omega ratio, however, which
has recently been introduced to make up for the
failure of traditional performance measures to
account for the third and fourth order moments
of hedge fund return distributions (i.e. skewness
and kurtosis), is rated as important to very
important by only 53% of the respondents.
In line with the results obtained regarding
extreme risk measures, investors seem to be
more interested in this ratio than managers.
While 32% of the investors think that it is very
important, only 16% of the fund managers feel
the same. This suggests that hedge funds’
asymmetric remuneration contracts (i.e. man-
agement + incentive fees) fail to align investors’
and fund managers’ interests properly. Investors
turn out to be much more concerned by
extreme losses than fund managers. To address
this issue, we suggest including indicators that
take investors’ pronounced aversion for extreme
risks into account in the monthly activity report.
Other ratios presented in previous sections of
this document like the Sharpe Omega ratio, M2,
ASRAP, Calmar ratio and Sterling ratio are con-
sidered not important to irrelevant by 51%,
63%, 65%, 63% and 71% of respondents
respectively. Since most of these indicators
would be redundant with the aforementioned
risk-adjusted performance indicators, we sug-
gest excluding all of these ratios except the
Calmar ratio. We argue that this ratio provides
valuable information, especially when high
watermark provisions are included in the remu-
neration contract.
Risk-adjusted performance indicators must
account for the different definitions of risk we
have mentioned previously, so that investors
with different preferences can assess the
returns per unit of risk (e.g. volatility, VaR, draw-
down, etc.) generated by the FoHF. As suggest-
ed by some respondents, measures like return to
VaR (or modified VaR) should also be included in
the report.
Edhec Funds of Hedge Funds Reporting Survey46
EDHEC FUNDS OF HEDGE FUNDS REPORTING SURVEY - A RETURN-BASED APPROACH TO FUNDS OF HEDGE FUNDS REPORTING
Risk-adjusted return analysis
Illustration 15:
How important, in your opinion, are the following risk-adjusted performance indicators?
0
10
20
30
40
50
60
No Answer
Very Important
Important
Irrelevant Not Important
Inve
stor
s
FoH
F M
anag
ers
All R
espo
nden
ts
Inve
stor
s
FoHF
Man
ager
s
All R
espo
nden
ts
Inve
stor
s
FoHF
Man
ager
s
All R
espo
nden
ts
4
0
3
37
0
5
02
29
4 30
37
0
16
11
6
22
107
17
75
16
32
16
40
303131
58
16
37
23
45
2018
43
20
40
32
47
16
3532
Sharpe ratio Sortino ratio Omega ratio
98 - Edhec European Alternative Multimanagement Practices Survey, 2003 – Opus Cit.2
Once one has been informed about the risk-
adjusted performance of an investment, it may
be interesting to go one step further and try to
understand where the added value comes from.
This is precisely the objective of the perfor-
mance attribution process. Information provid-
ed by the attribution process is essential for
both investors and fund managers. It helps the
former to better understand the performance of
their investment and thus adjust performance
fees accordingly. It helps the latter to manage
the investment process better. It is therefore not
surprising to see that performance attribution is
important to very important for 96% of the
respondents, but particularly for investors, with
68% considering performance attribution to be
very important, while only 43% of managers
think the same.
There is one interesting point to be made about
the differences in answers between investors or
fund managers working for large institutions
and those working for smaller institutions.
Large funds have an obvious propensity to
plead in favour of a wide range of risk-adjusted
performance indicators. The justification cer-
tainly lies in their desire to take advantage of
their infrastructures (e.g. IT systems) to have an
edge on smaller funds.
Edhec Funds of Hedge Funds Reporting Survey 47
EDHEC FUNDS OF HEDGE FUNDS REPORTING SURVEY - A RETURN-BASED APPROACH TO FUNDS OF HEDGE FUNDS REPORTING
Risk-adjusted return analysis
As a conclusion, monthly reports should include risk-adjusted performance measures with the defi-
nition of risk covering the aforementioned dimensions of risk (i.e. normal risk, extreme risks, etc.).
Risk-adjusted performance indicators should span traditional (e.g. Sharpe ratio) and alternative
ratios (Omega ratio) so that investors can be provided with information that they are familiar with
and also ratios that are robust for the specific features of hedge fund strategies. We suggest that
detailed information should be given at the strategy group and strategy levels. We consider that the
results of the performance attribution process should also be included in the report at the strategy
group and strategy levels.

Hedge fund strategies are increasingly used by
investors to improve their diversification. In
other words, investors try to include hedge
funds in traditional portfolios to benefit from
the diversification potential offered by alter-
native betas (due to non-linear and dynamic
exposure to risk factors). In order to efficient-
ly manage their diversification strategy, it is
essential for investors to be able to monitor
the evolution of exposures of the FoHF to the
different hedge fund strategies. It is thus not
surprising to see that static and dynamic style
analysis are considered to be important to
very important by 74% of the respondents.
Predictably, investors show more interest in
finding such information in the report than
fund managers (i.e. 37% think that it is very
important versus 20% for managers). This is in
turn illustrated by the fact that 24% of fund
managers think that it is not important or
irrelevant (only 11% of investors think so). We
note that style analysis is extremely useful,
since it enables investors to ensure that fund
managers are doing what they are supposed
to do. As stressed in DiBartolomeo and
Witkowski (1997)99, “the easiest way to win a
contest for the largest tomato is to paint a
cantaloupe red and hope the judges do not
notice”. We strongly believe that investors
should be able to distinguish tomatoes from
cantaloupes thanks to the monthly activity
report.
Hedge fund strategies are generally represent-
ed by hedge fund indices and exposures com-
puted through Sharpe’s style analysis model.
One may however want to go one step further
and handle true risk factors (e.g. volatility, liq-
uidity, credit risk, etc.) rather than pseudo risk
factors like hedge fund indices. This is the case
for 85% of the investors but only 56% of fund
managers, who think that factor analysis is
important to very important (37% of fund
managers consider that it is not important or
irrelevant, compared to 0% for investors!).
Finally, 84% of respondents think that it is
important to very important to give a detailed
analysis of unconditional and conditional cor-
relations with traditional indices (i.e. equity
and bond indices). Similarly, it is very impor-
tant for 47% of investors but for only 33% of
fund managers. Even more strikingly, 58% of
investors think that it is very important to
obtain a detailed analysis of unconditional
and conditional correlations with risk factors,
Edhec Funds of Hedge Funds Reporting Survey48
EDHEC FUNDS OF HEDGE FUNDS REPORTING SURVEY - A RETURN-BASED APPROACH TO FUNDS OF HEDGE FUNDS REPORTING
Beta and correlation analysis
0
10
20
30
40
50
60
No Answer
Very Important
Important
Irrelevant
Not Important
Inve
stor
s
FoH
F M
anag
ers
All R
espo
nden
ts
Inve
stor
s
FoHF
Man
ager
s
All R
espo
nden
ts
Inve
stor
s
FoHF
Man
ager
s
All R
espo
nden
ts
4
8 7
20
10
0
5 6
35
47
3
20
5
58
5 4
29
107
13
7
0
16
53
32
43
30
39
18
32
10
53
17
45
10
14
47
17
47
37
47
11
27
0
Static and dynamic style analysis Static factor analysis Dynamic factor analysis
99 - DiBartolomeo, D. & Witkowski, E., 1997, Mutual Fund Misclassification: Evidence Based on Style Analysis, Financial Analysts Journal, Vol.53,p.32-43.
Illustration 16:
How important, in your opinion are static and dynamic style/factor analysis?

versus only 20% for fund managers. Such an
analysis is considered not important to irrele-
vant by only 5% of investors, but 22% of fund
managers.
Again, large funds seem to want to take
advantage of their IT systems by including a
wide variety of risk-adjusted performance
indicators.
Edhec Funds of Hedge Funds Reporting Survey 49
EDHEC FUNDS OF HEDGE FUNDS REPORTING SURVEY - A RETURN-BASED APPROACH TO FUNDS OF HEDGE FUNDS REPORTING
Beta and correlation analysis
Hedge fund strategies are increasingly used for their diversification properties. Unfortunately, this
cannot be done optimally with black boxes. Investors need to check their portfolio diversification,
and must as a result be able to monitor the FoHF risk profile on a regular basis. For this reason, we
argue that monthly activity reports should include in-depth style and factor analysis, both static
and dynamic, at the FoHF level. It would also be interesting to include a factor analysis at strategy
group and strategy levels, to perform the risk attribution process100 in parallel with the performance
attribution process.
100 - Otherwise, investors could definitely opt for the transparency of investable hedge fund indices. It is thus in the interest of fund managers toimprove their communication on key return drivers and, more generally, on the risk profile of their fund.

Information is a crucial issue for the future
development of the alternative industry. Up
until recently, only accredited investors101 had
been allowed to invest in hedge funds. Now,
however, the range of potential investors has
widened considerably. It is thus high time for
a better definition of the level of information
that investors should be provided with on a
regular basis. We strongly believe that activity
reports should not be seen by fund managers
as a constraint but should rather be viewed as
a privileged means of communication with
investors.
Activity reports should first inform investors
about the levels of risk (i.e. normal, extreme
and risk of loss) and performance of the FoHF.
To this end, a series of risk and return mea-
sures with corresponding risk-adjusted per-
formance indicators should be disclosed to
measure the returns per unit of risk (e.g.
volatility, VaR, drawdown, etc.) that the fund
generated. FoHF reports should also offer
more insight into the way the fund is man-
aged. Investors should for example be
informed on the effective style mix of the
fund through a style analysis. In the same
vein, factor analysis should be provided to
inform investors about sources of risk.
Performance attribution, finally, could inform
investors about sources of value-added.
As mentioned in this document, there is an
important risk of data overkill. We argue that
only those investors who really need complete
information should be provided with detailed
analysis at all levels of aggregation. For the
others, we suggest adapting the degree of
detail to the level of aggregation. Detailed
information should be available at strategy
group and strategy levels, but only basic infor-
mation on performance and risk should be
disclosed for every single fund that enters into
the composition of the portfolio.
Alongside the think-tank that we have set up
on the standardisation of the content of
FoHFs’ monthly activity reports, numerous
actors from the hedge fund industry are
working on standards for hedge fund position
pricing methods (notably for exotic derivative
instruments and non-quoted assets). May all
this work allow multimanagers to improve
their reporting (only 13% of European multi-
managers today affirm that their reporting is
certified by a third party102 (see graph 17)) and
thereby help final investors to obtain reliable
and relevant data on FoHF, so that they can
approach alternative strategies as confidently
as they approach the so-called traditional
asset classes (i.e. stocks, bonds, etc.).
Edhec Funds of Hedge Funds Reporting Survey50
EDHEC FUNDS OF HEDGE FUNDS REPORTING SURVEY - A RETURN-BASED APPROACH TO FUNDS OF HEDGE FUNDS REPORTING
Conclusion
No answer
Yes
No
13%
4%
84%
Graph 17:
Is European FoHF reporting certified by a third party?
101 - See Rule 501 of Regulation D of the US federal securities laws for a definition of the term accredited investor.102 - Cf. Edhec (2003) – Opus Cit.2

Appendix

Standard deviation Sharpe Ratio
Semi standard deviation Sortino Ratio
Maximum drawdown Calmar Ratio
(with time “under water”)
Uninterrupted loss
(with nbr of consecutive negative n.a.
returns and time to recovery)
VaR Return / VaR
Modified VaR Return /
Modified VaR
Style VaR Return / Style VaR
Beyond-VaR Return / Beyond VaR
Omega Ratio
Risk measures Ratios Comments
The non-normal distribution of hedge fund returns is not taken into
account, leading to an overestimation of risk-adjusted performance
measures such as the Sharpe ratio.
Downside risk measures such as the semi deviation do not properly
account for extreme risks. Instead of specifying the level of MAR arbi-
trarily, we suggest calculating the Sortino Ratio for all levels of MAR and
plotting the Sortino function.
Hedge funds are entitled to incentive fees provided they have reached
high watermark provisions. As a result, the higher the maximum draw-
down, the higher the risk of seeing the best managers leave the fund to
start a new hedge fund, and in turn, the higher the probability of per-
forming poorly in the future. The Calmar Ratio thus provides investors
with valuable information.
Historical VaR is subject to a significant sample bias and generally assumes the
normality of the return distribution. It therefore does not take the negative
skewness and positive kurtosis of hedge fund strategies into account properly.
The Modified VaR accounts for 3rd and 4th order moments of the return
distribution. It is thus well suited for hedge funds. However, it is subject to
sample bias, and does not converge rapidly when sample size increases.
The appeal of the Style VaR is to use pseudo factors embedding the spe-
cific risk features of hedge funds. However, the estimation of the Style VaR
relies strongly on the quality of the hedge fund indices used in the style
analysis. We suggest using the index of indices series published by Edhec
for their high level of representativity.
Beyond VaR is a robust measure of extreme risk but “Block maxima” and “Peaks-
over-threshold” approaches, which are generally used to calculate this measure,
are very data consuming. Given the lack of historical data, it is technically diffi-
cult to apply this measure to hedge funds.
The Omega Ratio takes all moments of the return distribution into account.
It is thus well suited for hedge funds. Estimations of the Omega Ratio converge
with 40-50 observations103.
Edhec Funds of Hedge Funds Reporting Survey52
EDHEC FUNDS OF HEDGE FUNDS REPORTING SURVEY - A RETURN-BASED APPROACH TO FUNDS OF HEDGE FUNDS REPORTING
Appendix I A Detailed Summary of Hedge Funds’ Risk-Adjusted Performance Indicators
Nor
mal
Ris
kLo
ss R
isk
Extr
eme
Risk
103 - We thank Con Keating for his precious comments on this issue.

Question n°1: Do you see any acute issue as regards both the riskand return dimensions that could not be accounted for in amonthly activity report?
All Respondents FoHF Managers InvestorsYes 27% 30% 21%No 67% 63% 74%
Question n°2: How should information ideally be aggregated inthe monthly activity report? (Several answers possible)
All Respondents FoHF Managers InvestorsFund 67% 60% 79%Strategy 80% 90% 63%Strategy Group 55% 43% 74%Currency 20% 13% 32%Country 14% 13% 16%Asset Type 37% 33% 42%Other 4% 7% 0%
Question n°3: History of FoHF’s monthly returns (net of fees) All Respondents FoHF Managers Investors
Irrelevant 0% 0% 0%Not Important 0% 0% 0%Important 24% 27% 21%Very Important 76% 73% 79%
Question n°4: History of monthly returns (net of fees) for eachstrategy and each fund in which the FoHF invests
All Respondents FoHF Managers InvestorsIrrelevant 4% 7% 0%Not Important 20% 27% 11%Important 45% 47% 42%Very Important 31% 20% 47%
Question n°5: FoHF’s annualised return (net of fees)
All Respondents FoHF Managers InvestorsIrrelevant 2% 3% 0%Not Important 6% 7% 5%Important 41% 33% 53%Very Important 51% 57% 42%
Question n°6: Annualised return (net of fees) for each strategy and each fund in which the FoHF invests
All Respondents FoHF Managers InvestorsIrrelevant 4% 7% 0%Not Important 22% 23% 21%Important 53% 57% 47%Very Important 20% 13% 32%
Edhec Funds of Hedge Funds Reporting Survey 53
EDHEC FUNDS OF HEDGE FUNDS REPORTING SURVEY - A RETURN-BASED APPROACH TO FUNDS OF HEDGE FUNDS REPORTING
Appendix II Detailed Results
Question n°7: FoHF’s year-to-date return (net of fees)
All Respondents FoHF Managers InvestorsIrrelevant 0% 0% 0%Not Important 10% 3% 21%Important 43% 50% 32%Very Important 47% 47% 47%
Question n°8: Year-to-date return for each strategy and eachfund in which the FoHF invests
All Respondents FoHF Managers InvestorsIrrelevant 4% 7% 0%Not Important 24% 23% 26%Important 59% 60% 58%Very Important 12% 10% 16%
Question n°9: FoHF’s cumulative return since inception (net offees) compared with a composite index of hedge funds, traditio-nal equity and bond indices and the risk-free rate
All Respondents FoHF Managers InvestorsIrrelevant 2% 3% 0%Not Important 27% 17% 42%Important 37% 37% 37%Very Important 35% 43% 21%
Question n°10: Analysis of the contribution of each strategy and each fund to the FoHF’s return
All Respondents FoHF Managers InvestorsIrrelevant 0% 0% 0%Not Important 4% 3% 5%Important 41% 50% 26%Very Important 55% 47% 68%
Question n°11: Performance attribution
All Respondents FoHF Managers InvestorsIrrelevant 0% 0% 0%Not Important 8% 10% 5%Important 41% 47% 32%Very Important 51% 43% 63%
Question n°12: Minimum/maximum returns, maximum drawdownand uninterrupted loss with both time to recovery and drawdowntime
All Respondents FoHF Managers InvestorsIrrelevant 0% 0% 0%Not Important 6% 3% 11%Important 31% 40% 16%Very Important 63% 57% 74%

Question n°13: Percentage of positive/negative months
All Respondents FoHF Managers InvestorsIrrelevant 2% 3% 0%Not Important 16% 17% 16%Important 49% 47% 53%Very Important 33% 33% 32%
Question n°14: Up months in up market & down months in downmarket
All Respondents FoHF Managers InvestorsIrrelevant 0% 0% 0%Not Important 10% 10% 11%Important 67% 73% 58%Very Important 22% 17% 32%
Question n°15: Out-performance in up market & out-performan-ce in down market
All Respondents FoHF Managers InvestorsIrrelevant 8% 13% 0%Not Important 22% 20% 26%Important 45% 50% 37%Very Important 24% 17% 37%
Question n°16: Annualised standard deviation and semi-varianceor downside risk
All Respondents FoHF Managers InvestorsIrrelevant 0% 0% 0%Not Important 0% 0% 0%Important 49% 50% 47%Very Important 51% 50% 53%
Question n°17: Bera Jarque test
All Respondents FoHF Managers InvestorsIrrelevant 8% 10% 5%Not Important 49% 50% 47%Important 29% 30% 26%Very Important 4% 0% 11%No Answer 10% 10% 11%
Question n°18: Skewness and kurtosis
All Respondents FoHF Managers InvestorsIrrelevant 4% 7% 0%Not Important 10% 10% 11%Important 59% 67% 47%Very Important 24% 17% 37%No Answer 2% 0% 5%
Edhec Funds of Hedge Funds Reporting Survey54
EDHEC FUNDS OF HEDGE FUNDS REPORTING SURVEY - A RETURN-BASED APPROACH TO FUNDS OF HEDGE FUNDS REPORTING
Appendix IIDetailed Results
Question n°19: Gross and net leverage analysed at the FoHF level (with breakdown by sector, management style, country, currency,etc.), and also by strategy and by fund
All Respondents FoHF Managers InvestorsIrrelevant 4% 7% 0%Not Important 18% 23% 11%Important 45% 43% 47%Very Important 31% 23% 42%No Answer 2% 3% 0%
Question n°20: Duration and spread duration for interest rateproducts
All Respondents FoHF Managers InvestorsIrrelevant 4% 7% 0%Not Important 24% 33% 11%Important 51% 43% 63%Very Important 14% 10% 21%No Answer 6% 7% 5%
Question n°21: Ljung Box test
All Respondents FoHF Managers InvestorsIrrelevant 14% 20% 5%Not Important 49% 50% 47%Important 18% 20% 16%Very Important 4% 0% 11%No Answer 14% 10% 21%
Question n°22: Herfindahl index
All Respondents FoHF Managers InvestorsIrrelevant 12% 17% 5%Not Important 47% 50% 42%Important 24% 23% 26%Very Important 4% 0% 11%No Answer 12% 10% 16%
Question n°23: Liquidity ratios
All Respondents FoHF Managers InvestorsIrrelevant 2% 3% 0%Not Important 16% 20% 11%Important 43% 53% 26%Very Important 33% 17% 58%No Answer 6% 7% 5%

Edhec Funds of Hedge Funds Reporting Survey 55
EDHEC FUNDS OF HEDGE FUNDS REPORTING SURVEY - A RETURN-BASED APPROACH TO FUNDS OF HEDGE FUNDS REPORTING
Appendix IIDetailed Results
Question n°24: Stress tests
All Respondents FoHF Managers InvestorsIrrelevant 2% 3% 0%Not Important 14% 17% 11%Important 53% 53% 53%Very Important 27% 23% 32%No Answer 4% 3% 5%
Question n°25: Style-VaR
All Respondents FoHF Managers InvestorsIrrelevant 4% 7% 0%Not Important 35% 43% 21%Important 39% 43% 32%Very Important 18% 3% 42%No Answer 4% 3% 5%
Question n°26: Cornish-Fisher VaR
All Respondents FoHF Managers InvestorsIrrelevant 10% 13% 5%Not Important 39% 43% 32%Important 37% 37% 37%Very Important 4% 0% 11%No Answer 10% 7% 16%
Question n°27: Incremental & Component Cornish-Fisher VaR
All Respondents FoHF Managers InvestorsIrrelevant 12% 17% 5%Not Important 39% 47% 26%Important 33% 30% 37%Very Important 6% 0% 16%No Answer 10% 7% 16%
Question n°28: Beyond VaR
All Respondents FoHF Managers InvestorsIrrelevant 12% 17% 5%Not Important 31% 37% 21%Important 35% 37% 32%Very Important 12% 3% 26%No Answer 10% 7% 16%
Question n°29: Sharpe ratio
All Respondents FoHF Managers InvestorsIrrelevant 4% 3% 5%Not Important 18% 20% 16%Important 43% 40% 47%Very Important 35% 37% 32%No Answer 0% 0% 0%
Question n°30: Sortino ratio
All Respondents FoHF Managers InvestorsIrrelevant 2% 3% 0%Not Important 20% 23% 16%Important 45% 37% 58%Very Important 29% 37% 16%No Answer 4% 0% 11%
Question n°31: Omega ratio
All Respondents FoHF Managers InvestorsIrrelevant 6% 7% 5%Not Important 31% 30% 32%Important 31% 40% 16%Very Important 22% 17% 32%No Answer 10% 7% 16%
Question n°32: Sharpe Omega ratio
All Respondents FoHF Managers InvestorsIrrelevant 8% 10% 5%Not Important 43% 47% 37%Important 24% 27% 21%Very Important 14% 10% 21%No Answer 10% 7% 16%
Question n°33: M2
All Respondents FoHF Managers InvestorsIrrelevant 8% 10% 5%Not Important 55% 60% 47%Important 20% 20% 21%Very Important 2% 0% 5%No Answer 14% 10% 21%
Question n°34: ASRAP
All Respondents FoHF Managers InvestorsIrrelevant 14% 20% 5%Not Important 51% 53% 47%Important 22% 17% 32%Very Important 0% 0% 0%No Answer 12% 10% 16%
Question n°35: Calmar ratio
All Respondents FoHF Managers InvestorsIrrelevant 10% 10% 11%Not Important 53% 60% 42%Important 24% 27% 21%Very Important 0% 0% 0%No Answer 12% 3% 26%

56
EDHEC FUNDS OF HEDGE FUNDS REPORTING SURVEY - A RETURN-BASED APPROACH TO FUNDS OF HEDGE FUNDS REPORTING
Appendix IIDetailed Results
Edhec Funds of Hedge Funds Reporting Survey
Question n°36: Sterling ratio
All Respondents FoHF Managers InvestorsIrrelevant 12% 10% 16%Not Important 59% 67% 47%Important 16% 20% 11%Very Important 0% 0% 0%No Answer 12% 3% 26%
Question n°37: Static and dynamic style analysis
All Respondents FoHF Managers InvestorsIrrelevant 4% 7% 0%Not Important 14% 17% 11%Important 47% 47% 47%Very Important 27% 20% 37%No Answer 8% 10% 5%
Question n°38: Analysis of correlations and conditional/uncondi-tional betas with traditional equity and bond indices
All Respondents FoHF Managers InvestorsIrrelevant 2% 3% 0%Not Important 12% 13% 11%Important 45% 47% 42%Very Important 39% 33% 47%No Answer 2% 3% 0%
Question n°39: Analysis of correlations and conditional/uncondi-tional betas with risk factors that are appropriate for the strate-gy of the fund or FoHF
All Respondents FoHF Managers InvestorsIrrelevant 6% 7% 5%Not Important 10% 17% 0%Important 45% 53% 32%Very Important 35% 20% 58%No Answer 4% 3% 5%
Question n°40: Static and dynamic factor analysis to track theevolution of the exposure to the risk factors selected for the stra-tegy followed
All Respondents FoHF Managers InvestorsIrrelevant 4% 7% 0%Not Important 18% 30% 0%Important 39% 43% 32%Very Important 29% 13% 53%No Answer 10% 7% 16%No Answer 12% 3% 26%

Edhec Risk and Asset Management
Research Centre
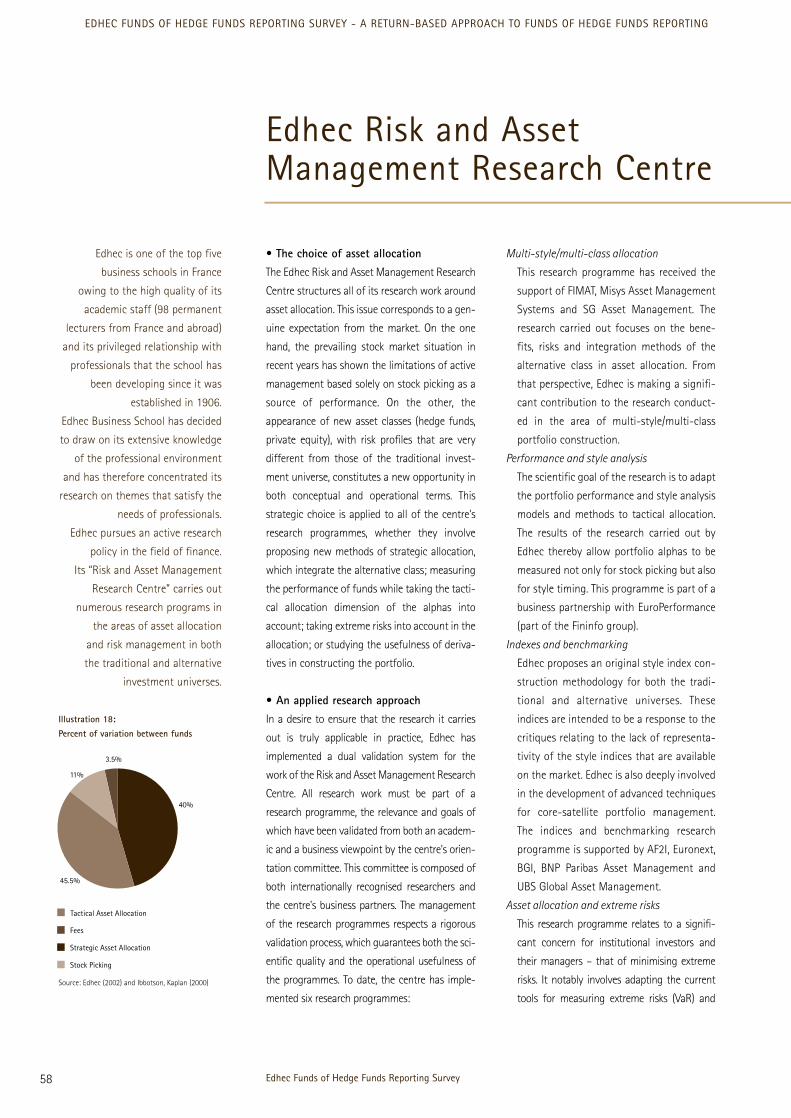
• The choice of asset allocation
The Edhec Risk and Asset Management Research
Centre structures all of its research work around
asset allocation. This issue corresponds to a gen-
uine expectation from the market. On the one
hand, the prevailing stock market situation in
recent years has shown the limitations of active
management based solely on stock picking as a
source of performance. On the other, the
appearance of new asset classes (hedge funds,
private equity), with risk profiles that are very
different from those of the traditional invest-
ment universe, constitutes a new opportunity in
both conceptual and operational terms. This
strategic choice is applied to all of the centre's
research programmes, whether they involve
proposing new methods of strategic allocation,
which integrate the alternative class; measuring
the performance of funds while taking the tacti-
cal allocation dimension of the alphas into
account; taking extreme risks into account in the
allocation; or studying the usefulness of deriva-
tives in constructing the portfolio.
• An applied research approach
In a desire to ensure that the research it carries
out is truly applicable in practice, Edhec has
implemented a dual validation system for the
work of the Risk and Asset Management Research
Centre. All research work must be part of a
research programme, the relevance and goals of
which have been validated from both an academ-
ic and a business viewpoint by the centre's orien-
tation committee. This committee is composed of
both internationally recognised researchers and
the centre's business partners. The management
of the research programmes respects a rigorous
validation process, which guarantees both the sci-
entific quality and the operational usefulness of
the programmes. To date, the centre has imple-
mented six research programmes:
Multi-style/multi-class allocation
This research programme has received the
support of FIMAT, Misys Asset Management
Systems and SG Asset Management. The
research carried out focuses on the bene-
fits, risks and integration methods of the
alternative class in asset allocation. From
that perspective, Edhec is making a signifi-
cant contribution to the research conduct-
ed in the area of multi-style/multi-class
portfolio construction.
Performance and style analysis
The scientific goal of the research is to adapt
the portfolio performance and style analysis
models and methods to tactical allocation.
The results of the research carried out by
Edhec thereby allow portfolio alphas to be
measured not only for stock picking but also
for style timing. This programme is part of a
business partnership with EuroPerformance
(part of the Fininfo group).
Indexes and benchmarking
Edhec proposes an original style index con-
struction methodology for both the tradi-
tional and alternative universes. These
indices are intended to be a response to the
critiques relating to the lack of representa-
tivity of the style indices that are available
on the market. Edhec is also deeply involved
in the development of advanced techniques
for core-satellite portfolio management.
The indices and benchmarking research
programme is supported by AF2I, Euronext,
BGI, BNP Paribas Asset Management and
UBS Global Asset Management.
Asset allocation and extreme risks
This research programme relates to a signifi-
cant concern for institutional investors and
their managers – that of minimising extreme
risks. It notably involves adapting the current
tools for measuring extreme risks (VaR) and
Edhec Funds of Hedge Funds Reporting Survey58
EDHEC FUNDS OF HEDGE FUNDS REPORTING SURVEY - A RETURN-BASED APPROACH TO FUNDS OF HEDGE FUNDS REPORTING
Edhec Risk and Asset Management Research Centre
Edhec is one of the top five
business schools in France
owing to the high quality of its
academic staff (98 permanent
lecturers from France and abroad)
and its privileged relationship with
professionals that the school has
been developing since it was
established in 1906.
Edhec Business School has decided
to draw on its extensive knowledge
of the professional environment
and has therefore concentrated its
research on themes that satisfy the
needs of professionals.
Edhec pursues an active research
policy in the field of finance.
Its “Risk and Asset Management
Research Centre” carries out
numerous research programs in
the areas of asset allocation
and risk management in both
the traditional and alternative
investment universes.
Illustration 18:
Percent of variation between funds
Stock Picking
Tactical Asset Allocation
Fees
Strategic Asset Allocation
11%
45.5%
3.5%
40%
Source: Edhec (2002) and Ibbotson, Kaplan (2000)

constructing portfolios (stochastic check) to
the issue of the long-term allocation of pen-
sion funds. This programme has been designed
in co-operation with Inria's Omega laboratory.
This research programme also intends to cover
other potential sources of extreme risks such as
liquidity and operations. The objective is to
allow for better measurement and modelling of
such risks in order to take them into consider-
ation as part of the portfolio allocation process.
Asset allocation and derivative instruments
This research programme focuses on the use-
fulness of employing derivative instruments
in the area of portfolio construction, whether
it involves implementing active portfolio allo-
cation or replicating indices. "Passive" replica-
tion of "active" hedge fund indices through
portfolios of derivative instruments is a key
area in the research carried out by Edhec. This
programme is supported by Eurex and Lyxor.
Tactical allocation and the econometrics of
financial markets
This programme concentrates on the applica-
tion, through tactical allocation, of recent
research in the area of behavioural finance. It
involves analysing the conditions for produc-
ing alphas from the systematic component of
a stock (sector or style timing) rather than its
specific component (pure stock picking).
• Research for business
In order to facilitate the dialogue between the
academic and business worlds, the centre has
recently undertaken four major initiatives:
- Opening of a web site that is entirely devoted to
the activity of international research into asset
management. www.edhec-risk.com is aimed at a
public of professionals who wish to benefit from
Edhec's analyses and expertise in the field of
applied portfolio management research such as
detailed summaries, from a business perspective,
of the latest academic research on risk and asset
allocation as well as the latest industry news
assessed in the light of the results of the Edhec
research programme. www.edhec-risk.com is
also the official site for the Edhec Indices.
- Launch of Edhec-Risk Advisory, the consult-
ing arm of the research centre focusing on
risk management issues within the buy-side
industry, and offering a wide range of ser-
vices aimed at supporting fund managers and
their service providers in the fields of opera-
tional risk, best execution, structured prod-
ucts, alternative investment due diligence and
risk management system implementation.
- Launch of Edhec Investment Research, in
order to support institutional investors and
asset managers in implementing the results of
the Edhec Risk and Asset Management
Research Centre’s research. Edhec Investment
Research proposes asset allocation services in
the context of a “core-satellite” approach
encompassing alternative investments.
- Launch of Edhec Alternative Investment
Education which is the exclusive official CAIA
association course provider for Europe.
• The Team
The aim of the Edhec Risk and Asset Management
Research Centre is to become the leading
European centre of research into asset manage-
ment in the coming years. To that end, Edhec has
invested significantly to give the centre an inter-
national research team made up of both profes-
sors and permanent researchers, with whom pro-
fessionals are affiliated in the capacity of research
associates. To date, the Edhec Risk and Asset
Management Research Centre has more than 28
members: 15 permanent members and 13 associ-
ates who are operating in firms that are reputed
for their proficiency in asset management. This
team is managed by Professor Noël Amenc, who
has considerable experience in asset management
as both an academic and a professional.
Edhec Funds of Hedge Funds Reporting Survey 59
EDHEC FUNDS OF HEDGE FUNDS REPORTING SURVEY - A RETURN-BASED APPROACH TO FUNDS OF HEDGE FUNDS REPORTING
Edhec Risk and Asset Management Research Centre

Edhec Funds of Hedge Funds Reporting Survey60
EDHEC FUNDS OF HEDGE FUNDS REPORTING SURVEY - A RETURN-BASED APPROACH TO FUNDS OF HEDGE FUNDS REPORTING


Edhec Risk and Asset Management
Research Centre
393-400 promenade des Anglais
BP 3116
F-06202 Nice Cedex 3
Tel.: +33 (0)4 93 18 78 24
Fax: +33 (0)4 93 83 08 10