Embed Size (px)
Citation preview
AQUATIC MICROBIAL ECOLOGYAquat Microb Ecol
Vol. 60: 273–287, 2010doi: 10.3354/ame01427
Published online August 3
INTRODUCTION
Organic carbon is exported from the upper ocean asboth particulate (POM) (Berelson 2001, Honjo et al.2008) and dissolved organic matter (DOM) (Carlson etal. 1994, Ducklow et al. 1995, Hansell 2002). DOM is
potentially an important form of export and is the dom-inant organic carbon pool in the ocean (Hedges 1992).About 50% of primary production (PP) in oceanicecosystems is ultimately released as DOM througha variety of processes (Ducklow & Carlson 1992,Williams 2000). DOM is mostly utilized by heterotro-
© Inter-Research 2010 · www.int-res.com*Email: [email protected]
Oceanic heterotrophic bacterial nutrition by semilabile DOM as revealed by data
assimilative modeling
Ya-Wei Luo1, 2, 6,*, Marjorie A. M. Friedrichs3, Scott C. Doney4,Matthew J. Church5, Hugh W. Ducklow1, 2
1The Ecosystems Center, Marine Biological Laboratory, 7 MBL Street, Woods Hole, Massachusetts 02543, USA2Department of Ecology and Evolutionary Biology, Brown University, Providence, Rhode Island 02912, USA
3Virginia Institute of Marine Science, College of William and Mary, PO Box 1346, Gloucester Point, Virginia 23062, USA4Department of Marine Chemistry and Geochemistry, Woods Hole Oceanographic Institution, MS#25,
Woods Hole, Massachusetts 02543, USA5School of Ocean and Earth Science and Technology, University of Hawaii, 1000 Pope Road, Honolulu, Hawaii 96822, USA
6Present address: Department of Marine Chemistry and Geochemistry, Woods Hole Oceanographic Institution,MS#25, Woods Hole, Massachusetts 02543, USA
ABSTRACT: Previous studies have focused on the role of labile dissolved organic matter (DOM)(defined as turnover time of ~1 d) in supporting heterotrophic bacterial production, but have mostlyneglected semilabile DOM (defined as turnover time of ~100 to 1000 d) as a potential substrate forheterotrophic bacterial growth. To test the hypothesis that semilabile DOM supports substantialamounts of heterotrophic bacterial production in the open ocean, we constructed a 1-dimensionalepipelagic ecosystem model and applied it to 3 open ocean sites: the Arabian Sea, Equatorial Pacificand Station ALOHA in the North Pacific Subtropical Gyre. The model tracks carbon, nitrogen andphosphorus with flexible stoichiometry. This study used a large number of observations, includingmeasurements of heterotrophic bacterial production rates and standing stocks, and DOM concentra-tion data, to rigorously test and constrain model output. Data assimilation was successfully applied tooptimize the model parameters and resulted in simultaneous representation of observed nitrate,phosphate, phytoplankton and zooplankton biomass, primary production, heterotrophic bacterialbiomass and production, DOM, and suspended and sinking particulate organic matter. Across the 3ocean ecosystems examined, the data assimilation suggests semilabile DOM may support 17 to 40%of heterotrophic bacterial carbon demand. In an experiment where bacteria only utilize labile DOM,and with more of the DOM production assigned to labile DOM, the model poorly represented theobservations. These results suggest that semilabile DOM may play an important role in sustainingheterotrophic bacterial growth in diverse regions of the open ocean.
KEY WORDS: Heterotrophic bacteria · Semilabile dissolved organic matter · Marine ecosystemmodel · Data assimilation
Resale or republication not permitted without written consent of the publisher
Aquat Microb Ecol 60: 273–287, 2010
phic Bacteria and possibly also Archaea (hereafter wefunctionally describe both groups as ‘bacteria’) (Azam1998), with a major fraction of the utilized DOMrespired to CO2 (del Giorgio & Cole 2000, Robinson2008), and with a lower fraction assimilated into bio-mass and ultimately reintroduced to the plankton foodweb or lysed by viruses (Azam et al. 1983). Bacterialactivity also regenerates inorganic nutrients fromDOM, which in turn directly impacts PP. Thus bacteriaare a key component of the oceanic carbon cycle.
The marine DOM pool represents a broad contin-uum in terms of its biological reactivity (Carlson 2002),from refractory material turning over on time scales ofmillennia to labile material turning over on time scalesof minutes to days, and semilabile material with inter-mediate turnover times of months to a few years. Mostprevious studies have tended to focus on labile DOM(LDOM) compounds such as dissolved free aminoacids and monosaccharides (Kirchman 2002 and refer-ences therein) as the major food sources for bacteria inthe ocean, largely neglecting the role of semilabileDOM (SDOM) in supporting microbial growth. By def-inition, SDOM is also biologically active, although at alower rate than LDOM. Since the bulk concentration ofSDOM is much higher than that of LDOM in openocean (Carlson 2002), SDOM has the potential to sup-port a substantial amount of bacterial production(Jackson 1988).
Since Redfield (1934) concluded that the elementalcomposition of marine seston is relatively stable in theworld ocean (Redfield ratio, molar ratio of C:N:P =106:16:1), marine biogeochemical models have tendedto use one of these elements as currency (usually N) totrace plankton dynamics, assuming that other ele-ments generally track proportionally to this currency atthe Redfield ratio. However, various studies suggestflexible biomass stoichiometry may be needed to accu-rately represent heterotrophic microbial dynamics inthe sea. The elemental composition of heterotrophicbacteria differs markedly from phytoplankton (Kirch-man 2000 and references therein), with bacterial bio-mass frequently enriched in N and P relative to phyto-plankton. Moreover, although variable in space andtime, bulk pools of DOM appear to be depleted in Nand P (Benner 2002) and bacterial growth appearsdirectly affected by DOM stoichiometry. Variability inDOM stoichiometry may derive from alteration insources or sinks of specific substrates; for example,phytoplankton production of C-enriched DOM hasbeen shown to occur under nutrient-limiting condi-tions (Fogg 1966, Bjørnsen 1988, Nagata 2000). Alter-natively, selective removal of N- and P-enriched DOMsubstrates by bacteria also controls bulk DOM poolstoichiometry (Hopkinson & Vallino 2005). Such non-Redfield dependent DOM production and removal
mechanisms present major challenges for models ofbacterial growth dynamics.
Numerical modeling of bacterial dynamics in theopen sea is a new and important approach for generat-ing and testing hypotheses regarding the role of bacte-ria in ocean carbon and nutrient cycling. Data assimila-tion provides a valuable tool to handle the increasingnumber of observations of bacterial dynamics emerg-ing from recent oceanographic studies. Data assimila-tion methods seek to minimize differences betweenmodeling results and observations by objectively opti-mizing model parameters (Lawson et al. 1995, Vallino2000, Spitz et al. 2001, Friedrichs 2002, Ward et al.2010). As field measurements are expensive and diffi-cult, usually only a small number of the state variablesand rates in a given model are directly measured. Dataassimilation uses available observations to improveconfidence in other unknown variables and rates.
We constructed a marine ecosystem model to test thehypothesis that a significant portion of bacterial pro-duction is supported by SDOM in the open ocean. Inthis study, LDOM are those with turnover time of ~1 d,and SDOM are those with turnover time of ~100 to1000 d depending on site, time and space. The modelemphasizes detailed heterotrophic microbial dynamicsand follows carbon (C), nitrogen (N) and phosphorus(P) of the state variables with flexible stoichiometry.The model was then applied to a 1-dimensional (1-D)framework at 3 open ocean sites in the North PacificSubtropical Gyre, Arabian Sea and Equatorial Pacific.The comparison of the 3 study sites in different openocean regions is used to reveal general patterns in theopen ocean controlled by regional-scale processes.Data assimilation was conducted to minimize the mis-fits between the model and observations through opti-mizing the model parameters. By this approach, themodel was constrained by available data from differ-ent aspects of each ecosystem, including concentra-tions and/or rates related to nutrients, phytoplankton,zooplankton and particulate organic matter (POM), aswell as bacteria and DOM.
METHODS
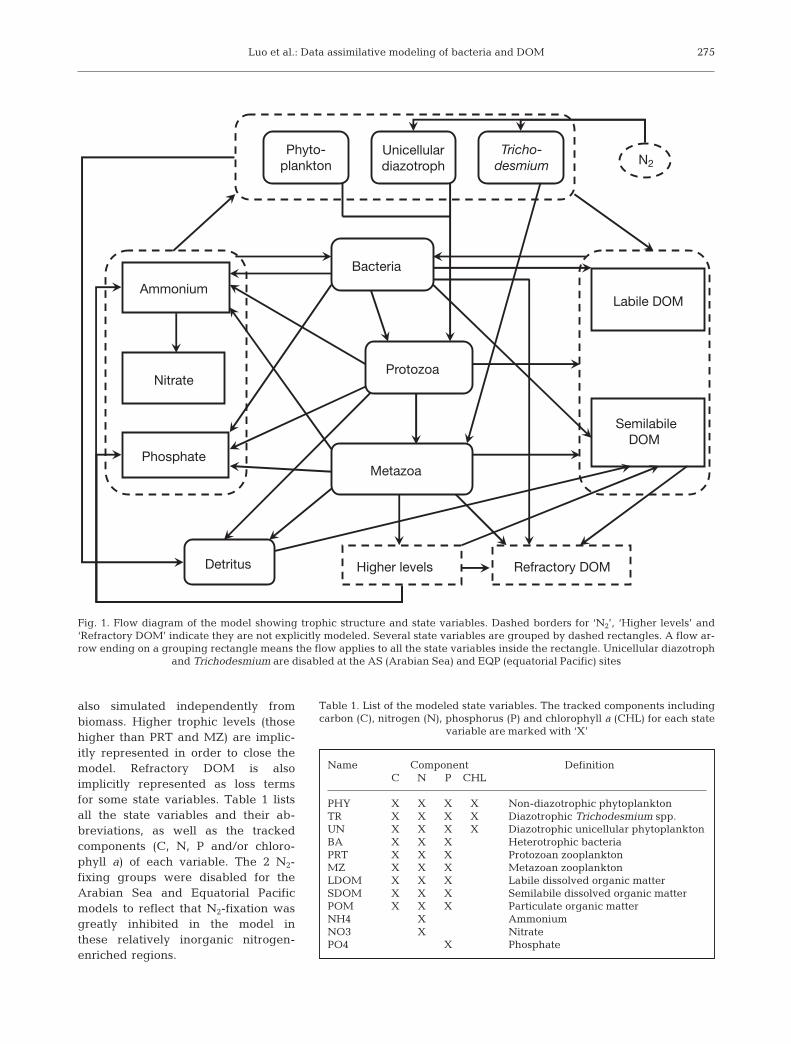
The ecosystem model. The ecosystem model simu-lates flows and stocks of C, N and P through each ofthe state variables including: generic phytoplankton(PHY), N2-fixing Trichodesmium spp. (TR) and uni-cellular diazotrophs (UN), heterotrophic bacteria(BA), protozoan (PRT) and metazoan (MZ) zooplank-ton, labile (LDOM) and semilabile DOM (SDOM),particulate detritus (DET) and inorganic nutrients(ammonium, NH4; nitrate, NO3; and phosphate,PO4) (Fig. 1). Chlorophyll a of PHY, TR and UN are
274
Luo et al.: Data assimilative modeling of bacteria and DOM
also simulated independently frombiomass. Higher trophic levels (thosehigher than PRT and MZ) are implic-itly represented in order to close themodel. Refractory DOM is alsoimplicitly represented as loss termsfor some state variables. Table 1 listsall the state variables and their ab-breviations, as well as the trackedcomponents (C, N, P and/or chloro-phyll a) of each variable. The 2 N2-fixing groups were disabled for theArabian Sea and Equatorial Pacificmodels to reflect that N2-fixation wasgreatly inhibited in the model inthese relatively inorganic nitrogen-enriched regions.
275
Bacteria
Protozoa
Metazoa
Ammonium
Nitrate
Labile DOM
Refractory DOM
Phosphate
Higher levels
SemilabileDOM
Phyto-plankton
Tricho-desmium
Unicellulardiazotroph N2
Detritus
Fig. 1. Flow diagram of the model showing trophic structure and state variables. Dashed borders for ‘N2’, ‘Higher levels’ and‘Refractory DOM’ indicate they are not explicitly modeled. Several state variables are grouped by dashed rectangles. A flow ar-row ending on a grouping rectangle means the flow applies to all the state variables inside the rectangle. Unicellular diazotroph
and Trichodesmium are disabled at the AS (Arabian Sea) and EQP (equatorial Pacific) sites
Name Component DefinitionC N P CHL
PHY X X X X Non-diazotrophic phytoplanktonTR X X X X Diazotrophic Trichodesmium spp.UN X X X X Diazotrophic unicellular phytoplanktonBA X X X Heterotrophic bacteriaPRT X X X Protozoan zooplanktonMZ X X X Metazoan zooplanktonLDOM X X X Labile dissolved organic matterSDOM X X X Semilabile dissolved organic matterPOM X X X Particulate organic matterNH4 X AmmoniumNO3 X NitratePO4 X Phosphate
Table 1. List of the modeled state variables. The tracked components includingcarbon (C), nitrogen (N), phosphorus (P) and chlorophyll a (CHL) for each state
variable are marked with ‘X’
Aquat Microb Ecol 60: 273–287, 2010
The model includes flexible stoichiometry for allcompartments. To integrate flexible stoichiometry withthe phytoplankton growth scheme, we selected theDroop equation (Droop 1974, McCarthy 1980, Droop1983) and adopted the model of Geider et al. (1998)with some changes. Thus the model allows phyto-plankton to take advantage of high light to store morecarbon when ambient nutrient levels are depleted andto store more nutrients when light is low (Bertilsson etal. 2003). In addition, when the N or P quota is lowerthan the Redfield value, the model determines theexcretion of SDOM by phytoplankton (Fogg 1966,Bjørnsen 1988, Nagata 2000), as will be discussed later.
Here we briefly describe the model schemes forheterotrophic bacterial dynamics. The full modeldescription and equations are provided in Supple-ment 1 available at www.int-res.com/articles/suppl/a060p273_supp.pdf. The heterotrophic bacterialscheme in this model has several key features asdetailed here:
(1) The DOM is divided into LDOM and SDOM,which are produced by autotrophs (including PHY, TRand UN), protozoa, metazoa, bacteria, dissolving detri-tus and implicit higher trophic levels (Fig. 1) as follows.
To represent passive diffusion of DOM out of phyto-plankton cells (Fogg 1966, Bjørnsen 1988), the phyto-plankton in our model release LDOM as a first orderfunction of phytoplankton biomass (default 5% perday) at the same C:N:P ratio as the biomass. To repre-sent the overflow model of DOM release (Fogg 1966,Nagata 2000), the phytoplankton in our model alsoexcrete carbohydrate (C only without N or P) at a fixedfraction of PP (default 5%), with the assumption that75% of this carbohydrate excretion goes to labile dis-solved organic carbon (DOC) pool and the other 25%to the semilabile DOC pool. The model also considersthat phytoplankton release DOM in order to adjusttheir stoichiometry to approach the Redfield ratio:SDOM is excreted at high C:N and/or C:P ratio ifphytoplankton C is in excess to N or P. The time scalefor this adjustment is 2 d, which means this SDOMexcretion will adjust the stoichiometry of phytoplank-ton to the Redfield ratio in 2 d if the rate of excretion isunchanged. For N2-fixing groups TR and UN in themodel, part (by default 36%) of their newly fixed N(from N2 fixation) is released equally as both labile dis-solved organic nitrogen (DON) and ammonium toreflect observations (e.g. Glibert & Bronk 1994, Mul-holland et al. 2004, Mulholland 2007).
Zooplankton, including both protozoa and metazoa,release a portion of ingested organic matter as DOMvia both sloppy feeding and excretion. The model doesnot separate these 2 processes, but assumes a certainpercentage of the total grazed C by protozoa andmetazoa is released as DOC. The ratio of released
DON or dissolved organic phosphorus (DOP) to re-leased DOC is same as the N:C or P:C ratio of the zoo-plankton food source. The model then partitions thereleased DOC by default with 75% to the labile pooland the other 25% to the semilabile pool. In addition,the release rates of semilabile DON and DOP areadjusted accordingly if the zooplankton cellular N:Cand P:C are different from their predefined referenceratios, which also helps zooplankton to stabilize theirstoichiometry toward their reference ratios. Theremoval of metazoa, implicitly represented in themodel as grazing by higher trophic levels, contributesto production of SDOM, remineralization of nutrients,and carbon respiration.
Both the carbohydrates release of phytoplankton andtotal DOC release by zooplankton are partitioned bydefault as 25% to the labile pool and 75% to the semi-labile pools. But there is no evidence to directly sup-port this partitioning. The uncertainty related to thispartitioning will be discussed later.
Although bacteria are net DOM consumers, the first-order mortality of bacteria also contributes to theLDOM pool in the model, which always reduces thenet flux of LDOM into bacteria. The final source ofDOM is from detritus, which dissolves and producesSDOM as a first-order function of detritus concentra-tion when it sinks through the model domain. Thesinking speed and the dissolution rate of detritus arecontrolled by optimizable parameters.
(2) The lability of SDOM is much lower than that ofLDOM. The model first determines bacterial utilizationof DOC by assuming available labile DOC (ALC)equals the labile DOC concentration while availablesemilabile DOC (ASC) only equals a portion of semi-labile DOC concentration:
(1)
where CLDOM and CSDOM are concentrations of labileand semilabile DOC, and rSDOM is an optimizable para-meter controlling the lability of semilabile DOC. Thenthe utilization rates of labile and semilabile DOC bybacteria are computed using Monod functions respec-tively:
(2)
(3)
where ULDOC and USDOC are utilization rates of labile andsemilabile DOC, is the maximum bacterial growthrate integrating other limiting factors such as nutrientsand temperature, CBA is the bacterial carbon biomass andkDOM is the half-saturation concentration related to ‘avail-able’ DOC. Thus, the ratio of labile to semilabile DOCutilization is determined by parameter rSDOM in Eq. (1).
μ̂BA
U Ck
SDOC BA BADOM
=ASC
ASC + ALCμ̂ ⋅ ⋅
+
U Ck
LDOC BA BADOM
=ALC
ALC + ASCμ̂ ⋅ ⋅
+
ALC = ASC =LDOM SDOM SDOMC r C, ,⋅
276

Luo et al.: Data assimilative modeling of bacteria and DOM
(3) The model then determines the bacterial utiliza-tion of DON and DOP based on the computed utiliza-tion rate of DOC. Due to the high lability of LDOM, themodel assumes all LDOM is used quickly and the ratioof labile DOC, DON and DOP utilization equals theC:N:P ratio of the bulk LDOM pool. However, themodel considers that bacteria have the capability touse SDOM with higher N:C and P:C ratios than thebulk SDOM pool (Eq. 15 in Supplement 1). This mech-anism allows bacteria to take up excess N and P andreduces relative nutrient contents in the SDOM pool,consistent with observations. The bacteria also take upinorganic nutrients, which alleviates nutrient limitationon bacterial growth (Eqs. 16 & 17 in Supplement 1).
(4) Bacterial growth efficiency (BGE), the ratio ofbacterial production (BP) to bacterial carbon demand(BCD, equals BP + bacterial respiration), normallyincreases with the BP as shown by del Giorgio & Cole(2000). To reflect this observation, the portion of assim-ilated C to be respired in the model is inversely relatedto BCD. Thus a higher BCD results in a higher propor-tion of BP and therefore a higher BGE, and vice versa.This mechanism also impacts the remineralization rateof DOM by bacteria. When BGE is lower and more C isrespired by bacteria, the C left for bacterial growth isless and therefore the bacterial requirements for nutri-ents (N and P in the model) are also less. Thus, withlower BGE, nutrients are more likely in excess andtherefore the remineralization rates are higher.
Study sites and modeling framework. We selected3 open sites for our study. One site was the long-term biogeochemical observatory, Station ALOHA(22.75° N, 158.00° W), the field site for the HawaiiOcean Time-series (HOT) program, established in theNorth Pacific Subtropical Gyre in 1988 (Karl et al.2001, Doney & Ducklow 2006). The station is 100 kmnorth of Oahu, Hawaii, USA with a bottom depth of~4700 m. The station is within the southward returnflow of the eastern gyre with relatively weak horizon-tal transport (Karl et al. 2001), and thus represents agood site to apply 1-D ecological modeling. This studysite will be referred to as HOT hereafter.
For comparison, we selected other tropical/subtropi-cal oceanic sites with available data and contrastingphysical regimes in the Arabian Sea (AS) and Equato-rial Pacific (EQP). US Joint Global Ocean Flux Study(JGOFS) off-shore site S7 was the selected AS site,located at 16° N, 62° E. The EQP site is located at 0° N,140° W. Because seasonal monsoons occur at the ASand strong upwelling occurs across the EQP com-pared to the strongly stratified condition at HOT,these 2 sites were expected to show different micro-bial dynamics. As the modeling framework for these 2sites has already been set up by others (Friedrichs etal. 2006, 2007), the comparison study can be con-
ducted by embedding our ecosystem model into theexisting model framework, along with some recentimprovements, such as assimilating bacterial andDOM data.
1-D frameworks for the upper ocean were set upbased on data availability for these sites to cover years1995 for the AS site, 1992 for the EQP site and 2002 atHOT. At the sites in the AS and the EQP, 20 layerswere used to cover the upper 150 m, with 10 surfacelayers of 5 m each and 10 bottom layers of 10 m each.At HOT, the framework used 25 layers, with 10 surfacelayers of 5 m each and 15 bottom layers of 10 m each,covering the upper 200 m water column. A deeper bot-tom was used for HOT because the observed nutrientlevels at 200 m were much less variable than those at150 m. The model is forced by physical fields such aslight, temperature, mixed layer depth, vertical velocityand diffusivity (see Supplement 1 for more details).
Data assimilation. A variational adjoint scheme(Lawson et al. 1995) was used for the parameter opti-mization process including the following procedures.(1) A cost function was constructed to evaluate the mis-fits between the observations and modeled results. Alower cost function indicates a better fit of the model toobservations. A cost function value of less than 1.0indicates an ideal fit of the model to observations. (2)An adjoint model was constructed for the ecosystemmodel using the auto-differentiation software TAPE-NADE 2.1 (Institut National de Recherche en Informa-tique et en Automatique [INRIA], France) to computethe gradients of the cost function with respect to themodel parameters. (3) A limited-memory quasi-New-ton optimization software M1QN3 3.1 (Gilbert &Lemaréchal 1989) was adopted to use the computedgradients from the adjoint model to determine thedirection and the optimal step size by which the modelparameters need to be modified in order to reduce thecost function. These procedures were conducted itera-tively until the preset criteria of low gradients of thecost function with respect to the model parameterswere met. For more details of the assimilation schemeas applied to this framework, see Friedrichs et al.(2006, 2007) and also Supplement 1.
Observations to be assimilated were obtained for ASand EQP online at http://usjgofs.whoi.edu/jg/dir/jgofs/,and for HOT at http://hahana.soest.hawaii.edu/hot/hot-dogs/interface.html. The bacterial production dataat HOT were measured during some, but not all HOTcruises (Church et al. 2006).
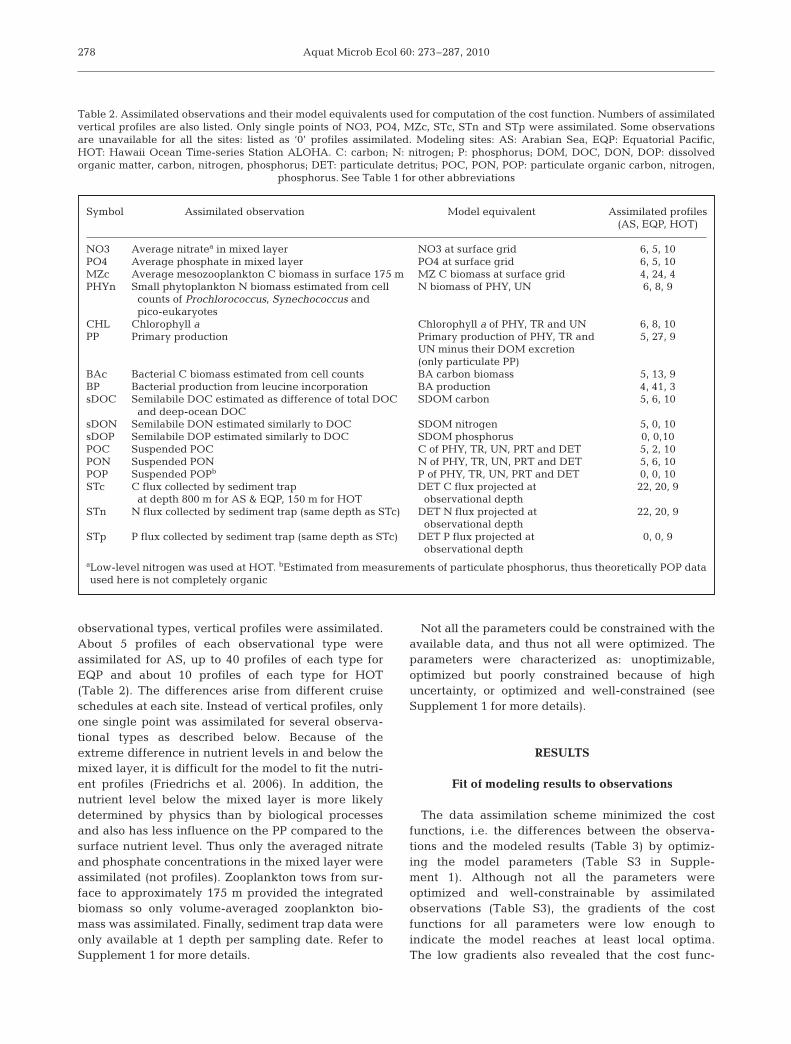
We included as many data types as possible: up to 17types of observations were assimilated for each site(several data types were unavailable for AS and EQP)(Table 2). The corresponding model equivalents usedto compute the cost function are also listed in Table 2for each type of the assimilated observations. For most
277
Aquat Microb Ecol 60: 273–287, 2010
observational types, vertical profiles were assimilated.About 5 profiles of each observational type wereassimilated for AS, up to 40 profiles of each type forEQP and about 10 profiles of each type for HOT(Table 2). The differences arise from different cruiseschedules at each site. Instead of vertical profiles, onlyone single point was assimilated for several observa-tional types as described below. Because of theextreme difference in nutrient levels in and below themixed layer, it is difficult for the model to fit the nutri-ent profiles (Friedrichs et al. 2006). In addition, thenutrient level below the mixed layer is more likelydetermined by physics than by biological processesand also has less influence on the PP compared to thesurface nutrient level. Thus only the averaged nitrateand phosphate concentrations in the mixed layer wereassimilated (not profiles). Zooplankton tows from sur-face to approximately 175 m provided the integratedbiomass so only volume-averaged zooplankton bio-mass was assimilated. Finally, sediment trap data wereonly available at 1 depth per sampling date. Refer toSupplement 1 for more details.
Not all the parameters could be constrained with theavailable data, and thus not all were optimized. Theparameters were characterized as: unoptimizable,optimized but poorly constrained because of highuncertainty, or optimized and well-constrained (seeSupplement 1 for more details).
RESULTS
Fit of modeling results to observations
The data assimilation scheme minimized the costfunctions, i.e. the differences between the observa-tions and the modeled results (Table 3) by optimiz-ing the model parameters (Table S3 in Supple-ment 1). Although not all the parameters wereoptimized and well-constrainable by assimilatedobservations (Table S3), the gradients of the costfunctions for all parameters were low enough toindicate the model reaches at least local optima.The low gradients also revealed that the cost func-
278
Symbol Assimilated observation Model equivalent Assimilated profiles(AS, EQP, HOT)
NO3 Average nitratea in mixed layer NO3 at surface grid 6, 5, 10PO4 Average phosphate in mixed layer PO4 at surface grid 6, 5, 10MZc Average mesozooplankton C biomass in surface 175 m MZ C biomass at surface grid 4, 24, 4PHYn Small phytoplankton N biomass estimated from cell N biomass of PHY, UN 6, 8, 9
counts of Prochlorococcus, Synechococcus andpico-eukaryotes
CHL Chlorophyll a Chlorophyll a of PHY, TR and UN 6, 8, 10PP Primary production Primary production of PHY, TR and 5, 27, 9
UN minus their DOM excretion(only particulate PP)
BAc Bacterial C biomass estimated from cell counts BA carbon biomass 5, 13, 9BP Bacterial production from leucine incorporation BA production 4, 41, 3sDOC Semilabile DOC estimated as difference of total DOC SDOM carbon 5, 6, 10
and deep-ocean DOCsDON Semilabile DON estimated similarly to DOC SDOM nitrogen 5, 0, 10sDOP Semilabile DOP estimated similarly to DOC SDOM phosphorus 0, 0,10POC Suspended POC C of PHY, TR, UN, PRT and DET 5, 2, 10PON Suspended PON N of PHY, TR, UN, PRT and DET 5, 6, 10POP Suspended POPb P of PHY, TR, UN, PRT and DET 0, 0, 10STc C flux collected by sediment trap DET C flux projected at 22, 20, 9
at depth 800 m for AS & EQP, 150 m for HOT observational depthSTn N flux collected by sediment trap (same depth as STc) DET N flux projected at 22, 20, 9
observational depthSTp P flux collected by sediment trap (same depth as STc) DET P flux projected at 0, 0, 9
observational depthaLow-level nitrogen was used at HOT. bEstimated from measurements of particulate phosphorus, thus theoretically POP dataused here is not completely organic
Table 2. Assimilated observations and their model equivalents used for computation of the cost function. Numbers of assimilatedvertical profiles are also listed. Only single points of NO3, PO4, MZc, STc, STn and STp were assimilated. Some observationsare unavailable for all the sites: listed as ‘0’ profiles assimilated. Modeling sites: AS: Arabian Sea, EQP: Equatorial Pacific,HOT: Hawaii Ocean Time-series Station ALOHA. C: carbon; N: nitrogen; P: phosphorus; DOM, DOC, DON, DOP: dissolvedorganic matter, carbon, nitrogen, phosphorus; DET: particulate detritus; POC, PON, POP: particulate organic carbon, nitrogen,
phosphorus. See Table 1 for other abbreviations
Luo et al.: Data assimilative modeling of bacteria and DOM
tion would not change significantly with relativelysmall changes in the parameters, i.e. the optimizedmodel was not sensitive to the parameters. The fullcomparison of each observation to its model equi-valent is included in Fig. S1 in Supplement 2, avail-able at www.int-res.com/articles/suppl/a060p273_supp.pdf.
The averaged observations and the averaged modelequivalents through the whole model domain weremostly comparable at each of the 3 sites (Table 3).However, some variables did not fit as well as others;for example, mesozooplankton biomass at AS was sig-nificantly underestimated by the model. For the vari-ables related to microbial dynamics, both bacterial bio-mass and production were slightly underestimated bythe model for EQP, and semilabile DON and DOP wereslightly overestimated for HOT.
Modeled heterotrophic microbialdynamics
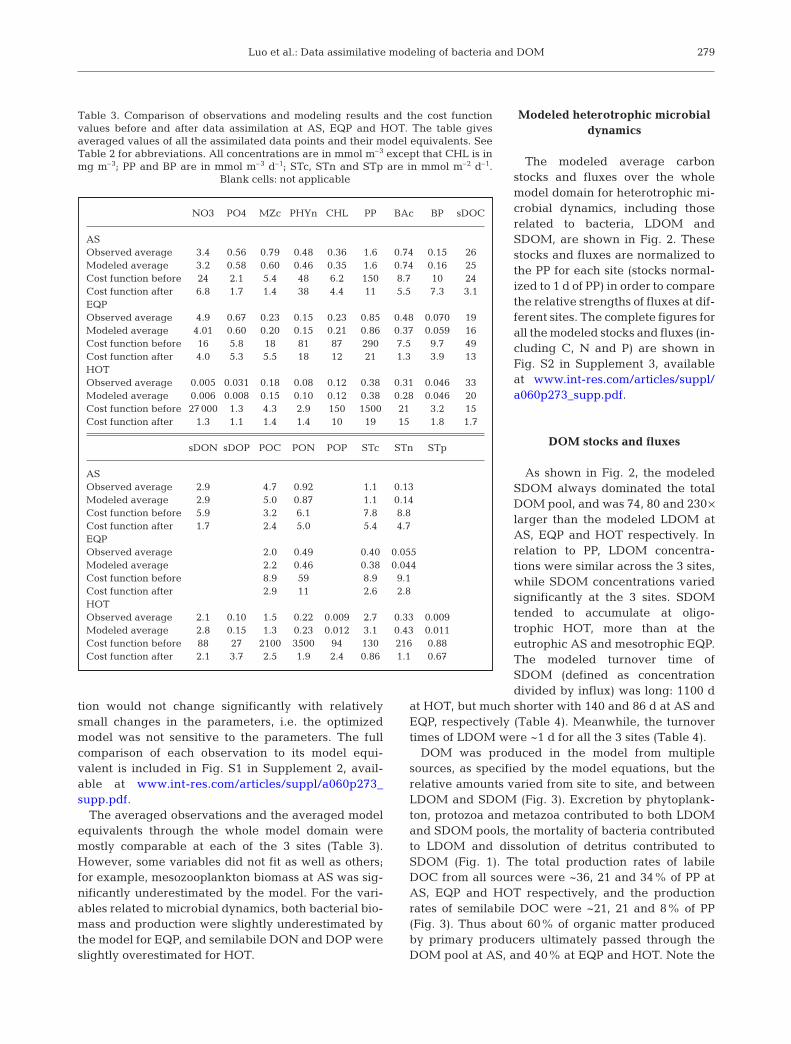
The modeled average carbonstocks and fluxes over the wholemodel domain for heterotrophic mi-crobial dynamics, including thoserelated to bacteria, LDOM andSDOM, are shown in Fig. 2. Thesestocks and fluxes are normalized tothe PP for each site (stocks normal-ized to 1 d of PP) in order to comparethe relative strengths of fluxes at dif-ferent sites. The complete figures forall the modeled stocks and fluxes (in-cluding C, N and P) are shown inFig. S2 in Supplement 3, availableat www.int-res.com/articles/suppl/a060p273_supp.pdf.
DOM stocks and fluxes
As shown in Fig. 2, the modeledSDOM always dominated the totalDOM pool, and was 74, 80 and 230 ×larger than the modeled LDOM atAS, EQP and HOT respectively. Inrelation to PP, LDOM concentra-tions were similar across the 3 sites,while SDOM concentrations variedsignificantly at the 3 sites. SDOMtended to accumulate at oligo-trophic HOT, more than at theeutrophic AS and mesotrophic EQP.The modeled turnover time ofSDOM (defined as concentrationdivided by influx) was long: 1100 d
at HOT, but much shorter with 140 and 86 d at AS andEQP, respectively (Table 4). Meanwhile, the turnovertimes of LDOM were ~1 d for all the 3 sites (Table 4).
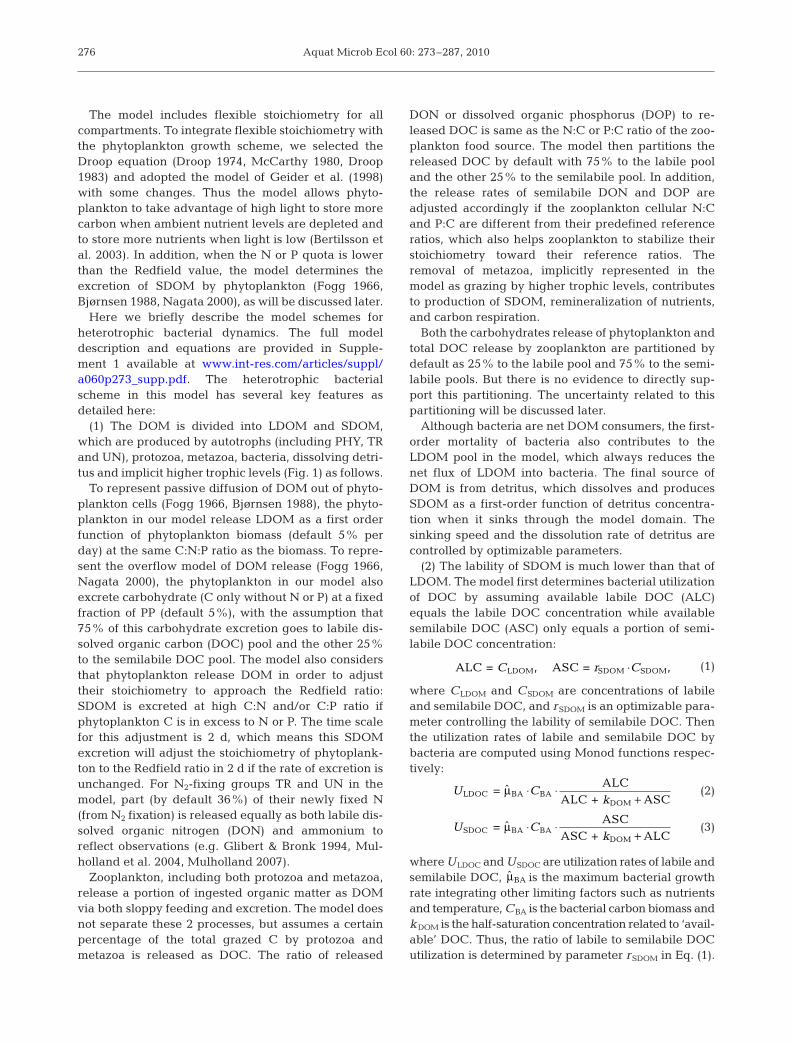
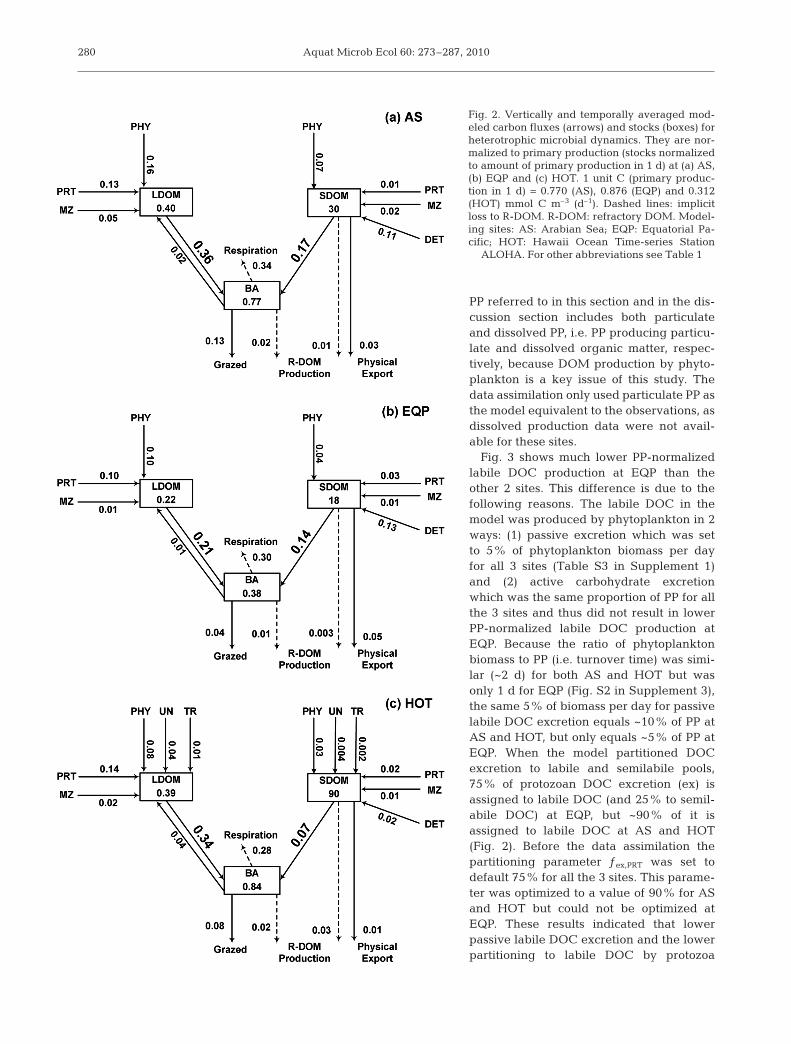
DOM was produced in the model from multiplesources, as specified by the model equations, but therelative amounts varied from site to site, and betweenLDOM and SDOM (Fig. 3). Excretion by phytoplank-ton, protozoa and metazoa contributed to both LDOMand SDOM pools, the mortality of bacteria contributedto LDOM and dissolution of detritus contributed toSDOM (Fig. 1). The total production rates of labileDOC from all sources were ~36, 21 and 34% of PP atAS, EQP and HOT respectively, and the productionrates of semilabile DOC were ~21, 21 and 8% of PP(Fig. 3). Thus about 60% of organic matter producedby primary producers ultimately passed through theDOM pool at AS, and 40% at EQP and HOT. Note the
279
NO3 PO4 MZc PHYn CHL PP BAc BP sDOC
ASObserved average 3.4 0.56 0.79 0.48 0.36 1.6 0.74 0.15 26Modeled average 3.2 0.58 0.60 0.46 0.35 1.6 0.74 0.16 25Cost function before 24 2.1 5.4 48 6.2 150 8.7 10 24Cost function after 6.8 1.7 1.4 38 4.4 11 5.5 7.3 3.1EQPObserved average 4.9 0.67 0.23 0.15 0.23 0.85 0.48 0.070 19Modeled average 4.01 0.60 0.20 0.15 0.21 0.86 0.37 0.059 16Cost function before 16 5.8 18 81 87 290 7.5 9.7 49Cost function after 4.0 5.3 5.5 18 12 21 1.3 3.9 13HOTObserved average 0.005 0.031 0.18 0.08 0.12 0.38 0.31 0.046 33Modeled average 0.006 0.008 0.15 0.10 0.12 0.38 0.28 0.046 20Cost function before 27000 1.3 4.3 2.9 150 1500 21 3.2 15Cost function after 1.3 1.1 1.4 1.4 10 19 15 1.8 1.7
sDON sDOP POC PON POP STc STn STp
ASObserved average 2.9 4.7 0.92 1.1 0.13Modeled average 2.9 5.0 0.87 1.1 0.14Cost function before 5.9 3.2 6.1 7.8 8.8Cost function after 1.7 2.4 5.0 5.4 4.7EQPObserved average 2.0 0.49 0.40 0.055Modeled average 2.2 0.46 0.38 0.044Cost function before 8.9 59 8.9 9.1Cost function after 2.9 11 2.6 2.8HOTObserved average 2.1 0.10 1.5 0.22 0.009 2.7 0.33 0.009Modeled average 2.8 0.15 1.3 0.23 0.012 3.1 0.43 0.011Cost function before 88 27 2100 3500 94 130 216 0.88Cost function after 2.1 3.7 2.5 1.9 2.4 0.86 1.1 0.67
Table 3. Comparison of observations and modeling results and the cost functionvalues before and after data assimilation at AS, EQP and HOT. The table givesaveraged values of all the assimilated data points and their model equivalents. SeeTable 2 for abbreviations. All concentrations are in mmol m–3 except that CHL is inmg m–3; PP and BP are in mmol m–3 d–1; STc, STn and STp are in mmol m–2 d–1.
Blank cells: not applicable
Aquat Microb Ecol 60: 273–287, 2010
PP referred to in this section and in the dis-cussion section includes both particulateand dissolved PP, i.e. PP producing particu-late and dissolved organic matter, respec-tively, because DOM production by phyto-plankton is a key issue of this study. Thedata assimilation only used particulate PP asthe model equivalent to the observations, asdissolved production data were not avail-able for these sites.
Fig. 3 shows much lower PP-normalizedlabile DOC production at EQP than theother 2 sites. This difference is due to thefollowing reasons. The labile DOC in themodel was produced by phytoplankton in 2ways: (1) passive excretion which was setto 5% of phytoplankton biomass per dayfor all 3 sites (Table S3 in Supplement 1)and (2) active carbohydrate excretionwhich was the same proportion of PP for allthe 3 sites and thus did not result in lowerPP-normalized labile DOC production atEQP. Because the ratio of phytoplanktonbiomass to PP (i.e. turnover time) was simi-lar (~2 d) for both AS and HOT but wasonly 1 d for EQP (Fig. S2 in Supplement 3),the same 5% of biomass per day for passivelabile DOC excretion equals ~10% of PP atAS and HOT, but only equals ~5% of PP atEQP. When the model partitioned DOCexcretion to labile and semilabile pools,75% of protozoan DOC excretion (ex) isassigned to labile DOC (and 25% to semil-abile DOC) at EQP, but ~90% of it isassigned to labile DOC at AS and HOT(Fig. 2). Before the data assimilation thepartitioning parameter ƒex,PRT was set todefault 75% for all the 3 sites. This parame-ter was optimized to a value of 90% for ASand HOT but could not be optimized atEQP. These results indicated that lowerpassive labile DOC excretion and the lowerpartitioning to labile DOC by protozoa
280
Fig. 2. Vertically and temporally averaged mod-eled carbon fluxes (arrows) and stocks (boxes) forheterotrophic microbial dynamics. They are nor-malized to primary production (stocks normalizedto amount of primary production in 1 d) at (a) AS,(b) EQP and (c) HOT. 1 unit C (primary produc-tion in 1 d) = 0.770 (AS), 0.876 (EQP) and 0.312(HOT) mmol C m–3 (d–1). Dashed lines: implicitloss to R-DOM. R-DOM: refractory DOM. Model-ing sites: AS: Arabian Sea; EQP: Equatorial Pa-cific; HOT: Hawaii Ocean Time-series Station
ALOHA. For other abbreviations see Table 1
Luo et al.: Data assimilative modeling of bacteria and DOM
were likely 2 major causes of the lower PP-normalizedlabile DOC production at EQP.
Fig. 3 also shows much lower PP-normalized semi-labile DOC production at HOT than the other 2 sites.Semilabile DOC production was dominated by detritusdissolution at AS and EQP, but the detritus dissolutionwas very low at HOT. Such results may not be unex-pected because HOT is perennially oligotrophic andmaintains the lowest rates of community productionamong the 3 sites studied, thus the rate of detritus pro-duction is likely low in this ecosystem. The data assim-ilation used observations of both concentrations (sus-pended organic particles) and fluxes (sediment traps)of detritus to constrain the model, improving confi-dence in modeled detritus production and dissolution
rates. Thus, the modeled low detritus dissolution rateand therefore the low semilabile DOC production rateat HOT appear consistent with observations.
In summary, the modeled labile DOC productionwas higher than semilabile DOC production at AS andHOT, and was about the same as semilabile DOC pro-duction at EQP.
Bacteria
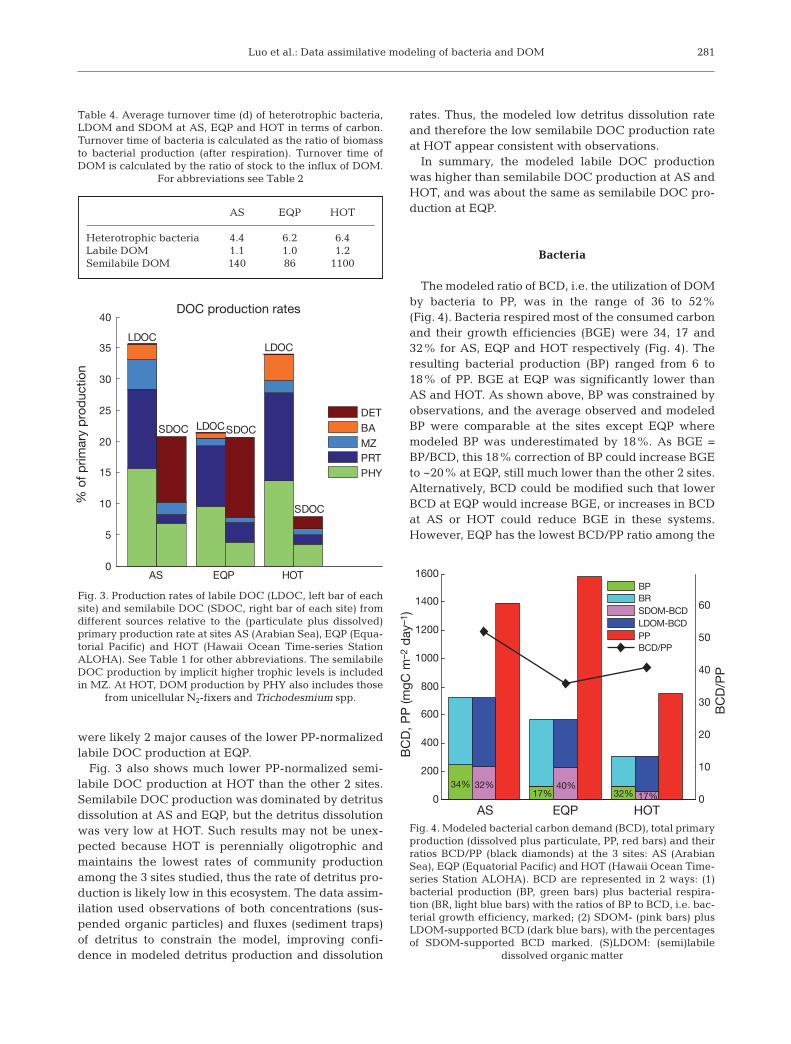
The modeled ratio of BCD, i.e. the utilization of DOMby bacteria to PP, was in the range of 36 to 52%(Fig. 4). Bacteria respired most of the consumed carbonand their growth efficiencies (BGE) were 34, 17 and32% for AS, EQP and HOT respectively (Fig. 4). Theresulting bacterial production (BP) ranged from 6 to18% of PP. BGE at EQP was significantly lower thanAS and HOT. As shown above, BP was constrained byobservations, and the average observed and modeledBP were comparable at the sites except EQP wheremodeled BP was underestimated by 18%. As BGE =BP/BCD, this 18% correction of BP could increase BGEto ~20% at EQP, still much lower than the other 2 sites.Alternatively, BCD could be modified such that lowerBCD at EQP would increase BGE, or increases in BCDat AS or HOT could reduce BGE in these systems.However, EQP has the lowest BCD/PP ratio among the
281
AS EQP HOT
Heterotrophic bacteria 4.4 6.2 6.4Labile DOM 1.1 1.0 1.2Semilabile DOM 140 86 1100
Table 4. Average turnover time (d) of heterotrophic bacteria,LDOM and SDOM at AS, EQP and HOT in terms of carbon.Turnover time of bacteria is calculated as the ratio of biomassto bacterial production (after respiration). Turnover time ofDOM is calculated by the ratio of stock to the influx of DOM.
For abbreviations see Table 2
AS EQP HOT0
5
10
15
20
25
30
35
40
% o
f prim
ary
pro
duc
tion
DOC production rates
LDOC
SDOC LDOCSDOC
LDOC
SDOC
DETBAMZPRTPHY
Fig. 3. Production rates of labile DOC (LDOC, left bar of eachsite) and semilabile DOC (SDOC, right bar of each site) fromdifferent sources relative to the (particulate plus dissolved)primary production rate at sites AS (Arabian Sea), EQP (Equa-torial Pacific) and HOT (Hawaii Ocean Time-series StationALOHA). See Table 1 for other abbreviations. The semilabileDOC production by implicit higher trophic levels is includedin MZ. At HOT, DOM production by PHY also includes those
from unicellular N2-fixers and Trichodesmium spp.
AS EQP HOT0
200
400
600
800
1000
1200
1400
1600
BC
D, P
P (m
gC m
–2 d
ay–1
)
34% 32%17%
40%32% 17% 0
10
20
30
40
50
60
BC
D/P
P
BPBRSDOM-BCDLDOM-BCDPPBCD/PP
Fig. 4. Modeled bacterial carbon demand (BCD), total primaryproduction (dissolved plus particulate, PP, red bars) and theirratios BCD/PP (black diamonds) at the 3 sites: AS (ArabianSea), EQP (Equatorial Pacific) and HOT (Hawaii Ocean Time-series Station ALOHA). BCD are represented in 2 ways: (1)bacterial production (BP, green bars) plus bacterial respira-tion (BR, light blue bars) with the ratios of BP to BCD, i.e. bac-terial growth efficiency, marked; (2) SDOM- (pink bars) plusLDOM-supported BCD (dark blue bars), with the percentagesof SDOM-supported BCD marked. (S)LDOM: (semi)labile
dissolved organic matter
Aquat Microb Ecol 60: 273–287, 2010
sites (Fig. 4). Thus if the model could be adjusted tomake the BGE similar at the 3 sites, it would result ineven lower BCD/PP than the current low level for EQP,or would result in an even higher BCD/PP than the cur-rent high level for AS and HOT, and the difference ofBCD/PP for the 3 sites would become even larger. Therange in measured BGE in the ocean is large (<1 to>60%) and for the open ocean the mean measuredBGE is 15 ± 12% (±SD) (del Giorgio & Cole 2000). BGEmeasurements are difficult to perform, with muchuncertainty (del Giorgio & Cole 2000 and referencestherein). Thus our modeled BGE values are within theobserved ranges. Given that the modeled BP was con-strained by observations and that our modeled derivedestimates of BGE were consistent with previously pub-lished estimates, the resulting modeled DOM utiliza-tion rates by bacteria (i.e. BCD) appear reasonable.
Bacteria used both LDOM and SDOM to support theircarbon demand in the model. The model predicted thatSDOM supplied a substantial amount of total carbonutilization by bacteria: 32, 40 and 17% for AS, EQP andHOT respectively (Fig. 4), which lent support to thekey hypothesis of the present study.
DISCUSSION
After optimization by the data assimila-tion, the model supported the hypothesisthat SDOM is an important source for thebacterial carbon requirement in the openocean. In this section, we examine howwell the modeled microbial dynamics areconstrained by the data, and point out keyuncertainties.
Optimization of microbial dynamics
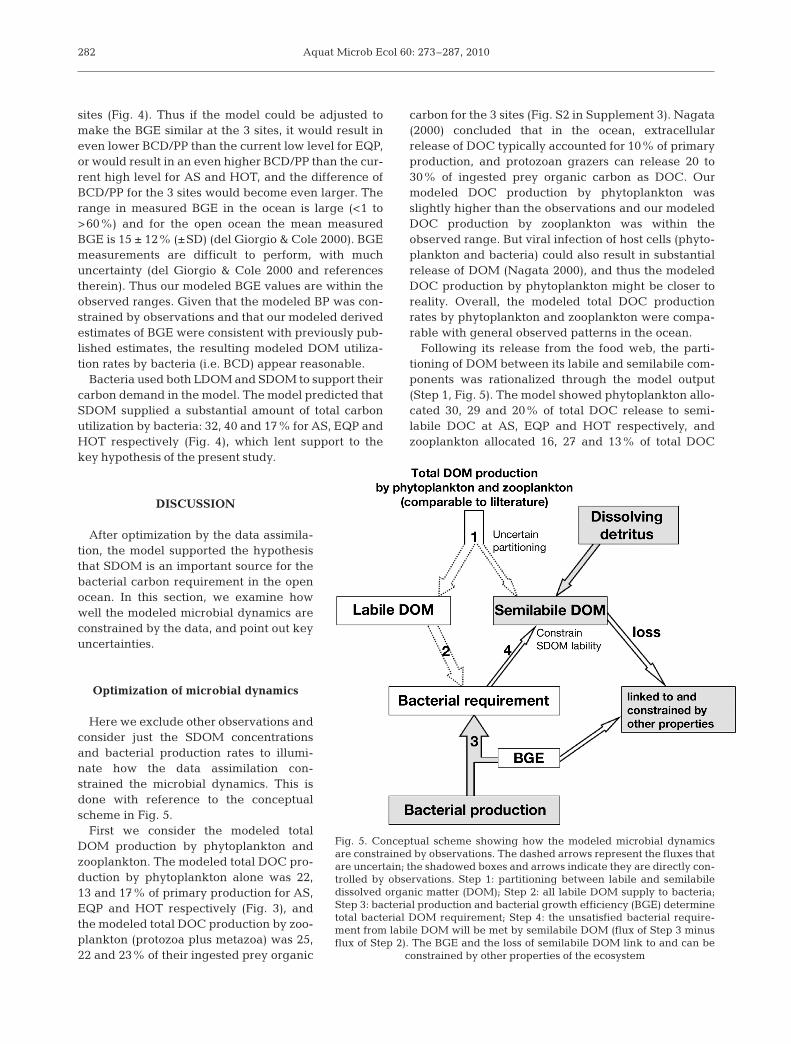
Here we exclude other observations andconsider just the SDOM concentrationsand bacterial production rates to illumi-nate how the data assimilation con-strained the microbial dynamics. This isdone with reference to the conceptualscheme in Fig. 5.
First we consider the modeled totalDOM production by phytoplankton andzooplankton. The modeled total DOC pro-duction by phytoplankton alone was 22,13 and 17% of primary production for AS,EQP and HOT respectively (Fig. 3), andthe modeled total DOC production by zoo-plankton (protozoa plus metazoa) was 25,22 and 23% of their ingested prey organic
carbon for the 3 sites (Fig. S2 in Supplement 3). Nagata(2000) concluded that in the ocean, extracellularrelease of DOC typically accounted for 10% of primaryproduction, and protozoan grazers can release 20 to30% of ingested prey organic carbon as DOC. Ourmodeled DOC production by phytoplankton wasslightly higher than the observations and our modeledDOC production by zooplankton was within theobserved range. But viral infection of host cells (phyto-plankton and bacteria) could also result in substantialrelease of DOM (Nagata 2000), and thus the modeledDOC production by phytoplankton might be closer toreality. Overall, the modeled total DOC productionrates by phytoplankton and zooplankton were compa-rable with general observed patterns in the ocean.
Following its release from the food web, the parti-tioning of DOM between its labile and semilabile com-ponents was rationalized through the model output(Step 1, Fig. 5). The model showed phytoplankton allo-cated 30, 29 and 20% of total DOC release to semi-labile DOC at AS, EQP and HOT respectively, andzooplankton allocated 16, 27 and 13% of total DOC
282
Fig. 5. Conceptual scheme showing how the modeled microbial dynamicsare constrained by observations. The dashed arrows represent the fluxes thatare uncertain; the shadowed boxes and arrows indicate they are directly con-trolled by observations. Step 1: partitioning between labile and semilabiledissolved organic matter (DOM); Step 2: all labile DOM supply to bacteria;Step 3: bacterial production and bacterial growth efficiency (BGE) determinetotal bacterial DOM requirement; Step 4: the unsatisfied bacterial require-ment from labile DOM will be met by semilabile DOM (flux of Step 3 minusflux of Step 2). The BGE and the loss of semilabile DOM link to and can be
constrained by other properties of the ecosystem

Luo et al.: Data assimilative modeling of bacteria and DOM
release to the semilabile pool at the 3 sites (Fig. 3).Unfortunately there are no observations on which tocompare the model performance to this partitioning.
LDOM has a very short turnover time (Table 4) andthe fluxes in and out the LDOM pool were tightly cou-pled. The rate of LDOM utilization by bacteria wasdirectly determined by the production of LDOM (Step2, Fig. 5). The observations of bacterial production canbe converted to a total bacterial DOM requirementusing bacterial growth efficiency (BGE) (Step 3, Fig. 5),and then can act to constrain the model. However,there is uncertainty in BGE. We do not have direct con-straints on BGE. However, variations in BGE affectbacterial nutrient remineralization rates, and these inturn have direct impacts on other components of themodel. Thus BGE is constrained indirectly by observa-tions like nutrient concentrations and primary produc-tion. At all 3 sites, the optimization procedure wasalways able to well-constrain the parameter (bacterial maximum active respiration rate) (Table S3in Supplement 1), which greatly determined BGE inthe model.
The total bacterial DOM requirement based on theconstrained BP and BGE (Step 3, Fig. 5) needs to bemet by a combination of LDOM (Step 2, Fig. 5) andSDOM. The unsatisfied bacterial DOM requirementafter LDOM uptake determines the bacterial utiliza-tion rate of SDOM (Step 4, Fig. 5). The relativestrength of fluxes between Steps 2 and 3 in Fig. 5 wasthe ultimate parameter used to test our hypothesisabout the importance of SDOM for bacterial nutritionin the open sea.
The bacterial utilization rate of SDOM, together withthe observations of SDOM stocks, will then be used tooptimize the relative lability of the SDOM pool (Fig. 5).The lability of SDOM in the model was controlled bythe parameter rSDOM, which defines the relative labilitybetween SDOM and LDOM (Eq. 1). Initially, rSDOM wasset to 0.5% for all the 3 sites, i.e. the lability of SDOMwas 0.5% of the lability of LDOM. After the dataassimilation, however, rSDOM was optimized to rela-tively well-constrained values of 0.68, 0.87 and 0.10%for AS, EQP and HOT respectively (Fig. 6), whichresulted in average utilization times of semilabile DOC(defined as its concentration divided by its utilizationrate by bacteria) of 179, 124 and 1330 d respectively(Table 5). From the same starting lability for SDOM,the data assimilation significantly increased the labilityat AS and EQP and decreased the lability at HOT inorder to better fit the assimilated observations.Although the in situ lability of SDOM was not mea-sured, the other available observations constrained themodel to different SDOM lability for the 3 sites.Because the SDOM lability equals the ratio of utiliza-tion rates to stocks of SDOM, the relatively well-con-
strained SDOM lability (Fig. 6), together with thedirectly constrained SDOM stocks, further added toour confidence in the modeled utilization rates ofSDOM.
Finally, some of the SDOM production is exported bymixing or converted to refractory DOM (R-DOM) pro-duction before it can be utilized by bacteria (‘loss’ step,Fig. 5). A large portion of the SDOM was produced
rmax,BAA
283
AS EQP HOT0
0.2
0.4
0.6
0.8
1
1.2
r SD
OM
(%)
Fig. 6. Optimizing the parameter rSDOM which defines the rel-ative lability between labile and semilabile dissolved organiccarbon (DOC) at modeling sites AS (Arabian Sea), EQP(Equatorial Pacific) and HOT (Hawaii Ocean Time-series Sta-tion ALOHA). The optimized values and their uncertaintiesare shown for each site. The dashed line represents the initial
value of 0.5% used for all the 3 sites
AS EQP HOT
Concentration (mmol C m–3) 22.9 15.7 28.2Production (mmol C m–3 day–1) 0.160 0.181 0.0246Bacterial utilization rate 0.128 0.126 0.0212(mmol C m–3 day–1)
Bacterial utilization/ 79.8 69.6 86.1production (%)
Physical export/production (%) 15.4 26.1 19.0Conversion to R-DOM/ 3.8 1.4 43.0production (%)
Imbalance (%) +1 +2.9 –48.1Realized utilization time (d) 179 124 1330
Table 5. Modeled average semilabile DOC concentration,production and utilization rates at AS, EQP and HOT. Also in-cluded are sinks of semilabile DOC relative to its productionrate, including bacterial utilization, physical export and con-version to refractory DOM (R-DOM). For the imbalance be-tween semilabile DOM production and sinks (relative to pro-duction), positive imbalance indicates production exceedingthan sinks in the modeled year (DOC accumulates); negativeimbalance indicates sinks exceeding production and a net de-cline in DOC. The realized utilization time of semilabile DOCis defined as the ratio of its concentration to its utilization rate
by bacteria. For abbreviations see Table 2
Aquat Microb Ecol 60: 273–287, 2010
by dissolving detritus, whose rates were constrainedby the observations as described previously. In order tofit the observed time-series of SDOM concentrations,the optimization had to adjust the term for the R-DOMproduction (another export of SDOM, physical exportis mainly determined by physical forcing) according tothe modeled SDOM utilization and production rates.This export represented a permanent loss of organicmatter and nutrient elements from the surface ocean,and thus may impact the productivity of the wholesystem.
In summary, this scenario indicates that higherLDOM production could result in higher LDOM uti-lization and therefore lower SDOM utilization by bac-teria, so that the percentage of SDOM-supported bac-terial production would be reduced. The uncertaintyrelated to partitioning between LDOM and SDOMfrom phytoplankton and zooplankton (Step 1, Fig. 5)can impact reliability of the model. However, themicrobial dynamics are not an isolated subsystem inthe model. From the discussion above, there were atleast 2 possible ways that the microbial dynamics canlink to the other processes in the model (and obser-vations): bacterial growth efficiency and the loss ofSDOM.
Thus, the microbial dynamics are partly constrainedindirectly from other observations. Such considerationssuggest that our hypothesis is consistent with manyobservations on different components of the oceanecosystem. But the possibility still exists that an alter-nate solution not supporting our hypothesis can also begenerated, and still be consistent with the observa-tions. Thus we conducted another numerical experi-ment to test if the model can generate an alternatesolution while keeping similar goodness of fit to theobservations.
Numerical experiment: no bacterial SDOM utilization
Semilabile DOM does accumulate seasonally (Carl-son 2002, Church et al. 2002). Such observations con-firm that some phytoplankton and zooplankton do pro-duce semilabile DOM. It remains unclear whether theaccumulated semilabile DOM is mostly utilized bybacteria in the surface layer (e.g. Carlson et al. 2004),or survives eventually to be physically exported duringdeep-mixing events. In order to test the null hypothesisof this study, i.e. semilabile DOM mostly accumulatesinstead of being utilized, we conducted anothernumerical experiment where bacteria did not utilizeany semilabile DOM. Accordingly, DOM productionwould be partitioned more to LDOM. Because thereare no data to estimate the partitioning between
LDOM and SDOM production by phytoplankton andzooplankton, the experiment also assigned all theDOM production by protozoa and metazoa to LDOM,which could roughly reduce the total biological semi-labile DOC production by 50% (Fig. 3). The scheme ofsemilabile DOC production from detritus dissolutionwas not changed, as these fluxes were partly con-strained by observations. Using data assimilation totest the resulting model performance indicated that atAS, the model became much worse at fitting semilabileDOC and DON (DOP was not assimilated for AS) andbacterial biomass (reflected in their increased cost),while the fit to bacterial production remained un-changed (Fig. 7). At EQP, the model performance fol-lowing assimilation was more robust at fitting semil-abile DOC (DON and DOP were not assimilated forEQP), bacterial biomass and production (Fig. 7). AtHOT, the model performance deteriorated in fittingsemilabile DON and DOP, bacterial biomass and pro-duction, while improving only slightly in fitting semil-abile DOC (Fig. 7). The total cost increased by 43, 7and 23% respectively for AS, EQP and HOT (Fig. 7).Excluding cost components for SDOM and bacterialbiomass and production, the total costs from all othercomponents increased by 26, 19 and 17% respectivelyfor AS, EQP and HOT (Table 6). Thus the experimentwithout SDOM utilization resulted in significantlyweaker fits to both microbial observations (bacteriaand SDOM) and other model components at AS andHOT. Although the experiment resulted in a better fitto bacteria and SDOM at EQP, this came at theexpense of weaker fits to other observations, and thetotal cost still indicated overall that the experiment didnot improve the model performance.
This experiment of seeking an alternate solution toour hypothesis resulted in a significantly worse fit tothe observations, not just to bacterial and DOMdynamics but also to observations related to variousother properties of the ecosystem (e.g. nutrient con-centrations, productivity). In other words, the currentmodel structure argues against this alternate solutionto our hypothesis.
CONCLUSIONS
This is one of the first studies to use a large numberof ecological and biogeochemical observations fromdifferent aspects of the upper ocean ecosystem includ-ing bacteria and DOM to test and constrain a marineecosystem model. The modeled heterotrophic micro-bial dynamics were directly constrained by measuredDOM concentration and bacterial biomass and produc-tion, and indirectly by other measured variables. Themodeled rates and variables were inside the range of
284

Luo et al.: Data assimilative modeling of bacteria and DOM
current observations and are consistent with our cur-rent understandings of marine microbiology. By assim-ilating a wide range of ecosystem observations, wedemonstrate that the modeled microbial dynamics didnot contradict observations of the whole ecosystem.Thus this modeling work bridges heterotrophic bacte-ria to other parts of the upper ocean ecosystem, andprovides evidence for the consistency among discretecomponents of ecosystems.
Our modeled results and the additional experimentsdid not reject our hypothesis that semilabile DOM sup-ports a significant amount of bacterial carbon demand(17 to 40%, Fig. 4). This study was applied to 3 differ-ent open ocean sites with different physical, biogeo-chemical and ecological characteristics: the relativelyeutrophic Arabian Sea with seasonal monsoonal forc-
ing, regions of the mesotrophic Equatorial Pacificwhere strong upwelling dominates upper oceandynamics, and the persistently stratified oligotrophicHawaii Ocean Time-series site. All of the sites showedsimilar results regarding the role of semilabile DOM-supported bacterial production. If our estimate thatSDOM-supported bacterial production accounted for17 to 40% of the total bacterial requirement is correct,SDOM is acting as a buffering pool and is likely stabi-lizing time-space variations in bacterial production.Such results would contribute to the observed varia-tions in coupling between primary production and bac-terial production in the open ocean.
To better support our hypothesis, the uncertaintyrelated to partitioning between LDOM and SDOMproduction still needs to be clarified. We suggest fur-ther study of the components and lability of DOM pro-duced by phytoplankton and zooplankton remain keyissues for marine microbiology.
Acknowledgements. Computing resources were provided bythe Sciclone cluster at The College of William and Mary.Y.W.L. was supported by fellowships from the Virginia Insti-tute of Marine Sciences and Marine Biological Laboratory aswell as NSF Grants OPP-0217282 and 0823101 to H.W.D. andVIMS and MBL, respectively. M.A.M.F.’s participation wassupported in part by a grant from the NASA Ocean Biologyand Biogeochemistry program (NNX07AF70G), S.C.D.’s
285
AS EQP HOT
Standard model 79.9 85.4 44.2No SDOM utilization 100.8 101.2 51.5Change (%) +26 +19 +17
Table 6. Total optimized costs excluding the semilabile DOM(SDOM) and bacterial biomass and production components,comparing the standard model and the experiments withoutSDOM utilization by bacteria. For abbreviations see Table 2
–100
0
+100
–100
0
+100
Cos
t ch
ange
(%)
NO3 PO4 MZc PHYn CHL PP BAc BP sDOC sDON sDOP POC PON POP STc STn STp TOTAL–100
0
+100
EQP
HOT
+207%+148%
+169%
+131%+195%
AS
+408%+401%
Fig. 7. Changes of cost function (including each component and total) at modeling site AS (Arabian Sea; upper panel), EQP(Equatorial Pacific; middle) and HOT (Hawaii Ocean Time-series Station ALOHA; lower) when bacteria do not utilize SDOM,and protozoa and metazoa allocate all the DOM production to the labile pool. The model was re-optimized. A positive changeindicates the cost is higher and the model becomes a worse fit to the observations, and vice versa. Changes larger than 100%
are marked on the top of the bars. See Table 2 for other abbreviations

Aquat Microb Ecol 60: 273–287, 2010
participation was supported by an NSF grant to the Centerfor Microbial Oceanography, Research and Education (C-MORE), NSF EF-0424599, and M.J.C. was supported in partby NSF grants EF-0424599 (C-MORE) and OCE 0425363. Wethank all the scientists and ships’ crew who collected andanalyzed data during US JGOFS cruises in the Arabian Sea,Equatorial Pacific and Hawaii Ocean Time-series.
LITERATURE CITED
Azam F (1998) Microbial control of oceanic carbon flux: theplot thickens. Science 280:694–696
Azam F, Fenchel T, Field JG, Gray JS, Meyer-Reil LA,Thingstad F (1983) The ecological role of water-columnmicrobes in the sea. Mar Ecol Prog Ser 10:257–263
Benner R (2002) Chemical composition and reactivity. In:Hansell DA, Carlson CA (eds) Biogeochemistry of marinedissolved organic matter. Academic Press, San Diego, CA,p 59–90
Berelson WM (2001) The flux of particulate organic carboninto the ocean interior: a comparison of four US JGOFSregional studies. Oceanography 14:59–67
Bertilsson S, Berglund O, Karl DM, Chisholm SW (2003) Ele-mental composition of marine Prochlorococcus and Syne-chococcus: implications for the ecological stoichiometry ofthe sea. Limnol Oceanogr 48:1721–1731
Bjørnsen PK (1988) Phytoplankton exudation of organic matter:Why do healthy cells do it? Limnol Oceanogr 33:151–154
Carlson CA (2002) Production and removal processes. In:Hansell DA, Carlson CA (eds) Biogeochemistry of marinedissolved organic matter. Elsevier Science, New York, NY,p 91–151
Carlson CA, Ducklow HW, Michaels AF (1994) Annual flux ofdissolved organic carbon from the euphotic zone in thenorthwestern Sargasso Sea. Nature 371:405–408
Carlson CA, Giovannoni SJ, Hansell DA, Goldberg SJ, Par-sons R, Vergin K (2004) Interactions among dissolvedorganic carbon, microbial processes, and communitystructure in the mesopelagic zone of the northwestern Sar-gasso Sea. Limnol Oceanogr 49:1073–1083
Church MJ, Ducklow HW, Karl DM (2002) Multiyearincreases in dissolved organic matter inventories at stationALOHA in the North Pacific Subtropical Gyre. LimnolOceanogr 47:1–10
Church MJ, Ducklow HW, Letelier RM, Karl DM (2006) Tem-poral and vertical dynamics in picoplankton photo-heterotrophic production in the subtropical North PacificOcean. Aquat Microb Ecol 45:41–53
del Giorgio PA, Cole JJ (2000) Bacterial energetics andgrowth efficiency. In: Kirchman DL (ed) Microbial ecologyof the oceans. Wiley-Liss, New York, NY, p 289–325
Doney SC, Ducklow HW (2006) A decade of synthesis andmodeling in the US Joint Global Ocean Flux Study. Deep-Sea Res II 53:451–458
Droop M (1974) The nutrient status of algal cell in continuousculture. J Mar Biol Assoc UK 54:825–855
Droop MR (1983) 25 years of algal growth kinetics: a personalview. Bot Mar 26:99–112
Ducklow HW, Carlson CA (1992) Oceanic bacterial produc-tivity. Adv Microb Ecol 12:113–181
Ducklow HW, Carlson CA, Bates NR, Knap AH, Michaels AF(1995) Dissolved organic carbon as a component of thebiological pump in the North Atlantic Ocean. Philos TransR Soc Lond B Biol Sci 348:161–167
Fogg GE (1966) The extracellular products of algae.Oceanogr Mar Biol Annu Rev 4:195–212
Friedrichs MAM (2002) Assimilation of JGOFS EqPac andSeaWiFS data into a marine ecosystem model of the cen-tral equatorial Pacific Ocean. Deep-Sea Res II 49:289–319
Friedrichs MAM, Hood RR, Wiggert JD (2006) Ecosystemmodel complexity versus physical forcing: quantificationof their relative impact with assimilated Arabian Sea data.Deep-Sea Res II 53:576–600
Friedrichs MAM, Dusenberry JA, Anderson LA, ArmstrongRA and others (2007) Assessment of skill and portability inregional marine biogeochemical models: role of multipleplanktonic groups. J Geophys Res 112:C08001. doi:10.1029/2006jc003852
Geider RJ, MacIntyre HL, Kana TM (1998) A dynamic regula-tory model of phytoplanktonic acclimation to light, nutri-ents, and temperature. Limnol Oceanogr 43:679–694
Gilbert JC, Lemaréchal C (1989) Some numerical experi-ments with variable-storage quasi-newton algorithms.Math Program 45:407–435
Glibert PM, Bronk DA (1994) Release of dissolved organicnitrogen by marine diazotrophic cyanobacteria, Tricho-desmium spp. Appl Environ Microbiol 60:3996–4000
Hansell DA (2002) DOC in the global ocean carbon cycle. In:Hansell DA, Carlson CA (eds) Biogeochemistry of marinedissolved organic matter. Academic Press, San Diego, CA,p 685–715
Hedges JI (1992) Global biogeochemical cycles: progress andproblems. Mar Chem 39:67–93
Honjo S, Manganini SJ, Krishfield RA, Francois R (2008) Par-ticulate organic carbon fluxes to the ocean interior andfactors controlling the biological pump: a synthesis ofglobal sediment trap programs since 1983. Prog Oceanogr76:217–285
Hopkinson CS, Vallino JJ (2005) Efficient export of carbon tothe deep ocean through dissolved organic matter. Nature433:142–145
Jackson GA (1988) Implications of high dissolved organicmatter concentrations for oceanic properties and pro-cesses. Oceanography 1:28–33
Karl DM, Dore JE, Lukas R, Michaels AF, Bates NR, Knap A(2001) Building the long-term picture: the U.S. JGOFStime-series programs. Oceanography 14:6–17
Kirchman DL (2000) Uptake and regeneration of inorganicnutrients by marine heterotrophic bacteria. In: KirchmanDL (ed) Microbial ecology of the oceans. Wiley-Liss, NewYork, NY, p 261–288
Kirchman DL (2002) The contribution of monomers and otherlow-molecular weight compounds to the flux of dissolvedorganic material in aquatic ecosystems. In: Findlay SEG,Sinsabaugh RL (eds) Aquatic ecosystems: interactive ofdissolved organic matter. Academic Press, San Diego, CA,p 217–241
Lawson LM, Spitz YH, Hofmann EE, Long RB (1995) A dataassimilation technique applied to a predator-prey model.Bull Math Biol 57:593–617
McCarthy JJ (1980) Nitrogen. In: Morris I (ed) The physio-logical ecology of phytoplankton. Blackwell, Oxford,p 191–234
Mulholland MR (2007) The fate of nitrogen fixed by dia-zotrophs in the ocean. Biogeosciences 4:37–51
Mulholland MR, Bronk DA, Capone DG (2004) Dinitrogen fix-ation and release of ammonium and dissolved organicnitrogen by Trichodesmium IMS101. Aquat Microb Ecol37:85–94
Nagata T (2000) Production mechanisms of dissolved organicmatter. In: Kirchman DL (ed) Microbial ecology of theoceans. Wiley-Liss, New York, NY, p 121–152
Redfield AC (1934) On the proportions of organic derivations
286
Luo et al.: Data assimilative modeling of bacteria and DOM
in sea water and their relation to the composition of plank-ton. In: Daniel RJ (ed) James Johnstone Memorial Volume,University Press of Liverpool, p 177–192
Robinson C (2008) Heterotrophic bacterial respiration. In:Kirchman DL (ed) Microbial ecology of the oceans, 2ndedn. John Wiley & Sons, Hoboken, NJ, p 299–334
Spitz YH, Moisan JR, Abbott MR (2001) Configuring anecosystem model using data from the Bermuda AtlanticTime Series (BATS). Deep-Sea Res II 48:1733–1768
Vallino JJ (2000) Improving marine ecosystem models: use of
data assimilation and mesocosm experiments. J Mar Res58:117–164
Ward BA, Friedrichs MAM, Anderson TR, Oschlies A (2010)Parameter optimisation techniques and the problem of under-determination in marine biogeochemical models. J Mar Syst81:34–43
Williams PJ le B. (2000) Heterotrophic bacteria and thedynamics of dissolved organic material. In: Kirchman DL(ed) Microbial ecology of the oceans. Wiley-Liss, NewYork, NY, p 153–200
287
Editorial responsibility: Craig Carlson,Santa Barbara, California, USA
Submitted: June 2, 2009; Accepted: May 17, 2010Proofs received from author(s): July 14, 2010