Embed Size (px)
Citation preview
1
Oceanic Energy
Assistant Professor Mazen AbualtayefEnvironmental Engineering Department
Islamic University of Gaza, Palestine

2
Adapted from a presentation by
Professor S.R. LawrenceLeeds School of Business, Environmental Studies
University of Colorado, Boulder, CO, USA
3
Course Outline
Renewable
Hydro Power
Wind Energy
Oceanic Energy
Solar Power
Geothermal
Biomass
Sustainable
Hydrogen & Fuel Cells
Nuclear
Fossil Fuel Innovation
Exotic Technologies
Integration
Distributed Generation
4
Oceanic Energy Outline
Overview
Tidal Power
Technologies
Environmental
Impacts
Economics
Future Promise
Wave Energy
Technologies
Environmental
Impacts
Economics
Future Promise
Assessment

5
Overview of Oceanic Energy
6
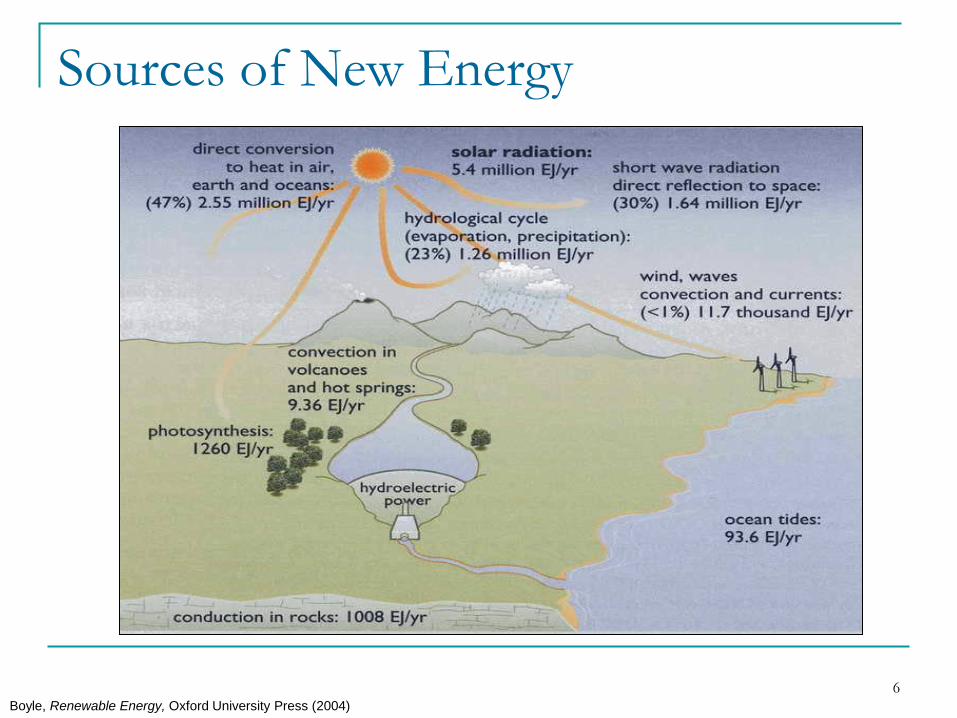
Sources of New Energy
Boyle, Renewable Energy, Oxford University Press (2004)
7
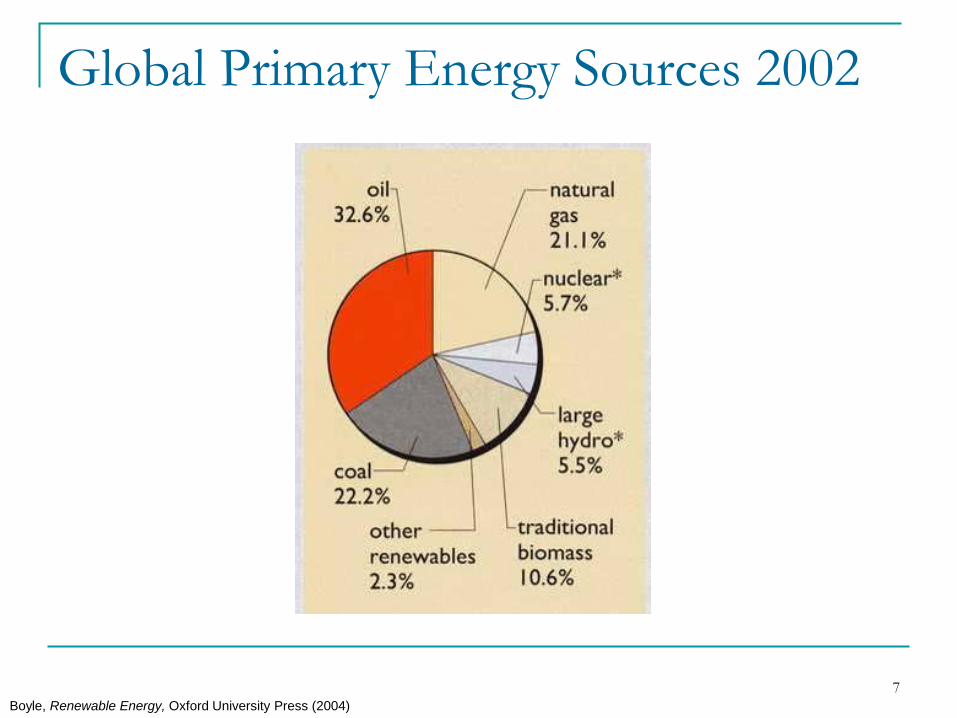
Global Primary Energy Sources 2002
Boyle, Renewable Energy, Oxford University Press (2004)
8
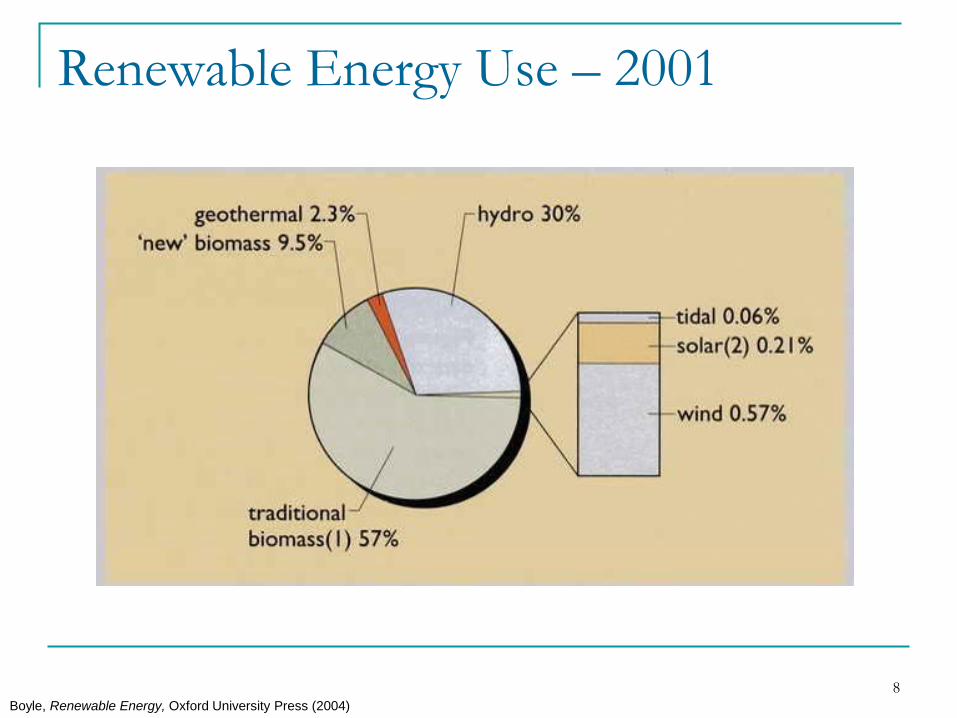
Renewable Energy Use – 2001
Boyle, Renewable Energy, Oxford University Press (2004)

9
Tidal Power
10
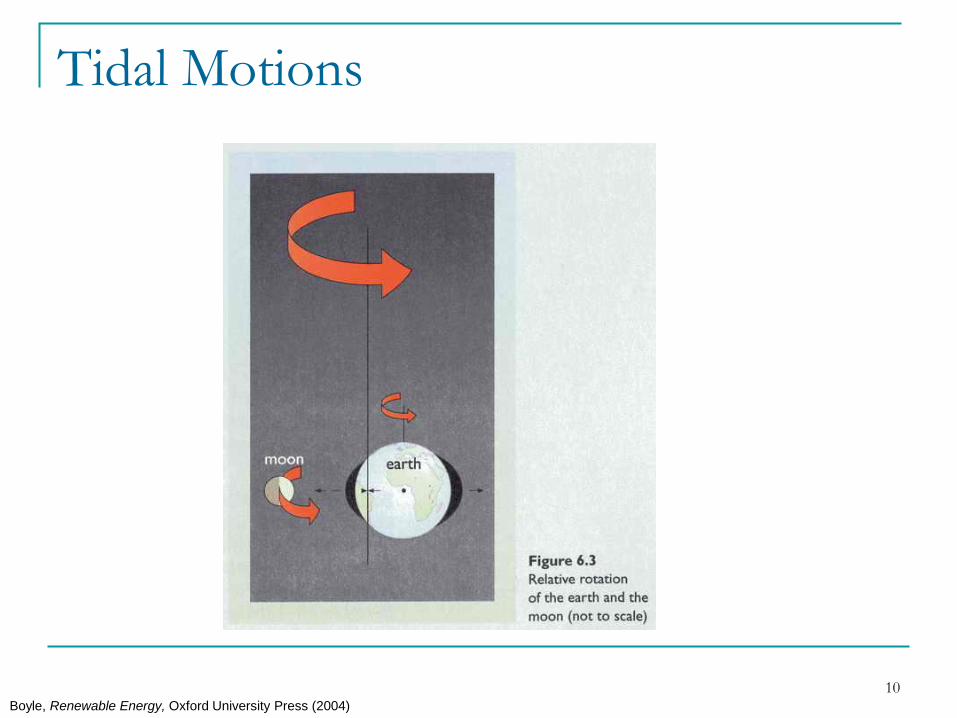
Tidal Motions
Boyle, Renewable Energy, Oxford University Press (2004)
11
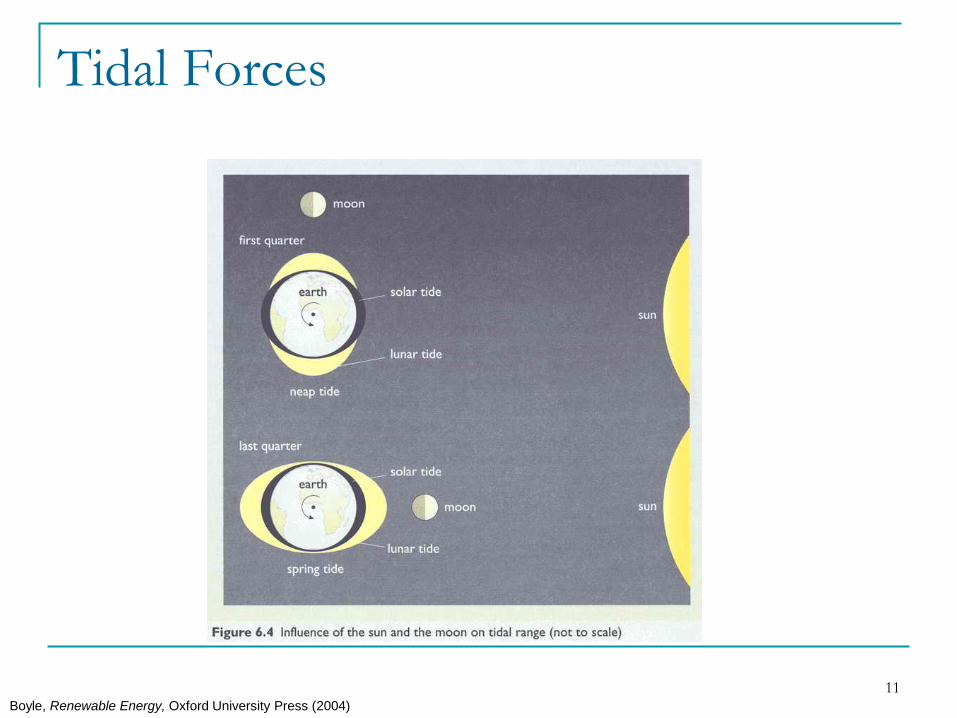
Tidal Forces
Boyle, Renewable Energy, Oxford University Press (2004)
12
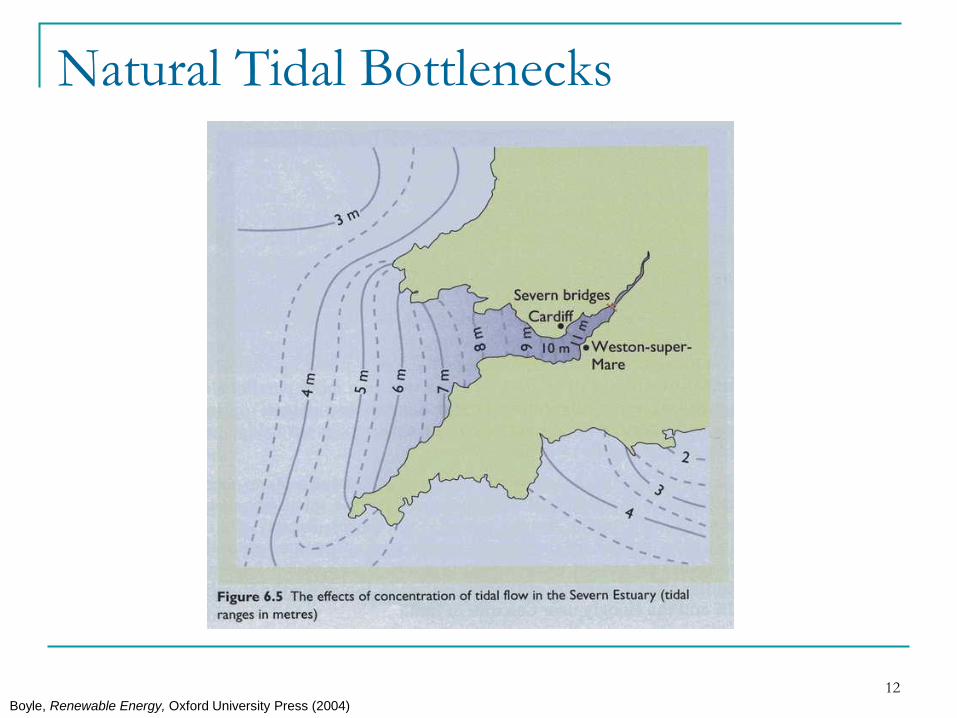
Natural Tidal Bottlenecks
Boyle, Renewable Energy, Oxford University Press (2004)
13
Tidal Energy Technologies
1. Tidal Turbine Farms
2. Tidal Barrages (dams)
14
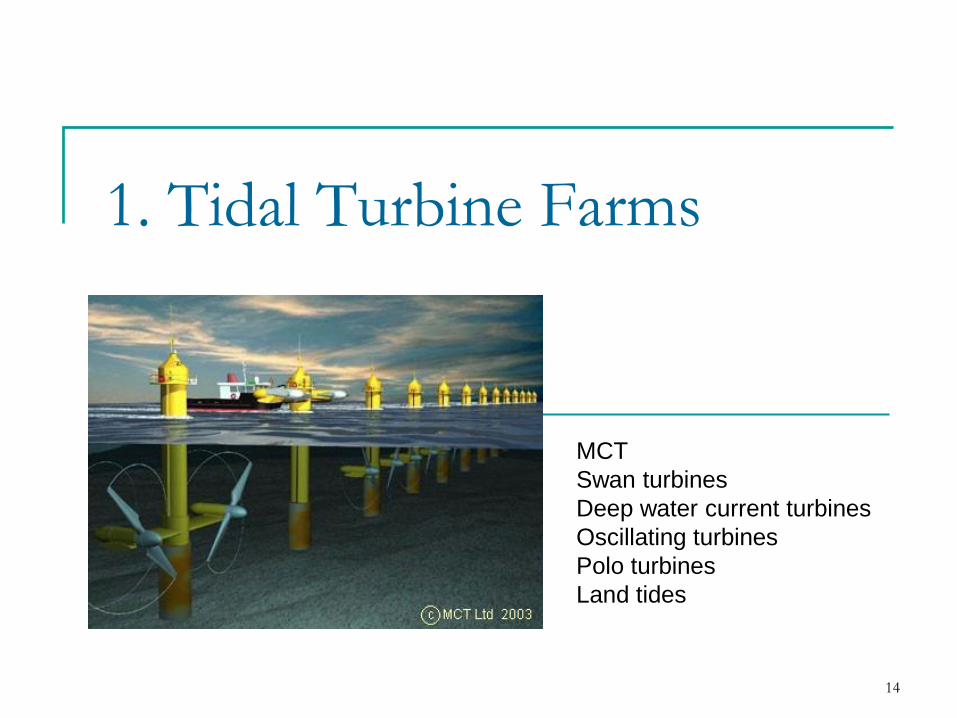
1. Tidal Turbine Farms
MCT
Swan turbines
Deep water current turbines
Oscillating turbines
Polo turbines
Land tides
15
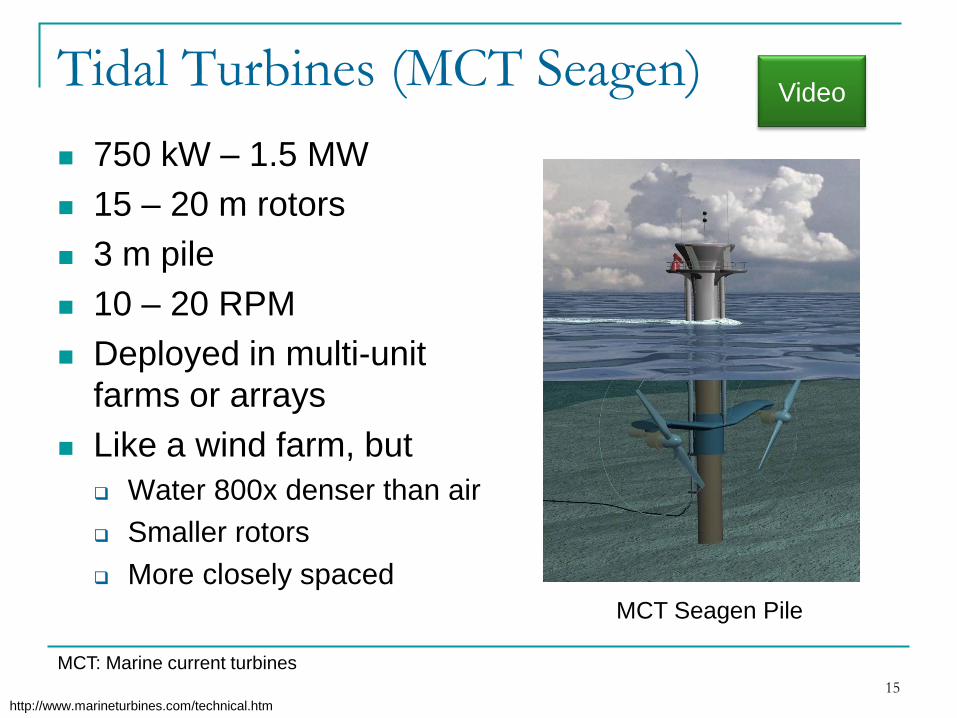
Tidal Turbines (MCT Seagen)
750 kW – 1.5 MW
15 – 20 m rotors
3 m pile
10 – 20 RPM
Deployed in multi-unit
farms or arrays
Like a wind farm, but
Water 800x denser than air
Smaller rotors
More closely spaced
http://www.marineturbines.com/technical.htm
MCT Seagen Pile
MCT: Marine current turbines
Video
16
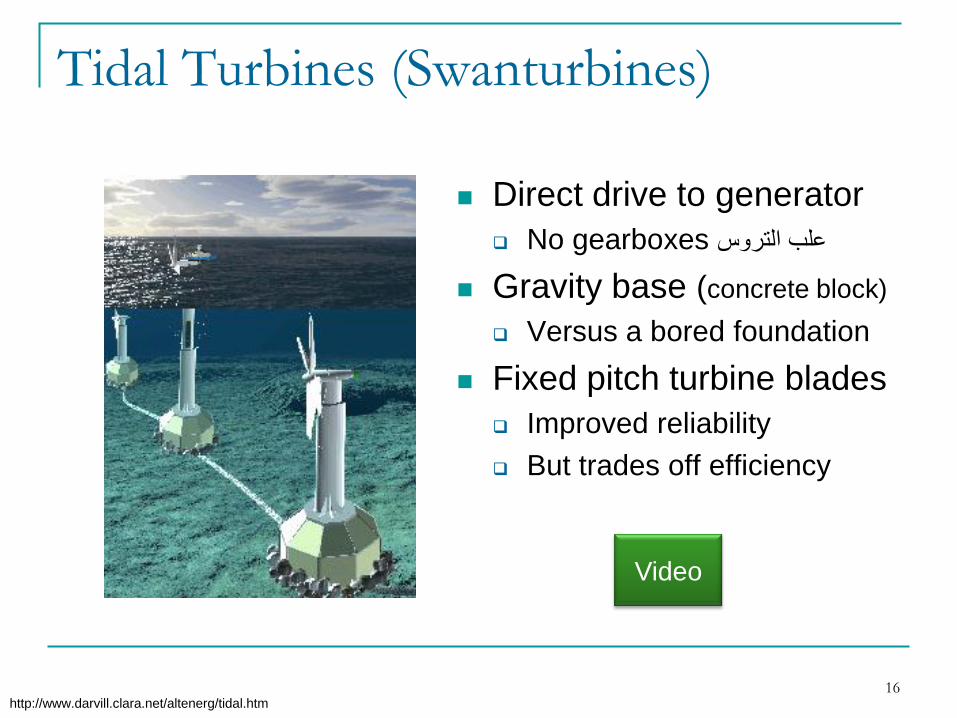
Tidal Turbines (Swanturbines)
Direct drive to generator
No gearboxes علب التروس
Gravity base (concrete block)
Versus a bored foundation
Fixed pitch turbine blades
Improved reliability
But trades off efficiency
http://www.darvill.clara.net/altenerg/tidal.htm
Video
17
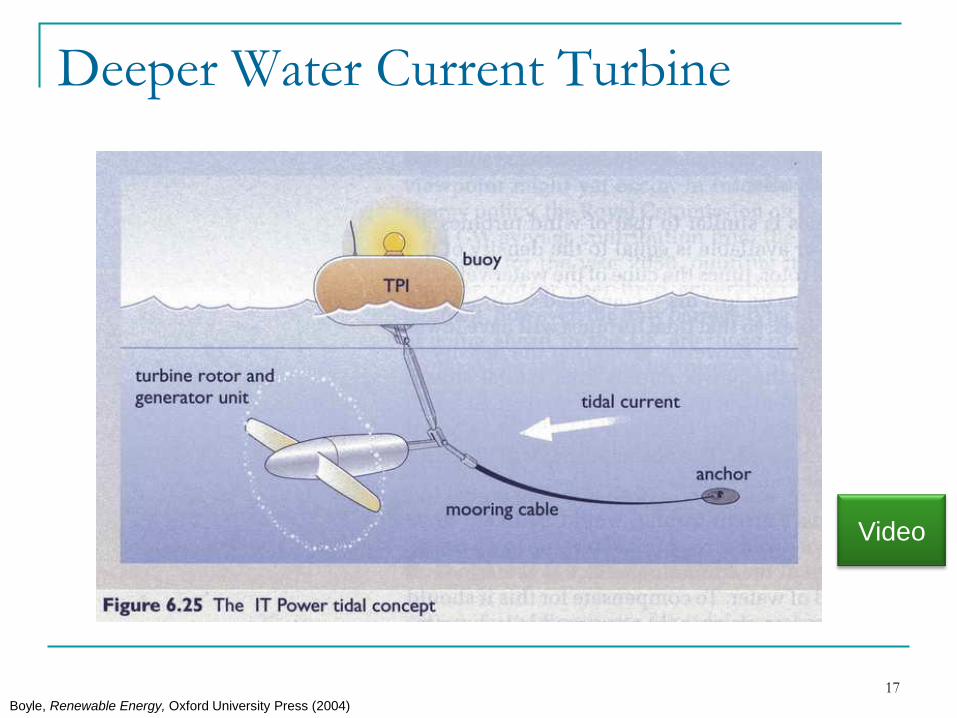
Deeper Water Current Turbine
Boyle, Renewable Energy, Oxford University Press (2004)
Video
18
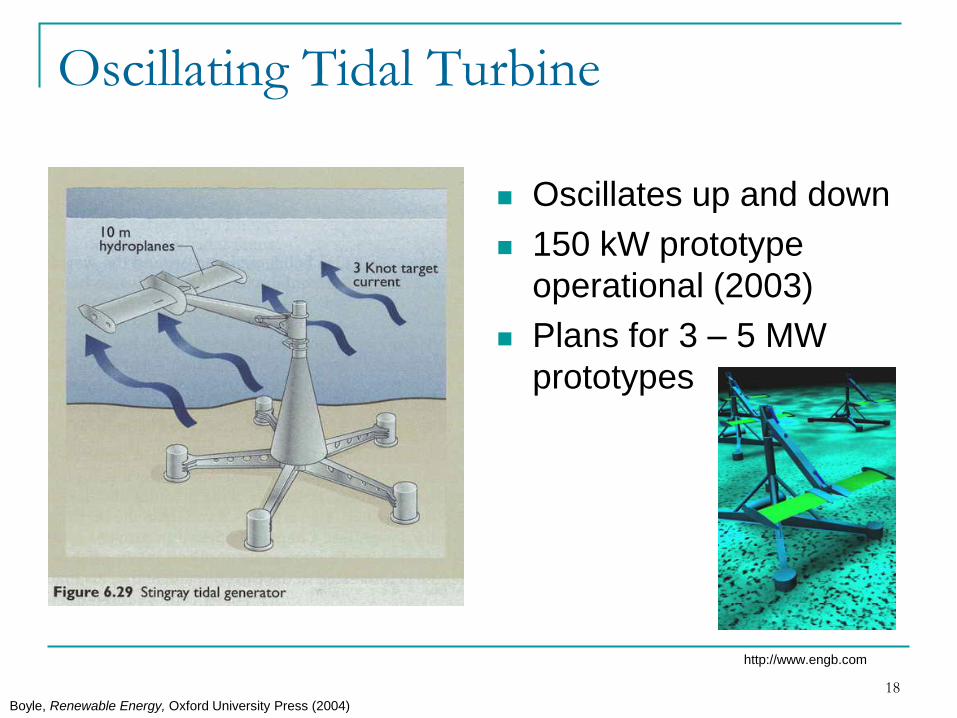
Oscillating Tidal Turbine
Oscillates up and down
150 kW prototype
operational (2003)
Plans for 3 – 5 MW
prototypes
Boyle, Renewable Energy, Oxford University Press (2004)
http://www.engb.com
19
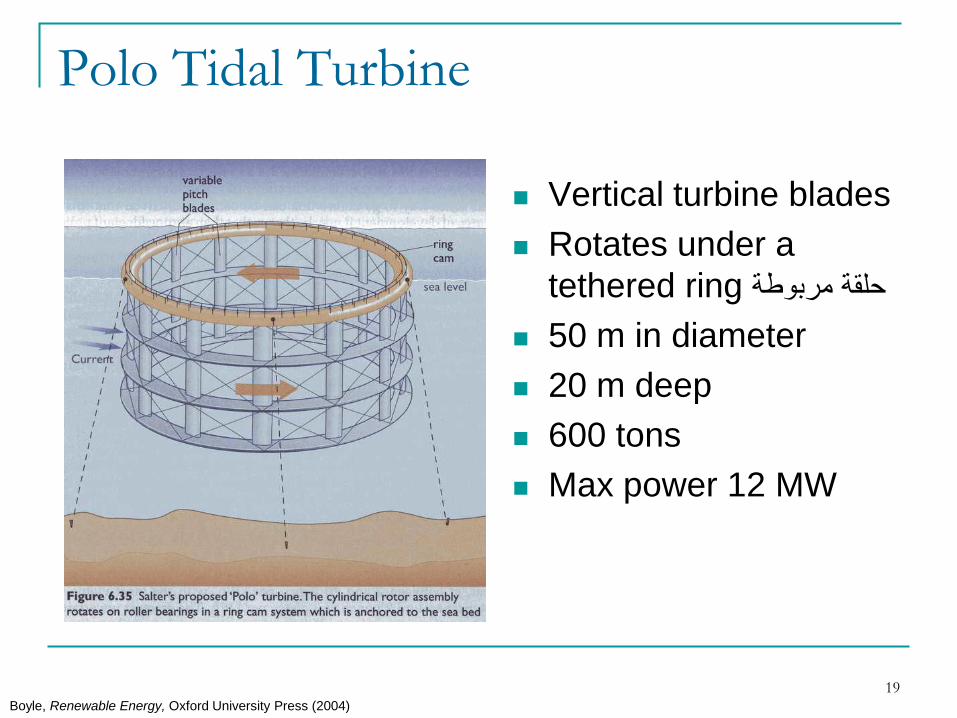
Polo Tidal Turbine
Vertical turbine blades
Rotates under a
tethered ring حلقة مربوطة
50 m in diameter
20 m deep
600 tons
Max power 12 MW
Boyle, Renewable Energy, Oxford University Press (2004)
20
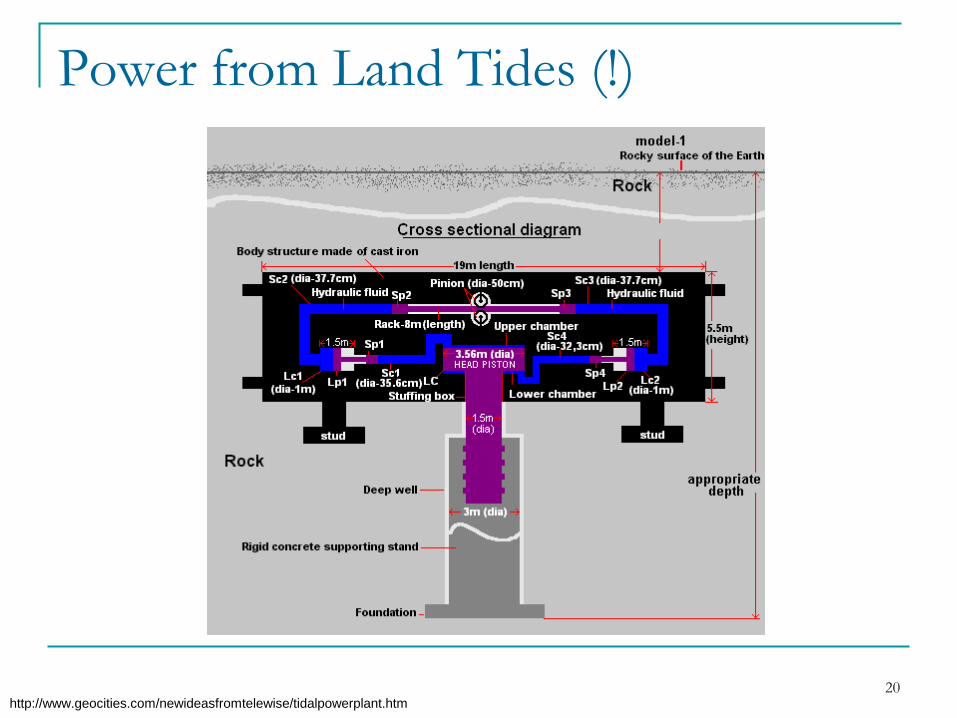
Power from Land Tides (!)
http://www.geocities.com/newideasfromtelewise/tidalpowerplant.htm
21
Advantages of Tidal Turbines
Low Visual Impact
Mainly, if not totally submerged.
Low Noise Pollution
Sound levels transmitted are very low
High Predictability
Tides predicted years in advance, unlike wind
High Power Density
Much smaller turbines than wind turbines for the
same power
http://ee4.swan.ac.uk/egormeja/index.htm
22
Disadvantages of Tidal Turbines
High maintenance costs
High power distribution costs
Somewhat limited upside capacity
Intermittent power generation

23
2. Tidal Barrage Schemes
Barrages
Offshore lagoons
Fences
24
Definitions
Barrage
An artificial dam to increase the depth of water for
use in irrigation or navigation, or in this case,
generating electricity.
Flood
The rise of the tide toward land (rising tide)
Ebb
The return of the tide to the sea (falling tide)
25
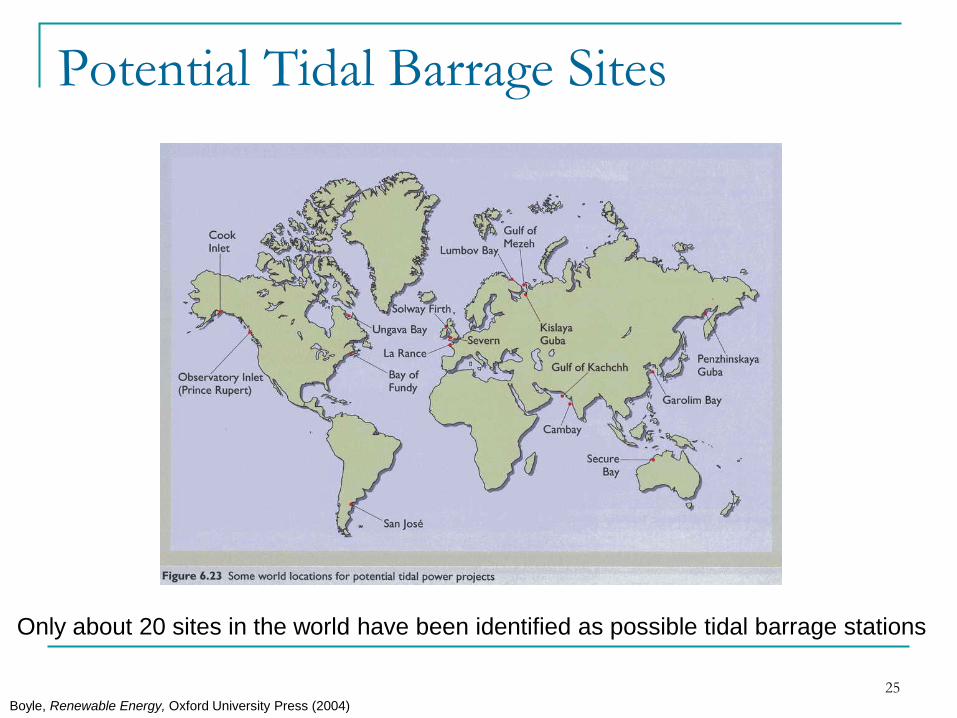
Potential Tidal Barrage Sites
Boyle, Renewable Energy, Oxford University Press (2004)
Only about 20 sites in the world have been identified as possible tidal barrage stations
26
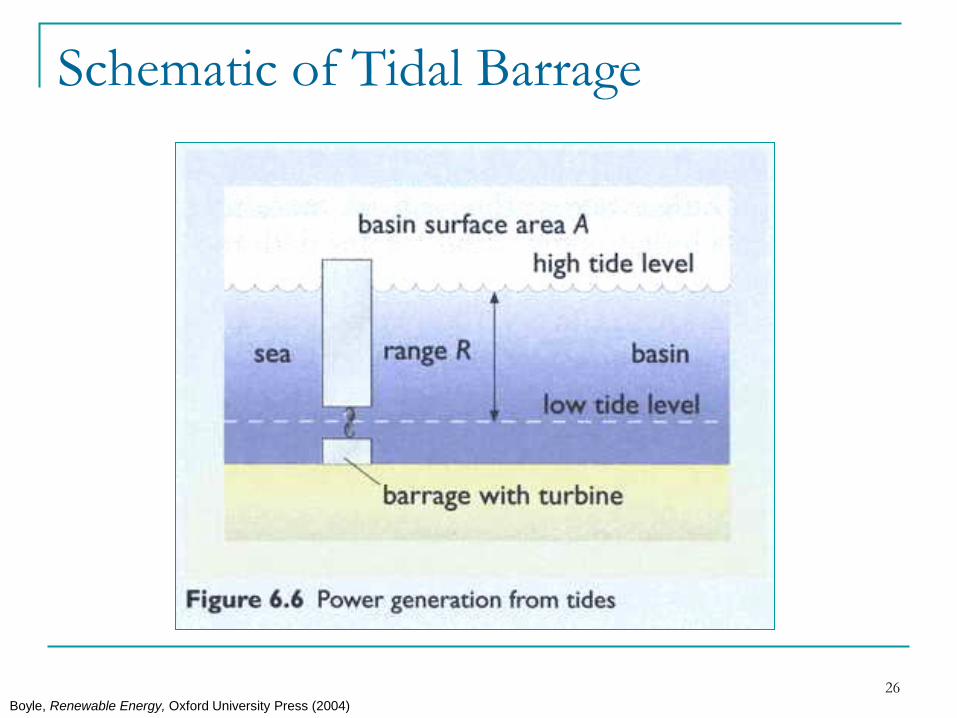
Schematic of Tidal Barrage
Boyle, Renewable Energy, Oxford University Press (2004)
27
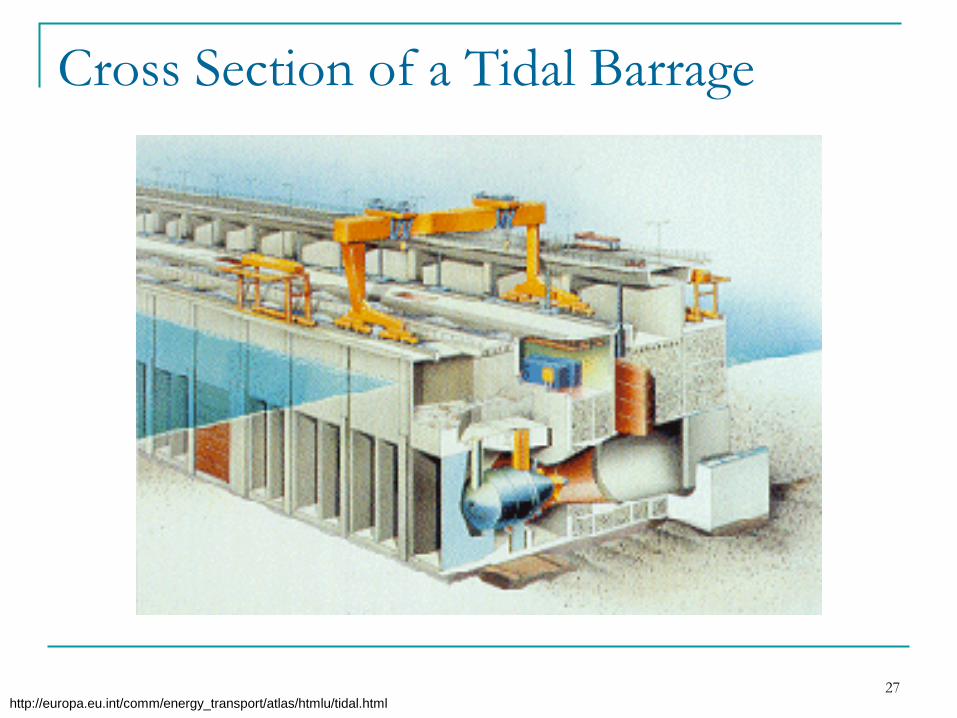
Cross Section of a Tidal Barrage
http://europa.eu.int/comm/energy_transport/atlas/htmlu/tidal.html
28
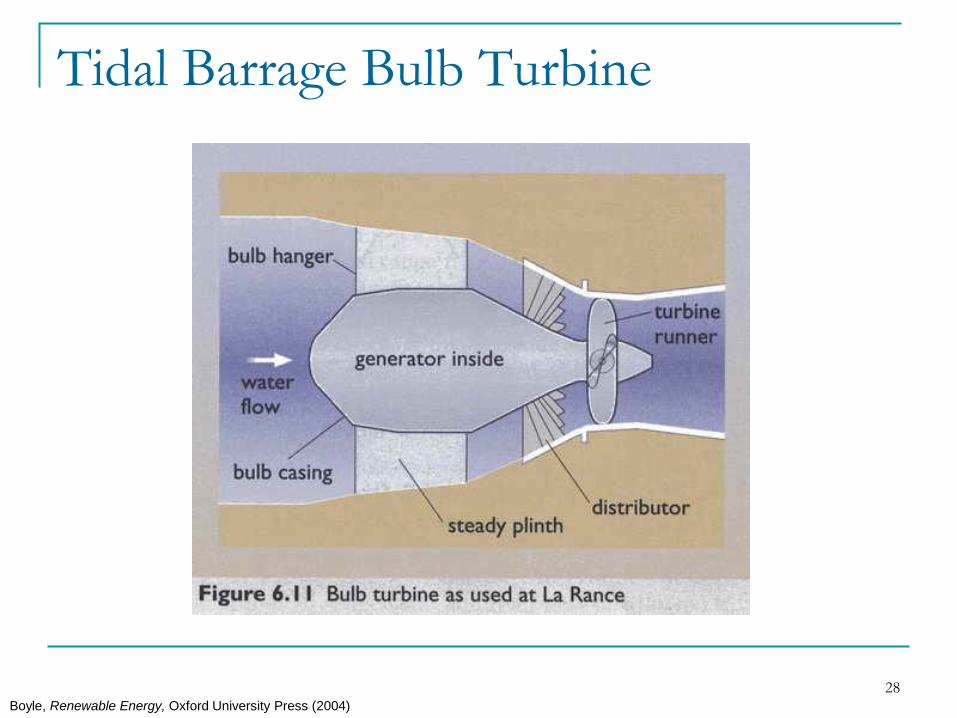
Tidal Barrage Bulb Turbine
Boyle, Renewable Energy, Oxford University Press (2004)
29
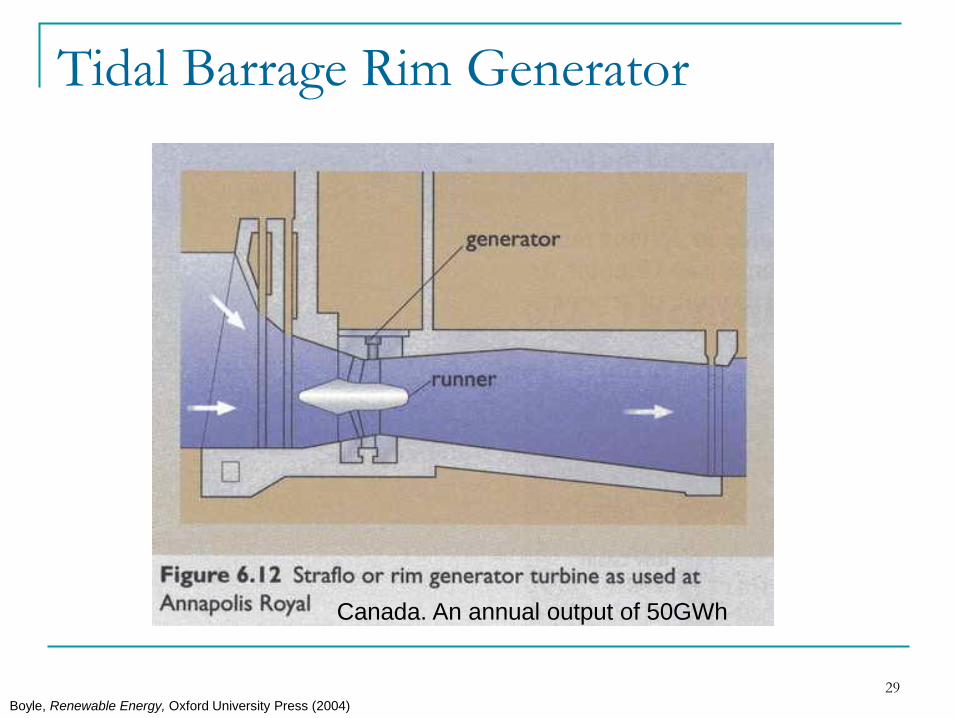
Tidal Barrage Rim Generator
Boyle, Renewable Energy, Oxford University Press (2004)
Canada. An annual output of 50GWh
30
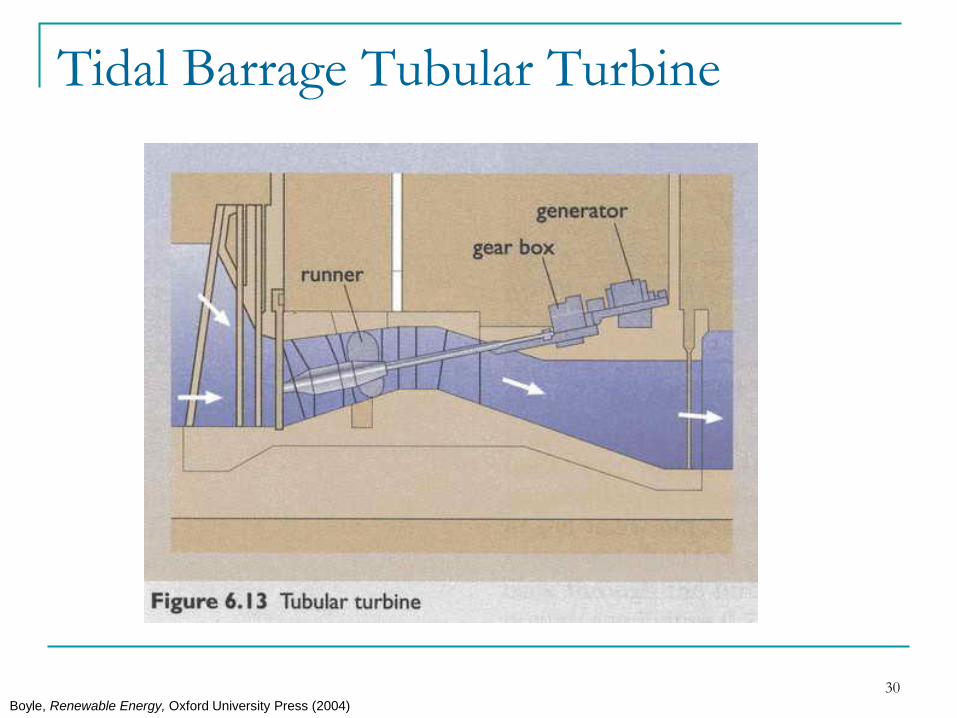
Tidal Barrage Tubular Turbine
Boyle, Renewable Energy, Oxford University Press (2004)
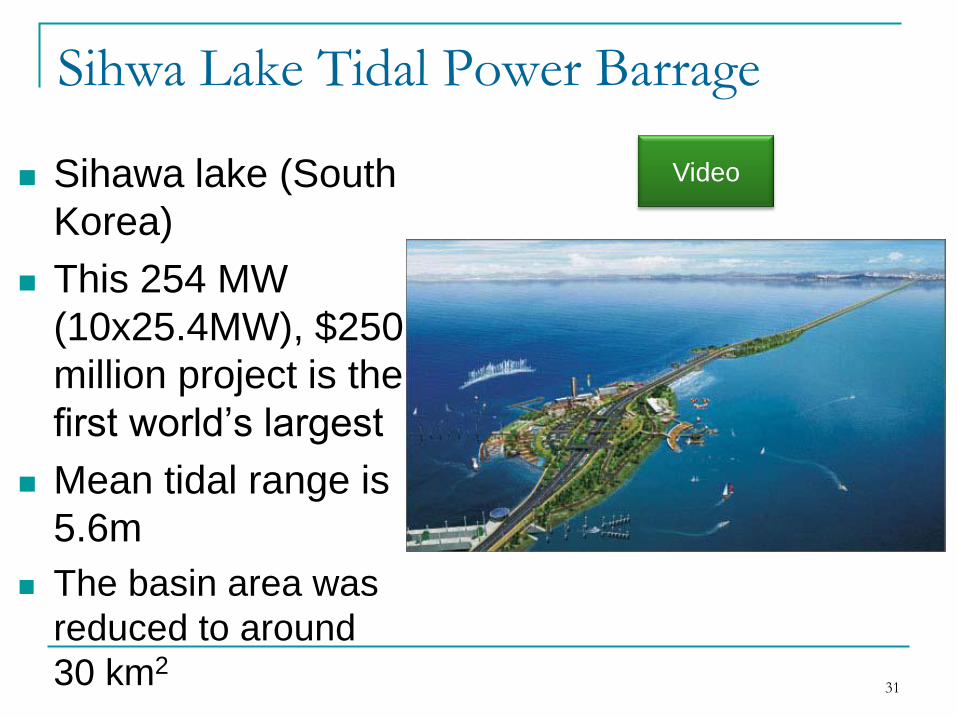
Sihwa Lake Tidal Power Barrage
31
Video Sihawa lake (South
Korea)
This 254 MW
(10x25.4MW), $250
million project is the
first world’s largest
Mean tidal range is
5.6m
The basin area was
reduced to around
30 km2
32
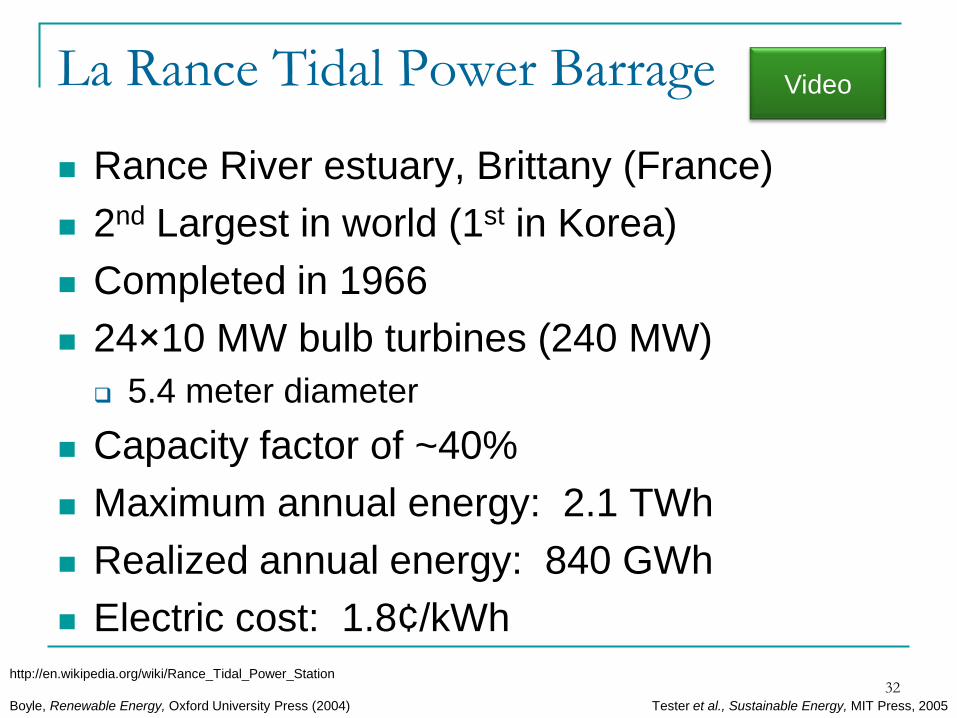
La Rance Tidal Power Barrage
Rance River estuary, Brittany (France)
2nd Largest in world (1st in Korea)
Completed in 1966
24×10 MW bulb turbines (240 MW)
5.4 meter diameter
Capacity factor of ~40%
Maximum annual energy: 2.1 TWh
Realized annual energy: 840 GWh
Electric cost: 1.8¢/kWh
Tester et al., Sustainable Energy, MIT Press, 2005Boyle, Renewable Energy, Oxford University Press (2004)
http://en.wikipedia.org/wiki/Rance_Tidal_Power_Station
Video
33
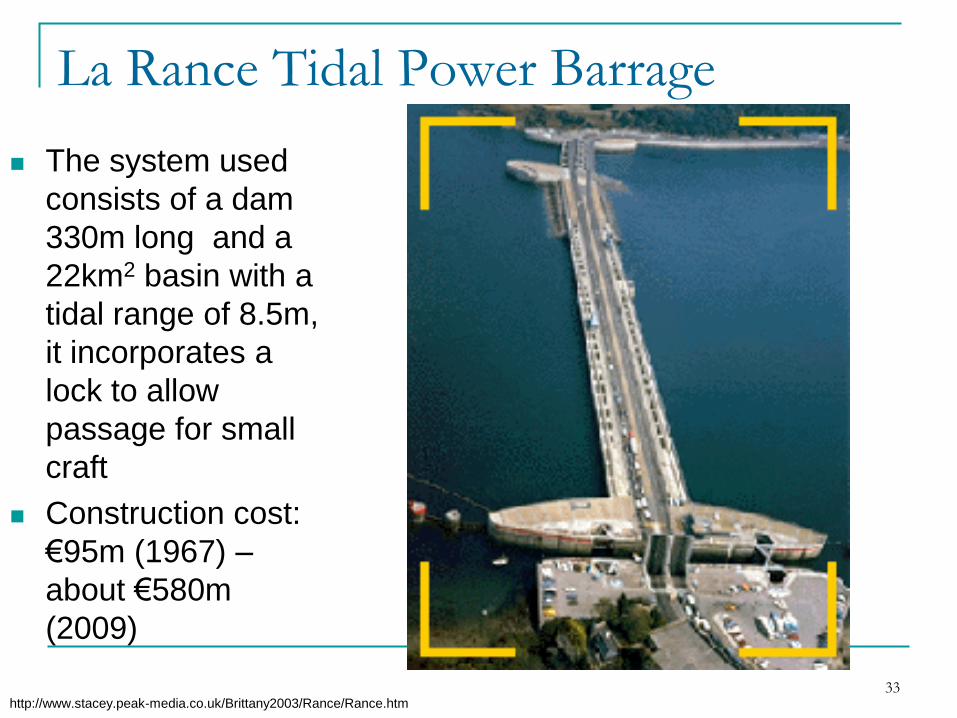
La Rance Tidal Power Barrage
http://www.stacey.peak-media.co.uk/Brittany2003/Rance/Rance.htm
The system used
consists of a dam
330m long and a
22km2 basin with a
tidal range of 8.5m,
it incorporates a
lock to allow
passage for small
craft
Construction cost:
€95m (1967) –
about €580m
(2009)
34
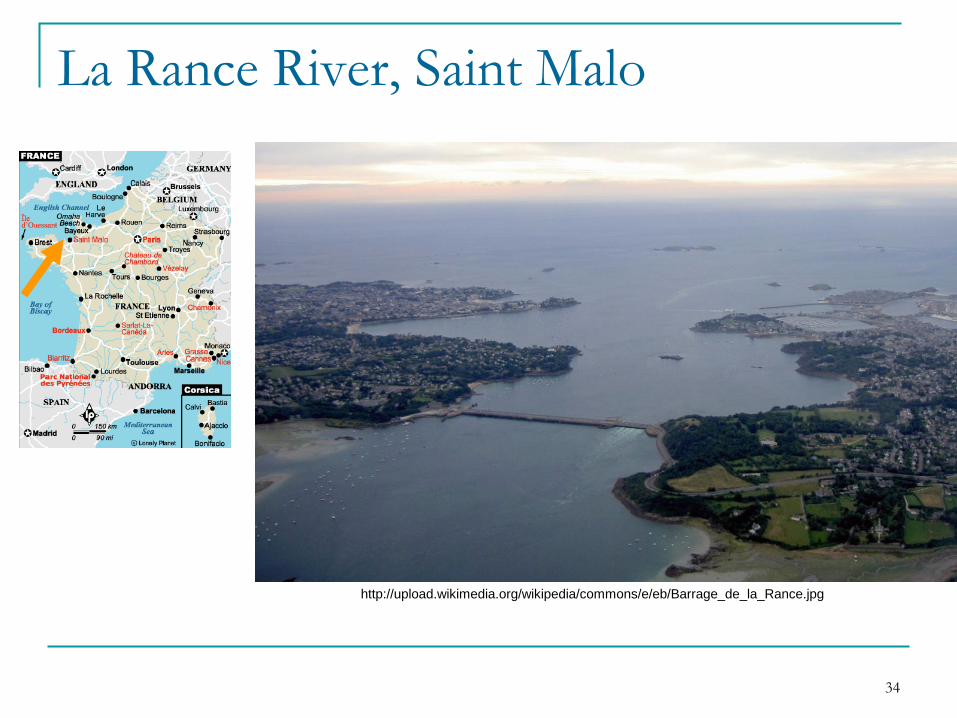
La Rance River, Saint Malo
http://upload.wikimedia.org/wikipedia/commons/e/eb/Barrage_de_la_Rance.jpg
35
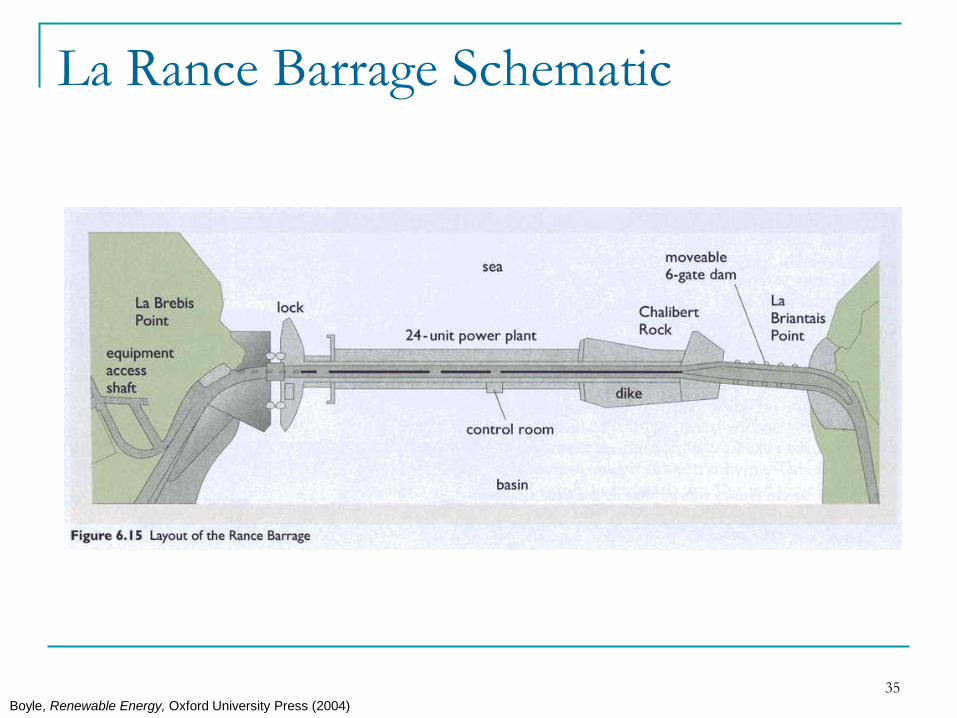
La Rance Barrage Schematic
Boyle, Renewable Energy, Oxford University Press (2004)

36
Cross Section of La Rance Barrage
Tide going out
sea
river
http://en.wikipedia.org/wiki/File:Coupebarrage_Rance.jpg
37
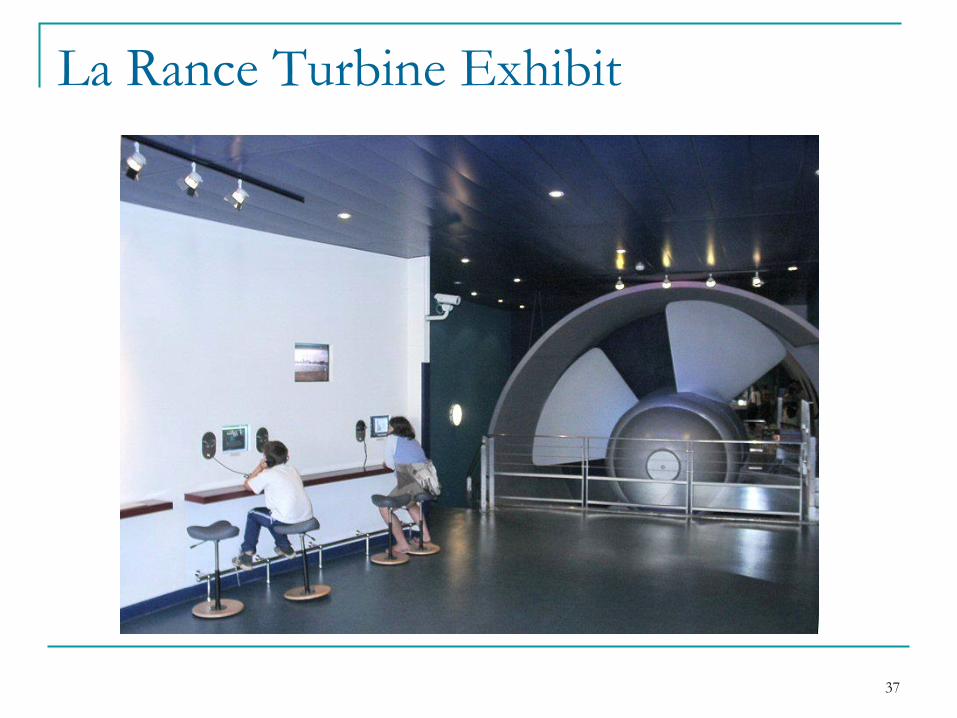
La Rance Turbine Exhibit
38
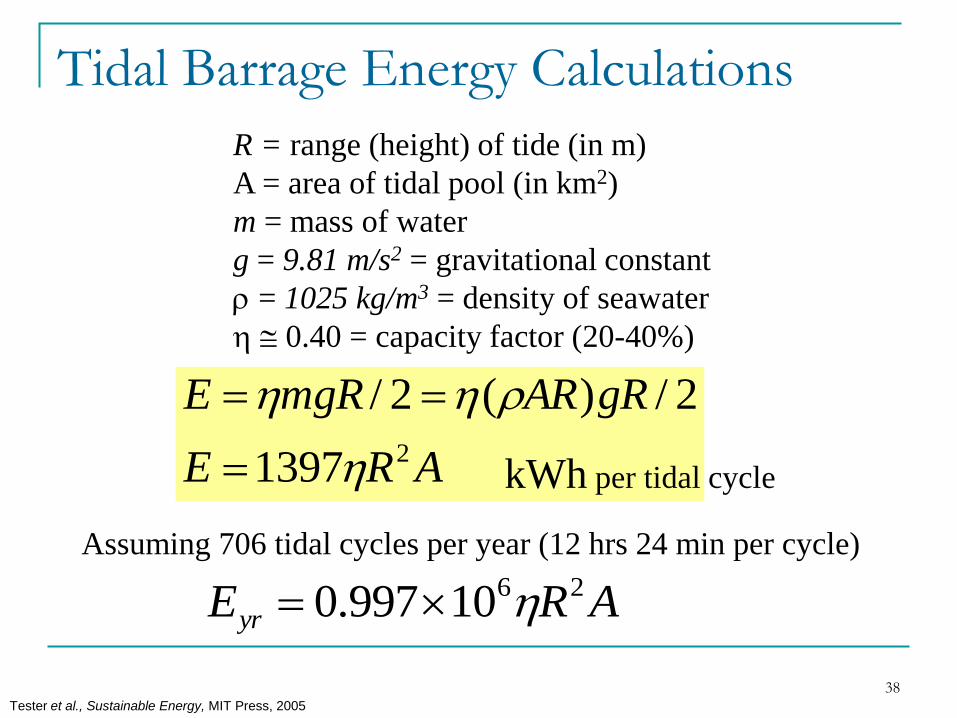
Tidal Barrage Energy Calculations
ARE
gRARmgRE
21397
2/)(2/
R = range (height) of tide (in m)
A = area of tidal pool (in km2)
m = mass of water
g = 9.81 m/s2 = gravitational constant
= 1025 kg/m3 = density of seawater
0.40 = capacity factor (20-40%)
kWh per tidal cycle
Assuming 706 tidal cycles per year (12 hrs 24 min per cycle)
AREyr
2610997.0
Tester et al., Sustainable Energy, MIT Press, 2005
39
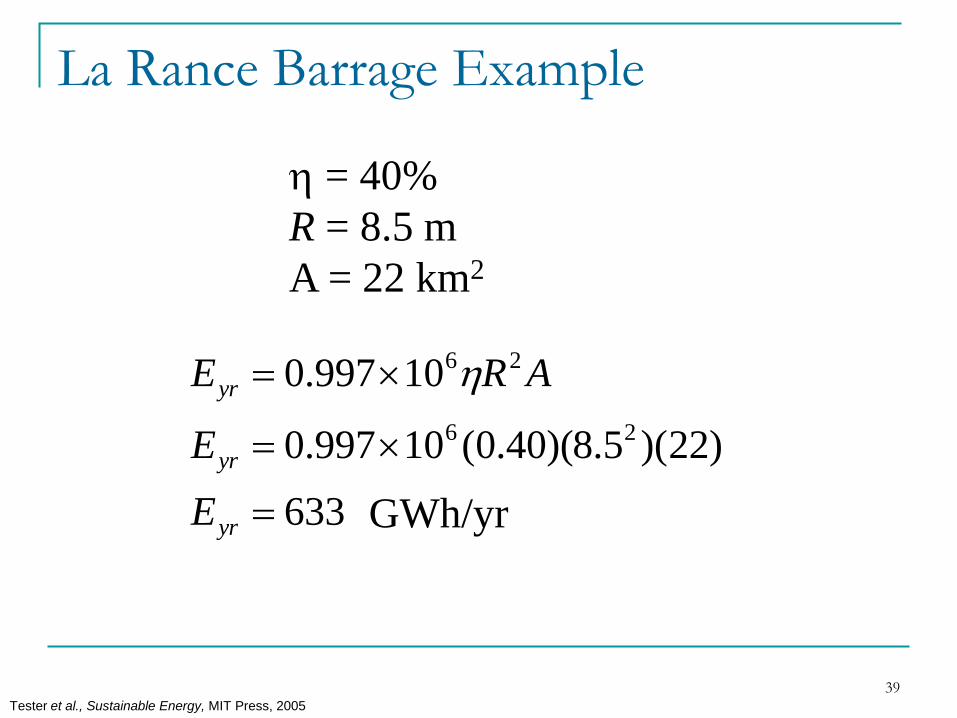
La Rance Barrage Example
= 40%
R = 8.5 m
A = 22 km2
633
)22)(5.8)(40.0(10997.0
10997.0
26
26
yr
yr
yr
E
E
ARE
GWh/yr
Tester et al., Sustainable Energy, MIT Press, 2005
40
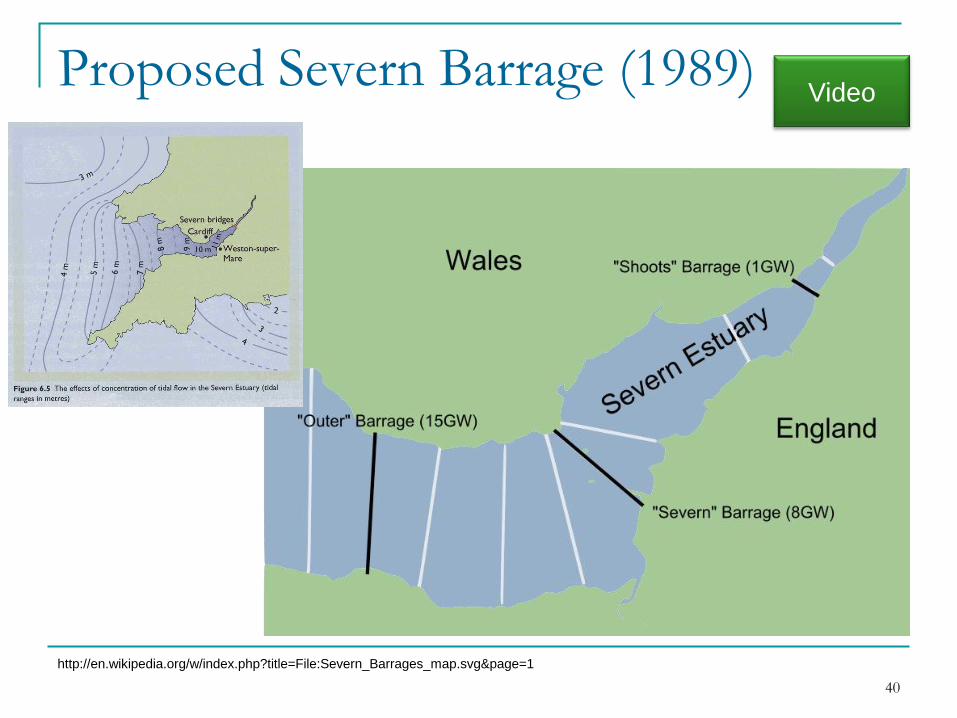
Proposed Severn Barrage (1989)
http://en.wikipedia.org/w/index.php?title=File:Severn_Barrages_map.svg&page=1
Video
41
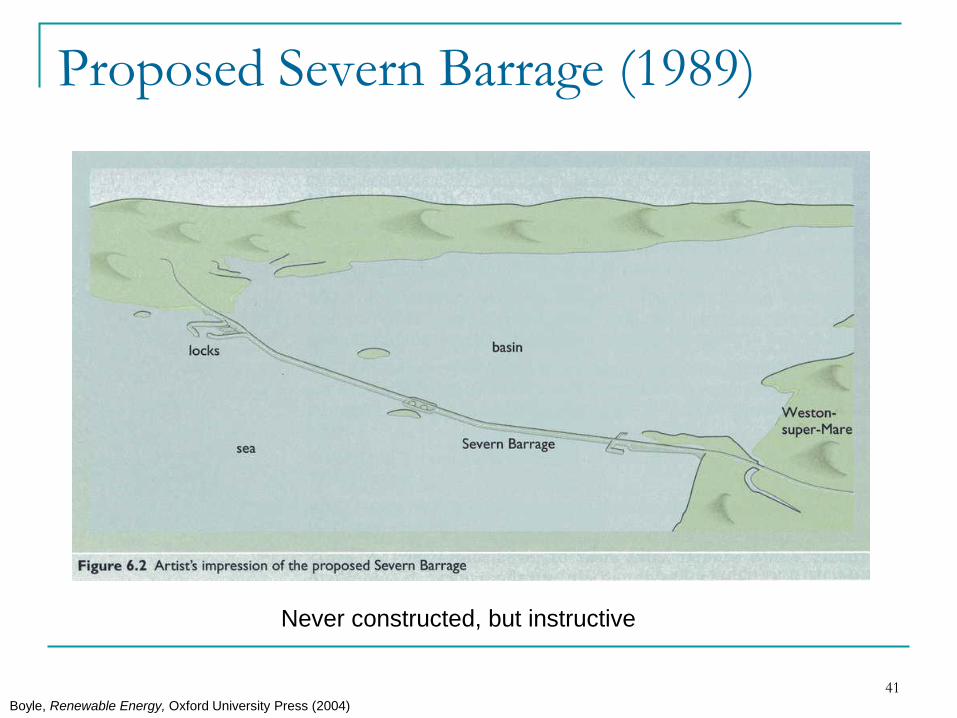
Proposed Severn Barrage (1989)
Boyle, Renewable Energy, Oxford University Press (2004)
Never constructed, but instructive
42
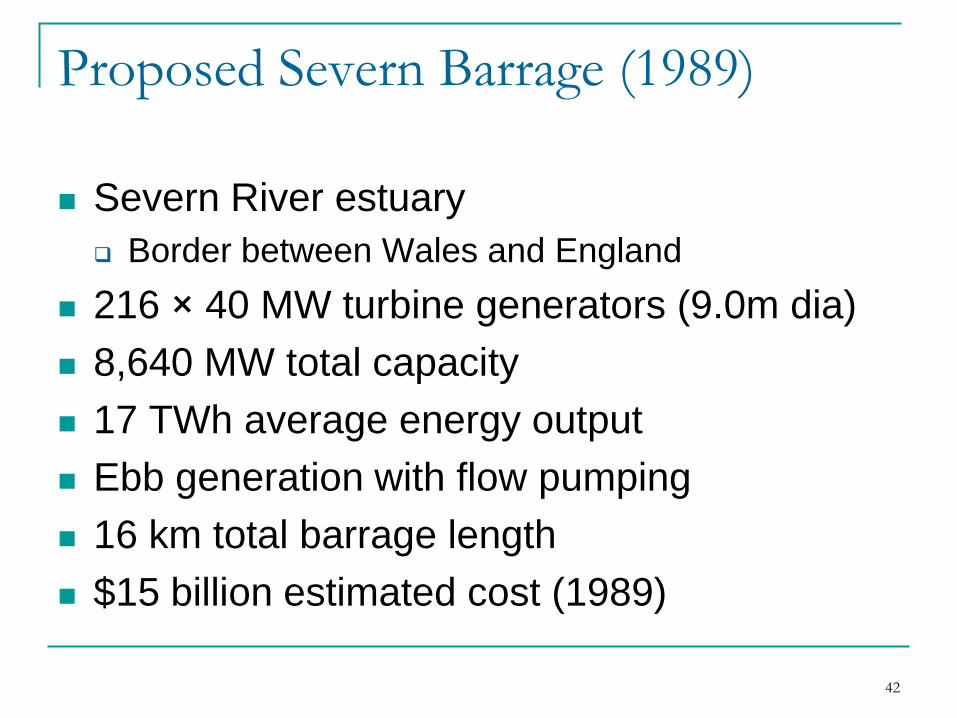
Proposed Severn Barrage (1989)
Severn River estuary
Border between Wales and England
216 × 40 MW turbine generators (9.0m dia)
8,640 MW total capacity
17 TWh average energy output
Ebb generation with flow pumping
16 km total barrage length
$15 billion estimated cost (1989)
43
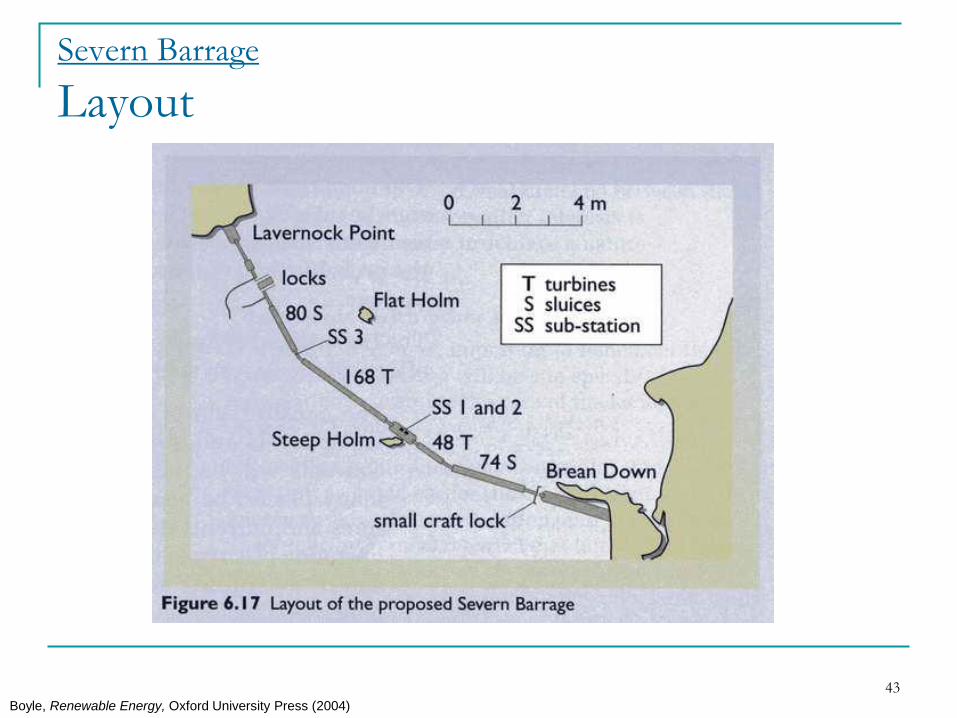
Severn Barrage
Layout
Boyle, Renewable Energy, Oxford University Press (2004)
44
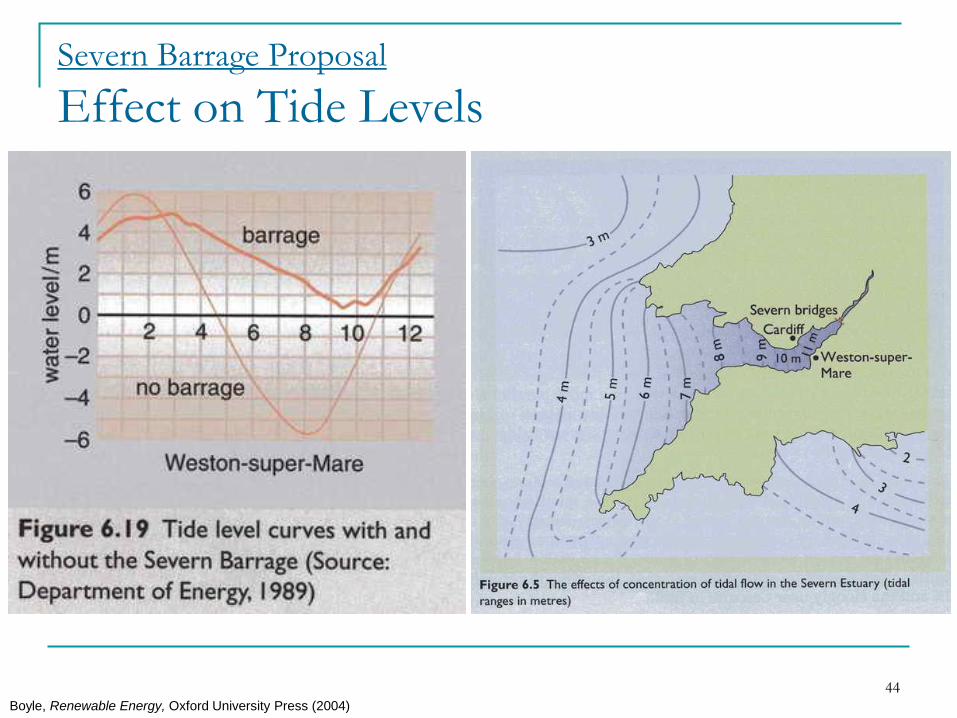
Severn Barrage Proposal
Effect on Tide Levels
Boyle, Renewable Energy, Oxford University Press (2004)
45
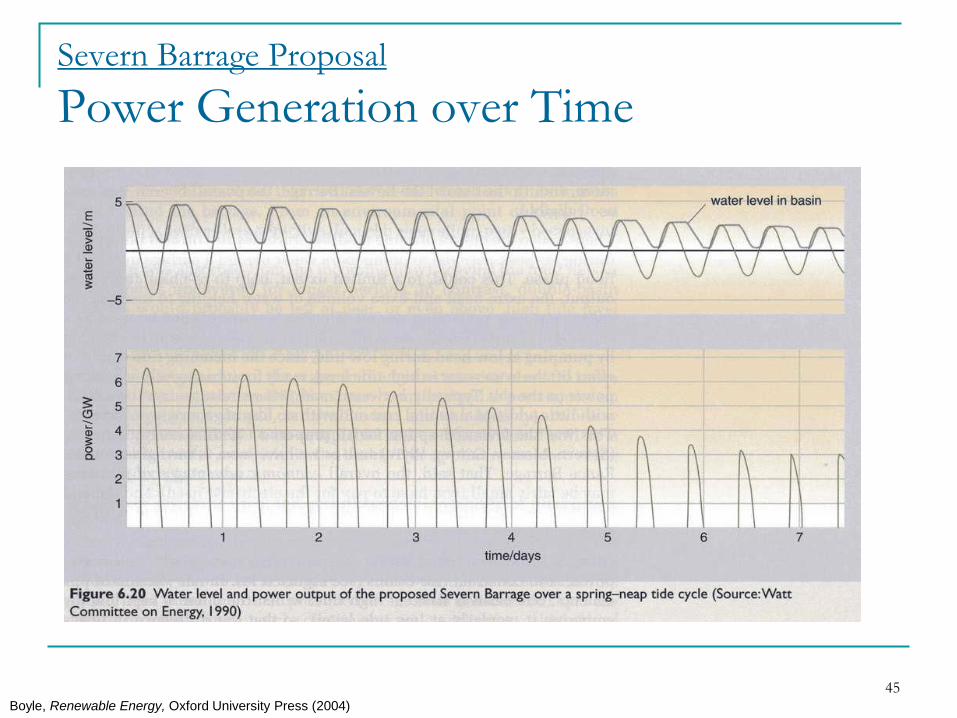
Severn Barrage Proposal
Power Generation over Time
Boyle, Renewable Energy, Oxford University Press (2004)
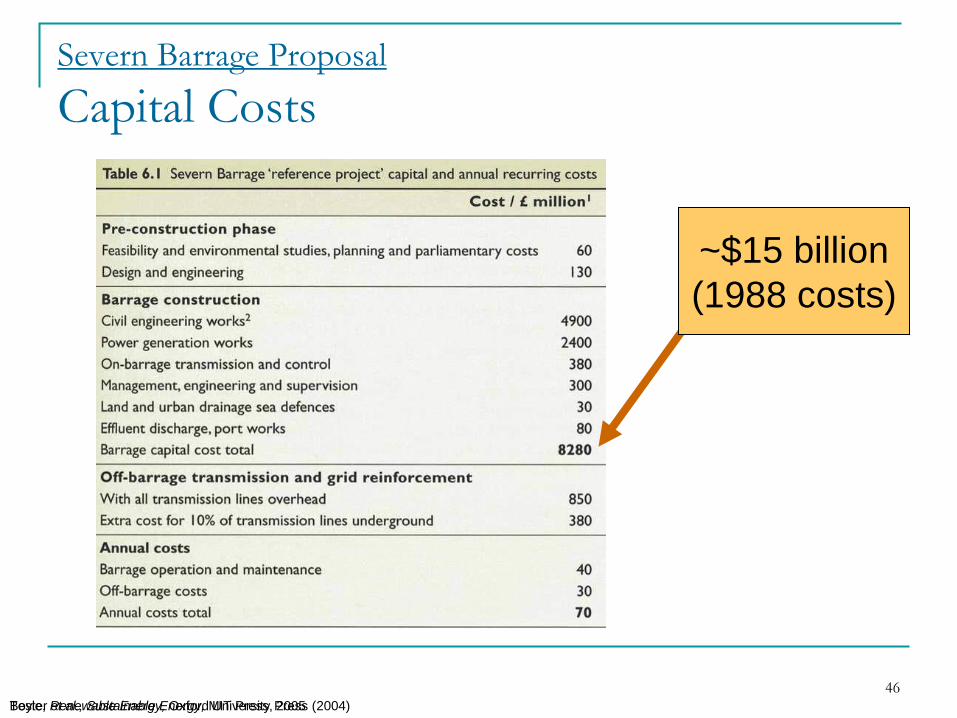
46
Severn Barrage Proposal
Capital Costs
Boyle, Renewable Energy, Oxford University Press (2004)
~$15 billion
(1988 costs)
Tester et al., Sustainable Energy, MIT Press, 2005
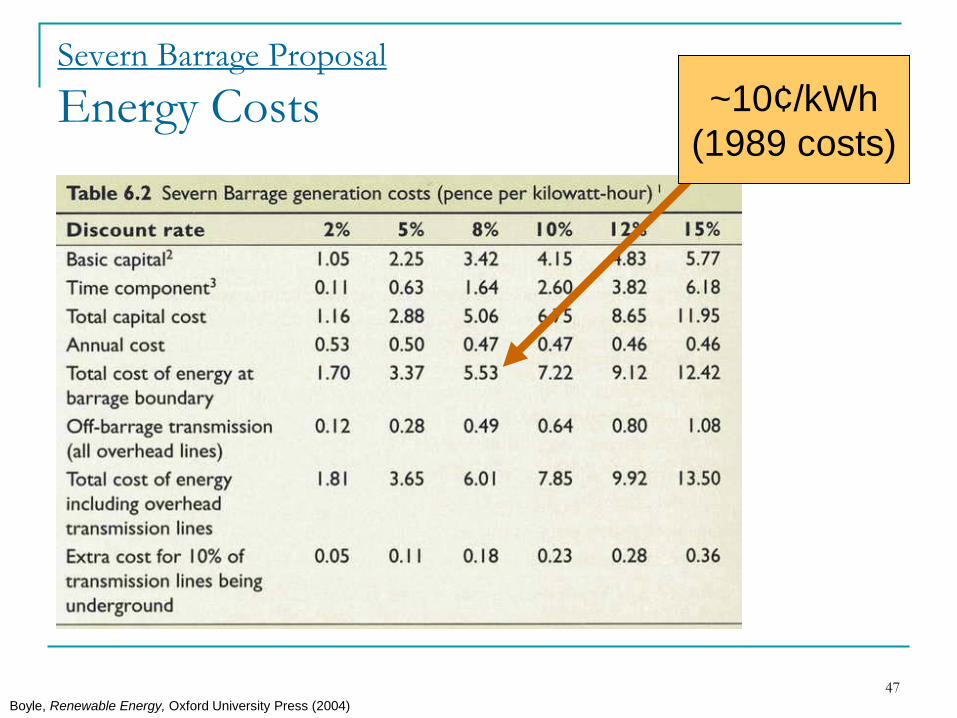
47
Severn Barrage Proposal
Energy Costs
Boyle, Renewable Energy, Oxford University Press (2004)
~10¢/kWh
(1989 costs)
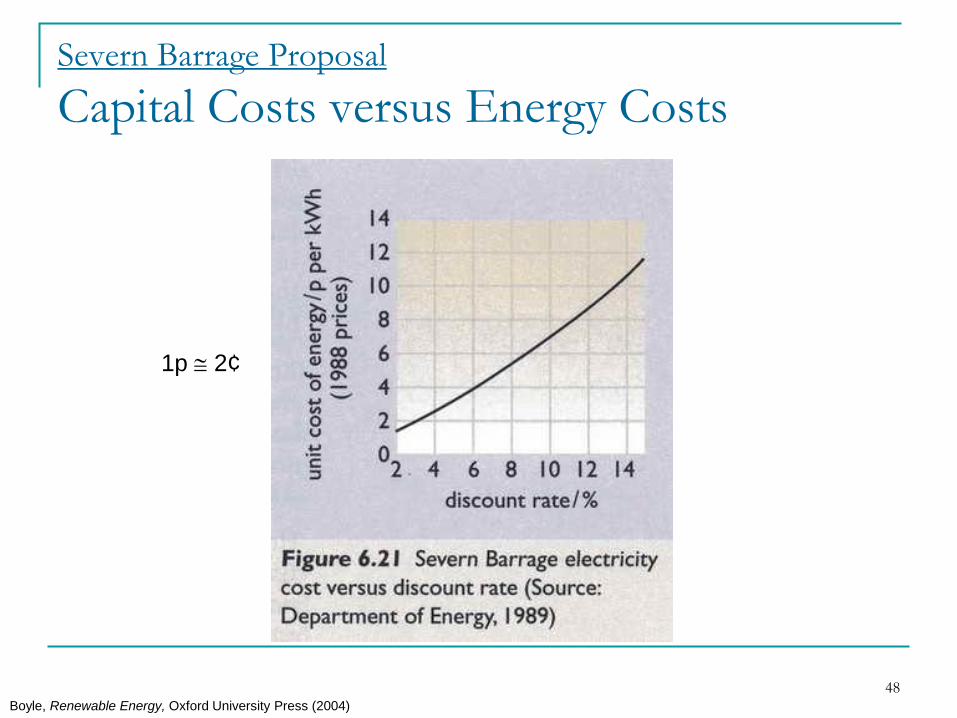
48
Severn Barrage Proposal
Capital Costs versus Energy Costs
Boyle, Renewable Energy, Oxford University Press (2004)
1p 2¢
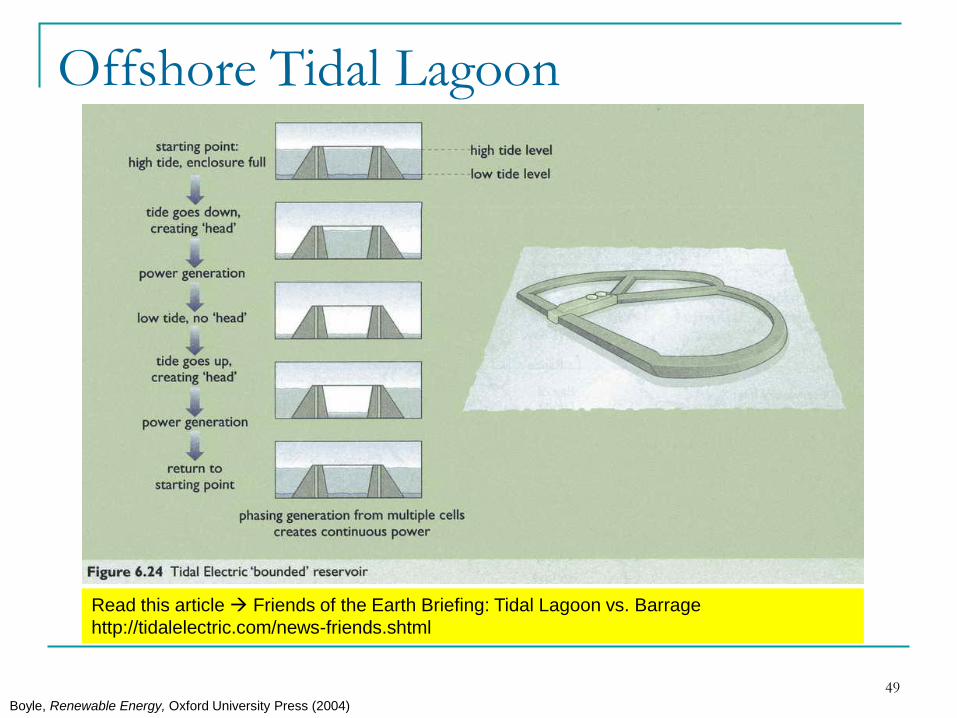
49
Offshore Tidal Lagoon
Boyle, Renewable Energy, Oxford University Press (2004)
Read this article Friends of the Earth Briefing: Tidal Lagoon vs. Barrage
http://tidalelectric.com/news-friends.shtml
50
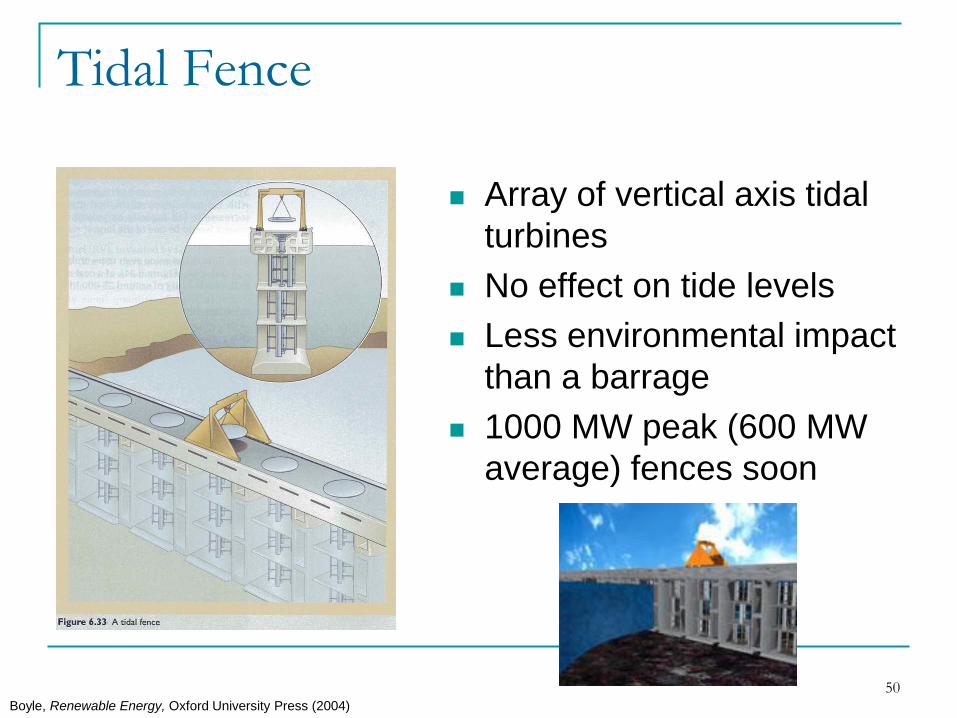
Tidal Fence
Array of vertical axis tidal
turbines
No effect on tide levels
Less environmental impact
than a barrage
1000 MW peak (600 MW
average) fences soon
Boyle, Renewable Energy, Oxford University Press (2004)
51
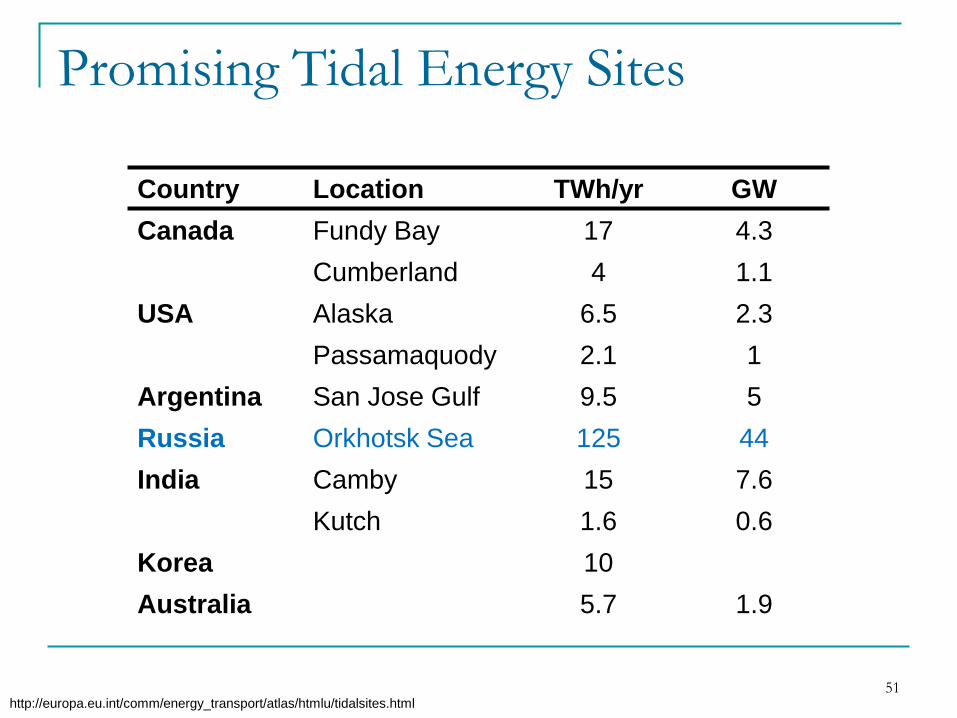
Promising Tidal Energy Sites
Country Location TWh/yr GW
Canada Fundy Bay 17 4.3
Cumberland 4 1.1
USA Alaska 6.5 2.3
Passamaquody 2.1 1
Argentina San Jose Gulf 9.5 5
Russia Orkhotsk Sea 125 44
India Camby 15 7.6
Kutch 1.6 0.6
Korea 10
Australia 5.7 1.9
http://europa.eu.int/comm/energy_transport/atlas/htmlu/tidalsites.html
52
Tidal Barrage Environmental Factors
Changes in estuary ecosystems
Less variation in tidal range
Fewer mud flats
Less turbidity – clearer water
More light, more life
Accumulation of silt
Concentration of pollution in silt
Visual clutter
53
Advantages of Tidal Barrages
High predictability
Tides predicted years in advance, unlike wind
Similar to low-head dams
Known technology
Protection against floods
Benefits for transportation (bridge)
Some environmental benefits
http://ee4.swan.ac.uk/egormeja/index.htm
54
Disadvantages of Tidal Turbines
High capital costs
Few attractive tidal power sites worldwide
Intermittent power generation
Silt accumulation behind barrage
Accumulation of pollutants in mud
Changes to estuary ecosystem
55
Wave Energy
56
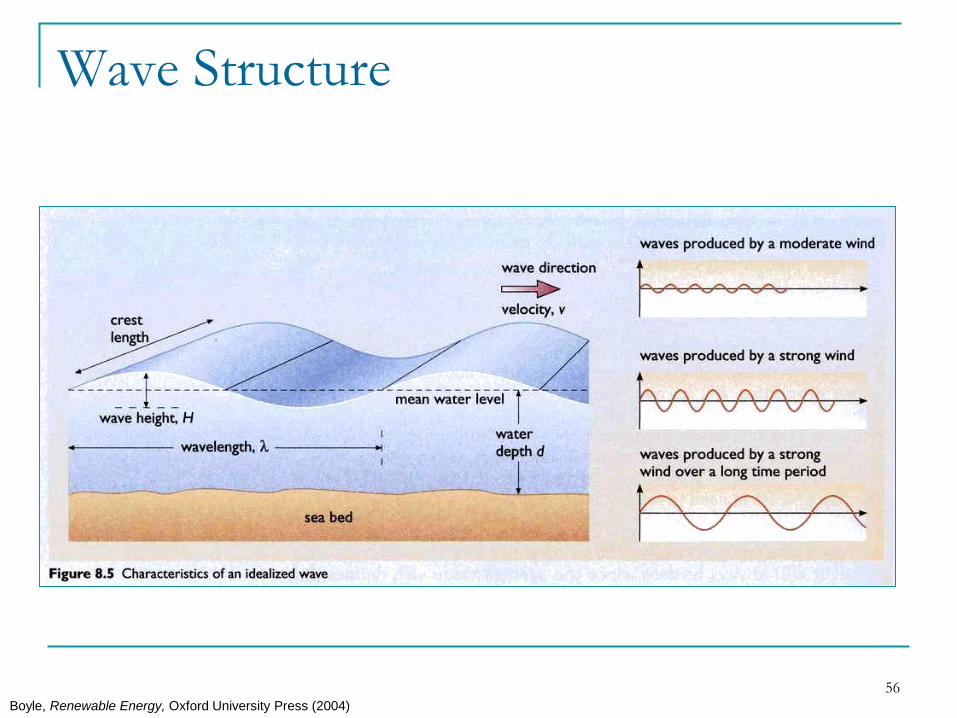
Wave Structure
Boyle, Renewable Energy, Oxford University Press (2004)
57
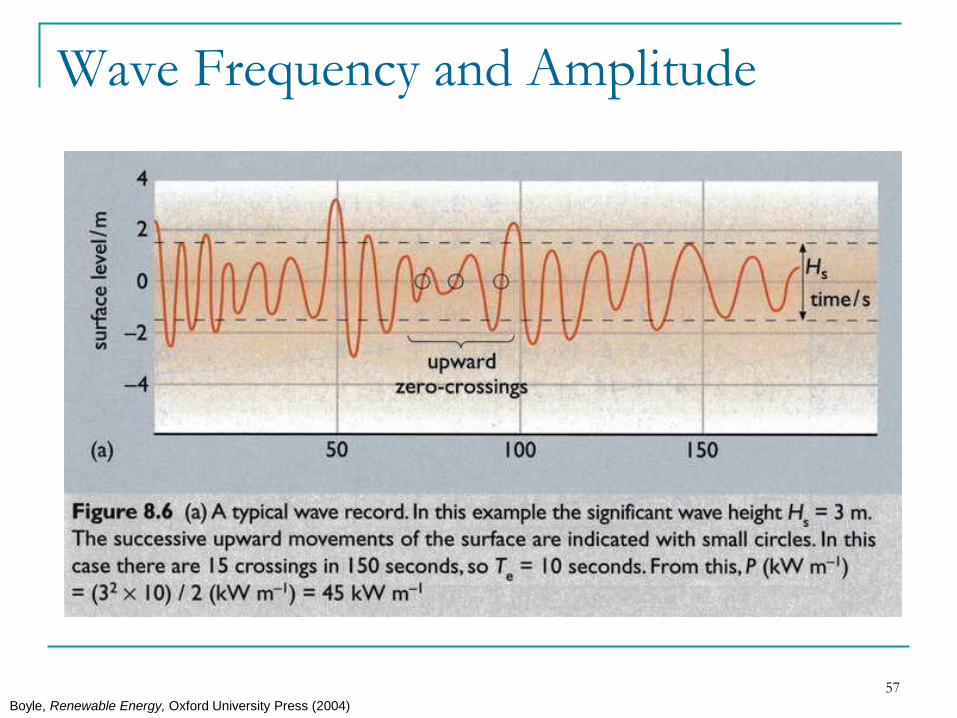
Wave Frequency and Amplitude
Boyle, Renewable Energy, Oxford University Press (2004)
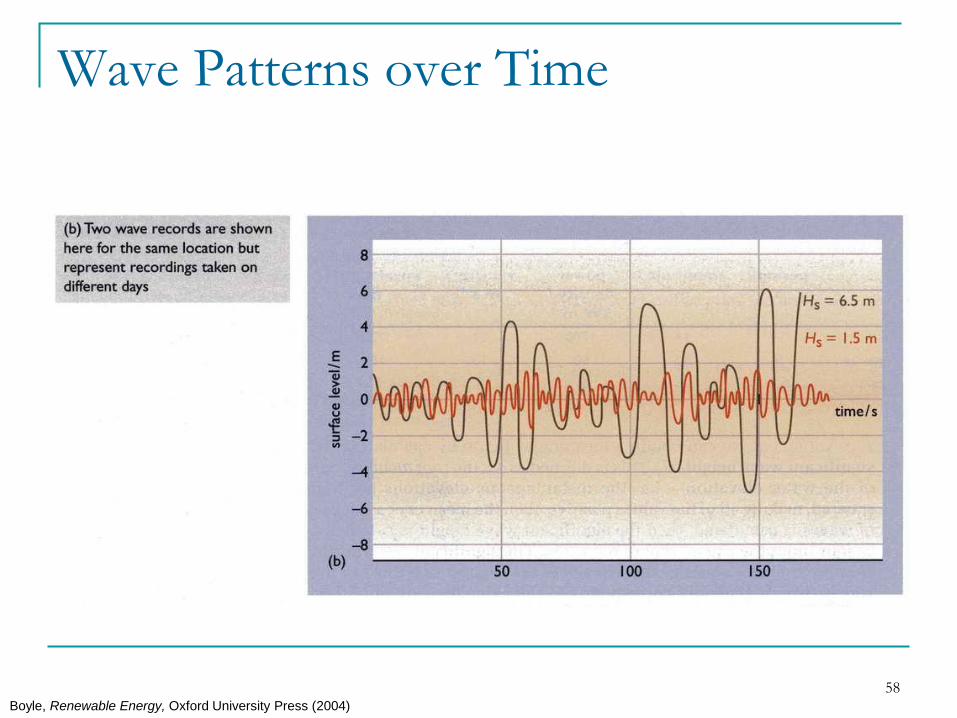
58
Wave Patterns over Time
Boyle, Renewable Energy, Oxford University Press (2004)

59
Wave Power Calculations
2
2
es THP
Hs2 = Significant wave height (m)
Te = average wave period (sec)
P = Power in kW per meter of wave crest length
Example: Hs = 3m, Te = 10sec
m
kWTHP es 45
2
103
2
22
m
kWTHP es 5.3
2
71
2
22
Gaza: Hs = 1m, Te = 7sec
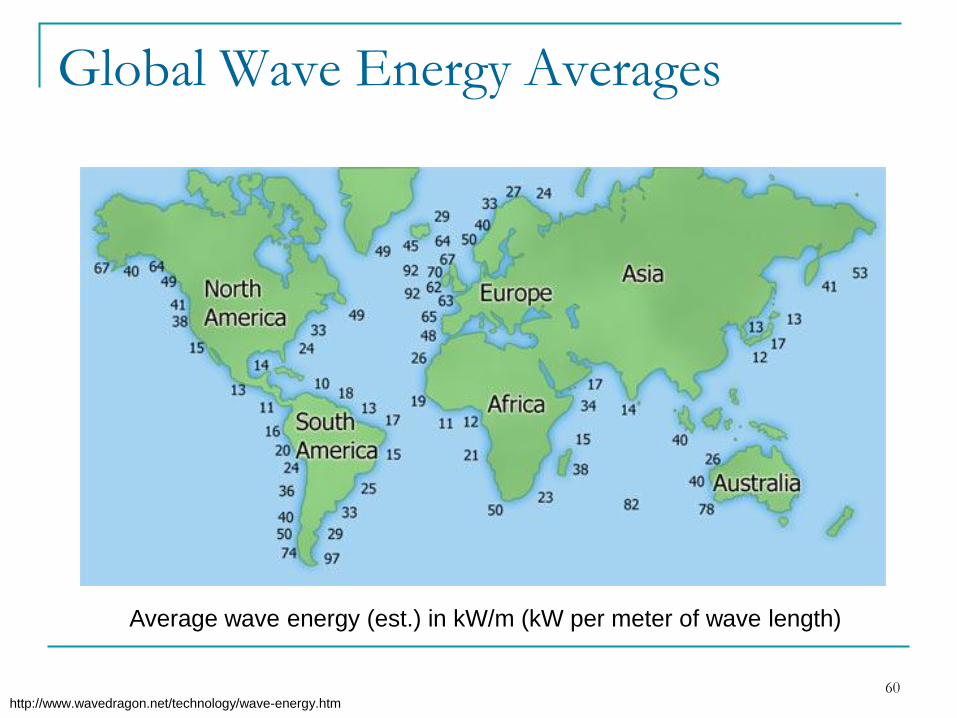
60
Global Wave Energy Averages
http://www.wavedragon.net/technology/wave-energy.htm
Average wave energy (est.) in kW/m (kW per meter of wave length)
61
Wave Energy Potential
Potential of 1,500 – 7,500 TWh/year 10 and 50% of the world’s yearly electricity demand
IEA (International Energy Agency)
200,000 MW installed wave and tidal energy power forecast by 2050 Power production of 6 TWh/y
Load factor of 0.35
DTI and Carbon Trust (UK)
“Independent of the different estimates the potential for a pollution free energy generation is enormous.”
http://www.wavedragon.net/technology/wave-energy.htm

62
Wave Energy Technologies
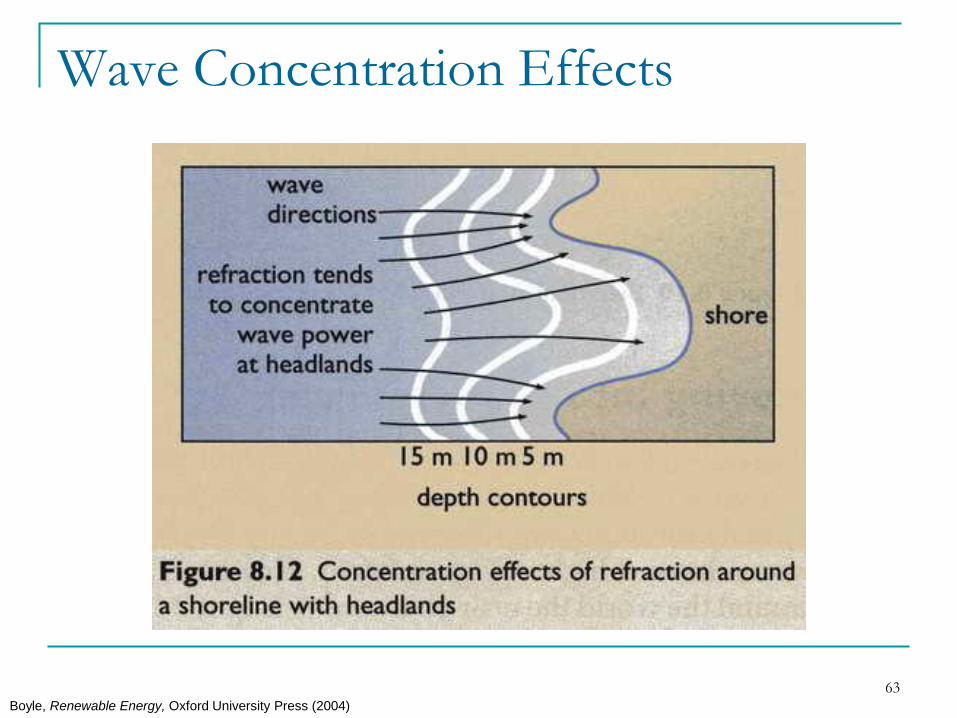
63
Wave Concentration Effects
Boyle, Renewable Energy, Oxford University Press (2004)
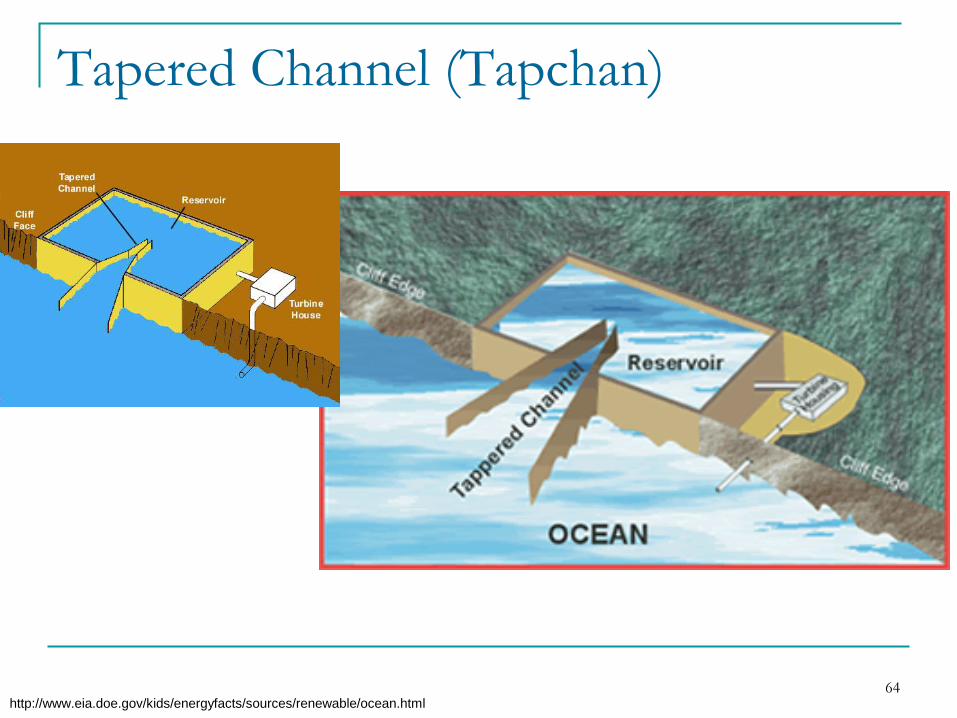
64
Tapered Channel (Tapchan)
http://www.eia.doe.gov/kids/energyfacts/sources/renewable/ocean.html
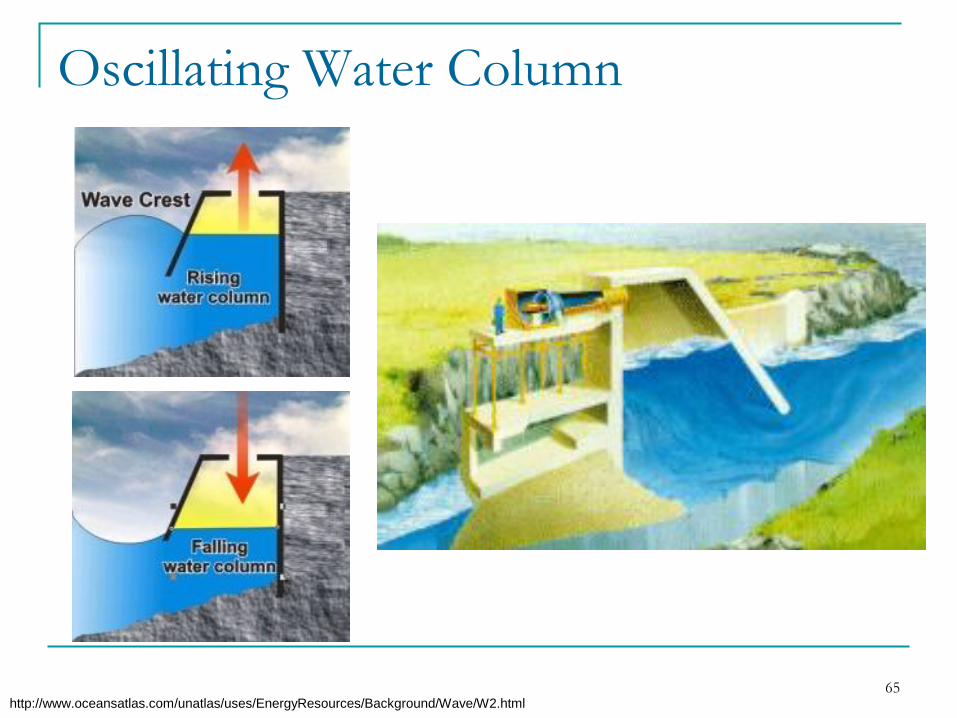
65
Oscillating Water Column
http://www.oceansatlas.com/unatlas/uses/EnergyResources/Background/Wave/W2.html
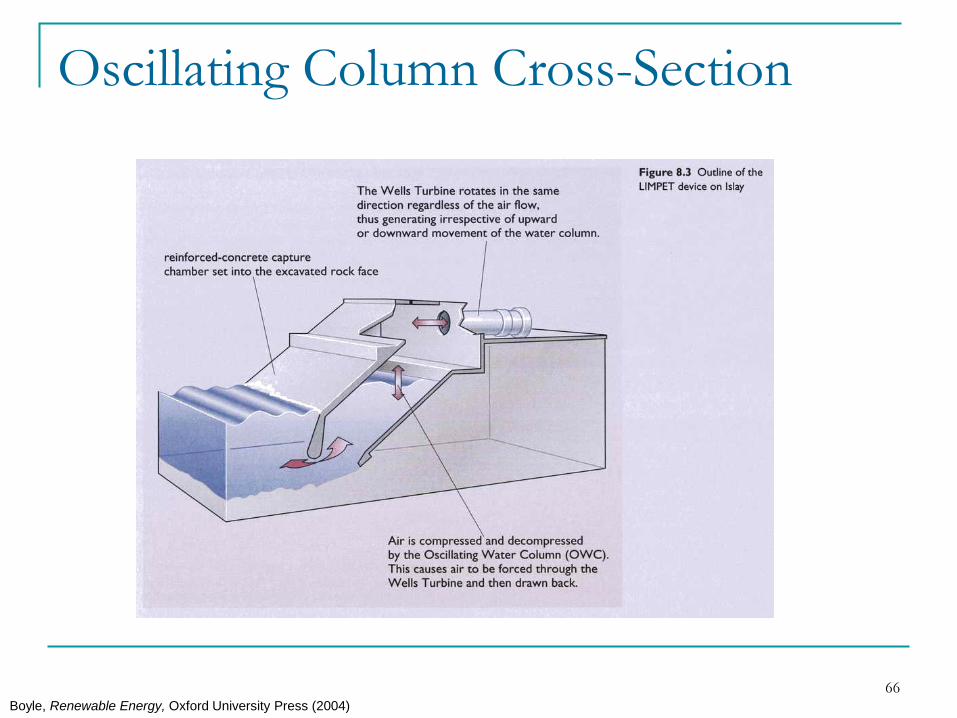
66
Oscillating Column Cross-Section
Boyle, Renewable Energy, Oxford University Press (2004)
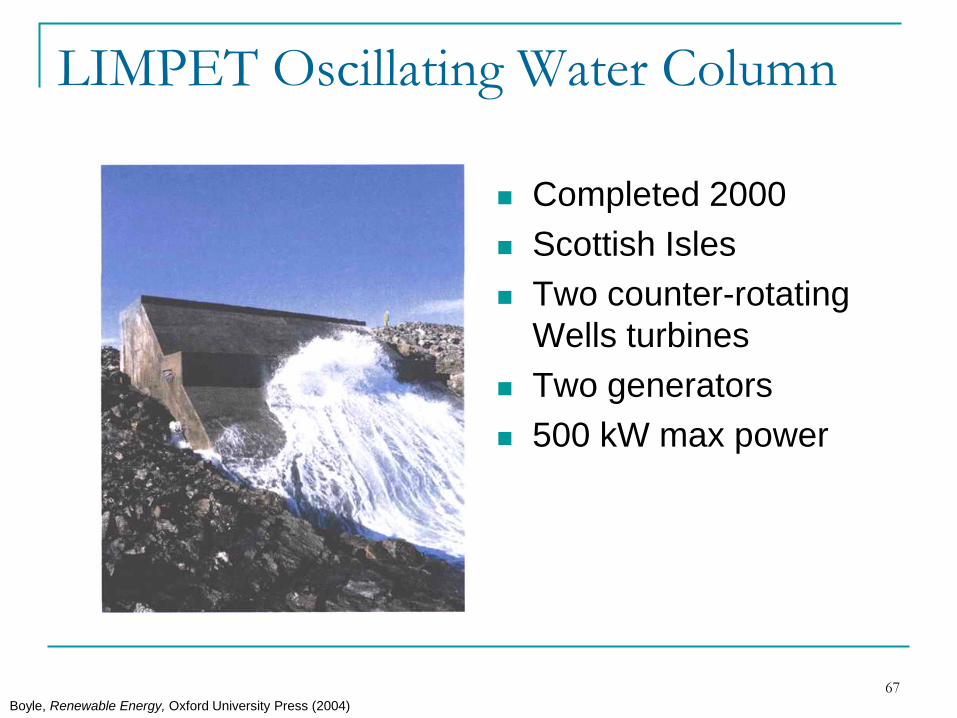
67
LIMPET Oscillating Water Column
Completed 2000
Scottish Isles
Two counter-rotating
Wells turbines
Two generators
500 kW max power
Boyle, Renewable Energy, Oxford University Press (2004)
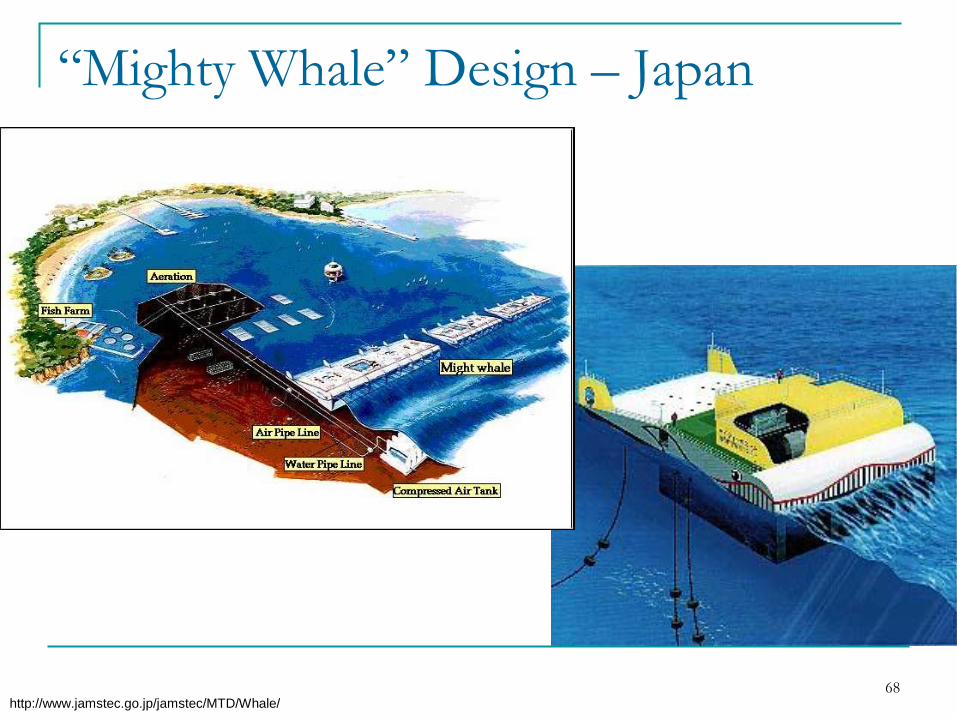
68
“Mighty Whale” Design – Japan
http://www.jamstec.go.jp/jamstec/MTD/Whale/
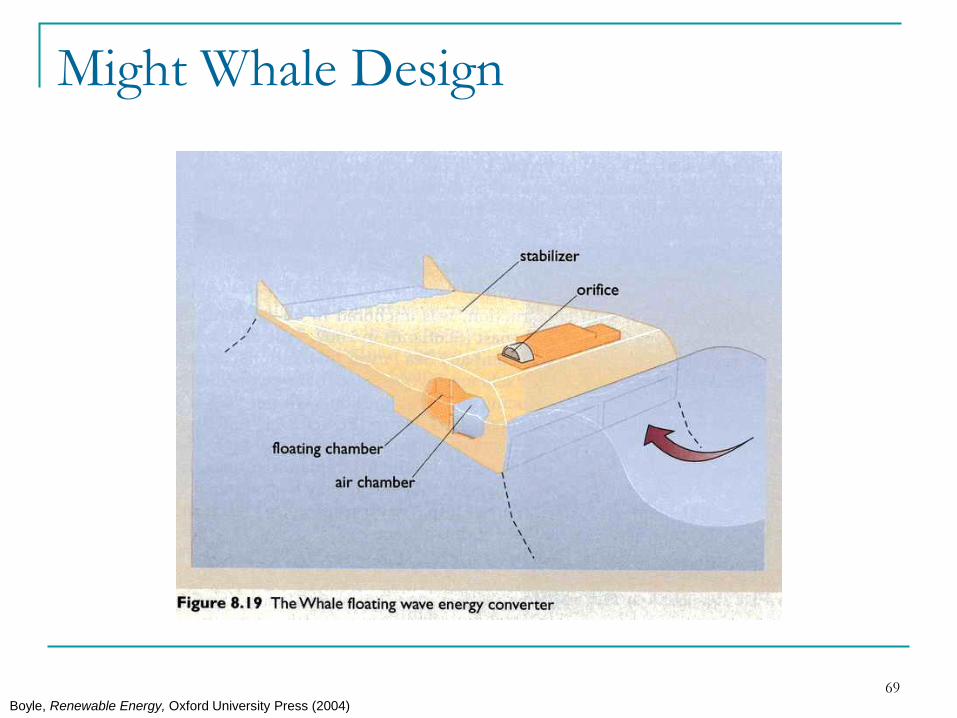
69
Might Whale Design
Boyle, Renewable Energy, Oxford University Press (2004)
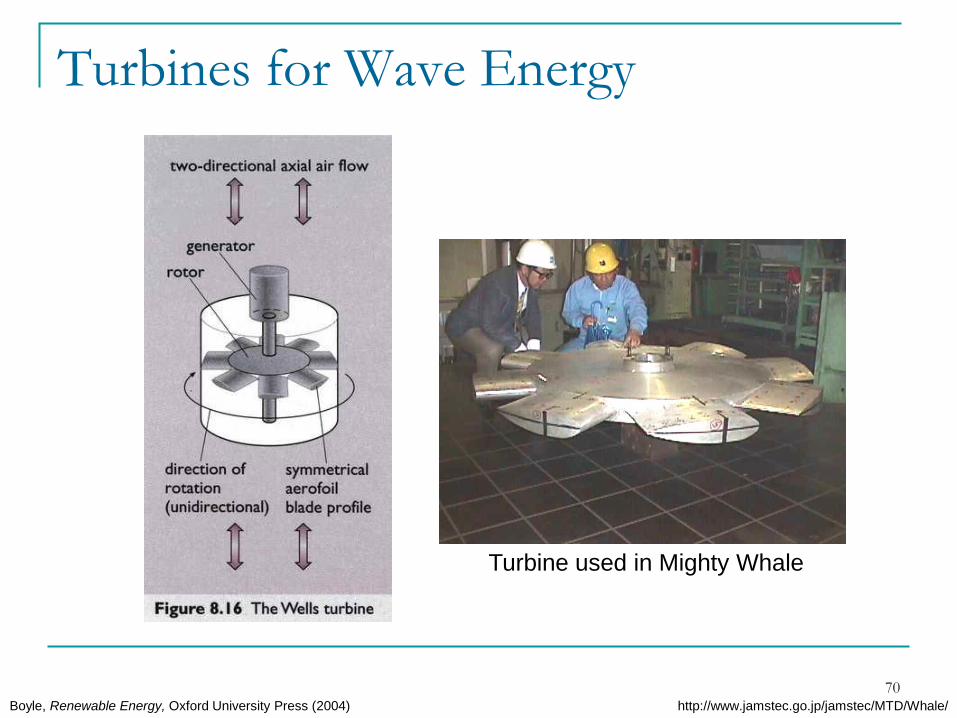
70
Turbines for Wave Energy
Boyle, Renewable Energy, Oxford University Press (2004) http://www.jamstec.go.jp/jamstec/MTD/Whale/
Turbine used in Mighty Whale
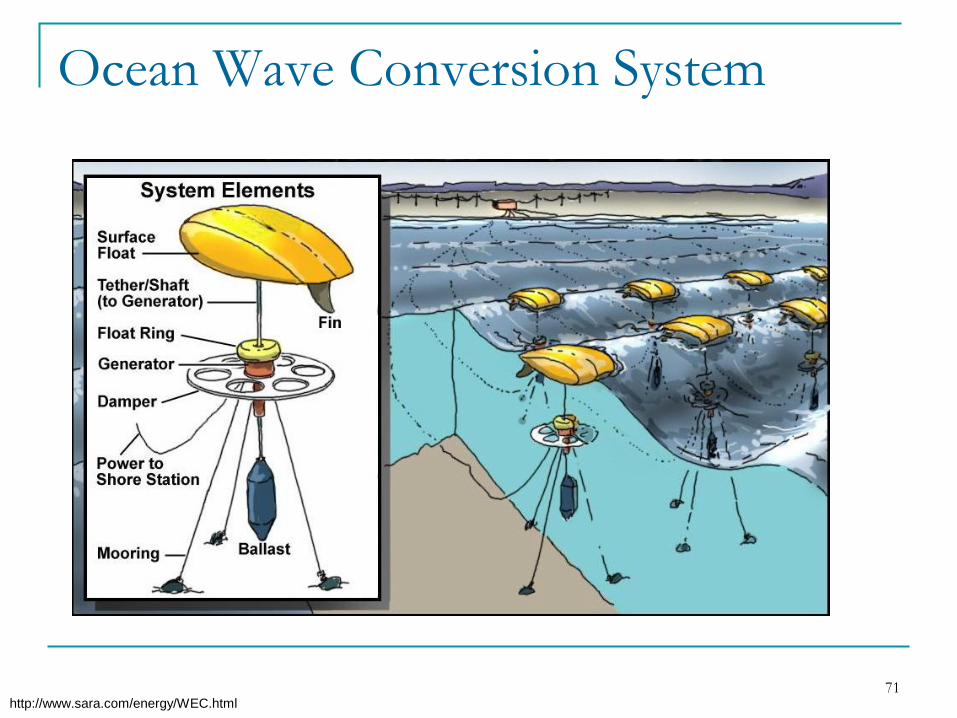
71
Ocean Wave Conversion System
http://www.sara.com/energy/WEC.html
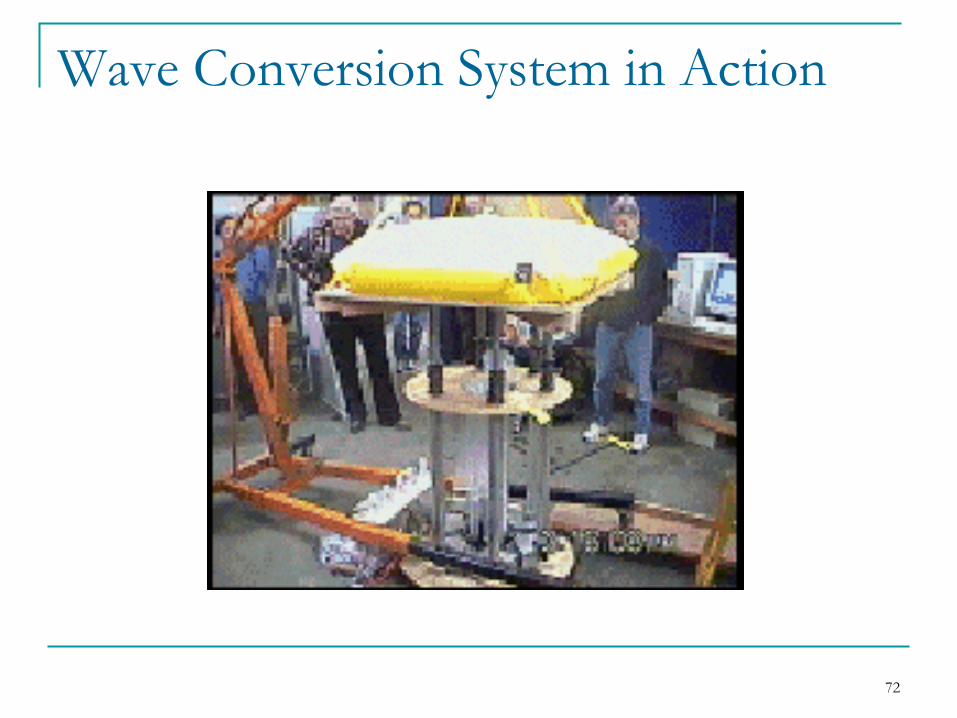
72
Wave Conversion System in Action
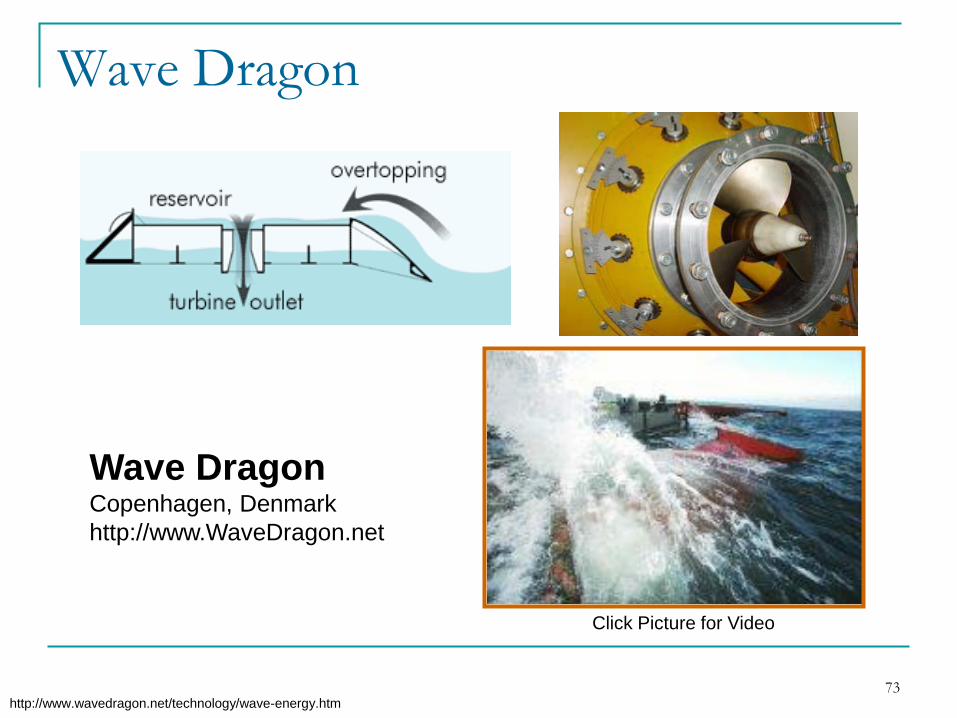
73
Wave Dragon
http://www.wavedragon.net/technology/wave-energy.htm
Wave DragonCopenhagen, Denmark
http://www.WaveDragon.net
Click Picture for Video
74
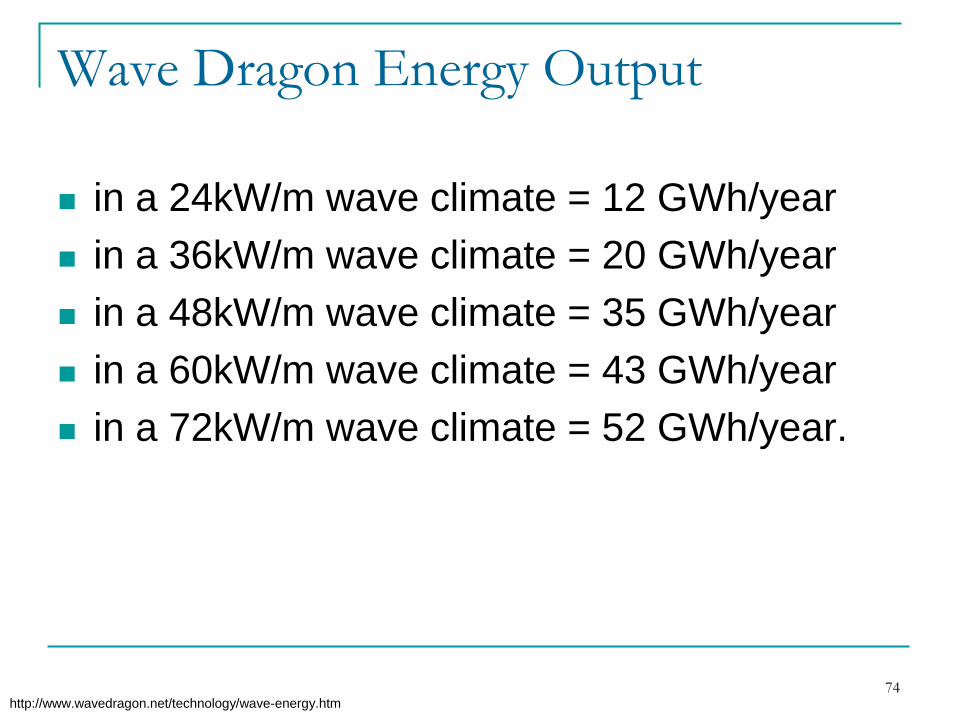
Wave Dragon Energy Output
in a 24kW/m wave climate = 12 GWh/year
in a 36kW/m wave climate = 20 GWh/year
in a 48kW/m wave climate = 35 GWh/year
in a 60kW/m wave climate = 43 GWh/year
in a 72kW/m wave climate = 52 GWh/year.
http://www.wavedragon.net/technology/wave-energy.htm
75
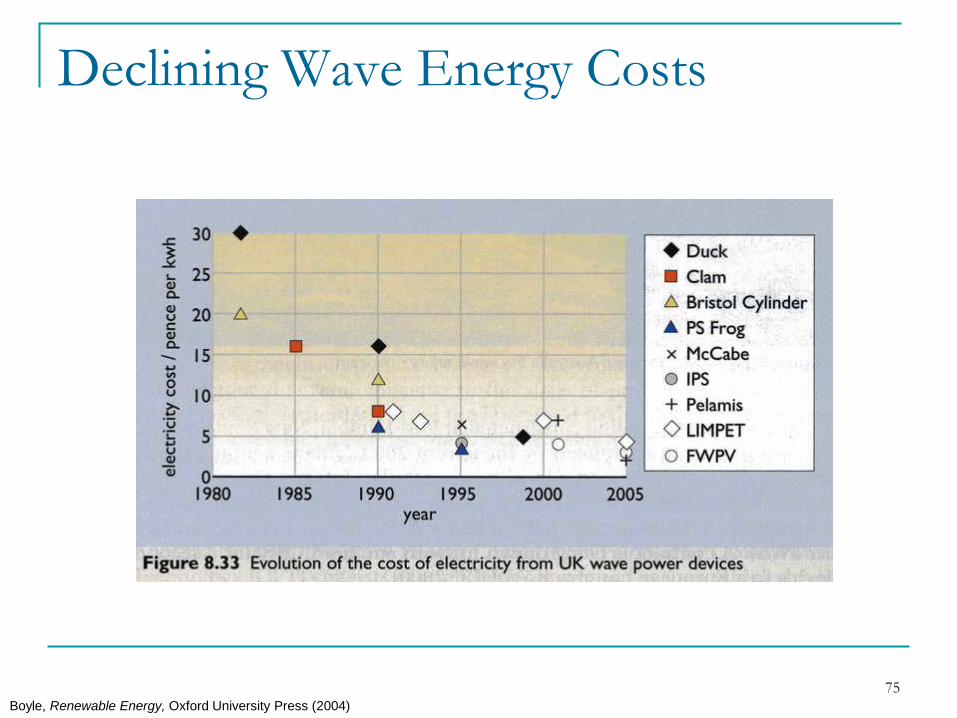
Declining Wave Energy Costs
Boyle, Renewable Energy, Oxford University Press (2004)
76
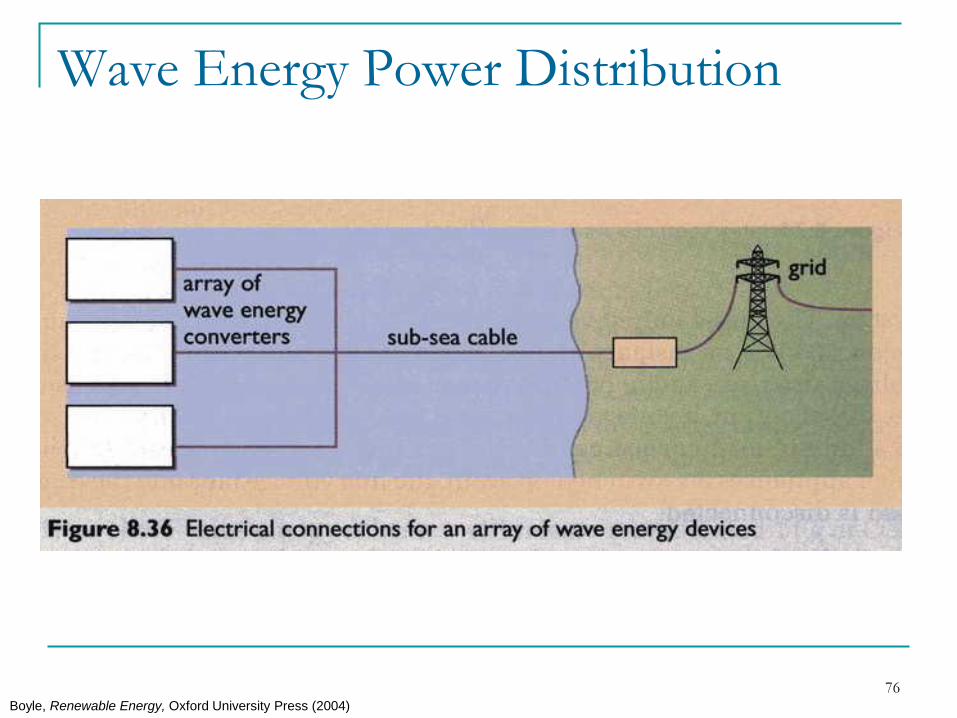
Wave Energy Power Distribution
Boyle, Renewable Energy, Oxford University Press (2004)
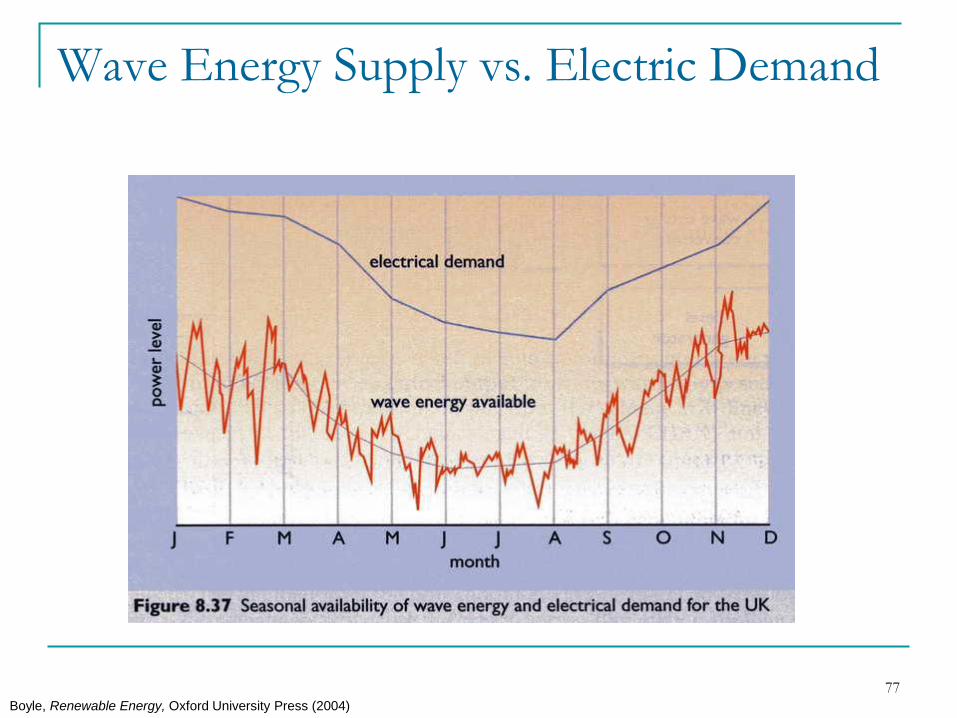
77
Wave Energy Supply vs. Electric Demand
Boyle, Renewable Energy, Oxford University Press (2004)
78
Wave Energy
Environmental Impacts
79
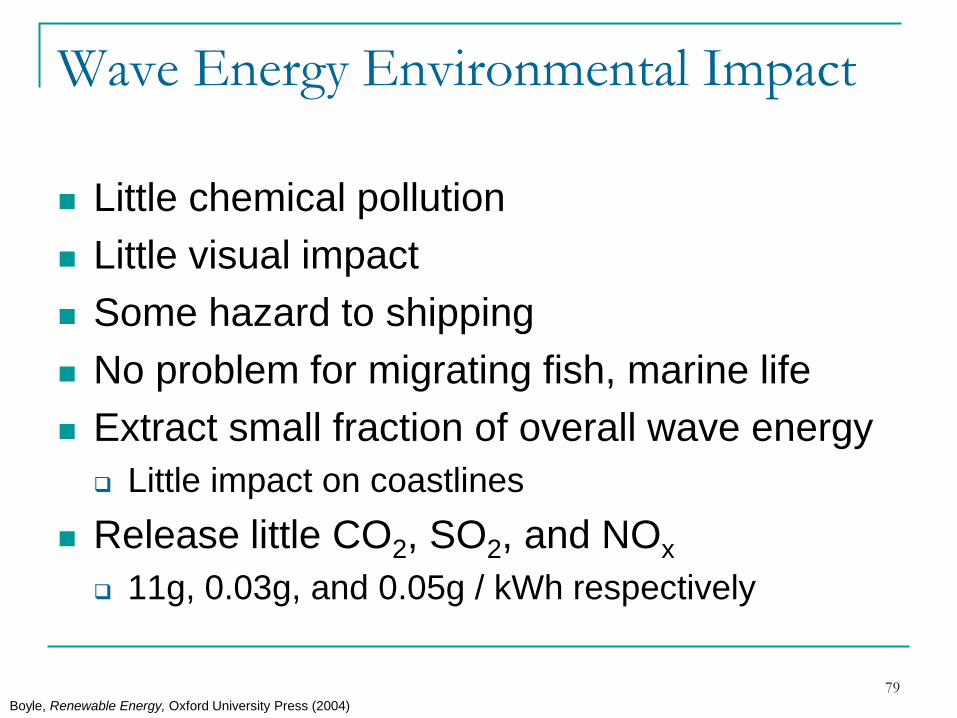
Wave Energy Environmental Impact
Little chemical pollution
Little visual impact
Some hazard to shipping
No problem for migrating fish, marine life
Extract small fraction of overall wave energy
Little impact on coastlines
Release little CO2, SO2, and NOx
11g, 0.03g, and 0.05g / kWh respectively
Boyle, Renewable Energy, Oxford University Press (2004)
80
Wave Energy
Summary
81
Wave Power Advantages
Onshore wave energy systems can be incorporated
into harbor walls and coastal protection
Reduce/share system costs
Providing dual use
Create calm sea space behind wave energy
systems
Development of mariculture
Other commercial and recreational uses;
Long-term operational life time of plant
Non-polluting and inexhaustible supply of energy
http://www.oceansatlas.com/unatlas/uses/EnergyResources/Background/Wave/W2.html
82
Wave Power Disadvantages
High capital costs for initial construction
High maintenance costs
Wave energy is an intermittent resource
Requires favorable wave climate.
Investment of power transmission cables to shore
Degradation of scenic ocean front views
Interference with other uses of coastal and offshore areas navigation, fishing, and recreation if not properly sited
Reduced wave heights may affect beach processes in the littoral zone
http://www.oceansatlas.com/unatlas/uses/EnergyResources/Background/Wave/W2.html
83
Wave Energy Summary
Potential as significant power supply (1 TW)
Intermittence problems mitigated by
integration with general energy supply
system
Many different alternative designs
Complimentary to other renewable and
conventional energy technologies
http://www.oceansatlas.com/unatlas/uses/EnergyResources/Background/Wave/W2.html

84
Future Promise
85
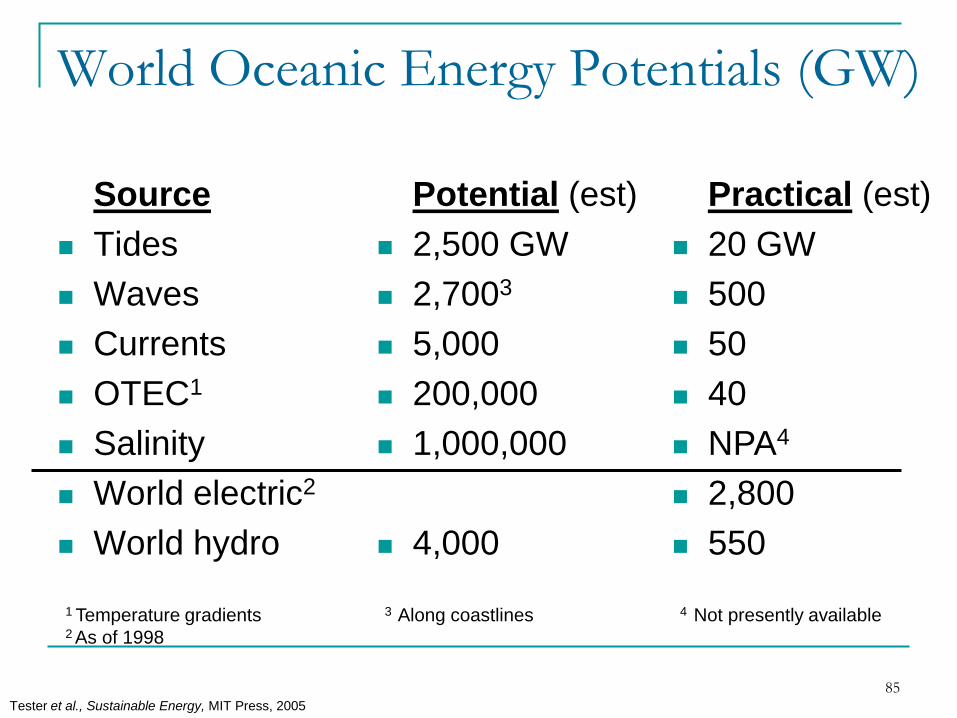
World Oceanic Energy Potentials (GW)
Source
Tides
Waves
Currents
OTEC1
Salinity
World electric2
World hydro
Potential (est)
2,500 GW
2,7003
5,000
200,000
1,000,000
4,000
Practical (est)
20 GW
500
50
40
NPA4
2,800
550
1 Temperature gradients2 As of 1998
3 Along coastlines 4 Not presently available
Tester et al., Sustainable Energy, MIT Press, 2005
86
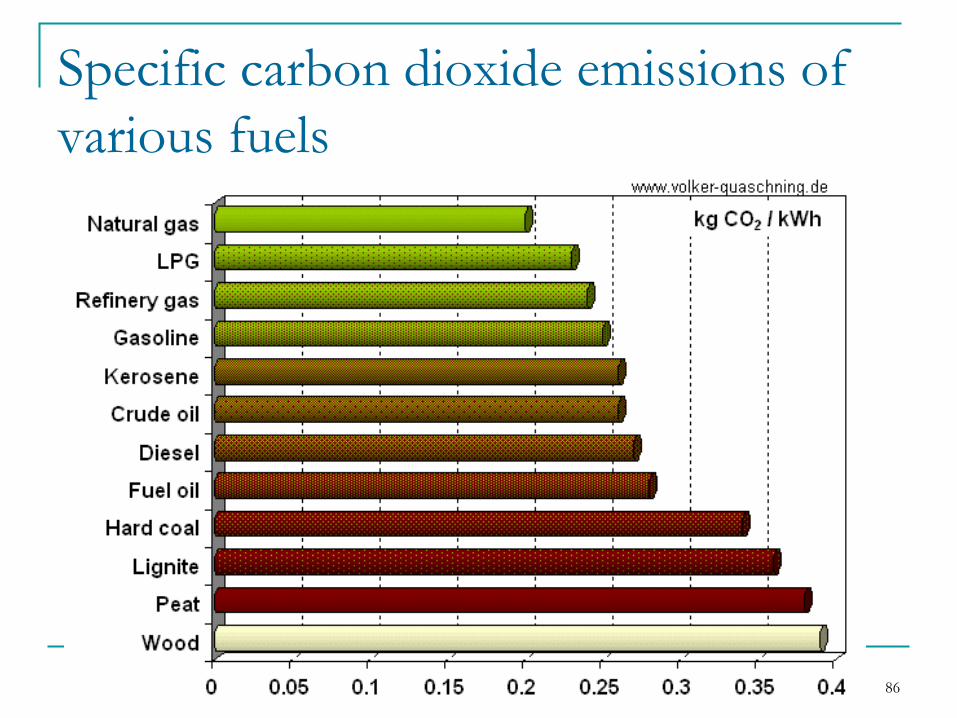
Specific carbon dioxide emissions of
various fuels

87
Solar Power – Next Week
http://www.c-a-b.org.uk/projects/tech1.jpg