Embed Size (px)
Citation preview

OCEAN REEF MARINA
GROUNDWATER MODELLING TOASSESS NUTRIENT LOADS IN
GROUNDWATER DISCHARGING TOTHE OCEAN AND MARINA
FEBRUARY 2015
REPORT FORM P ROGERS & ASSOCIATES
288-3/15/01

Rockwater Pty Ltd 288.3/15/01
TABLE OF CONTENTSPAGE
1 BACKGROUND 1
2 HYDROGEOLOGICAL SETTING 1
2.1 Groundwater Quality 2
3 NUMERICAL GROUNDWATER MODEL 3
3.1 Description 3
3.2 Model Parameters and Boundary Conditions 4
3.3 Model Calibration 5
3.4 Sensitivity Analysis 6
3.5 Modelling Results 7
3.6 Impact of Additional Climate Change 83.6.1 Impact of Reduced Rainfalls 83.6.2 Impact of Higher Ocean Levels 9
5 CONCLUSIONS 9
REFERENCES 10
Tables
Table 1: Nitrogen and Phosphorus Concentrations, from WIR Database 2
Table 2: Nitrogen and Phosphorus Concentrations Measured in 2014 3
Table 3: Aquifer Parameters Adopted In Model (Superficial Formations) 4
Table 4: Results of Sensitivity Analysis 6
Table 5: Calculated Groundwater Flows 7
Table 6: Calculated Nutrient Loads 7
Figures
1. TN Concentrations (mg/L) WIR Database
2. TP Concentrations (mg/L) WIR Database
3. Average TN Concentrations (mg/L) 2014 (Strategen)
4. Average TP Concentrations (mg/L) 2014 (Strategen)
5. Extent of Model Grid (Layer 1)
6. Recharge Factor, for Annual Rainfall
7. Water Levels Sept-Oct 2014 (Posts, m AHD) and Model-Calculated (Contours)
8. Measured and Model-Calculated Hydrographs, Bores JP20C, GD2 & WM18

Rockwater Pty Ltd 288.3/15/01
CONTENTS (Figures, Continued)
9. Measured and Model-Calculated Hydrographs, Bores MS7, QU21/89 & JP26
10. Measured and Model-Calculated Hydrographs, Bores WF5, WF8 & WM42
11. Modelled versus Calculated Groundwater Levels, All Bores

MP Rogers & AssociatesGroundwater Modelling to Assess Nutrient Loads to Planned Marina Page 1
Rockwater Pty Ltd 288.3/15/01
1 BACKGROUND
M P Rogers and Associates is carrying out oceanographic modelling for the planned marina
at Ocean Reef (Fig. 1). Rockwater was engaged by M P Rogers and Associates as a sub-
consultant to provide calculated values of groundwater flows and nutrient loads, particularly
in summer. These are required as an input to the oceanographic modelling.
Rockwater (2011) presented the results of flow and solute transport modelling, using
nitrogen concentrations in the groundwater that were recorded in the Department of Water
WIN database as source concentrations. It was noted that the nitrogen source concentrations
were based on a few measurements in nearby bores that were made more than 20 years
earlier, and that bores near the planned marina should be re-sampled if the nutrient loads
were of concern. Sampling by Strategen (2015) indicated there were now higher nitrogen
concentrations in groundwater in the area. Rockwater was requested to update the 2011
report and to:
Recalibrate/validate the groundwater model;
Incorporate the report on the impacts of climate change that was produced by
Rockwater in 2013; and
Use contemporary monitoring data to characterise the hydrogeology and groundwater
flows into the planned marina as required by the EPA Scoping Document.
This report is an update of the 2011 report; it presents details of the groundwater modelling
including groundwater flows and nutrient loads, and includes the additional information
required as described above.
2 HYDROGEOLOGICAL SETTING
The planned Ocean Reef Marina is in an area of predominantly limestone and sand of the
Tamala Limestone, with minor recent eolian sand of the Quindalup Dune System (Safety
Bay Sand). The Safety Bay Sand consists of fine to medium grained quartz sand and shell
fragments; it overlies calcareous sand and limestone of the Tamala Limestone. The Safety
Bay Sand is generally unsaturated, and so the Tamala Limestone forms the Superficial
aquifer inland of the marina site; with sand of the Tamala Limestone and Gnangara Sand to
the east from Lake Joondalup.
The Tamala Limestone extends down to about -35 m AHD at the coast, and unconformably
overlies the Osborne Formation or the Pinjar Member of the Leederville Formation, both of
Cretaceous age.

MP Rogers & AssociatesGroundwater Modelling to Assess Nutrient Loads to Planned Marina Page 2
Rockwater Pty Ltd 288.3/15/01
The Tamala Limestone is karstic in nature, and has high permeability. Its groundwater is
recharged by rainfall infiltration, and flows westwards with a water-table elevation
decreasing from about 45 m AHD at Lake Mariginiup to sea-level at the coast. Groundwater
flow in the Tamala Limestone is largely controlled by the location, and degree of
interconnection, of solution channels within the limestone (Davidson, 1995). A study by
Barber et al (1990) in an area near Ocean Reef indicated groundwater flow velocities of
between 85 and 335 m/year.
Groundwater discharges to the ocean and by evaporation and transpiration from the lakes. It
is extracted by bores for irrigation of parks, sporting grounds, public open space, and market
gardens; and for public water supply (Whitfords and Quinns Rocks borefields).
The description of the hydrogeology in this section of the report forms the conceptual model
on which the numerical groundwater model is based.
2.1 GROUNDWATER QUALITY
Groundwater salinity in the Tamala Limestone is about 500 mg/L TDS, increasing to around
1,000 mg/L TDS near the coast.
Background nutrient concentrations in the area were indicated in Davidson (1995, Plates 60
and 61) to be low: nitrate concentrations about 1 to 2 mg/L (as nitrate), and phosphorus
concentrations around 0.03 mg/L. There are few nutrient data in the Department of Water
(DoW) WIN (now WIR) database and those data are old (collected between 1971 and 1992)
– the Total Nitrogen (TN) and Total Phosphorus (TP) concentrations are shown in Figures 1
and 2. Where there was a range of values, the highest value was used in preparing these
maps. Nutrient concentrations for the bores near Ocean Reef (Table 1) indicated some
elevated concentrations of TN of up to 7.1 mg/L. Also, TP concentrations were less than 0.1
mg/L with one exception (0.5 mg/L).
Table 1: Nitrogen and Phosphorus Concentrations, from WIR Database
Bore mE mN TN Range TP Range
JP4 380677 6483378 0.7-4.1 0.5
Production Bore 380790 6485260 0.9 0.08
WF1 380420 6486544 5.4-7.1 0.01
WF1 Shallow 380420 6486544 5.6 <0.01
WF13 380045 6486243 0.02-3.7 0.04-0.06
WF8 381623 6484349 0.5 0.09
WF8 Shallow 381623 6484349 3.6 0.01
There were between one and three measurements of TN and TP: where there is only one
value given in the range there was generally only one measurement.

MP Rogers & AssociatesGroundwater Modelling to Assess Nutrient Loads to Planned Marina Page 3
Rockwater Pty Ltd 288.3/15/01
Bores installed for the marina project, and DoW bore GE5 (4931), were sampled on either
one or three occasions by Strategen in 2014 (Strategen, 2015). The average nutrient
concentrations are given in Table 2 and are shown in Figs. 3 and 4.
Table 2: Nitrogen and Phosphorus Concentrations Measured in 2014
Bore Scaled CoordinatesNo. of
AnalysesTN TP
mE mN (2014) (Average mg/L)
MB01 379611 6486175 3 12.7 <0.05
MB02 379758 6485196 3 8.9 0.10
MB03 379646 6485157 3 3.0 0.05
GE5 (DoW 4931) 379910 6484989 3 4.8 0.29
CB01 379541 6485646 1 10.0 0.09
CB02 379561 6485650 1 9.0 0.06
CB03 379586 6485202 1 9.8 0.14
CB05 379685 6485140 1 7.1 0.12
CB06 379611 6485597 1 1.8 <0.05
CB07 379509 6485536 1 24.0 0.17
The results of the analyses indicate that TN concentrations in the area generally range from 2
to 13 mg/L, somewhat higher than the 1971 to 1992 values measured in other bores, as a
result of fertiliser use and urbanisation at Ocean Reef and further inland. Bores CB03 and
CB07 are close to septic tanks and leach drains at Ocean Reef Sports Club and the public
toilets, and the high concentration at CB07 reflects its location and point-source
contamination.
TP concentrations measured in 2014 ranged from <0.05 to 0.29 mg/L, a similar to slightly
higher range than for the old values in the WIR database (except for the JP4 value). Strong
adsorption by the Tamala Limestone will have kept concentrations low, counteracting the
effects of urbanisation.
3 NUMERICAL GROUNDWATER MODEL
3.1 DESCRIPTION
The model is based on a portion of the Perth Regional Aquifer Modelling System (PRAMS)
groundwater model that has been developed by the Water Corporation and the DoW. For this
project the model is centred on Ocean Reef and covers an area of 19 km north–south and 19
km east–west, and uses the top two layers of the PRAMS model that compose the Superficial
aquifer. Both layers represent the same aquifer, but only Layer 1 includes the ocean and
wetlands – the division into two layers allows vertical components of groundwater flow to be
simulated.

MP Rogers & AssociatesGroundwater Modelling to Assess Nutrient Loads to Planned Marina Page 4
Rockwater Pty Ltd 288.3/15/01
The model consists of a rectangular grid of 77 columns and 86 rows, and cell sizes range
from 70 m by 70 m at the planned marina, to 280 m by 280 m over much of the model area
(Fig. 5). It utilises Processing Modflow Pro version 8.0.42 (Simcore Software, 2010) that
incorporates MODFLOW, finite-difference groundwater modelling software designed by the
US Geological Survey (McDonald and Harbaugh, 1988).
Model stress periods were selected to alternate between 212 days of summer (October to
April), and 153 days of winter (May to September). All of the recharge is assumed to occur
during the winter and all evapotranspiration during summer.
The model was constructed with layer tops and bottoms as adopted in PRAMS (Davidson
and Yu, 2008). The base of Layer 1 was then adjusted to be about 3 m below summer
groundwater levels in 2010.
3.2 MODEL PARAMETERS AND BOUNDARY CONDITIONS
Values of vertical and horizontal hydraulic conductivity, specific yield and storage
coefficient were initially as used previously in modelling another area immediately to the
north. Values of horizontal hydraulic conductivity were varied during calibration of the
model, as described in Section 3.3, below. The values adopted after calibration are given in
Table 3.
Table 3: Aquifer Parameters Adopted In Model (Superficial Formations)
Parameter UnitsTamala
LimestoneTamala/Gnangara
Sands
Horizontal HydraulicConductivity
m/d 130 to 300 10 to 36
Vertical HydraulicConductivity
m/d 2 0.5
Specific Yield 0.2 0.2
Storage Coefficient(Layer 2)
0.001 0.001
The PRAMS model uses two recharge models coupled to the flow model to provide recharge
rates. For a model covering an area immediately to the north, Chengchao Xu who developed
the recharge models for PRAMS recommended using a recharge rate of 179 mm/a for most
of the area, and this value was adopted as a starting point for the Ocean Reef model and
varied in steady-state model calibration.

MP Rogers & AssociatesGroundwater Modelling to Assess Nutrient Loads to Planned Marina Page 5
Rockwater Pty Ltd 288.3/15/01
In the transient calibration, an annual factor was applied to the recharge values for each year
modelled from 1987 to 2014 based on the rainfall each year compared to the 1944 to 2014
(Perth airport) average. The factors are a weighted percentage of rainfall above or below the
average, as shown in Figure 6; they were derived to achieve calibration of a similar model of
the Southern River area (Rockwater, 2005). The factors follow a curved rather than straight-
line trend as there is proportionately more recharge in wet years, and proportionately less in
dry years. The adopted recharge in an average rainfall year ranges from 197 mm to 255 mm
per year over the modelled area.
There is a large number of groundwater licences in the modelled area, including those for
Water Corporation bores. There are also many private garden-irrigation bores that are
unlicensed and whose water use is unrecorded. Actual extraction rates were used for the
Water Corporation bores and these were assumed to be spread evenly throughout each year.
The licensed allocations of 100,000 kL/a or more were included in the model as given in the
DoW Water Register and were applied in summer stress periods from the year the allocation
was granted. Some very large allocations were reduced in the model where they were located
close to the northern or southern model (no-flow) boundaries as modelling the full allocation
would have resulted in unrealistically large declines in groundwater level. Smaller
allocations were not included and were assumed to be accounted for in the (reduced)
recharge rates.
Boundaries to the model include constant-head boundaries representing the ocean, and on the
eastern side of the model to represent groundwater flow into the modelled area. Those
representing the ocean are in Layer 1 only. The other boundaries are assumed to be no-flow
boundaries as they are sub-parallel to the direction of groundwater flow; and there is
assumed to be no flow into or out of the Superficial formations from the underlying
Cretaceous sediments.
3.3 MODEL CALIBRATION
The model was first calibrated in steady state mode to water levels measured around mid
1987. Those levels were then used as initial groundwater levels in the model. The model was
then calibrated to water-level changes measured from 1987 to 2014 in nine representative
monitoring bores that have been monitored for an extended period and provide a good spread
over the model area.
A comparison of model-calculated and observed groundwater levels for September–October
2014 after calibration of the model is given in Figure 7, and the comparisons of time-series
plots for the nine monitoring bores are given in Figures 8 to 10. There is a close
correspondence, considering the uncertainties in actual groundwater extraction in the area,
and that the dates of measured and calculated groundwater levels vary by up to 50 days.
Also, groundwater levels in the Tamala Limestone near the coast are affected by ocean tides.

MP Rogers & AssociatesGroundwater Modelling to Assess Nutrient Loads to Planned Marina Page 6
Rockwater Pty Ltd 288.3/15/01
The scaled root mean square (RMS) error for the September–October 2014 water levels is 4.63
percent; and for the time-series water levels ranges from 0.46 to 1.70 % except for 8.11 % for
bore JP20C and 3.51 % for WM42. All these errors except for the time-series data for bore
JP20C are below the maximum of 5 % recommended in Barnett et. al. (2012). The largest
errors are for bore JP20B&C, WM42 and two other bores close to Lake Joondalup – the model
doesn’t well-represent the flattening of the water table through the lake, but this is irrelevant to
groundwater flows to the coast and planned marina.
Post-2010 water-level monitoring data did not necessitate recalibration of the 2011 model and
so validated that model. However, some recalibration was carried out to improve the RMS
errors by including recent water allocations and adjusting water levels on the eastern model
boundary.
The overall water balance error for the transient model is less than 0.01 %, well below the
upper limit of 1 % recommended in Barnett et. al. (2012).
A scattergram of modelled groundwater levels versus groundwater levels is presented in
Figure 11. Even though they are not for the same dates, there is a close correspondence for all
the key bores except JP20B&C and to a lesser degree WM42 (where the data fall above the
equivalence line). For the other bores, a similar number of points fall above and below the
equivalence line showing that there is no significant systematic error.
3.4 SENSITIVITY ANALYSIS
Sensitivity analysis was carried out by varying the values of one parameter at a time and
calculating water levels in the representative bores at the end of summer and end of winter in
2010 and comparing them with water levels from the calibrated model. The differences in
water levels are given in Table 4.
Table 4: Results of Sensitivity Analysis
Parameter, And Variation Changes In Representative Bore Water Levels (m)
End Of Summer End Of Winter
Pumpage +15% -0.05 to -0.01 -0.04 to -0.01
Recharge -15% -0.37 to -0.04 -0.39 to -0.06
Evapotranspiration +15% -0.22 to -0.01 -0.17 to 0.0
Horizontal Conductivity +15% -0.31 to -0.02 -0.33 to -0.03
Vertical Conductivity +15% -0.03 to 0.0 -0.03 to 0.0
Specific Yield +15% 0.02 to 0.13 0.0 to 0.05

MP Rogers & AssociatesGroundwater Modelling to Assess Nutrient Loads to Planned Marina Page 7
Rockwater Pty Ltd 288.3/15/01
The results show that the model is most sensitive to recharge rates, followed by horizontal
hydraulic conductivities and evapotranspiration rates. The model is insensitive to pumping
rates, vertical hydraulic conductivity and specific yield.
3.5 MODELLING RESULTS
The calibrated model was run to simulate groundwater flow with average rainfall and
recharge over a 10-year period from 2014, with and without the planned marina. Model-
calculated peak end-of-winter and minimum end-of-summer groundwater flows at the end of
that period were applied to total nitrogen (TN) and total phosphorus (TP) concentrations that
were distributed to model cells by kriging the 2014 data for the planned marina area and the
WIR data for other areas, to determine nutrient loads in groundwater discharging to:
The existing Ocean Reef harbour;
The ocean along the section of coast that will be enclosed by the planned marina; and
The planned marina.
Model-calculated groundwater flows for each of these cases are given in Table 5 and nutrient
loads are given in Table 6.
Table 5: Calculated Groundwater Flows
Case Modelled Groundwater Flow (kL/d)
End of Summer End of Winter
To Existing Harbour 2149 3346
Existing Coast within Planned Marina 4851 7989
To Planned Marina 5022 8396
Table 6: Calculated Nutrient Loads
Case Modelled TN Loads (kg/d) TP Loads (kg/d)
End of Summer End of Winter End of Summer End of Winter
To Existing Harbour 26.5 41.2 0.2 0.3Existing Coast within PlannedMarina
61.0 102.2 0.4 0.7
To Planned Marina 64.5 107.9 0.4 0.7
The calculated nitrogen loads are probably on the high side, as the elevated concentration in
bore CB07 resulting from point contamination has resulted in some elevated TN
concentrations in the model in the surrounding area after kriging of the monitoring data.
Groundwater will discharge to the marina and ocean through the sea bed. Sampling of sea-
bed pore water by Bowman Bishaw Gorham (RPS Group) at Port Coogee indicated that most

MP Rogers & AssociatesGroundwater Modelling to Assess Nutrient Loads to Planned Marina Page 8
Rockwater Pty Ltd 288.3/15/01
of the flow would be within 20 to 30 m of the shoreline (unless there are solution pipes in the
limestone that “daylight” further off-shore).
The salinity of groundwater discharging in the planned marina is expected to be between 590
and 1,000 mg/L TDS, based on electrical conductivity measurements from bores MB01 to
MB03 in 2014.
3.6 IMPACT OF ADDITIONAL CLIMATE CHANGE
The modelling described above is based on rainfalls and groundwater recharge continuing
with a similar dry climate to that which has occurred since the 1970’s. The potential impacts
on the planned marina of further climate change (less rainfall and higher ocean levels) are
discussed below.
3.6.1 Impact of Reduced Rainfalls
Lower rainfalls would reduce groundwater levels, and hence groundwater throughflow and
discharge to the ocean. They would be offset, at least in part, by increased infiltration to
groundwater from runoff from roofs and roads with further urbanisation in the area inland of
the marina, and reduced extraction of groundwater for irrigation of market gardens.
Lowering of groundwater levels on the Gnangara Mound (upgradient of Ocean Reef) has
resulted in the development of the Gnangara Sustainability Strategy (2009). Based on the
strategy, the Government is planning reductions in private and public groundwater
extraction, and the clearing of pine plantations that prevent groundwater recharge.
The future climate in Perth could be wetter, similar or drier than at present, although it has
been widely predicted to be drier. For example, Sadler (2007) cited in DoW (2009) predicted
that rainfall could decrease by 15 percent to 2030 compared to the 1980–1999 baseline,
together with a -5% to -25% natural variability.
CSIRO (2009) has assessed groundwater availability in the South-West of Western Australia
at year 2030 for a number of climate scenarios using 15 global climate models, including a
dry extreme future climate scenario. The Perth Regional Aquifer Modelling System
(PRAMS) was run to predict future groundwater levels for these scenarios, and for the dry
extreme future climate case it was predicted that groundwater levels in 2030 would be
similar (to those at present) near the coast at Ocean Reef and 3 m lower (than those at
present) inland on the flanks of the Gnangara Mound. The modelling did not allow for the
impacts of urbanisation, or for reductions in extraction and increased recharge to the
Gnangara Mound.
MP Rogers & AssociatesGroundwater Modelling to Assess Nutrient Loads to Planned Marina Page 9
Rockwater Pty Ltd 288.3/15/01
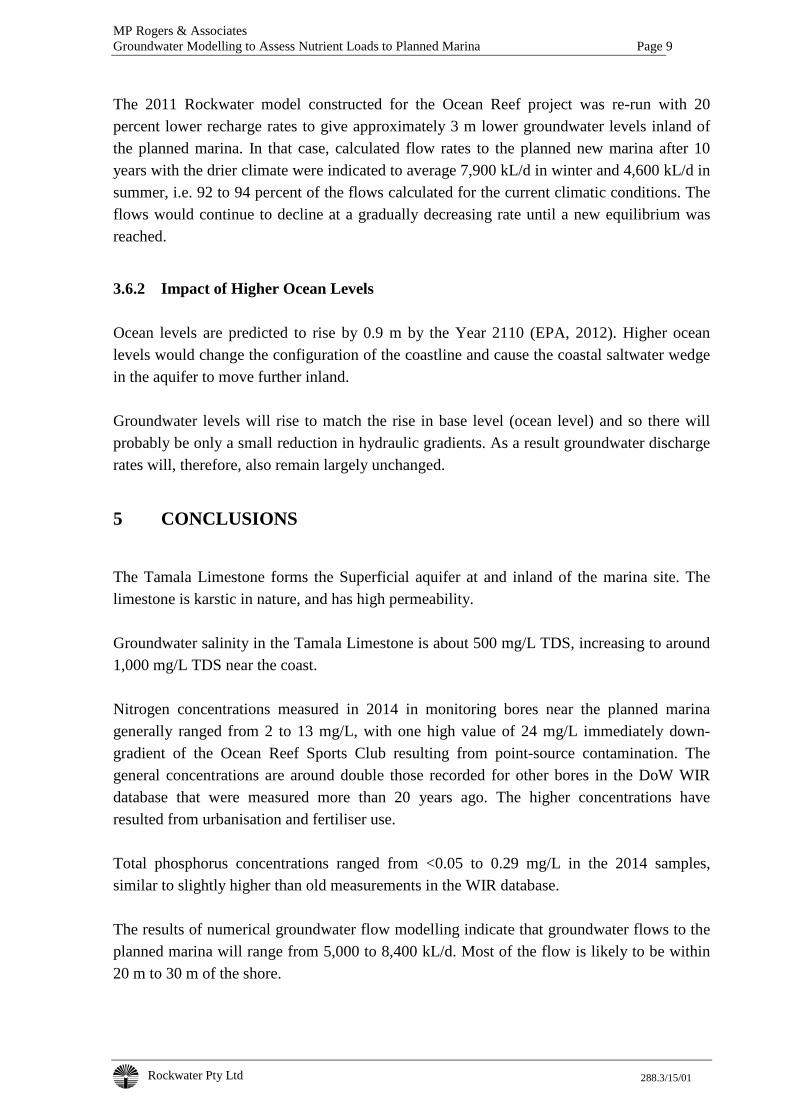
The 2011 Rockwater model constructed for the Ocean Reef project was re-run with 20
percent lower recharge rates to give approximately 3 m lower groundwater levels inland of
the planned marina. In that case, calculated flow rates to the planned new marina after 10
years with the drier climate were indicated to average 7,900 kL/d in winter and 4,600 kL/d in
summer, i.e. 92 to 94 percent of the flows calculated for the current climatic conditions. The
flows would continue to decline at a gradually decreasing rate until a new equilibrium was
reached.
3.6.2 Impact of Higher Ocean Levels
Ocean levels are predicted to rise by 0.9 m by the Year 2110 (EPA, 2012). Higher ocean
levels would change the configuration of the coastline and cause the coastal saltwater wedge
in the aquifer to move further inland.
Groundwater levels will rise to match the rise in base level (ocean level) and so there will
probably be only a small reduction in hydraulic gradients. As a result groundwater discharge
rates will, therefore, also remain largely unchanged.
5 CONCLUSIONS
The Tamala Limestone forms the Superficial aquifer at and inland of the marina site. The
limestone is karstic in nature, and has high permeability.
Groundwater salinity in the Tamala Limestone is about 500 mg/L TDS, increasing to around
1,000 mg/L TDS near the coast.
Nitrogen concentrations measured in 2014 in monitoring bores near the planned marina
generally ranged from 2 to 13 mg/L, with one high value of 24 mg/L immediately down-
gradient of the Ocean Reef Sports Club resulting from point-source contamination. The
general concentrations are around double those recorded for other bores in the DoW WIR
database that were measured more than 20 years ago. The higher concentrations have
resulted from urbanisation and fertiliser use.
Total phosphorus concentrations ranged from <0.05 to 0.29 mg/L in the 2014 samples,
similar to slightly higher than old measurements in the WIR database.
The results of numerical groundwater flow modelling indicate that groundwater flows to the
planned marina will range from 5,000 to 8,400 kL/d. Most of the flow is likely to be within
20 m to 30 m of the shore.

MP Rogers & AssociatesGroundwater Modelling to Assess Nutrient Loads to Planned Marina Page 10
Rockwater Pty Ltd 288.3/15/01
Nutrient loads in groundwater discharging to the marina are calculated to range from 64.5 to
107.9 kg/d for total nitrogen, and 0.4 to 0.7 kg/d for total phosphorus, with the smaller loads
(and groundwater flows) occurring in summer. The actual nitrogen loads are likely to be less
than the calculated values, as the elevated value for bore CB07 has caused some higher
modelled concentrations on kriging the monitoring data.
The modelling is partly based on the climate since the 1970’s which has been drier than
the climate in the long-term record. It is uncertain whether the climate will continue to
become drier. On the basis of a drier future as predicted by CSIRO, the groundwater
levels would decrease by about 3 m inland but remain at around current levels near the
coast. Consequently, groundwater flow to the planned marina could decrease by up to
8% over the coming decade, and by more in subsequent decades.
Dated: 14 February 2015 Rockwater Pty Ltd
P H WhartonPrincipal
REFERENCES
Barber, C., Davis, G.B., and Buselli, G., 1990, Development of procedures for more efficient
monitoring and assessment of groundwater contamination from point sources of pollution:
Final Report to AWRAC, EPA, WAWA. The Mindarie Regional Council and the Atlas
Group.
Barnett et al, 2012, Australian groundwater modelling guidelines. Waterlines report series
No.82, National Water Commission, Canberra.
CSIRO, 2009, Groundwater yields in south-west Western Australia. Report to the Australian
Government from the Sustainable Yields Project.
Davidson, W. A., 1995, Hydrogeology and groundwater resources of the Perth Region,
Western Australia: Western Australia Geological Survey Bulletin 142.

MP Rogers & AssociatesGroundwater Modelling to Assess Nutrient Loads to Planned Marina Page 11
Rockwater Pty Ltd 288.3/15/01
Davidson W.A., & Yu, X, 2008, Perth regional aquifer modelling system (PRAMS) model
development: Hydrogeology and groundwater modelling, Western Australia Department of
Water, Hydrogeological record series HG 20.
DoW, 2009, Perth-Peel regional water plan 2010–2030, responding to our drying climate.
Draft for public comment.
EPA, 2012, Sea level rise. Environmental Protection Authority of Western Australia,
Environmental Protection Bulletin 18.
Government of Western Australia, 2009, Gnangara sustainability strategy. Draft for public
comment.
McDonald, M.G., and A.W. Harbaugh, 1988, A Modular Three-Dimensional
Finite-Difference Ground-Water Flow Model. Book 6, Chapter A1, Techniques of Water
Resources Investigations. U.S. Geol. Surv., Washington, DC. (A:3980).
Rockwater, 2005, Southern River development area, groundwater modelling to assess the
effects of climatic variations, and planned development. Report to Water Corporation.
Rockwater, 2011, Ocean Reef Marina, groundwater modelling to assess nutrient loads to the
ocean and marina. Report for M P Rogers & Associates.
Simcore Software, 2010, Processing Modflow, An integrated modelling environment for the
simulation of groundwater flow, transport and reactive processes.
Strategen, 2015, Ocean Reef Marina Development, design groundwater levels and water
quality results. Report to City of Joondalup.

Rockwater Pty Ltd 288.3/15/01
FIGURES

3.3
0.8
4.1
<0.02<0.02
1.4
2.2 9.7
7.0
0.3
0.0
1.8
3.9
3.0
<0.02
10.0
3.14.3
1.7
0.2
2.8
0.0
7.1
4.5
6.0
3.0
2.9
3.8
2.1
0.5
0.4
0.6
12.4
0.3
3.7
1.5
4.52.8
1.4
39.4
2.6
0.2
<0.2
0.2
1.1
0.2
0.5
4.5
<0.2
0.9
3.6
3.0
2.8
1
1
1
1
1
5
5
5
376000 378000 380000 382000 384000 386000 388000 390000
6478000
6480000
6482000
6484000
6486000
6488000
6490000
6492000
Note: highest value shown wherethere was more than one analysis
OceanReef
PlannedMarina

0.03
0.04
0.50
0.340.57
0.07
0.03
1.87
0.33
0.01
0.01
0.01
0.06
0.02
0.02
<0.005
0.10
0.04
0.040.01
0.01
0.02
0.01
0.06
0.03
0.05
0.03
0.02
0.04
0.05
0.09
0.12
0.17
0.21
0.03
0.04
0.01
0.050.05
0.21
5.54
0.43
0.08
<0.01
0.07
0.05
0.1
0.1
0.1
0.1
0.5
1.0
376000 378000 380000 382000 384000 386000 388000 390000
6478000
6480000
6482000
6484000
6486000
6488000
6490000
6492000
OceanReef
Note: highest value shown wherethere was more than one analysis
PlannedMarina

12.7
8.9
3.0
4.8
10.0 9.0
9.8
7.1
1.8
24.0
MB01
MB02
MB03
GE5
CB01CB02
CB03
CB05
CB06
CB07
379000 379200 379400 379600 379800 380000 380200
6484800
6485000
6485200
6485400
6485600
6485800
6486000
6486200
6486400
Planned
Marina

<0.05
0.10
0.05
0.29
0.09 0.06
0.14
0.12
<0.05
0.17
MB01
MB02
MB03
GE5
CB01CB02
CB03
CB05
CB06
CB07
379000 379200 379400 379600 379800 380000 380200
6484800
6485000
6485200
6485400
6485600
6485800
6486000
6486200
6486400
Planned
Marina

376000 378000 380000 382000 384000 386000 388000 390000
6476000
6478000
6480000
6482000
6484000
6486000
6488000
6490000
6492000
6494000
Ocean
Reef
Planned
Marina

Figure 6
Rockwater P
ty Ltd
annual rech
arge multiplier.g
rf
0 0.1 0.2 0.3 0.4 0.5 0.6 0.7 0.8 0.9 1 1.1 1.2 1.3 1.4 1.5 1.6 1.7 1.8 1.9 2 2.1 2.2 2.3 2.4Recharge Factor For Annual Rainfall
500
600
700
800
900
1000
1100
1200
1300
Annual Rainfall (m
m)

0.4
1.3
4.1
17.9
18.9
15.7
21.0
37.5
38.8
41.0
40.7
39.2
42.3
42.2
0.8
17.0
41.3
0.9
1.2
1.7
1.9
3.1
2.1
0.8
27.8
4.5 15.9
41.1
1.3
11
1
55
5
10
10
10
15
15
15
20
20
20
25
25
25
30
30
35
35
40
45
JP7
JP4
WH100
JP20B
8281
WH230
GD2
WM22
WM18
MS10
MS7
WM28
MS14
MT1S
QQ24-89
L Joondalup
L Mariginiup
WF1
WF3
WF4
WF5
WF11
WF12
WF13
WM42
JP26 JNP_WC
MGP_C
SCC21-88
376000 378000 380000 382000 384000 386000 388000 390000
6478000
6480000
6482000
6484000
6486000
6488000
6490000
6492000
OceanReef

Figure 8
Rockwater P
ty Ltd
key wls1 calib
.grf
18
20
22
24
26
Water Level (m
AHD)
GD2 (5020)
Model-Calculated
16
18
20
22
24
JP20C (4970)
Model-Calculated
1-Jan-88 1-Jan-90 1-Jan-92 1-Jan-94 1-Jan-96 1-Jan-98 1-Jan-00 1-Jan-02 1-Jan-04 1-Jan-06 1-Jan-08 1-Jan-10 1-Jan-12 1-Jan-14
34
36
38
40
42
WM18 (5025)
Model-Calculated

Figure 9
Rockwater P
ty Ltd
key wls2 calib
.grf
-2
0
2
4
6
Water L
evel (m
AHD)
QU21/89 (5727)
Model-Calculated
38
40
42
44
46
MS7 (5029)
Model-Calculated
1-Jan-88 1-Jan-90 1-Jan-92 1-Jan-94 1-Jan-96 1-Jan-98 1-Jan-00 1-Jan-02 1-Jan-04 1-Jan-06 1-Jan-08 1-Jan-10 1-Jan-12 1-Jan-14
2
4
6
8
10
JP26 (13323693)
Model-Calculated
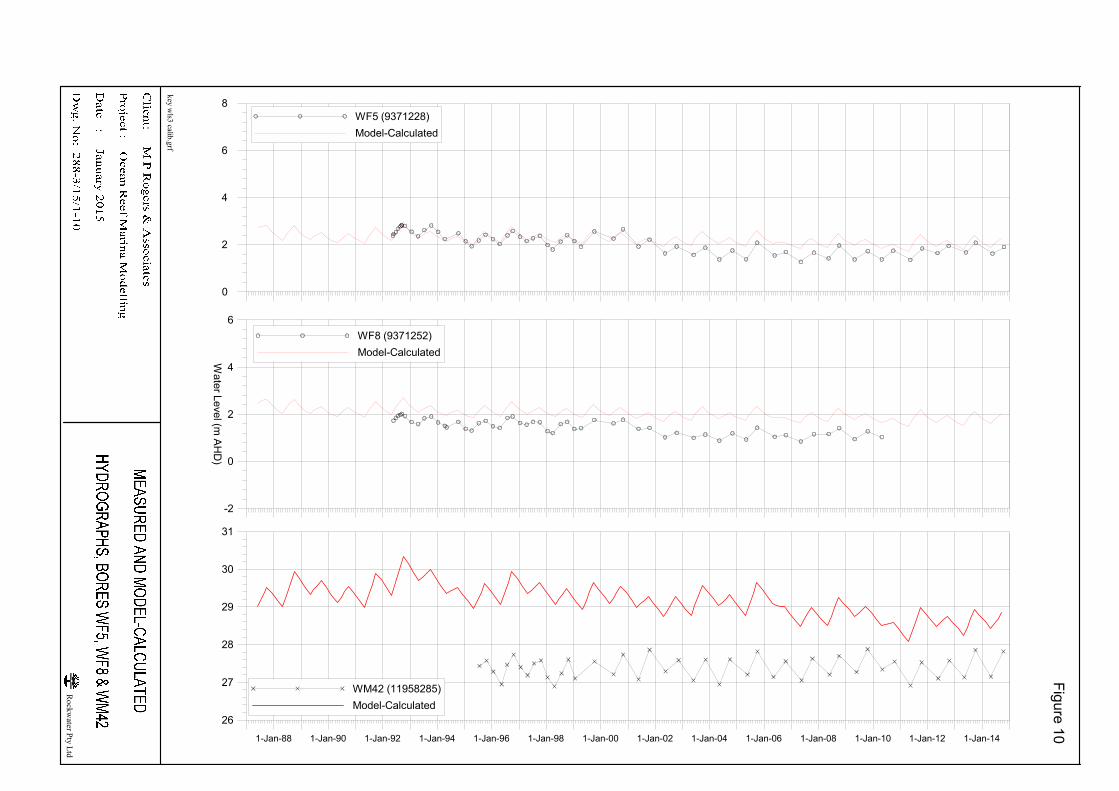
Figure 10
Rockwater P
ty Ltd
key wls3 calib
.grf
-2
0
2
4
6
Water L
evel (m
AHD)
WF8 (9371252)
Model-Calculated
0
2
4
6
8
WF5 (9371228)
Model-Calculated
1-Jan-88 1-Jan-90 1-Jan-92 1-Jan-94 1-Jan-96 1-Jan-98 1-Jan-00 1-Jan-02 1-Jan-04 1-Jan-06 1-Jan-08 1-Jan-10 1-Jan-12 1-Jan-14
26
27
28
29
30
31
WM42 (11958285)
Model-Calculated

Figure 11
Rockwater P
ty Ltd
measu
red vs modelled
.grf
0 10 20 30 40 50Measured Water Level (m AHD)
0
10
20
30
40
50
Modelled Water Level (m
AHD)
JP20
WM42