Embed Size (px)
Citation preview
- 1 -
Occurrence of Arsenic Species in Algae and Freshwater Plants of an Extreme Arid 1
Region in Northern Chile, the Loa River Basin 2
Albert Pell1, Anna Márquez1, José Fermín López-Sánchez1,2,*, Roser Rubio1,2, Mercedes 3
Barbero3, Susana Stegen4, Fabrizio Queirolo4, Paula Díaz-Palma4 4 1 Analytical Chemistry Department, Universitat de Barcelona, Martí i Franquès 1-11, Barcelona ES-08028, Spain 5
2 Water Research Institute, Universitat de Barcelona, Av. Diagonal 684, Barcelona ES-08034, Spain 6
3 Plant Biology Department, Universitat de Barcelona, Av. Diagonal 647, Barcelona ES-08028, Spain 7
4 Chemistry Department, Universidad Católica del Norte, Avda. Angamos 0610, Antofagasta CL-1270709, Chile 8
* Corresponding autor. Tel: +34 93 403 48 73; e-mail: [email protected] 9
10
ABSTRACT 11
This study reports data on arsenic speciation in two green algae species (Cladophora sp. and 12
Chara sp.) and in five aquatic plants (Azolla sp., Myriophyllum aquaticum, Phylloscirpus cf. 13
desserticola, Potamogeton pectinatus, Ruppia filifolia and Zannichellia palustris) from the Loa 14
River Basin in the Atacama Desert (northern Chile). Arsenic content was measured by Mass 15
Spectrometry coupled with Inductively Coupled Plasma (ICP-MS), after acidic digestion. Liquid 16
Chromatography coupled to ICP-MS was used for arsenic speciation, using both anionic and 17
cationic chromatographic exchange systems. Inorganic arsenic compounds were the main 18
arsenic species measured in all samples. The main arsenic species in the extracts of freshwater 19
algae and plants were arsenite and arsenate, whereas glycerol-arsenosugar (gly-sug), 20
dimethylarsinic acid (DMA) and methylarsonic acid (MA) were present only as minor 21
constituents. Of the samples studied, algae species accumulated more arsenic than aquatic 22
plants. Total arsenic content ranged from 182 to 11,100 and from 20 to 248 mg As kg-1 (d.w.) in 23
algae and freshwater plants, respectively. In comparison with As concentration in water 24
samples, there was hyper-accumulation (>0.1% d.w.) in Cladophora sp. 25
HIGHLIGHTS 26
- Loa River Basin (area of study) presents extreme environmental conditions 27
- Arsenic and arsenic compounds were determined in algae and aquatic plants 28
- Inorganic arsenic species predominated in all samples 29
- Arsenic content in most samples ranged from 20 to 341 mg As kg-1 30
- One sample (Cladophora sp.) presented hyperaccumulation of As (11,000 mg As kg-1) 31
KEYWORDS 32
Arsenic speciation, LC-ICP-MS, algae, aquatic plants, Loa River 33
34
*Manuscript
Click here to view linked References
- 2 -
1. INTRODUCTION 35
The Antofagasta Region (northern Chile) has high environmental levels of arsenic (Queirolo, et 36
al., 2000a). The only river in the region that flows into the sea is the Loa, an extremely saline 37
river. Dissolved arsenic content in the Loa and its tributaries range from 200 to 4,400 µg As L-1 38
(seasonal maximum) (Dirección General de Aguas (DGA), 2004). The chemical composition of 39
the Loa’s water is strongly influenced by its tributaries, mostly by the Salado River, which is As-40
enriched by waters from the El Tatio geothermal fields with levels up to 27 mg As L-1 (Romero, 41
et al., 2003). The extremely arid conditions, high evaporation and the lack of low-level arsenic 42
tributaries maintain high concentrations of arsenic and other components (e.g. copper, boron, 43
chloride, sulfate…) throughout the river course. Nevertheless, arsenic not only comes from 44
natural sources such as volcanic bedrock and geothermal activity, but also has anthropogenic 45
origins, such as smelter emissions, mining waste and enriched arsenic effluents from water 46
treatment plants (Dirección General de Aguas (DGA), 2004). The Loa River and its main 47
tributaries provide water to the cities and it is extensively used for agriculture and by the 48
mining industry in the Atacama region. Adverse health effects due to high arsenic 49
concentrations in drinking water have been reported in rural populations since 1962 (Smedley, 50
et al., 2000). Nowadays, major cities and towns receive water that complies with Chilean 51
legislation (< 0.010 mg As L-1) (Ministerio de Salud Pública, 1969). 52
The Loa River is a suitable habitat for a high number of endemic flora and fauna species, 53
particularly relevant for their adaptation to this extremely arid region. Algae and aquatic plants 54
can be considered possible bioindicators of arsenic levels in the aquatic system. As they are 55
able to remove inorganic arsenic from water, they could be useful for bioremediation purposes 56
(Bird, et al., 2011; Hansen, et al., 2006; Knauer and Hemond, 2000; Robinson, et al., 2006b). 57
A comprehensive review on distribution an occurence of organoarsenic compounds in living 58
organisms is available from Reimer et al. (2010). Specifically, several studies on arsenic and its 59
compounds in marine algae around the world have been reported (Francesconi and Edmonds, 60
1998; Llorente-Mirandes, et al., 2010; Thomson, et al., 2007; Tukai, et al., 2002). However, few 61
data are available for total arsenic (Hansen, et al., 2006; Vasquez and Guerra, 1996) and 62
arsenic speciation in Chilean seaweeds (Ruíz Chancho, et al., 2010). Nor is there much 63
information on freshwater algae and aquatic plants (Miyashita, et al., 2009; Schaeffer, et al., 64
2006; Zheng, et al., 2003). Although some reports are available on arsenic in water (Dirección 65
General de Aguas (DGA), 2004; Queirolo, et al., 2000a; Romero, et al., 2003), vegetables 66
(Muñoz, et al., 2002; Queirolo, et al., 2000a; Queirolo, et al., 2000b) and aquatic plants 67
- 3 -
(Stegen, et al., 2000) from the Loa River Basin, no study was found reporting arsenic speciation 68
in the algae and aquatic plants of this basin. 69
The aim of the study is to determine total arsenic and arsenic species in algae and aquatic 70
plants from the Loa River Basin in order to assess their contribution to overall contamination in 71
this lotic ecosystem. This could be a motive for further bioremediation studies in the area and 72
studies of possible bio-monitoring organisms. 73
74
2. STUDY AREA 75
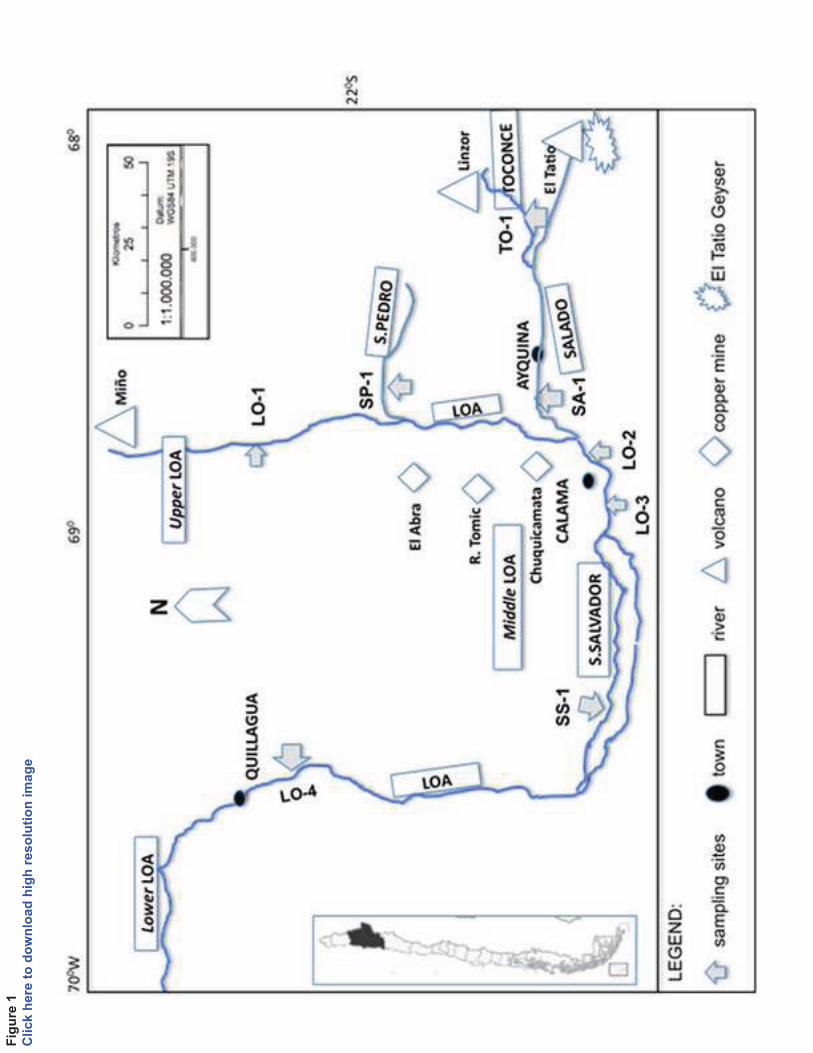
The study area was restricted to the Loa River Basin in northern Chile (22°16’0’’S 68°38’0’’W). 76
The location and general view of the study area are given in Figure 1. Mining activity in the Loa 77
Basin takes place in the intensively mineralized porphyry-Cu belt with developments at three 78
large Cu deposits: Chuquicamata, Radomiro Tomic and El Abra (Figure 1). The main tributaries 79
of the Loa River are the San Pedro, Salado and San Salvador rivers. Two important sources of 80
arsenic have to be considered in this basin. On the one hand, the Salado River, mainly fed by 81
the geothermal springs of El Tatio located in the Andes, flows in an E–W direction into a 82
canyon and cuts into volcanic rocks, mainly andesite and rhyolitic ignimbrite of the Miocene-83
Holocene age. On the other hand, the Chuquicamata smelter, at 2,850 MASL and 16 km from 84
the city of Calama, producing high As content in the copper concentrates and the release of 85
SO2 and aerosols (containing mainly arsenic as As2O3 and a low proportion of Cd, Cu, Pb and 86
Zn) into the air, contributes to the contamination of water bodies, especially saltpans 87
(Brundenius and Göransson, 1990). The hydrologic regime of the Loa Basin is rain-dominated: 88
the river flow increases mainly during the summer in January and February (Dirección General 89
de Aguas (DGA), 2004). The region is extremely arid with a rainfall ranging from 300 mm per 90
year at 3,000 MASL to 1-2 mm per year at sea level (Romero, et al., 2003) and is associated 91
with high environmental levels of arsenic (Queirolo, et al., 2000a). Owing to the extremely arid 92
conditions in the region, all rivers are temporal or endorrheic except for the Loa River, which is 93
the only permanently exorrheic river in the region. It is 440 km long, covers an area of 33,570 94
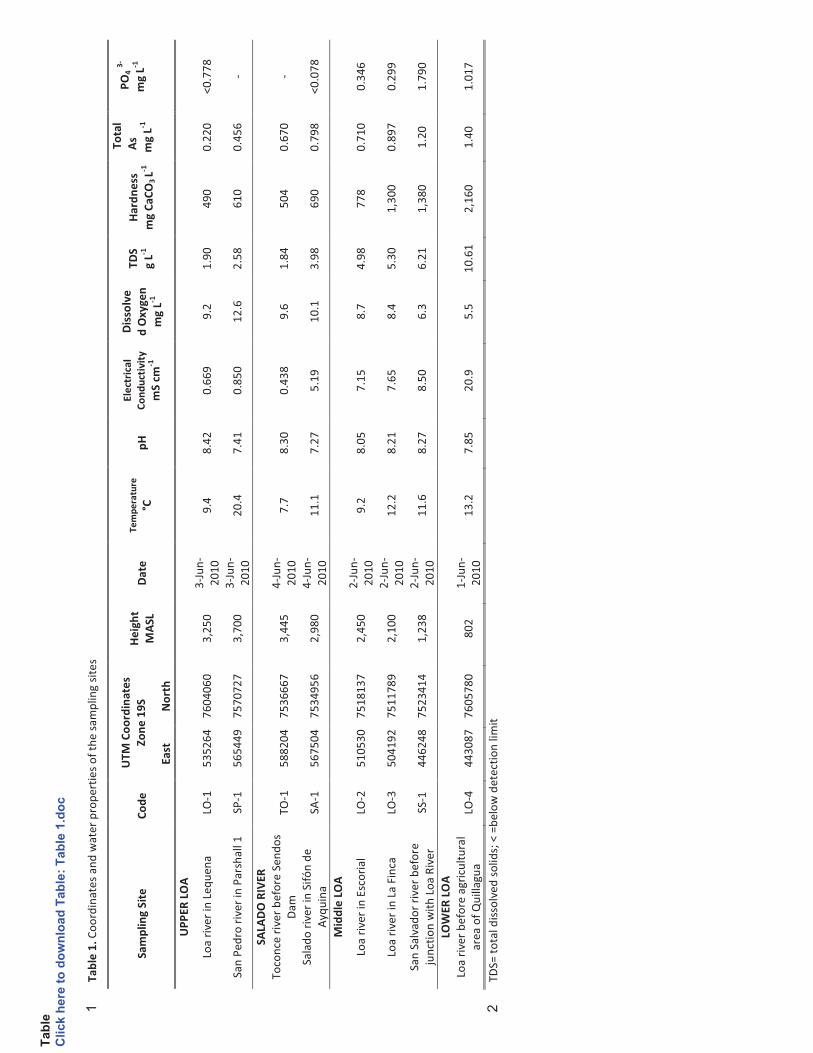
km² and flows sinuously across the Atacama Desert from the Andes to the Pacific Ocean. In 95
this basin, plants and algae grow in water with high conductivity and pH (see Table 1) and 96
under strongly limiting conditions, such as large daily temperature variations and prolonged 97
daily UV exposure. 98
- 4 -
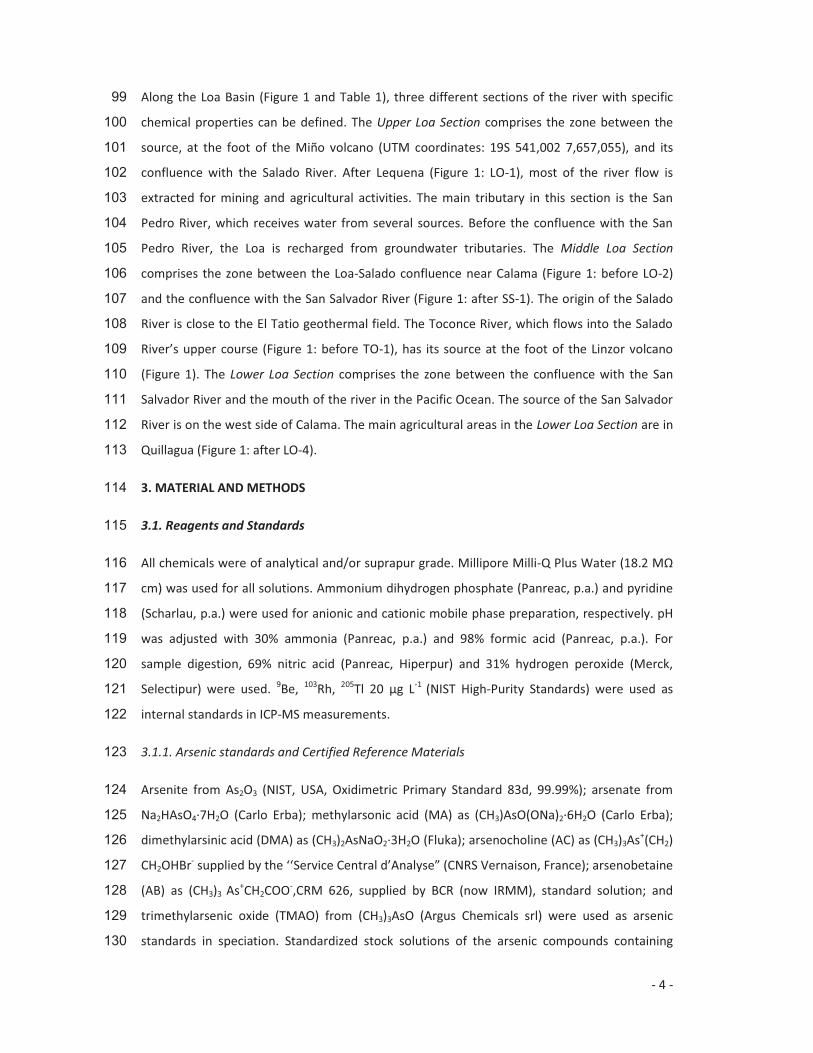
Along the Loa Basin (Figure 1 and Table 1), three different sections of the river with specific 99
chemical properties can be defined. The Upper Loa Section comprises the zone between the 100
source, at the foot of the Miño volcano (UTM coordinates: 19S 541,002 7,657,055), and its 101
confluence with the Salado River. After Lequena (Figure 1: LO-1), most of the river flow is 102
extracted for mining and agricultural activities. The main tributary in this section is the San 103
Pedro River, which receives water from several sources. Before the confluence with the San 104
Pedro River, the Loa is recharged from groundwater tributaries. The Middle Loa Section 105
comprises the zone between the Loa-Salado confluence near Calama (Figure 1: before LO-2) 106
and the confluence with the San Salvador River (Figure 1: after SS-1). The origin of the Salado 107
River is close to the El Tatio geothermal field. The Toconce River, which flows into the Salado 108
River’s upper course (Figure 1: before TO-1), has its source at the foot of the Linzor volcano 109
(Figure 1). The Lower Loa Section comprises the zone between the confluence with the San 110
Salvador River and the mouth of the river in the Pacific Ocean. The source of the San Salvador 111
River is on the west side of Calama. The main agricultural areas in the Lower Loa Section are in 112
Quillagua (Figure 1: after LO-4). 113
3. MATERIAL AND METHODS 114
3.1. Reagents and Standards 115
All chemicals were of analytical and/or suprapur grade. Millipore Milli-Q Plus Water (18.2 MΩ 116
cm) was used for all solutions. Ammonium dihydrogen phosphate (Panreac, p.a.) and pyridine 117
(Scharlau, p.a.) were used for anionic and cationic mobile phase preparation, respectively. pH 118
was adjusted with 30% ammonia (Panreac, p.a.) and 98% formic acid (Panreac, p.a.). For 119
sample digestion, 69% nitric acid (Panreac, Hiperpur) and 31% hydrogen peroxide (Merck, 120
Selectipur) were used. 9Be, 103Rh, 205Tl 20 µg L-1 (NIST High-Purity Standards) were used as 121
internal standards in ICP-MS measurements. 122
3.1.1. Arsenic standards and Certified Reference Materials 123
Arsenite from As2O3 (NIST, USA, Oxidimetric Primary Standard 83d, 99.99%); arsenate from 124
Na2HAsO4·7H2O (Carlo Erba); methylarsonic acid (MA) as (CH3)AsO(ONa)2·6H2O (Carlo Erba); 125
dimethylarsinic acid (DMA) as (CH3)2AsNaO2·3H2O (Fluka); arsenocholine (AC) as (CH3)3As+(CH2) 126
CH2OHBr- supplied by the ‘‘Service Central d’Analyse” (CNRS Vernaison, France); arsenobetaine 127
(AB) as (CH3)3 As+CH2COO-,CRM 626, supplied by BCR (now IRMM), standard solution; and 128
trimethylarsenic oxide (TMAO) from (CH3)3AsO (Argus Chemicals srl) were used as arsenic 129
standards in speciation. Standardized stock solutions of the arsenic compounds containing 130
- 5 -
about 1,000 mg -1
were prepared in water, except for arsenite, which was dissolved in NaOH (4 131
g L−1, Merck, Suprapure), and all were stored in the dark at 4°C to prevent decomposition or 132
oxidation. Multispecies standard working solutions covering the range 1 - 100 µg As L-1 were 133
prepared fresh daily for speciation analysis. Arsenate standard solution from NIST High-Purity 134
Standards with a certified concentration of 1,000 ± 2 mg As L-1 was used for external 135
calibration in the determination of total arsenic content with ICP-MS. An aliquot of freeze-136
dried extract of Fucus serratus dissolved in water (Madsen, et al., 2000) was used as a 137
laboratory reference material for the identification of the major arsenosugars: phosphate 138
(PO4-sug), sulfate (SO4-sug), sulfonate (SO3-sug) and glycerol (Gly-sug). The Certified Reference 139
Material BCR CRM 279 Sea Lettuce (Ulva lactuca), supplied by the Institute for Reference 140
Materials and Measurements (IRMM) of the European Commission, with a certified value of 141
3.09 ± 0.20 mg As kg−1, and the Standard Reference Material (SRM) 1640 for natural water 142
were used for internal quality control purposes in total arsenic determinations. 143
3.2. Instruments 144
A Perkin Elmer system of Flow injection hydride generation atomic absorption spectrometry 145
(FI-HG-AAS), Model AAnalyst 700 and FIAS 400, was used for total As in water, under the 146
following conditions: sample loop 0.5 mL; reducing agent, 0.5% NaBH4 in 0.125% NaOH at 5 mL 147
min-1; 10% HCl, at 10 mL min-1; and argon at 100 mL min-1 as carrier gas for the FI system. An 148
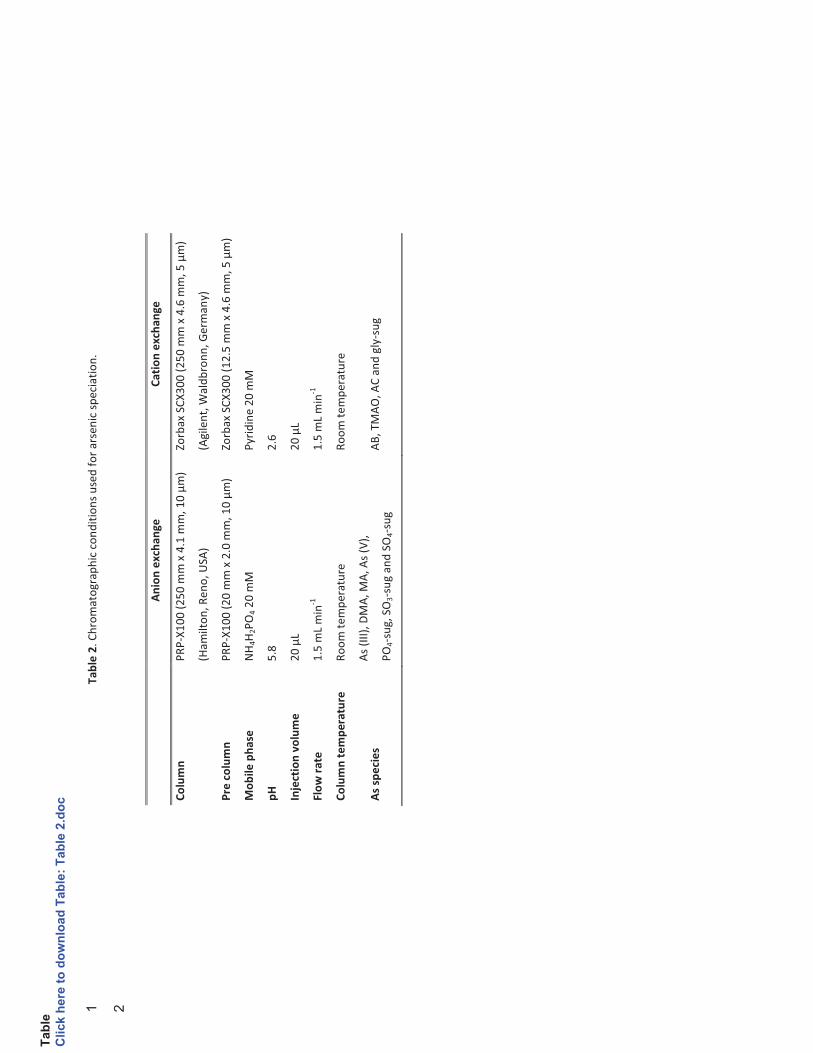
As electrodeless discharge lamp and electric oven temperature for the quartz cell at 900°C was 149
used in AAS. 150
Algae and aquatic plants and CRM Sea Lettuce were digested in a closed microwave digestion 151
system, Milestone Ethos Touch Control. The ICP-MS analyses were performed through an 152
Agilent 7500ce ICP-MS (Agilent, Germany) with Ari Mist HP nebulizer (Burgener, Canada). The 153
chromatographic system consisting of an Agilent 1200 LC quaternary pump, equipped with an 154
autosampler and degasification module, was connected to an analytical PRP-X100 (Hamilton, 155
USA) and Zorbax SCX300 (Agilent, Germany). Both columns were protected with their 156
respective guard column. The Instrument operating conditions of LC-ICP-MS and arsenicals 157
that are separated with each chromatographic system are given in Table 2. 158
159
3.3 Procedures 160
3.3.1 Sample collection and preparation 161
In June 2010, the Analytical and Environmental research group of the Chemistry Department 162
of the Católica del Norte University (Antofagasta, Chile) collected samples of water and of the 163
- 6 -
dominant species of both algae and plants from eight sites along the Loa River and its 164
tributaries, San Pedro, Salado and San Salvador (Figure 1). The geographical coordinates and 165
the water properties of the sampling sites are shown in Table 1. Electrical conductivity, 166
dissolved oxygen, pH and water temperature were measured in situ. Water samples were 167
acidified with 2 M HNO3 and cooled in a refrigerator (< 5°C) during transport to the laboratory, 168
where they were stored at -20°C until further analysis. The taxonomic identification of the 169
plants and algae is given in Table 3. Samples were stored in sealed plastic bags at -18°C in the 170
laboratory until preparation for transportation. Samples were defrosted under a laminar flow 171
clean bench, washed with deionized water to remove mud, sand and little stones, pre-dried at 172
45°C for 3 days and sealed in plastic bags. 173
Plant and algae samples were transported by plane to the Analytical Chemistry Department of 174
the University of Barcelona. There, a stereomicroscope (Zeiss) was used to remove remaining 175
impurities. Then, samples were dried at 40°C, crushed by hand in a glass mortar and stored in 176
PET bottles until their analyses. 177
178
3.3.2. Determination of total As in water 179
Total arsenic content in water samples was determined after microwave acidic digestion, using 180
a closed-vessel system as follows: a 45 mL water sample was placed into the pre-cleaned 181
EasyPrepTM vessels and 9 mL of 65% nitric acid and 3 mL of 40% hydrogen peroxide were 182
added for digestion. The program for addition was as follows: 10 min at room temperature, 10 183
min from room temperature to 200°C and 15 min maintained at 170°C. After cooling, digested 184
samples were filtered through ash-free filter papers (Whatman 42) into a 100 mL volumetric 185
flask and 5 mL of 50% HCl and 5 mL of reducing solution (5% KI + 5% ascorbic acid) were 186
added. After 30 min, the resulting solution was diluted to volume with 50% HCl. Blanks were 187
also prepared for each batch sample. Total As was measured by FI-HG-AAS under the 188
conditions described in Instruments. 189
190
3.3.3. Extraction of arsenic compounds and speciation analysis 191
Homogenized, powdered samples (0.1 g) were separately weighed in polypropylene tubes in 192
triplicate and 10 mL of water was added. The extraction procedure was performed in an end-193
over-end shaker overnight at 35 rpm for 16 hours at room temperature. Water extracts were 194
centrifuged (3,000 rpm, 15 min) and the supernatants were filtered through PET syringe filters 195
(Chromafil PET, Macherey–Nagel, 0.45 μm) before analysis. The LC-ICP-MS system previously 196
- 7 -
used (Llorente-Mirandes, et al., 2010; Ruíz Chancho, et al., 2010) was applied for the 197
determination of arsenic compounds in algae and plant extracts, under the conditions 198
described in Table 2. An aliquot of each extract was analyzed by anionic exchange 199
chromatography immediately after extraction. The remaining extract was stored at -80°C for 200
further analyses (cationic exchange and total arsenic measurements). Chromatographic peaks 201
were identified according to their retention time by comparison with standards. Arsenic 202
species were quantified by external calibration curves. Total As was determined in aliquots of 203
the extracts, for mass balance calculations. 204
205
3.3.4. Determination of total As in algae, aquatic plants and the speciation extracts 206
Algae and aquatic plants and BCR CMR 279 were digested under a closed-vessel microwave 207
system as follows: 0.2 g of powdered sample was weighed in the pre-cleaned TEFLON® vessels 208
in triplicate. After addition of 8 mL of 69% nitric acid and 2 mL of 33% hydrogen peroxide, 209
samples were digested according to the following program: 10 min from room temperature to 210
90°C, maintained for 5 min at 90°C, 10 min from 90°C to 120°C, 10 min from 120°C to 190°C 211
and maintained for 10 min at 190°C. After cooling, digested samples were filtered through ash-212
free filter papers (Whatman 40) and diluted to 20 mL with water. Blanks were also prepared 213
for each batch sample. Total arsenic content was measured by ICP-MS. The digested samples 214
and the extracts obtained for further arsenic speciation were properly diluted with 1% nitric 215
acid prior to measurement, to ensure that all arsenic concentrations were within the working 216
calibration range (0–50 µg As L-1). Helium was used in the collision cell to remove interferences 217
in ICP-MS measurements and a solution of 9Be, 103Rh, 205Tl (20 µg L-1) was used as an internal 218
standard. Samples were quantified by external calibration method. For quality control 219
purposes, the calibration curve was run before, within and after each sample series 220
measurement. 221
3.4 Quality assessment in the determination of arsenic and arsenic species 222
3.4.1 Column recovery 223
Column recovery was calculated as the ratio of the sum of the species eluted from the 224
chromatographic columns to the total arsenic in the extract injected into the column. Column 225
recoveries ranged between 60% and 100% (Table 3). This parameter allows to evaluate 226
correctly the quantification of the species and to guarantee the correct chromatographic 227
separation. 228
- 8 -
3.4.2. Certified reference material (CRM) 229
To check accuracy, total arsenic concentration was determined in CRM BCR 279 Sea lettuce 230
(Ulva lactuca). The result obtained (2.9 ± 0.3 mg As kg-1) was consistent with the certified value 231
(3.09 ± 0.20 mg As kg-1), thereby demonstrating the accuracy of the analytical method. Our 232
results for arsenic species (As(V): 0.53 ± 0.04 mg As kg-1; As(III): 0.06 ± 0.03 mg As kg-1; DMA: 233
0.06 ± 0.03 mg As kg-1; MA: 0.04 ± 0.01 mg As kg-1;AB: 0.14 ± 0.02 mg As kg-1; gly-sug: 0.096 234
±0.004 mg As kg-1; PO4-sug: 0.08± 0.01 mg As kg-1; Unknown species: 0.07 ± 0.02 mg As kg-1; 235
Extraction efficiency: 57%; Column recovery: 81%) and those reported in the literature do not 236
disagree (Caumette, et al., 2011; Foster, et al., 2007). 237
3.4.3. Analysis of F. serratus extract 238
We used an extract from the brown seaweed F. serratus (Madsen, et al., 2000) to identify 239
arsenosugars present in our algae samples. For quality control purposes, we quantified As 240
species in F. serratus extracts. Our results1 (DMA: 0.01 ± 0.01 µg; gly-sug: 0.07 ± 0.01 µg; PO4-241
sug: 0.07 ± 0.01 µg; SO3-sug: 0.56 ± 0.04 µg; SO4-sug: 0.37 ± 0.02 µg) confirm those reported by 242
Madsen et al. (2000) and other values in the literature on the same extract (Kohlmeyer, et al., 243
2003; Llorente-Mirandes, et al., 2010; Ruíz Chancho, et al., 2008; Šlejkovec, et al., 2006). 244
3.4.4. Quantification of arsenic species without standard 245
Standards were not used for some arsenic species since they were not offered. Using 246
calibration curves form others species is a controversial point as nebulization efficiency might 247
be different for each compound (Entwisle and Hearn, 2006; Polya, et al., 2003); however, we 248
quantified PO4-sug with the MA calibration curve, SO3-sug and SO4-sug with the As(V) 249
calibration curve, and gly-sug with the calibration curve of the AC standard as other authors 250
suggested (Francesconi and Sperling, 2005). 251
3.4.5. Limit of Detection (LOD) and Limit of Quantification (LOQ) 252
LOD and LOQ were estimated. The former is the lowest concentration of an analyte that can 253
be reliably differentiated from background noise (signal-to-noise ratio greater than 3). The 254
LOQ is the lowest concentration that can be quantified (signal-to-noise ratio greater than 10). 255
For calculating LOD and LOQ, the standard deviation of the base line and the peak base of each 256
analyte multiplied by 3 or 10 (LOD and LOQ respectively) were calculated in the peak height 257
1 Values for F. serratus extract are given as absolute amount for extract µg.
- 9 -
calibration curve. The arsenosugar LODs and LOQs was estimated through a correction factor, 258
which is the relation within the concentration of arsenosugar in F. serratus and the height of 259
the peak. 260
261
4. RESULTS AND DISCUSSION 262
4.1. Surface water characteristics 263
Coordinates and water characteristics are shown in Table 1. Surface waters were characterized 264
by pH values near neutral to slightly alkaline (pH 7.27-8.42). Electrical conductivity (0.438 – 265
20.9 mS cm-1) and total dissolved solids (1.84–10.61 g L-1) showed wide ranges of values 266
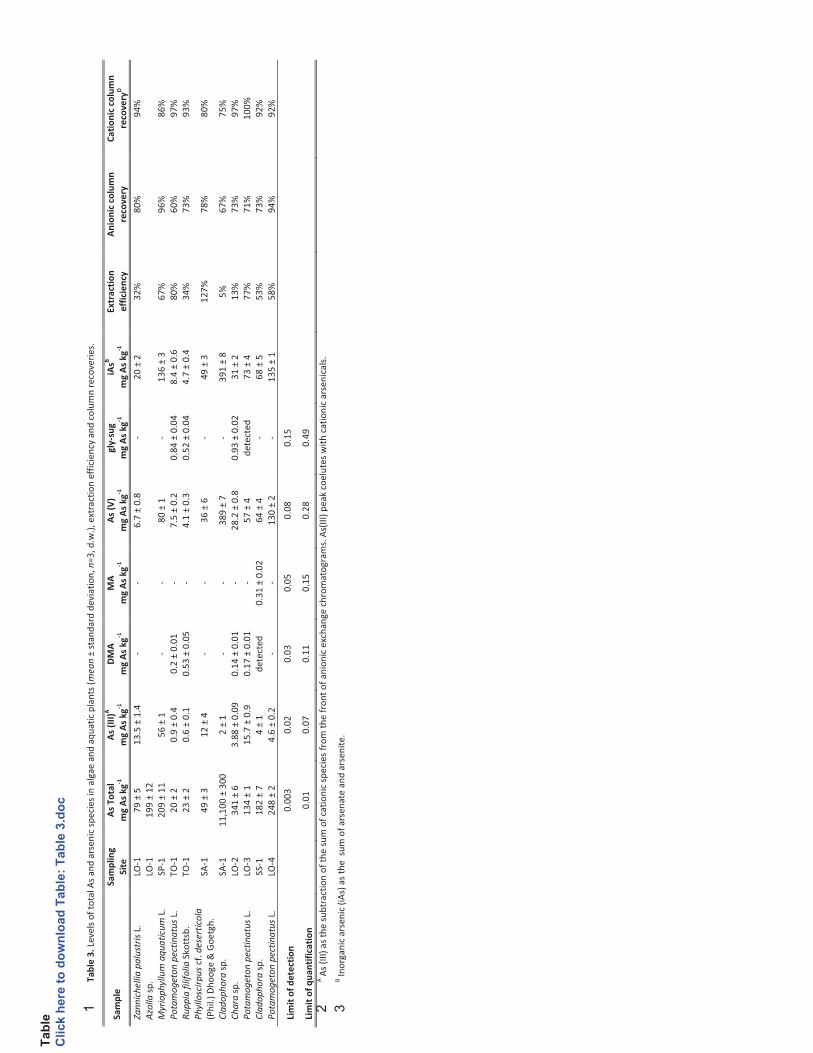
between Loa river sections and were consistent with the location of the anthropogenic sources 267
(wastewater and mining activities). Arsenic content in the surface waters ranged from 0.220 to 268
1.40 mg As L-1 and varied depending on the sampling point. The results indicated that the main 269
contribution is due to the anthropogenic inputs of tributaries near the mining area of 270
Chuquicamata and Calama city. Therefore, the ecological risk of anthropogenic As from long-271
term human activities might be mainly due to the sediments of these tributaries. An increase 272
of arsenic is observed down-stream even at a considerable distance from the confluence, 273
through the important mining area of Chuquicamata, to the mouth. The highest level of As was 274
measured in Lower Loa (LO-4), mainly polluted by mining, smelting, industrial and agricultural 275
activities. For internal quality control, the SRM 1640 was analyzed for arsenic and the results 276
obtained were within ± 5% of the reference value. 277
278
4.2. Total arsenic in algae and aquatic plants 279
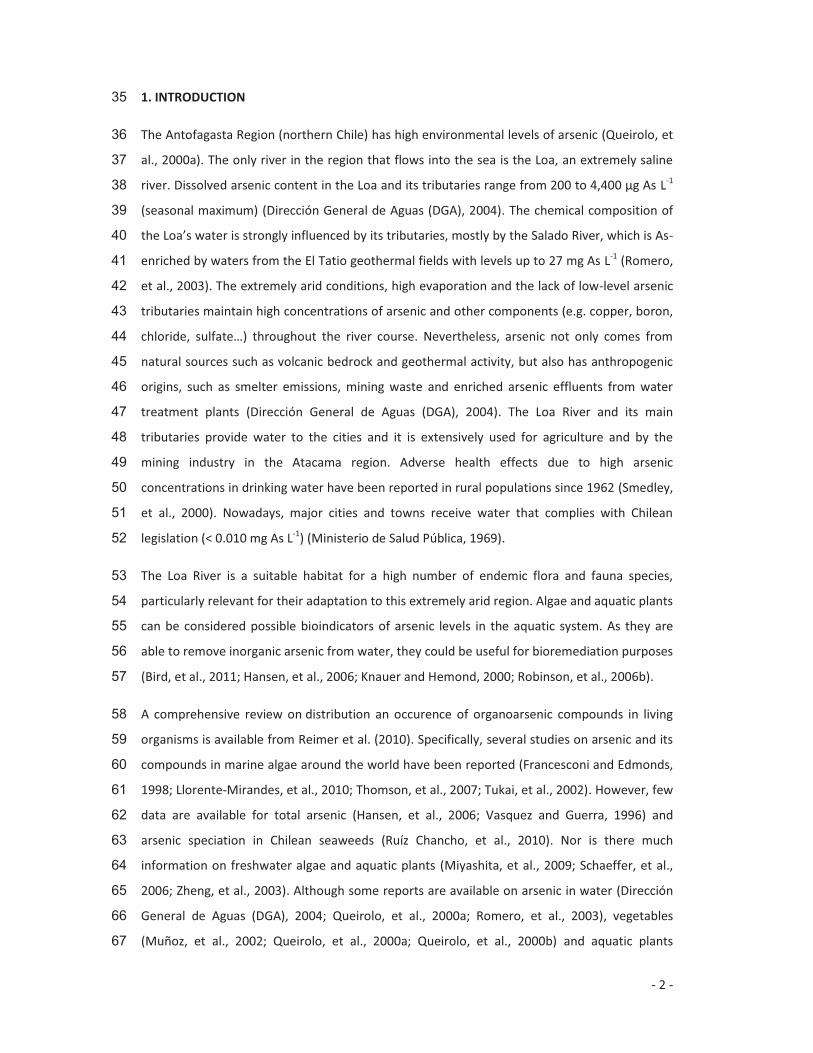
Results of total arsenic and arsenic species found in the algae and aquatic plants, limits of 280
quantification and detection, extraction efficiency and column recoveries are given in Table 3. 281
Each of the values shown in the tables is the mean of three replicates. 282
Total arsenic content determined in various species of algae and aquatic plants varied along 283
the river course and ranged from 20 to 341 mg As kg-1 (Table 3), but this range was greatly 284
exceeded in an algae sample (Cladophora sp.: 11,100 mg As kg-1) from the Salado River (SA-1), 285
one of the most polluted sites (Dirección General de Aguas (DGA), 2004). The disparity in the 286
values found in these algae is largely attributable to the water’s chemical composition in the 287
Salado River, which is strongly influenced by its origin in the geothermal field of El Tatio. 288
Nevertheless, a freshwater plant (Phylloscirpus cf. deserticola) collected at the same site (SA-1) 289
as Cladophora sp. had 49 mg As kg-1. A similar figure was seen in a study comparing the same 290
- 10 -
algal species with some aquatic plants in a freshwater environment (Schaeffer, et al., 2006). 291
The differences in arsenic concentration between samples might be due either to the fact that 292
P. cf. deserticola is a vascular plant and Cladophora sp. is a filamentous alga, or to differences 293
in the habitat where samples were collected. Cladophora sp. lives submerged in water, 294
whereas the analyzed samples of P. cf. deserticola were only aerial stems, not submerged 295
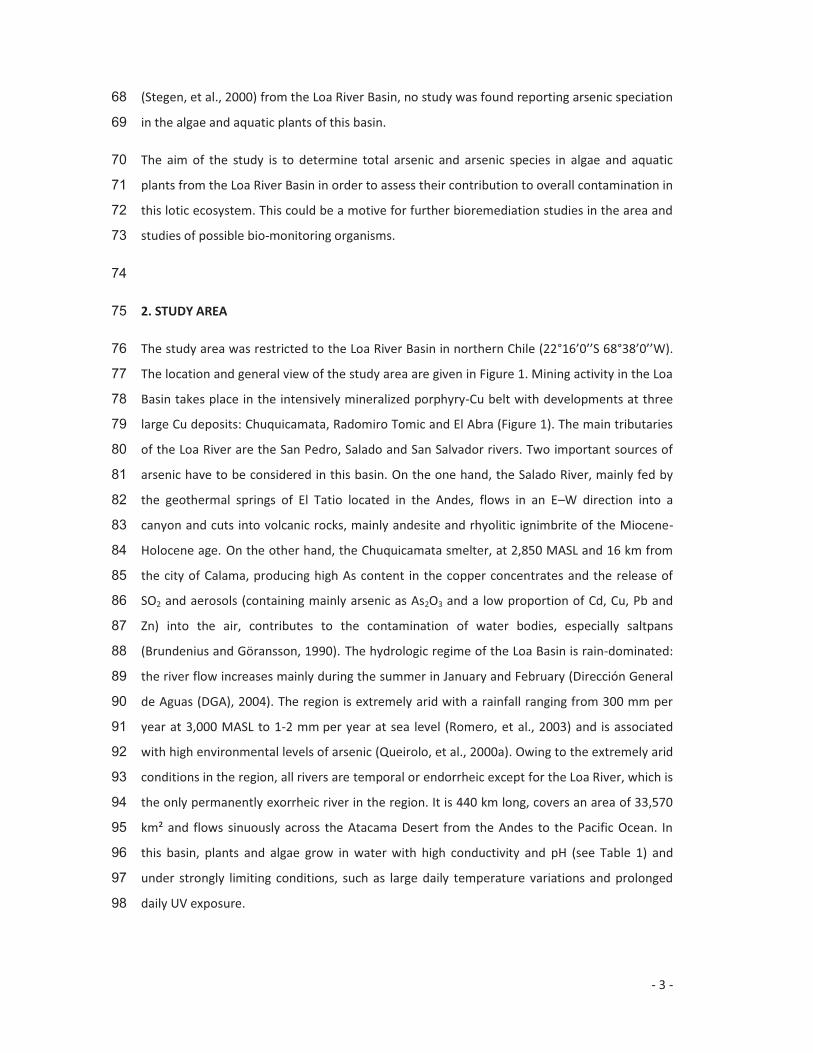
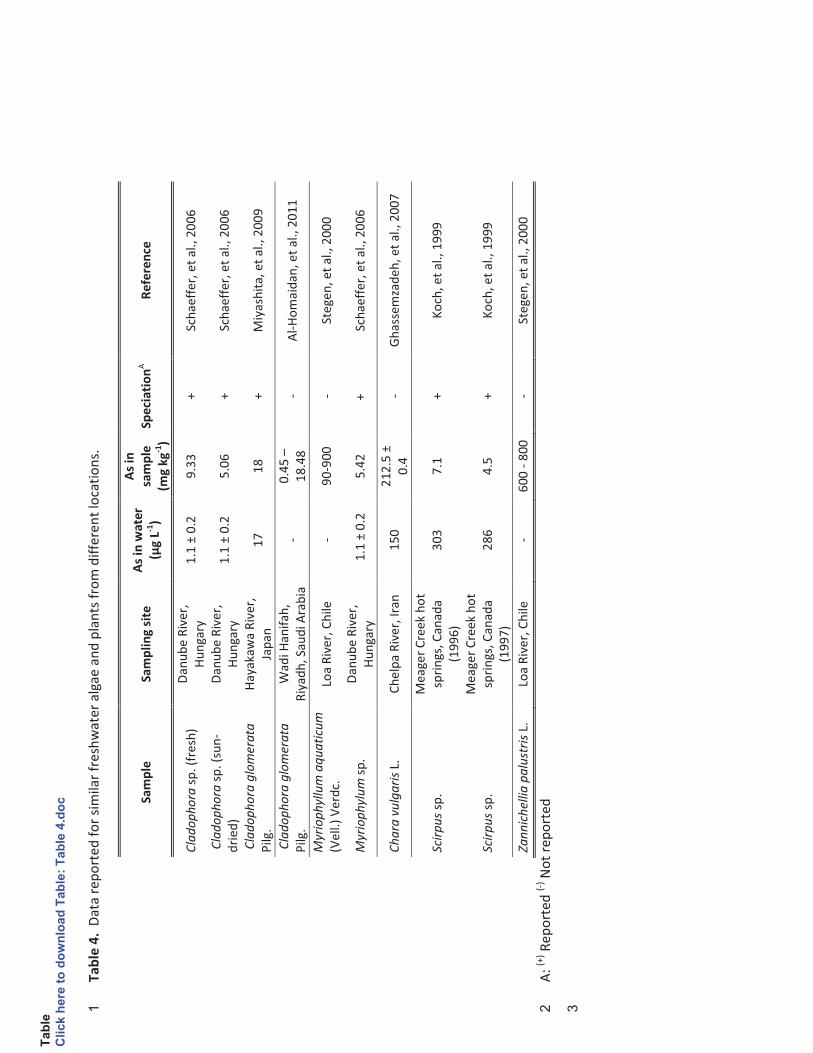
roots and stems. Data on arsenic content in algae and freshwater plants of the same genus as 296
in the present study but from different locations are summarized in Table 4 for comparison 297
purposes. Algae and aquatic plants growing in the Loa River Basin survive in an environment 298
with high arsenic content, meaning that these species have developed arsenic tolerance 299
mechanisms (which may vary between species). In general, hyperaccumulating plants can 300
concentrate some elements in their tissues up to 0.1% of their dry weight. Of the species 301
analyzed, Cladophora sp. is able to hyperaccumulate arsenic (1.11% of dry weight) and would 302
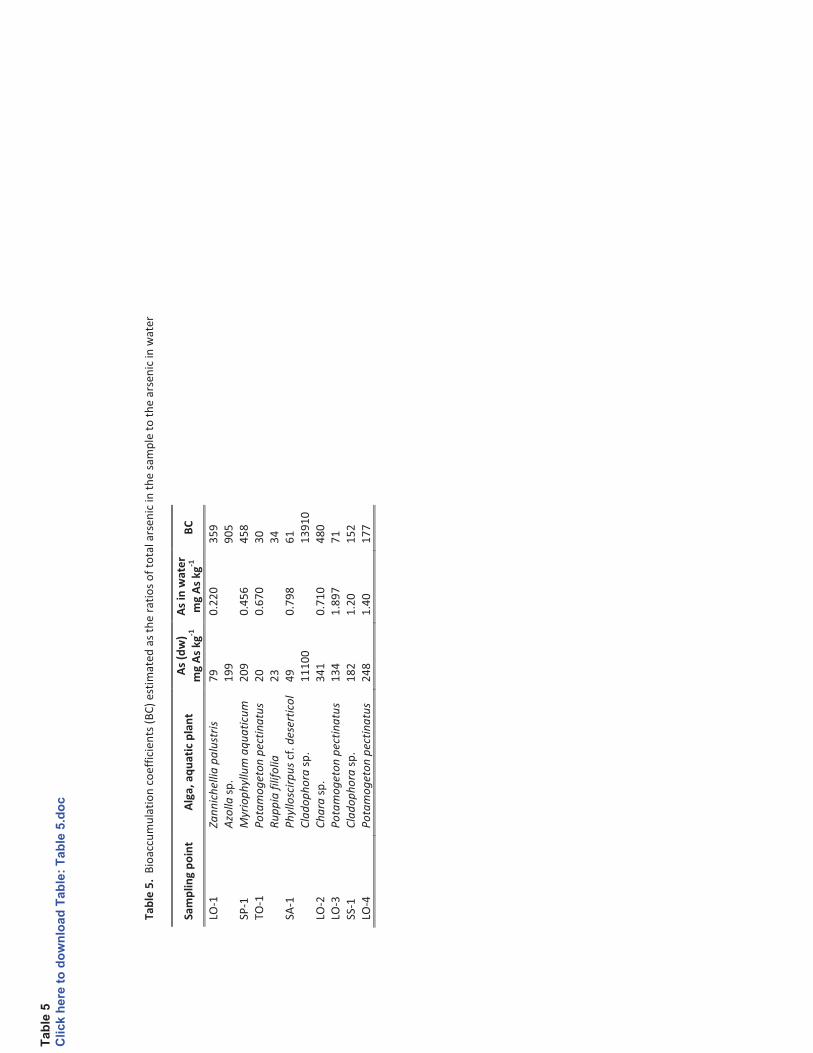
be a good candidate for bioremediation studies. With this aim in mind, bioaccumulation 303
coefficients (BC) were estimated as the ratios of total arsenic in the sample to the arsenic in 304
water, according to Robinson et al. (2006a) (values shown in Table 5). Cladophora sp. shows 305
remarkable differences between SA-1 (13,910) and SS-1 (152), whereas arsenic concentration 306
in water at SA-1 is lower than at SS-1 (see Table 1). This behavior could be explained by 307
including phosphorous, since the ratio As:P in soil and water affects intake, distribution and 308
speciation due to the chemical analogy between arsenate and phosphate (Wang, et al., 2002). 309
In the present study, as differences in phosphate concentration were found between the 310
water samples (see Table 1), the highest BC (the highest uptake of arsenate) was obtained with 311
the data from the site with low phosphate concentration. Thus, the increase in phosphate in 312
the water appears to result in a decrease in arsenic uptake. 313
4.3. Arsenic speciation 314
Results of arsenic speciation, limits of quantification and detection, extraction efficiency and 315
column recoveries are given in Table 3. 316
Extraction efficiencies (calculated as the ratio of total As in the extract to total As from acidic 317
digestions) ranged from 5% to 126%. Rubio et al. (2010) reported a wide range of extraction 318
efficiencies among algae and plants with different extracting agents (6%-108%). Water is a 319
good extracting agent, since it enters the sample matrix and extracts the compounds 320
determined in the present study, as these are very polar and soluble in water (Francesconi and 321
Kuehnelt, 2004). Low extraction efficiencies are related to the presence of non water-soluble 322
arsenicals like arsenolipids (Francesconi, 2003), and to arsenic bound to cell components or 323
proteins, which are not extracted by soft extractants such as water (Koch, et al., 2000). For 324
- 11 -
example, Cladophora sp. (SA-1) had a total arsenic concentration of 11,100 mg As kg-1
, but only 325
5% of arsenic compounds were extracted, only as inorganic forms. 326
Inorganic arsenic (iAs) is the main form in the samples, representing 82% to 100% of the sum 327
of arsenic species. High values of standard deviation in some arsenite values could be 328
explained by the rapid oxidation of this species to arsenate (Table 3). DMA, MA and glycerol 329
arsenosugars were found as minor compounds in several samples. Gly-sug was found in plant 330
samples of P. pectinatus and R. filifolia, corroborating recent studies of aquatic plants 331
(Llorente-Mirandes, et al., 2010; Ruíz Chancho, et al., 2010). AB was not detected in any 332
sample, which indicates that the removal of epiphytes during sample pre-treatment was 333
accurate and that microbial activity, which might be involved in the formation of such an 334
arsenocompound (Llorente-Mirandes, et al., 2010; Ruíz Chancho, et al., 2010), is not significant 335
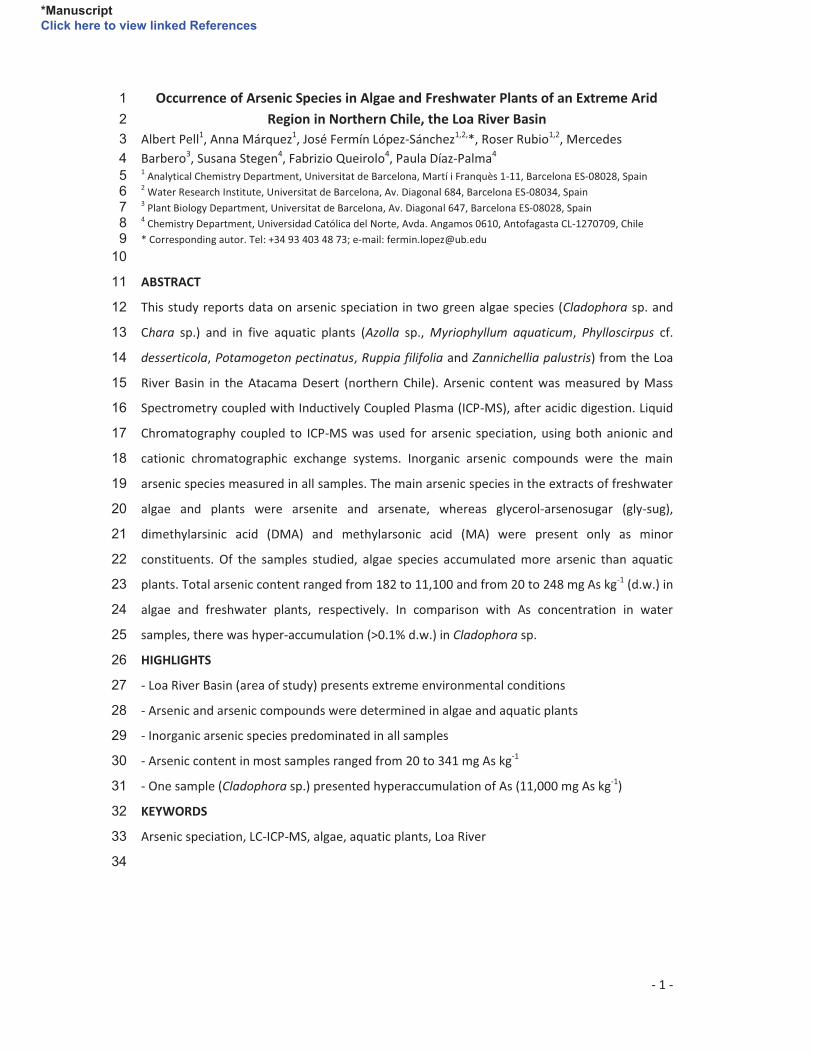
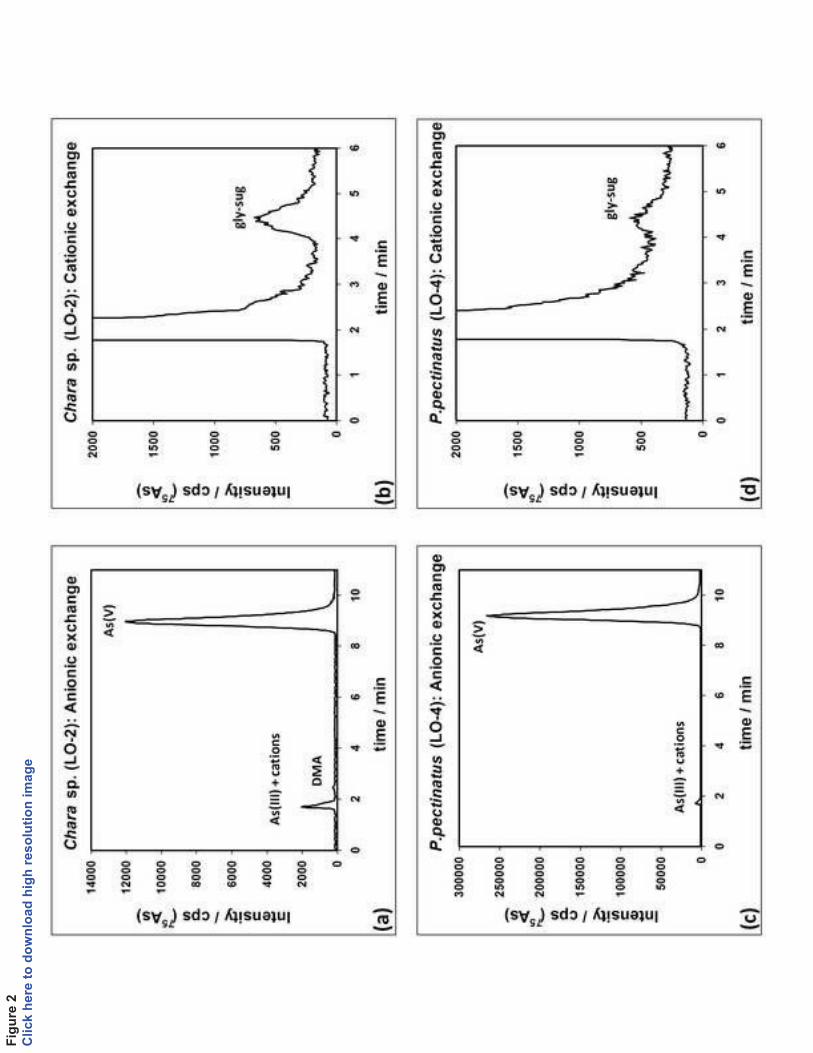
in the Loa River Basin. In some chromatograms the presence of a large amount of a major 336
arsenic compound might make it difficult to quantify minor species that elute with a similar 337
retention time. As an example, Figure 2 shows an anionic and a cationic exchange 338
chromatogram of extracts of P. pectinatus (LO-4) and Chara sp. (LO-2). 339
Column recovery values, calculated as the ratio of the sum of arsenicals eluted from the 340
column to the arsenic injected in the column, are shown in Table 3. Anionic column recoveries 341
ranged from 60% to 96%; and cationic ones, from 75% to 100%. 342
It is interesting to notice that samples from TO-1 and SA-1 present the same speciation patters 343
despite being different taxa of aquatic plants. These results might suggest that arsenic uptake, 344
transformation and accumulation in plants and algae growing under chemical stress depend on 345
the environmental conditions rather than the biological species (Kabata-Pendias, et al., 1997). 346
Diatoms were present in all algae (Chara sp. and Cladophora sp.) and in P. pectinatus (LO-3). 347
Therefore, the possible influence of adsorbed diatoms on samples was examined. However, 348
this seems to have had no effect on extraction efficiency, since samples had both low (5%) and 349
high ratios (76%). Nor was any correlation between occurrence of diatoms and total arsenic 350
and arsenical concentrations found (see Table 4). 351
352
353
5. CONCLUSIONS 354
This is the first study of arsenic speciation in algae and freshwater plants from the Loa River 355
Basin (northern Chile). Samples had a wide range of concentrations of total arsenic, from 20 to 356
341 mg As kg-1 (d.w.), except for one algal sample with 11,100 mg As kg-1, Cladophora sp., 357
which can be classified as a hyperaccumulator. Inorganic arsenic predominated in all samples, 358
accounting for 82% to 100% of the arsenicals measured. Small amounts of DMA, MA and gly-359

- 12 -
sug were detected in several samples. This preliminary information should contribute usefully 360
to further bioremediation assays and to the proposal for biomonitoring organisms in this 361
extremely arid region. 362
363
364
365
ACKNOWLEDGEMENTS 366
This study was supported financially by the DGICYT (Project No. CTQ2010-15377), the Grup de 367
Recerca Consolidat (Project No. SGR2009-1188), DGIP (Project No. 155/2009, University 368
Católica del Norte, Chile) and the Master EMQAL “Erasmus Mundus Quality in Analytical 369
Laboratorie, project number 2008-0095", which are all gratefully acknowledged. We also thank 370
Dr. Toni Padró from the Serveis Científico-tècnics of the University of Barcelona for his valuable 371
support with ICP-MS measurements. The authors are also grateful to Prof. Kevin A. 372
Francesconi for the kind donation of the F. serratus extract and to Prof. M.J. Ruiz-Chancho for 373
her help with the safe sample transportation from Chile to Barcelona. A. Pell is grateful to the 374
CUR of DIEU (Generalitat de Catalunya) for the support given through a pre-doctoral grant. 375
376
- 13 -
REFERENCES 377
Al-Homaidan, A.A., Al-Ghanayem, A.A., Alkhalifa, A.H., 2011. Green Algae as Bioindicators of Heavy Metal 378
Pollution in Wadi Hanifah Stream, Riyadh, Saudi Arabi. Int. J. Water Resour. Arid Environ. 1, 10-15. 379
Bird, M.I., Wurster, C.M., de Paula Silva, P.H., Bass, A.M., de Nys, R., 2011. Algal biochar - production and 380
properties. Bioresour. Technol. 102, 1886-1891. 381
Brundenius, C., Göransson, B., 1990. Technological Change and Pollution Abatement in the Copper Industries 382
of Chile and China. Minerals and energy. 14, 3. 383
Caumette, G., Koch, I., Estrada, E., Reimer, K.J., 2011. Arsenic Speciation in Plankton Organisms from 384
Contaminated Lakes: Transformations at the Base of the Freshwater Food Chain. Environ. Sci. Technol. 45, 385
9917-9923. 386
Dirección General de Aguas (DGA), 2004. Diagnóstico y Clasificación de los Cursos y Cuerpos de Agua según 387
Objetivos de Calidad, Cuenca Río Loa. Ministerio de Medio Ambiente, Chile. 388
Entwisle, J., Hearn, R., 2006. Development of an accurate procedure for the determination of arsenic in fish 389
tissues of marine origin by inductively coupled plasma mass spectrometry. Spectrochimica Acta - Part B 390
Atomic Spectroscopy. 61, 438-443. 391
Foster, S., Maher, W., Krikowa, F., Apte, S., 2007. A microwave-assisted sequential extraction of water and 392
dilute acid soluble arsenic species from marine plant and animal tissues. Talanta. 71, 537-549. 393
Francesconi, K.A., 2003. Complete extraction of arsenic species: A worthwhile goal? Applied Organometallic 394
Chemistry. 17, 682-683. 395
Francesconi, K.A., Edmonds, J.S., 1998. Arsenic Species in Marine Samples. Croat. Chem. Acta. 71, 343-359. 396
Francesconi, K.A., Kuehnelt, D., 2004. Determination of arsenic species: A critical review of methods and 397
applications, 2000-2003. Analyst. 129, 373-395. 398
Francesconi, K.A., Sperling, M., 2005. Speciation analysis with HPLC-mass spectrometry: Time to take stock. 399
Analyst. 130, 998-1001. 400
Ghassemzadeh, F., Babaee, F., Alavi, R., Arbab, Z., Mohammad, H., 2007. Phytoremediation of arsenic by 401
macroalga: implication in natural contaminated water, northeast Iran. J. Appl. Sci. 7, 1614-1619. 402
Hansen, H.K., Rojo, A., Ribeiro, A., Mateus, E., 2006. The use of Lessonia nigrescens as biosorbant for 403
Arsenic(V) removal. CHISA - Int. Congr. Chem. Process Eng. 404
Kabata-Pendias, A., Piotrowska, M., Dudka, S., 1997. Trace metals in Legumes and Monocotyledons and their 405
suitability for the assessment of soil contamination. In: Markert, B. (Ed.). Plants as Biomonitors. VCH 406
Publishers, New York, USA, pp. 485-494. 407
Knauer, K., Hemond, H., 2000. Accumulation and reduction of arsenate by the freshwater green alga Chlorella 408
sp (Chlorophyta). J. Phycol. 36, 506-509. 409
Koch, I., Feldmann, J., Wang, L., Andrewes, P., Reimer, K.J., Cullen, W.R., 1999. Arsenic in the Meager Creek 410
hot springs environment, British Columbia, Canada. Sci. Total Environ. 236, 101-117. 411
- 14 -
Koch, I., Wang, L., Ollson, C.A., Cullen, W.R., Reimer, K.J., 2000. The predominance of inorganic arsenic species 412
in plants from Yellowknife, Northwest Territories, Canada. Environmental Science and Technology. 34, 22-26. 413
Kohlmeyer, U., Jantzen, E., Kuballa, J., Jakubik, S., 2003. Benefits of high resolution IC-ICP-MS for the routine 414
analysis of inorganic and organic arsenic species in food products of marine and terrestrial origin. Anal. 415
Bioanal. Chem. 377, 6-13. 416
Llorente-Mirandes, T., Ruíz Chancho, M.J., Barbero, M., Rubio, R., López-Sánchez, J.F., 2010. Measurement of 417
arsenic compounds in littoral zone algae from the Western Mediterranean Sea. Occurrence of arsenobetaine. 418
Chemosphere. 81, 867-875. 419
Madsen, A.D., Goessler, W., Pedersen, S.N., Francesconi, K.A., 2000. Characterization of an algal extract by 420
HPLC-ICP-MS and LC-electrospray MS for use in arsenosugar speciation studies. J. Anal. At. Spectrom. 15, 657-421
662. 422
Ministerio de Salud Pública, 1969. Decreto 735: Reglamento Reglamento de los servicios de agua al consumo 423
humano. (versión 31 de julio de 2010). Boletín oficial de Chile. 424
Miyashita, S., Shimoya, M., Kamidate, Y., Kuroiwa, T., Shikino, O., Fujiwara, S., Francesconi, K.A., Kaise, T., 425
2009. Rapid determination of arsenic species in freshwater organisms from the arsenic-rich Hayakawa River in 426
Japan using HPLC-ICP-MS. Chemosphere. 75, 1065-1073. 427
Muñoz, O., Diaz, O.P., Leyton, I., Nuñez, N., Devesa, V., Súñer, M.A., Vélez, D., Montoro, R., 2002. Vegetables 428
collected in the cultivated Andean area of Northern Chile: Total and inorganic arsenic contents in raw 429
vegetables. J. Agric. Food Chem. 50, 642-647. 430
Polya, D.A., Lythgoe, P.R., Abou-Shakra, F., Gault, A.G., Brydie, J.R., Webster, J.G., Brown, K.L., Nimfopoulos, 431
M.K., Michailidis, K.M., 2003. IC-ICP-MS and IC-ICP-HEX-MS determination of arsenic speciation in surface and 432
groundwaters: Preservation and analytical issues. Mineral. Mag. 67, 247-261. 433
Queirolo, F., Stegen, S., Mondaca, J., Cortés, R., Rojas, R., Contreras, C., Munoz, L., Schwuger, M.J., Ostapczuk, 434
P., 2000a. Total arsenic, lead, cadmium, copper, and zinc in some salt rivers in the northern Andes of 435
Antofagasta, Chile. Sci. Total Environ. 255, 85-95. 436
Queirolo, F., Stegen, S., Restovic, M., Paz, M., Ostapczuk, P., Schwuger, M.J., Muñoz, L., 2000b. Total arsenic, 437
lead, and cadmium levels in vegetables cultivated at the Andean villages of northern Chile. Sci. Total Environ. 438
255, 75-84. 439
Reimer, K.J., Koch, I., Cullen, W.R., 2010. Organoarsenicals. Distribution and Transformation in the 440
Environment. In: Sigel, A., Sigel, H., Sigel, R. (Eds.). Organometallics in Environment and Toxicology. The Royal 441
Society of Chemistry, Cambridge, UK, pp. 165-229. 442
Robinson, B., Marchgetti, M., Moni, C., Schroeter, L., van den Dijssel, C., Milne, G., Bolan, N., Mahimairaja, S., 443
2006a. Arsenic accumulation by aquatic and terrestial plants. In: Smith, N.E., Owens, G., Bhattacharya, P., 444
Nadebaum, P. (Eds.). Managing Arsenic in the Environment. CSIRO Publications, Australia, pp. 235. 445
Robinson, B., Kim, N., Marchetti, M., Moni, C., Schroeter, L., van den Dijssel, C., Milne, G., Clothier, B., 2006b. 446
Arsenic hyperaccumulation by aquatic macrophytes in the Taupo Volcanic Zone, New Zealand. Environ. Exp. 447
Bot. 58, 206-215. 448
Romero, L., Alonso, H., Campano, P., Fanfani, L., Cidu, R., Dadea, C., Keegan, T., Thornton, I., Farago, M., 2003. 449
Arsenic enrichment in waters and sediments of the Rio Loa (Second Region, Chile). Appl. Geochem. 18, 1399-450
1416. 451
- 15 -
Rubio, R., Ruíz Chancho, M.J., López-Sánchez, J.F., 2010. Sample pre-treatment and extraction methods that 452
are crucial to arsenic speciation in algae and aquatic plants. TrAC, Trends Anal. Chem. 29, 53-69. 453
Ruíz Chancho, M.J., López-Sánchez, J.F., Rubio, R., 2010. Occurrence of arsenic species in the seagrass 454
Posidonia oceanica and in the marine algae Lessonia nigrescens and Durvillaea antarctica . J. Appl. Phycol. 22, 455
465-472. 456
Ruíz Chancho, M.J., López-Sánchez, J.F., Schmeisser, E., Goessler, W., Francesconi, K.A., Rubio, R., 2008. 457
Arsenic speciation in plants growing in arsenic-contaminated sites. Chemosphere. 71, 1522-1530. 458
Schaeffer, R., Francesconi, K.A., Kienzl, N., Soeroes, C., Fodor, P., Váradi, L., Raml, R., Goessler, W., Kuehnelt, 459
D., 2006. Arsenic speciation in freshwater organisms from the river Danube in Hungary. Talanta. 69, 856-865. 460
Šlejkovec, Z., Kápolna, E., Ipolyi, I., van Elteren, J.T., 2006. Arsenosugars and other arsenic compounds in 461
littoral zone algae from the Adriatic Sea. Chemosphere. 63, 1098-1105. 462
Smedley, P.L., Nicolli, H.B., Luo, Z.D., 2000. Arsenic in groundwaters from major aquifers: sources, effects and 463
potential mitigation. Brit. Geol. Surv. Tech. Rep. WC/99/38. 464
Stegen, S., Queirolo, F., Cortés, S., Pastenes, J., Ostapczuk, P., Backhaus, F., Moh, C., 2000. Use of the fresh 465
water plants Zannichellia pallustris and Myriophyllum acuaticum for biomonitoring of Cd, Pb and Cu in Anden 466
Rivers of Chile. Bol. Soc. Chil. Quím. 45, 449-459. 467
Thomson, D., Maher, W.A., Foster, S., 2007. Arsenic and selected elements in inter-tidal and estuarine marine 468
algae, south-east coast, NSW, Australia. Applied Organometallic Chemistry. 21, 396-411. 469
Tukai, R., Maher, W.A., McNaught, I.J., Ellwood, M.J., Coleman, M., 2002. Occurrence and chemical form of 470
arsenic in marine macroalgae from the east coast of Australia. Marine and Freshwater Research. 53, 971-980. 471
Vasquez, J.A., Guerra, N., 1996. The use of seaweeds as bioindicators of natural and anthropogenic 472
contaminants in northern Chile. Hydrobiologia. 326-327, 327-333. 473
Wang, J., Zhao, F.-., Meharg, A.A., Raab, A., Feldmann, J., McGrath, S.P., 2002. Mechanisms of arsenic 474
hyperaccumulation in Pteris vittata. Uptake kinetics, interactions with phosphate, and arsenic speciation. 475
Plant Physiol. 130, 1552-1561. 476
Zheng, J., Hintelmann, H., Dimock, B., Dzurko, M.S., 2003. Speciation of arsenic in water, sediment, and plants 477
of the Moira watershed, Canada, using HPLC coupled to high resolution ICP-MS. Anal. Bioanal. Chem. 377, 14-478
24. 479
480
Fig
ure
1.
Sa
mp
lin
g s
ite
s lo
cati
on
at
the
Lo
a R
ive
r a
nd
at
its
ma
in t
rib
uta
rie
s: S
an
Pe
dro
, Sa
lad
o a
nd
Sa
n S
alv
ad
or.
Fig
ure
2.
An
ion
ic (
a)
an
d c
ati
on
ic (
b)
exc
ha
ng
e c
hro
ma
tog
ram
s o
f a
Ch
ara
sp
. (L
O-2
) e
xtra
ct.
P.
pe
ctin
atu
s (L
O-4
) ch
rom
ato
gra
ms
fro
m a
nio
nic
(c)
an
d c
ati
on
ic (
d)
exc
ha
ng
e s
yst
em
s.
Fig
ure
ca
pti
on
s
Fig
ure
1
Click h
ere
to
do
wn
load
hig
h r
eso
luti
on
im
ag
e
Fig
ure
2
Click h
ere
to
do
wn
load
hig
h r
eso
luti
on
im
ag
e
Ta
ble
1.
Co
ord
ina
tes
an
d w
ate
r p
rop
ert
ies
of
the
sa
mp
lin
g s
ite
s 1
Sa
mp
lin
g S
ite
C
od
e
UT
M C
oo
rdin
ate
s
Zo
ne
19
S
He
igh
t
MA
SL
Da
te
Te
mp
era
ture
°C
pH
Ele
ctri
cal
Co
nd
uct
ivit
y
mS
cm
-1
Dis
solv
e
d O
xy
ge
n
mg
L-1
TD
S
g L
-1
Ha
rdn
ess
mg
Ca
CO
3 L
-1
To
tal
As
mg
L-1
PO
4 3
-
mg
L-1
Ea
st
No
rth
UP
PE
R L
OA
Loa
riv
er
in L
eq
ue
na
LO
-1
53
52
64
7
60
40
60
3
,25
0
3-J
un
-
20
10
9
.4
8.4
2
0.6
69
9
.2
1.9
0
49
0
0.2
20
<
0.7
78
Sa
n P
ed
ro r
ive
r in
Pa
rsh
all
1
SP
-1
56
54
49
7
57
07
27
3
,70
0
3-J
un
-
20
10
2
0.4
7
.41
0
.85
0
12
.6
2.5
8
61
0
0.4
56
-
SA
LA
DO
RIV
ER
To
con
ce r
ive
r b
efo
re S
en
do
s
Da
m
TO
-1
58
82
04
7
53
66
67
3
,44
5
4-J
un
-
20
10
7
.7
8.3
0
0.4
38
9
.6
1.8
4
50
4
0.6
70
-
Sa
lad
o r
ive
r in
Sif
ón
de
Ay
qu
ina
S
A-1
5
67
50
4
75
34
95
6
2,9
80
4
-Ju
n-
20
10
1
1.1
7
.27
5
.19
1
0.1
3
.98
6
90
0
.79
8
<0
.07
8
Mid
dle
LO
A
Loa
riv
er
in E
sco
ria
l LO
-2
51
05
30
7
51
81
37
2
,45
0
2-J
un
-
20
10
9
.2
8.0
5
7.1
5
8.7
4
.98
7
78
0
.71
0
0.3
46
Loa
riv
er
in L
a F
inca
LO
- 3
50
41
92
7
51
17
89
2
,10
0
2-J
un
-
20
10
1
2.2
8
.21
7
.65
8
.4
5.3
0
1,3
00
0
.89
7
0.2
99
Sa
n S
alv
ad
or
riv
er
be
fore
jun
ctio
n w
ith
Lo
a R
ive
r S
S-1
4
46
24
8
75
23
41
4
1,2
38
2
-Ju
n-
20
10
1
1.6
8
.27
8
.50
6
.3
6.2
1
1,3
80
1
.20
1
.79
0
LOW
ER
LO
A
Loa
riv
er
be
fore
ag
ricu
ltu
ral
are
a o
f Q
uil
lag
ua
LO
-4
44
30
87
7
60
57
80
8
02
1
-Ju
n-
20
10
1
3.2
7
.85
2
0.9
5
.5
10
.61
2
,16
0
1.4
0
1.0
17
TD
S=
to
tal
dis
solv
ed
so
lid
s; <
=b
elo
w d
ete
ctio
n l
imit
2
Ta
ble
Cli
ck
he
re t
o d
ow
nlo
ad
Ta
ble
: T
ab
le 1
.do
c
Ta
ble
2.
Ch
rom
ato
gra
ph
ic c
on
dit
ion
s u
sed
fo
r a
rse
nic
sp
eci
ati
on
. 1
2
A
nio
n e
xch
an
ge
C
ati
on
ex
cha
ng
e
Co
lum
n
PR
P-X
10
0 (
25
0 m
m x
4.1
mm
, 1
0 µ
m)
Zo
rba
x S
CX
30
0 (
25
0 m
m x
4.6
mm
, 5
µm
)
(H
am
ilto
n,
Re
no
, U
SA
) (A
gil
en
t, W
ald
bro
nn
, G
erm
an
y)
Pre
co
lum
n
PR
P-X
10
0 (
20
mm
x 2
.0 m
m,
10
µm
) Z
orb
ax S
CX
30
0 (
12
.5 m
m x
4.6
mm
, 5
µm
)
Mo
bil
e p
ha
se
NH
4H
2P
O4 2
0 m
M
Py
rid
ine
20
mM
pH
5
.8
2.6
Inje
ctio
n v
olu
me
2
0 µ
L 2
0 µ
L
Flo
w r
ate
1
.5 m
L m
in-1
1
.5 m
L m
in-1
Co
lum
n t
em
pe
ratu
re
Ro
om
te
mp
era
ture
R
oo
m t
em
pe
ratu
re
As
spe
cie
s A
s (I
II),
DM
A,
MA
, A
s (V
),
PO
4-s
ug
, S
O3-s
ug
an
d S
O4-s
ug
A
B,
TM
AO
, A
C a
nd
gly
-su
g
Ta
ble
Cli
ck
he
re t
o d
ow
nlo
ad
Ta
ble
: T
ab
le 2
.do
c
Ta
ble
3.
Leve
ls o
f to
tal A
s a
nd
ars
en
ic s
pe
cie
s in
alg
ae
an
d a
qu
ati
c p
lan
ts (
me
an
± s
tan
da
rd d
ev
iati
on
, n
=3
, d
.w.)
, e
xtra
ctio
n e
ffic
ien
cy a
nd
co
lum
n r
eco
ve
rie
s.
1
Sa
mp
le
Sa
mp
lin
g
Sit
e
As
To
tal
mg
As
kg
-1
As
(III
)A
mg
As
kg
-1
DM
A
mg
As
kg
-1
MA
mg
As
kg
-1
As
(V)
mg
As
kg
-1
gly
-su
g
mg
As
kg
-1
iAsB
mg
As
kg
-1
Ex
tra
ctio
n
eff
icie
ncy
An
ion
ic c
olu
mn
reco
ve
ry
Ca
tio
nic
co
lum
n
reco
ve
ryD
Za
nn
ich
ellia
pa
lust
ris
L.
LO-1
7
9 ±
5
13
.5 ±
1.4
-
- 6
.7 ±
0.8
-
20
± 2
3
2%
8
0%
9
4%
Azo
lla
sp
. LO
-1
19
9 ±
12
Myri
op
hyllu
m a
qu
ati
cum
L.
SP
-1
20
9 ±
11
5
6 ±
1
- -
80
± 1
-
13
6 ±
3
67
%
96
%
86
%
Po
tam
og
eto
n p
ect
ina
tus
L.
TO
-1
20
± 2
0
.9 ±
0.4
0
.2 ±
0.0
1
- 7
.5 ±
0.2
0
.84
± 0
.04
8
.4 ±
0.6
8
0%
6
0%
9
7%
Ru
pp
ia f
ilif
olia
Sk
ott
sb.
TO
-1
23
± 2
0
.6 ±
0.1
0
.53
± 0
.05
-
4.1
± 0
.3
0.5
2 ±
0.0
4
4.7
± 0
.4
34
%
73
%
93
%
Ph
yllo
scir
pu
s cf
. d
ese
rtic
ola
(Ph
il.)
Dh
oo
ge
& G
oe
tgh
. S
A-1
4
9 ±
3
12
± 4
-
- 3
6 ±
6
- 4
9 ±
3
12
7%
7
8%
8
0%
Cla
do
ph
ora
sp
. S
A-1
1
1,1
00
± 3
00
2
± 1
-
- 3
89
± 7
-
39
1 ±
8
5%
6
7%
7
5%
Ch
ara
sp
. LO
-2
34
1 ±
6
3.8
8 ±
0.0
9
0.1
4 ±
0.0
1
- 2
8.2
± 0
.8
0.9
3 ±
0.0
2
31
± 2
1
3%
7
3%
9
7%
Po
tam
og
eto
n p
ect
ina
tus
L.
LO-3
1
34
± 1
1
5.7
± 0
.9
0.1
7 ±
0.0
1
- 5
7 ±
4
de
tect
ed
7
3 ±
4
77
%
71
%
10
0%
Cla
do
ph
ora
sp
. S
S-1
1
82
± 7
4
± 1
d
ete
cte
d
0.3
1 ±
0.0
2
64
± 4
-
68
± 5
5
3%
7
3%
9
2%
Po
tam
og
eto
n p
ect
ina
tus
L.
LO-4
2
48
± 2
4
.6 ±
0.2
-
- 1
30
± 2
-
13
5 ±
1
58
%
94
%
92
%
Lim
it o
f d
ete
ctio
n
0
.00
3
0.0
2
0.0
3
0.0
5
0.0
8
0.1
5
Lim
it o
f q
ua
nti
fica
tio
n
0
.01
0
.07
0
.11
0
.15
0
.28
0
.49
A A
s (I
II)
as
the
su
btr
act
ion
of
the
su
m o
f ca
tio
nic
sp
eci
es
fro
m t
he
fro
nt
of
an
ion
ic e
xch
an
ge
ch
rom
ato
gra
ms.
As(
III)
pe
ak c
oe
lute
s w
ith
ca
tio
nic
ars
en
ica
ls.
2
B I
no
rga
nic
ars
en
ic (
iAs)
as
the
su
m o
f a
rse
na
te a
nd
ars
en
ite
. 3
Ta
ble
Cli
ck
he
re t
o d
ow
nlo
ad
Ta
ble
: T
ab
le 3
.do
c
Ta
ble
4.
Da
ta r
ep
ort
ed
fo
r si
mil
ar
fre
shw
ate
r a
lga
e a
nd
pla
nts
fro
m d
iffe
ren
t lo
cati
on
s.
1
Sa
mp
le
Sa
mp
lin
g s
ite
A
s in
wa
ter
(µg
L-1
)
As
in
sam
ple
(mg
kg
-1)
Sp
eci
ati
on
A
Re
fere
nce
Cla
do
ph
ora
sp
. (f
resh
) D
an
ub
e R
ive
r,
Hu
ng
ary
1
.1 ±
0.2
9
.33
+
S
cha
eff
er,
et
al.
, 2
00
6
Cla
do
ph
ora
sp
. (s
un
-
dri
ed
)
Da
nu
be
Riv
er,
Hu
ng
ary
1
.1 ±
0.2
5
.06
+
S
cha
eff
er,
et
al.
, 2
00
6
Cla
do
ph
ora
glo
me
rata
Pil
g.
Ha
ya
ka
wa
Riv
er,
Jap
an
1
7
18
+
M
iya
shit
a,
et
al.
, 2
00
9
Cla
do
ph
ora
glo
me
rata
Pil
g.
Wa
di
Ha
nif
ah
,
Riy
ad
h,
Sa
ud
i A
rab
ia
- 0
.45
–
18
.48
-
Al-
Ho
ma
ida
n,
et
al.
, 2
01
1
Myri
op
hyll
um
aq
ua
ticu
m
(Ve
ll.)
Ve
rdc.
Lo
a R
ive
r, C
hil
e
-
9
0-9
00
-
Ste
ge
n,
et
al.
, 2
00
0
Myri
op
hylu
m s
p.
Da
nu
be
Riv
er,
Hu
ng
ary
1
.1 ±
0.2
5
.42
+
Sch
ae
ffe
r, e
t a
l.,
20
06
Ch
ara
vu
lga
ris
L.
Ch
elp
a R
ive
r, I
ran
1
50
2
12
.5 ±
0.4
-
Gh
ass
em
zad
eh
, e
t a
l.,
20
07
Sci
rpu
s sp
.
Me
ag
er
Cre
ek
ho
t
spri
ng
s, C
an
ad
a
(19
96
)
30
3
7.1
+
K
och
, e
t a
l.,
19
99
Sci
rpu
s sp
.
Me
ag
er
Cre
ek
ho
t
spri
ng
s, C
an
ad
a
(19
97
)
28
6
4.5
+
K
och
, e
t a
l.,
19
99
Za
nn
ich
ell
ia p
alu
stri
s L.
Lo
a R
ive
r, C
hil
e
- 6
00
- 8
00
-
Ste
ge
n,
et
al.
, 2
00
0
A:
(+) R
ep
ort
ed
(-) N
ot
rep
ort
ed
2
3
Ta
ble
Cli
ck
he
re t
o d
ow
nlo
ad
Ta
ble
: T
ab
le 4
.do
c
Ta
ble
5.
Bio
acc
um
ula
tio
n c
oe
ffic
ien
ts (
BC
) e
stim
ate
d a
s th
e r
ati
os
of
tota
l a
rse
nic
in
th
e s
am
ple
to
th
e a
rse
nic
in
wa
ter
Sa
mp
lin
g p
oin
t A
lga
, a
qu
ati
c p
lan
t A
s (d
w)
mg
As
kg
-1
As
in w
ate
r
mg
As
kg
-1
BC
LO-1
Z
an
nic
he
llia
pa
lust
ris
79
0
.22
0
35
9
A
zoll
a s
p.
19
9
9
05
SP
-1
Myri
op
hyll
um
aq
ua
ticu
m
20
9
0.4
56
4
58
TO
-1
Po
tam
og
eto
n p
ect
ina
tus
20
0
.67
0
30
R
up
pia
fil
ifo
lia
2
3
3
4
SA
-1
Ph
yll
osc
irp
us
cf.
de
sert
ico
l
49
0
.79
8
61
C
lad
op
ho
ra s
p.
11
10
0
1
39
10
LO-2
C
ha
ra s
p.
34
1
0.7
10
4
80
LO-3
P
ota
mo
ge
ton
pe
ctin
atu
s 1
34
1
.89
7
71
SS
-1
Cla
do
ph
ora
sp
. 1
82
1
.20
1
52
LO-4
P
ota
mo
ge
ton
pe
ctin
atu
s 2
48
1
.40
1
77
Ta
ble
5
Cli
ck
he
re t
o d
ow
nlo
ad
Ta
ble
: T
ab
le 5
.do
c