Embed Size (px)
Citation preview
Occipital Cortex of Blind Individuals Is FunctionallyCoupled with Executive Control Areas of
Frontal Cortex
Ben Deen, Rebecca Saxe, and Marina Bedny
Abstract
■ In congenital blindness, the occipital cortex responds toa range of nonvisual inputs, including tactile, auditory, andlinguistic stimuli. Are these changes in functional responsesto stimuli accompanied by altered interactions with non-visual functional networks? To answer this question, we intro-duce a data-driven method that searches across cortex forfunctional connectivity differences across groups. Replicatingprior work, we find increased fronto-occipital functional con-nectivity in congenitally blind relative to blindfolded sightedparticipants. We demonstrate that this heightened connectivityextends over most of occipital cortex but is specific to a sub-
set of regions in the inferior, dorsal, and medial frontal lobe.To assess the functional profile of these frontal areas, we usedan n-back working memory task and a sentence comprehen-sion task. We find that, among prefrontal areas with overcon-nectivity to occipital cortex, one left inferior frontal regionresponds to language over music. By contrast, the majorityof these regions responded to working memory load but notlanguage. These results suggest that in blindness occipital cor-tex interacts more with working memory systems and raisenew questions about the function and mechanism of occipitalplasticity. ■
INTRODUCTION
The human brain has a remarkable capacity for reorgani-zation. Studies of occipital cortex function in congenitallyblind individuals provide a key example of such corticalplasticity: Cortex normally recruited for vision insteadresponds to nonvisual input. The occipital cortex of con-genitally blind individuals responds to tactile (Weaver &Stevens, 2007; Ptito, Moesgaard, Gjedde, & Kupers, 2005;Sadato, Okada, Kubota, & Yonekura, 2004; Sadato et al.,1996) and auditory stimuli (Collignon et al., 2011; Weaver& Stevens, 2007; Gougoux, Zatorre, Lassonde, Voss, &Lepore, 2005; Kujala et al., 2005). In addition, occipitalcortex is active during high-level cognitive tasks, suchas reading Braille, listening to sentences, generatingverbs to heard nouns, and verbal recall (Bedny, Pascual-Leone, Dodell-Feder, Fedorenko, & Saxe, 2011; Amedi,Raz, Pianka, Malach, & Zohary, 2003; Burton, Snyder,Conturo, et al., 2002; Burton, Snyder, Diamond, &Raichle, 2002; Röder, Stock, Bien, Neville, & Rösler,2002; Sadato et al., 1996). These studies suggest that,in the absence of visual input, occipital areas acquirenovel, nonvisual cognitive functions.Early blindness also alters the interactions of occipital
cortex with other cortical areas. Evidence for this comesfrom studies of resting state functional connectivity MRI
(fcMRI), which measures temporal correlations betweenhemodynamic signals from different brain regions, in theabsence of a task (Biswal, Yetkin, Haughton, & Hyde,1995). Previous fcMRI studies of blind individuals con-verge on a surprising finding: Rather than increasedfunctional connectivity to nonvisual sensory areas, theoccipital cortex of early blind adults shows increased func-tional connectivity to regions of pFC (Watkins et al., 2012;Bedny et al., 2011; Liu et al., 2007).
A key open question concerns which regions withinprefrontal and occipital cortices have increased connec-tivity in the blind. pFC contains regions associated withmultiple distinct functional networks. For example, in-ferior frontal regions respond specifically to language(Fedorenko, Behr, & Kanwisher, 2011) and are function-ally connected to temporal language regions; other pre-frontal regions are active during working memory andcognitive control tasks (Fedorenko, Duncan, & Kanwisher,2013; Duncan & Owen, 2000) and are functionally con-nected to parietal regions. Blindness could affect con-nectivity of occipital areas with frontal components ofone or more specific functional networks, or it couldnonspecifically increase connectivity between occipitalcortex and frontal cortex. Characterizing these connectivitychanges could provide insight into the mechanisms ofblindness-related plasticity.
One challenge in addressing this question is the needto characterize the anatomical layout of fronto-occipitalMassachusetts Institute of Technology
© 2015 Massachusetts Institute of Technology Journal of Cognitive Neuroscience 27:8, pp. 1633–1647doi:10.1162/jocn_a_00807
connections in an unbiased manner. Most investigationsof functional connectivity in blindness use predefined“seed” regions and thus depend on prior assumptionsabout which regions are altered (Bedny et al., 2011;Bedny, Konkle, Pelphrey, Saxe, & Pascual-Leone, 2010).Such approaches might miss other regions with alteredfunctional connectivity. Independent component analysishas also been used to assess group differences in func-tional connectivity. Unlike seed-based methods, this ap-proach is data driven and does not require a predefinedseed region. However, this method also has limitations.Typical methods for group comparison using indepen-dent component analysis involve assessing correlationsbetween individual voxels’ time series and a network-wide time course. This does not directly assess pairwiseconnections between specific regions and thus couldmiss differences in specific connections.
Here we introduce a data-driven approach for dis-covering regions with group differences in functionalconnectivity: the group difference count (GDC) method.We first compute correlations between all fronto-occipitalvoxel pairs and then search for voxels with a significantlylarge number of group differences. This approach allowsus to discover regions with group differences in functionalconnectivity without predefined seeds. Next, we askedwhether prefrontal regions with increased functionalconnectivity belong to the language or executive controlnetwork by measuring their responses in a languagecomprehension task and an n-back working memorytask.
METHODS
Participants
Participants were 13 congenitally blind adults (mean age =43.6 years, SD = 15.8, range = 24–62 years, 6 women)and 23 sighted adults (mean age = 39.5 years, SD = 11.9,range = 18–59 years, 12 women; further demographicdata in Table 1). Blind participants had vision loss frombirth, caused by abnormality at or anterior to the opticchiasm (i.e., not due to brain damage). All blind partici-pants reported, at most, faint light perception, with 10 of13 participants having no light perception at the time ofthe study. Detailed demographic information about blindparticipants is provided in Table 2. Sighted participantshad normal or corrected vision. None of the participantshad any history of neurological or psychiatric impairment,and all were fluent English speakers. All participants gavewritten, informed consent, in accordance with the Com-mittee on the Use of Humans as Experimental Subjectsat MIT.
Resting state data were collected from 12 blind partic-ipants and 21 sighted participants, and task data werecollected from 13 blind participants and 16 sighted partic-ipants. No significant group differences were found inage, mean frame-to-frame translation or rotation, number
of volumes removed from the data set ( p > .05, two-sample t test), gender, or handedness ( p > .05, Fisher’sexact test).
Paradigm
Sighted adults wore total light exclusion blindfolds toeliminate external visual stimulation. Blind participantsdid not wear blindfolds; however, lights in the scannerroom were turned off during this scan. During restingstate scans, participants were instructed to relax and stayas still as possible without falling asleep; additionally,sighted participants were asked to keep their eyes closed.Resting state scans lasted 6.2 min.For the language task, during each trial, participants
listened to a 20-sec-long clip from one of three conditions:a story in English (language), a story in a foreign language(foreign), or instrumental music (music). They then heardthe question, “Does this come next?” (1.5 sec), followed bya probe clip (3 sec). For the language condition, the probeeither fit or did not fit with the plot of the preceding story.For the foreign condition, the probe was either in thesame or a different language as the preceding story. Forthe music condition, the probe either contained the samemelody and instrument as the preceding clip or a differ-ent melody and instrument. During the response period(6.5 sec), yes/no responses were provided by right/ leftbutton presses, followed by 5-sec intertrial interval. Thelanguage condition comprised three subconditions (storieswith mental, social, or physical content), which are col-lapsed in the present analyses. Foreign languages included
Table 1. Participant Demographics
Blind Sighted
Rest
Age (years) 44.7 (15.9) 39.0 (12.4)
Sex 6/12 F 10/21 F
Handedness 10/12 R 21/21 R
Mean translation (mm) 0.26 (0.21) 0.16 (0.10)
Mean rotation (mm) 0.16 (0.14) 0.12 (0.13)
Volumes removed 3.1 (9.2) 1.1 (3.9)
Task
Age (years) 43.6 (15.8) 43.8 (12.1)
Sex 6/13 F 7/16 F
Handedness 10/13 R 16/16 R
Mean translation (mm) 0.21 (0.08) 0.19 (0.05)
Mean rotation (mm) 0.09 (0.08) 0.06 (0.05)
Volumes removed 5.2 (8.1) 4.9 (8.7)
1634 Journal of Cognitive Neuroscience Volume 27, Number 8
Hebrew, Russian, and Korean; no participant had any pro-ficiency in any of these languages. Each run consisted of10 trials (6 language, 2 foreign, and 2 music) in counter-balanced order and three resting periods (12 sec each),for a total of 6.6 min. Participants received three to fourruns of the task. Further details on this task can be foundin Gweon, Dodell-Feder, Bedny, and Saxe (2012).The auditory n-back task consisted of three conditions:
n = 1, 2, and 3. Each 24-sec-long block included a pause(0.5 sec), an instruction phase specifying the value of n(3.5 sec), and then 10 trials (an individual English letter[0.5 sec] followed by an intertrial interval [1.5 sec]).Participants were instructed to press a button when theletter matched the letter presented in trials earlier; tar-gets occurred three times per block. Conditions werecounterbalanced across runs and participants. Each runconsisted of 18 blocks, separated by rest periods (12 sec),for a total of 10.8 min. Participants received two runs ofthis task.
Data Acquisition
Images were acquired on a Siemens 3T Magnetom Trioscanner (Erlangen, Germany) using a 12-channel headcoil. High-resolution T1-weighted anatomical images wereacquired using a MPRAGE pulse sequence (repetition time[TR] = 2 sec, echo time [TE] = 3.39 msec, flip angle α =9°, field of view [FOV]= 256mm,matrix = 256× 192, slice
thickness = 1.33 mm, 128 near-axial slices, accelerationfactor = 2, 48 reference lines). Task functional data wereacquired using a T2*-weighted EPI pulse sequence sensi-tive to BOLD contrast (TR = 2 sec, TE = 30 msec, α= 90°,FOV = 200 mm, matrix = 64 × 64, slice thickness =4 mm, 30 near-axial slices). Resting state functional datawere acquired using a T2*-weighted EPI pulse sequence(TR = 6 sec, TE = 30 msec, α = 90°, FOV = 256 mm,matrix = 128 × 128, slice thickness = 2 mm, 67 near-axialslices). Resting data were acquired at higher resolu-tion (2 mm isotropic) to reduce the relative influence ofphysiological noise (Triantafyllou, Hoge, & Wald, 2006;Triantafyllou et al., 2005). This necessitated a somewhathigh TR, which is justified by the observation that mostof the power in resting state fluctuations is in frequencieslower than our sampling rate.
Data Preprocessing
Data were processed using the FMRIB Software Library(FSL), version 4.1.8, along with custom MATLAB scripts.Functional data were motion-corrected using rigid bodytransformations to the middle image in each 4-D data set,corrected for interleaved slice timing using sinc inter-polation, spatially smoothed with a 5-mm FWHM Gaussiankernel, and high-pass filtered (Gaussian-weighted leastsquares fit straight line subtraction, with σ = 50 sec;Marchini & Ripley, 2000). Functional images were linearly
Table 2. Blind Participant Information
Participant Age SexOnset of
Vision Loss Cause of Blindness Residual Light Perception
Age Startedto LearnBraille T/R
B1 58 M Birth ROP None. Had LP until age 20. 6 T + R
B2 41 M Birth Unknown, nerve disconnectbetween eyes and brain
None 5 T + R
B3 41 M Birth Retinoblastoma None 5.5 T + R
B4 25 F Birth Unattached optic nerve None 4 T + R
B5 64 F Birth Malformation of optic nerve Tiny LP in corner of one eye.Had slightly more LP as atoddler.
4 T + R
B6 30 M Birth Optic nerve hypoplasia Some LP in both eyes 7 T
B7 32 M Birth ROP None 5 T + R
B8 62 F Birth ROP Minimal LP, previously had more. 6 T + R
B9 57 F Birth ROP None 6 T + R
B10 62 F Birth ROP None 6 or before T + R
B11 25 F Birth ROP None 3 T + R
B12 24 M Birth Anopthalmia None 4 T + R
B13 38 M Birth Leber’s congenital amaurosis None 5 T + R
M = male; F = female; ROP = retinopathy of prematurity; LP = light perception; T = task; R = rest.
Deen, Saxe, and Bedny 1635
registered to anatomical images using FMRIB’s linear im-age registration tool followed by Freesurfer’s bbregister(Greve & Fischl, 2009). Anatomical images were nor-malized to the Montreal Neurological Institute (MNI)-152template brain using FMRIB’s nonlinear registration tool.
We used three procedures to reduce the influence ofphysiological and motion-related noise. First, six motionparameters estimated during motion correction wereremoved from the data via linear regression. Second,signals from white matter and cerebrospinal fluid were re-moved using the CompCorr procedure (Chai, Castañón,Ongür, & Whitfield-Gabrieli, 2012; Behzadi, Restom, Liau,& Liu, 2007). The first four principal components, as wellas the mean signal, were extracted for individually de-fined white matter and cerebrospinal fluid masks and re-moved from the data via linear regression. Third, pairsof volumes with more than 1.2 mm of translation or 1.2°of rotation between them were removed from subsequentanalysis (Power, Barnes, Snyder, Schlaggar, & Petersen,2012).
Resting State Data Analysis
We introduce a data-driven method for identifying groupdifferences in functional connectivity. We focus on corre-lations between ipsilateral frontal and occipital cortices,which are thought to be altered in blindness (Watkinset al., 2012). Specifically, we search for occipital voxelsthat have group differences in connectivity with a largenumber of frontal voxels and frontal voxels that havegroup differences with a large number of occipital voxels.This approach will be referred to as the GDC method.
Left and right frontal and occipital gray matter maskswere defined using regions provided in the MNI structuralatlas, thresholded at a probability of .5. For each partici-pant and hemisphere, a matrix of functional connectivitystrengths between all frontal voxels and all occipital voxelswas computed by regressing time series from frontal vox-els on time series from occipital voxels. Group differences(blind > sighted) were computed using a two-samplet test on beta values for each pair of voxels, thresholdedat p < .01, one-tailed. For each frontal voxel, the totalnumber of ipsilateral occipital voxels for which it hada group difference in functional connectivity (the GDCstatistic) was computed; likewise, for each occipital voxel,the total number of ipsilateral frontal voxels with group dif-ferences was computed.
We then used a permutation test to build a null dis-tribution for GDC values. In each of 500 iterations (sepa-rately for each hemisphere), group assignment wasrandomized. For each voxel, the GDC statistic was com-puted and contributed to a null histogram for eitherfrontal or occipital voxels. The resulting null distributionswere then thresholded at p < .01.
Lastly, we used a cluster size threshold to correct formultiple comparisons across voxels (Forman et al., 1995).To determine this threshold, another permutation test
was performed in the same way, but as an additional step,the computed GDC threshold was applied to define clus-ters. The resulting null distributions for cluster size werethresholded at p < .01 to determine a cluster size cutoff.This procedure was analogous to standard nonparametricapproaches to generating a cluster size threshold (Winkler,Ridgway, Webster, Smith, & Nichols, 2014; Nichols &Holmes, 2002). The resulting cluster size cutoffs were 22(left hemisphere) and 21 (right hemisphere) for occipitalcortex and 42 (left hemisphere) and 35 (right hemisphere)for frontal cortex.The GDC analysis produced a map of voxels showing
increased fronto-occipital correlations in blind individualsas compared to the sighted control group. On the basisof these results, we defined frontal and occipital ROIstermed group difference (GD) ROIs. Each ROI consistedof all suprathreshold voxels within a 7.5-mm-radius spherearound a local peak statistic. In addition, to determinewhether null effects would replicate in independent data,we defined non-group difference (NGD) ROIs: 7.5-mm-radius spheres surrounding local minima of the GD statis-tic from the resting analysis, intersected with the graymatter mask.Additionally, to look at group differences in functional
connectivity between occipital cortex and other parts ofthe brain and to test whether our results in frontal cortexwould replicate in a bilateral analysis, we applied theGDC analysis to bilateral occipito-temporal, parieto-occipital, and fronto-occipital connections. Specifically,we applied the GDC method described above usingthree new pairs of masks: bilateral temporal and bilateraloccipital cortex, bilateral parietal and bilateral occipitalcortex, and bilateral frontal and bilateral occipital cortex.Data analysis and thresholding were the same as de-scribed above. This approach identifies voxels in tem-poral, parietal, and frontal cortex with significantly manygroup differences in functional connections with theoccipital lobe. Using these results, GD ROIs for parietaland temporal cortex were defined in the manner de-scribed above.
Task Residual Data Analysis
To replicate and evaluate functional connectivity betweenoccipital and frontal ROIs, we measured correlationsbetween the ROIs in two independent data sets (the lan-guage and n-back task data, after removing task-evokedresponses via linear regression). Whole-brain generallinear model (GLM)-based analyses were used to modeltask-evoked responses (see Task Data Analysis sectionbelow), and subsequent functional connectivity analyseswere performed on the residuals from this model. Forresidual extraction, the models differed in two ways: tem-poral derivatives were not included, and autocorrelationcorrection was not performed. Additionally, nuisanceremoval was performed in the same way as for restingstate data.
1636 Journal of Cognitive Neuroscience Volume 27, Number 8
We extracted mean time series in each ROI and com-puted a matrix of correlations between each pair of ROIsfor each participant. To assess group differences in corre-lation strengths, a multiple regression was performed foreach pair of ROIs, with Fisher-transformed correlationvalues as the response, group as the predictor of interest,and age, mean translation, and mean rotation as nuisancecovariates. Group differences were assessed using at test. We focused on group differences that were con-sistent across the two data sets (both p < .05), becauseany effects observed in only one data set may result fromimperfectly modeled evoked responses and/or differ-ences in “background connectivity” induced by each task(Al-Aidroos, Said, & Turk-Browne, 2012).
Hemispheric Differences inFunctional Connectivity
We next investigated how fronto-occipital correlations inblind individuals varied by hemisphere, using correla-tions computed from task residual data. We thus used alinear mixed model to compare correlations in four cate-gories: left frontal to left occipital (LF-LO), right frontalto right occipital (RF-RO), right frontal to left occipital(RF-LO), and left frontal to right occipital (LF-RO). Thedependent variable for this model consisted of Fisher-transformed correlation values for all 70 frontal-occipitalGD ROI pairs and all 13 blind participants, averaged acrossthe two data sets (language and n-back tasks). A one-wayANOVA with four levels was used, parameterized with thefollowing regressors: (1) an intercept term, (2) a regressorcomparing ipsilateral with contralateral correlations, (3) aregressor comparing LF-LO with RF-RO correlations, and(4) a regressor comparing RF-LO with LF-RO correlations.Random effect terms for all regressors were included,because this minimized Aikake and Bayesian informationcriteria among models with random effect terms for dif-ferent subsets of regressors. Individual comparisons weretested using a Wald test, with the normal approximationjustified by the large number of degrees of freedom inthe model.
Task Data Analysis
To functionally characterize regions with increased con-nectivity to occipital cortex, we used task responses andresting data. For the task data, whole-brain GLM-basedanalyses were performed for each participant and eachrun of the language and n-back tasks. Regressors weredefined as boxcar functions, convolved with a canonicaldouble-gamma hemodynamic response function. For thelanguage task, there were regressors for the five condi-tions (3 language, 1 foreign, and 1 music) peaking duringthe 20-sec story period, as well as a response regressor,collapsed across conditions, peaking during the remain-ing 16 sec of each trial. For the n-back task, there wereregressors for 1-, 2-, and 3-back conditions, each peaking
during the 20-sec task blocks (excluding the instructionphase). Additionally, temporal derivatives of each regressorwere included, and all regressors were high-pass filtered.FMRIB’s improved linear model was used to correct fortemporal autocorrelation (Woolrich, Ripley, Brady, &Smith, 2001).
Fitted beta values were extracted from each frontal,parietal, and temporal ROI identified by the GDC method.In each ROI, we performed paired one-tailed t tests com-paring responses to language versus music and 2-backversus 1-back. Qualitatively identical results for the one-tailed comparison were obtained using language versusforeign and language versus foreign + music contrasts,as well as 3-back versus 1-back and 3-back + 2-back versus1-back contrasts. Additionally, to test the hypothesis thattask responses differ across frontal regions and to testfor possible effects of Group, we performed a repeated-measures ANOVA on the contrast values from frontal ROIs.Contrast (language or working memory) and ROI wereincluded as within-participant factors, and Group wasincluded as a between-participant factor.
Functional Connectivity of Left Frontal Regions
Finally, we used resting data to assess the typical func-tional connectivity patterns of left frontal regions identifiedby the GDC analysis in typical individuals. Resting statedata were preprocessed as described above. Time seriesfrom left frontal ROIs were extracted for each sightedparticipant and used as regressors in whole-brain GLM-based analyses, along with their temporal derivatives.Within-participant results were combined across par-ticipants with a mixed effects model, using FSL’s LocalAnalysis of Mixed Effects Stage 1 (Woolrich, Behrens,Beckmann, Jenkinson, & Smith, 2004). Results werethresholded with an initial voxelwise cutoff of p < .01.Subsequently, correction for multiple comparisons wasperformed using a cluster size cutoff based on Gaussianrandom field theory (Friston, Worsley, Frackowiak,Mazziotta, & Evans, 2004) with a cluster-wise threshold ofp < .05.
RESULTS
Which Occipital and Frontal Areas ShowConnectivity Changes?
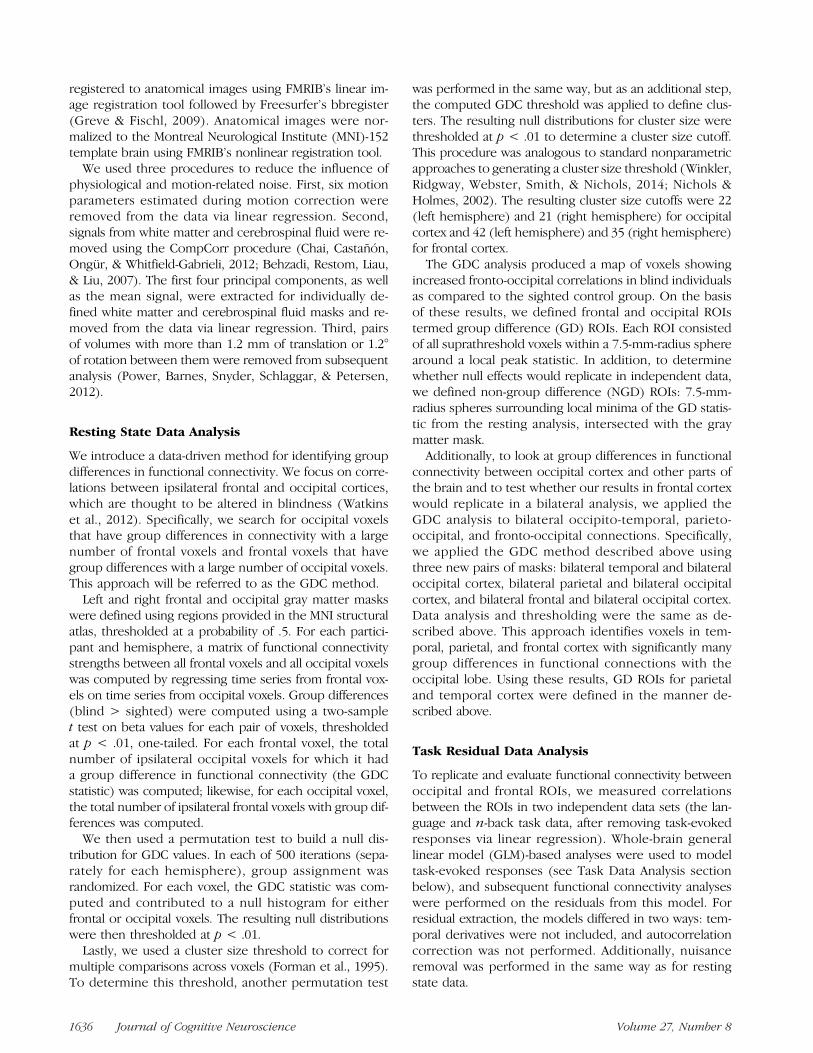
Results from the GDC analysis are shown in Figure 1. Inthe left occipital lobe, a large area of cortex was found tohave stronger connectivity with left frontal cortex in blindas compared to sighted participants. Increased correla-tions were observed in nearly all of the lingual gyrus(termed left medial occipital cortex, LMOC), along theventral surface in the fusiform gyrus (LFus) and alongthe lateral occipital surface in the lateral occipital sulcusand surrounding gyri (left lateral occipital cortex, LLOC),
Deen, Saxe, and Bedny 1637
and superiorly to the inferior aspect of the intraparietalsulcus (left superior occipital cortex, LSOC).
In the left pFC, we observed increased correlationsmedially in the pre-SMA (LMSFC) and medial pFC(LMPFC). Laterally, effects were observed along muchof the precentral sulcus (LPCS), the posterior part ofthe inferior frontal sulcus (IFS), as well as smaller areaswithin the superior frontal sulcus (LSFS) and inferiorfrontal gyrus (LIFG). A similar but weaker pattern ofgroup differences was observed in the right hemisphere,with no effect in RIFG.
As a proportion of voxels in the corresponding graymatter mask, we found higher fronto-occipital correla-
tions in blind individuals for 36% of voxels in left occi-pital cortex (3026/8420), 19% of voxels in left frontalcortex (2435/12563), 14% of voxels in right occipital cor-tex (747/5518), and 8% of voxels in right frontal cortex(1092/13867), demonstrating clear left-lateralization ofthe effects.To assess group differences in functional connections
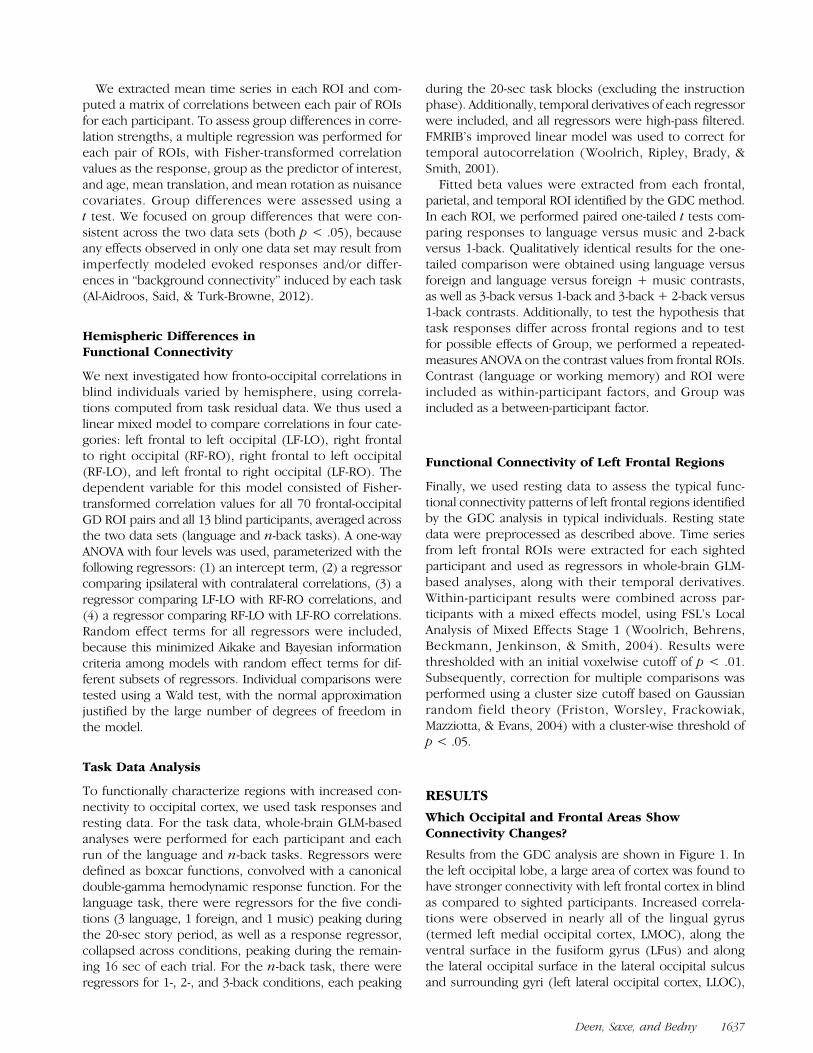
between occipital lobe and other parts of the brain, we nextperformed GDC analyses for bilateral occipito-temporal,parieto-occipital, and fronto-occipital connections (Figure 2).Frontal regions with altered connectivity were virtuallyidentical to those observed in the prior analysis, indicatingthat these findings are robust to the choice of whether toconsider bilateral or just ipsilateral fronto-occipital connec-tions. Additionally, in the parietal lobe, regions in the bilat-eral intraparietal sulcus and inferior parietal lobe (IPS) andleft posterior-to-middle cingulate cortex were found tohave increased functional connectivity with occipital cortexin blindness. In the temporal lobe, a region of bilateral pos-terior inferior temporal sulcus and gyrus was also foundto have increased functional connectivity.
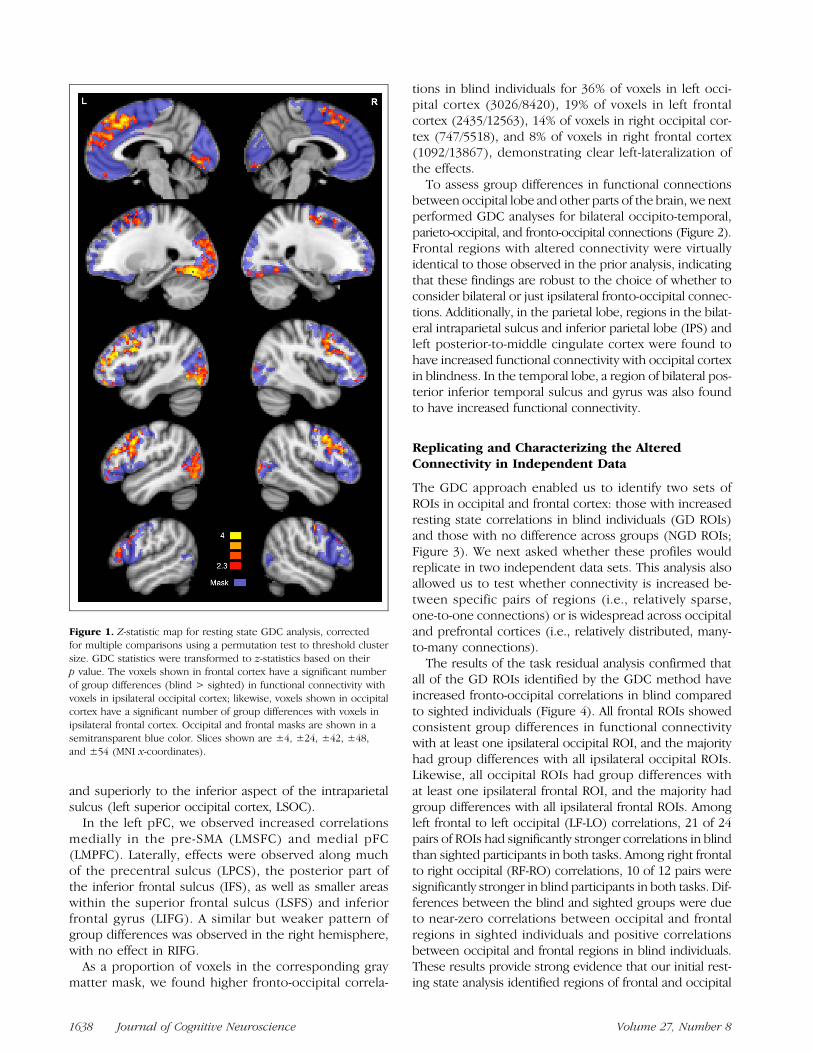
Replicating and Characterizing the AlteredConnectivity in Independent Data
The GDC approach enabled us to identify two sets ofROIs in occipital and frontal cortex: those with increasedresting state correlations in blind individuals (GD ROIs)and those with no difference across groups (NGD ROIs;Figure 3). We next asked whether these profiles wouldreplicate in two independent data sets. This analysis alsoallowed us to test whether connectivity is increased be-tween specific pairs of regions (i.e., relatively sparse,one-to-one connections) or is widespread across occipitaland prefrontal cortices (i.e., relatively distributed, many-to-many connections).The results of the task residual analysis confirmed that
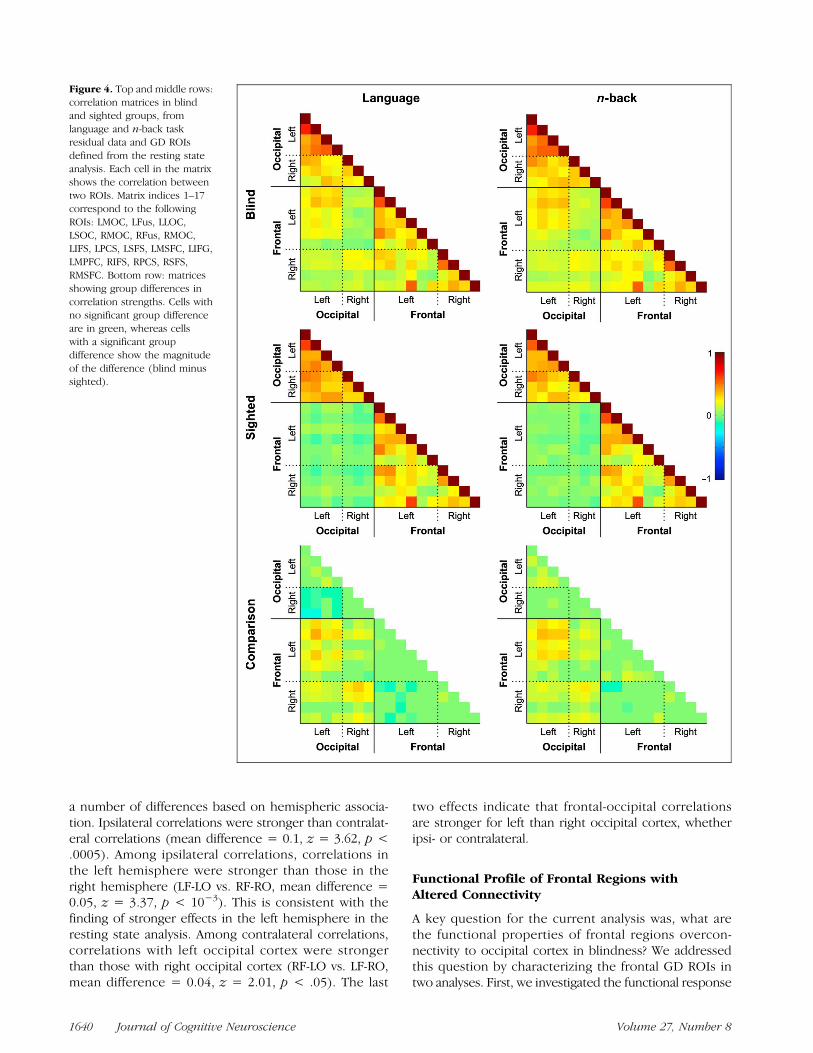
all of the GD ROIs identified by the GDC method haveincreased fronto-occipital correlations in blind comparedto sighted individuals (Figure 4). All frontal ROIs showedconsistent group differences in functional connectivitywith at least one ipsilateral occipital ROI, and the majorityhad group differences with all ipsilateral occipital ROIs.Likewise, all occipital ROIs had group differences withat least one ipsilateral frontal ROI, and the majority hadgroup differences with all ipsilateral frontal ROIs. Amongleft frontal to left occipital (LF-LO) correlations, 21 of 24pairs of ROIs had significantly stronger correlations in blindthan sighted participants in both tasks. Among right frontalto right occipital (RF-RO) correlations, 10 of 12 pairs weresignificantly stronger in blind participants in both tasks. Dif-ferences between the blind and sighted groups were dueto near-zero correlations between occipital and frontalregions in sighted individuals and positive correlationsbetween occipital and frontal regions in blind individuals.These results provide strong evidence that our initial rest-ing state analysis identified regions of frontal and occipital
Figure 1. Z-statistic map for resting state GDC analysis, correctedfor multiple comparisons using a permutation test to threshold clustersize. GDC statistics were transformed to z-statistics based on theirp value. The voxels shown in frontal cortex have a significant numberof group differences (blind > sighted) in functional connectivity withvoxels in ipsilateral occipital cortex; likewise, voxels shown in occipitalcortex have a significant number of group differences with voxels inipsilateral frontal cortex. Occipital and frontal masks are shown in asemitransparent blue color. Slices shown are ±4, ±24, ±42, ±48,and ±54 (MNI x-coordinates).
1638 Journal of Cognitive Neuroscience Volume 27, Number 8
cortex with systematically altered functional connectivity inblind individuals and suggest that in blindness each occip-ital area has increased connectivity with multiple prefrontalareas.Are increased correlations in blindness specific to sub-
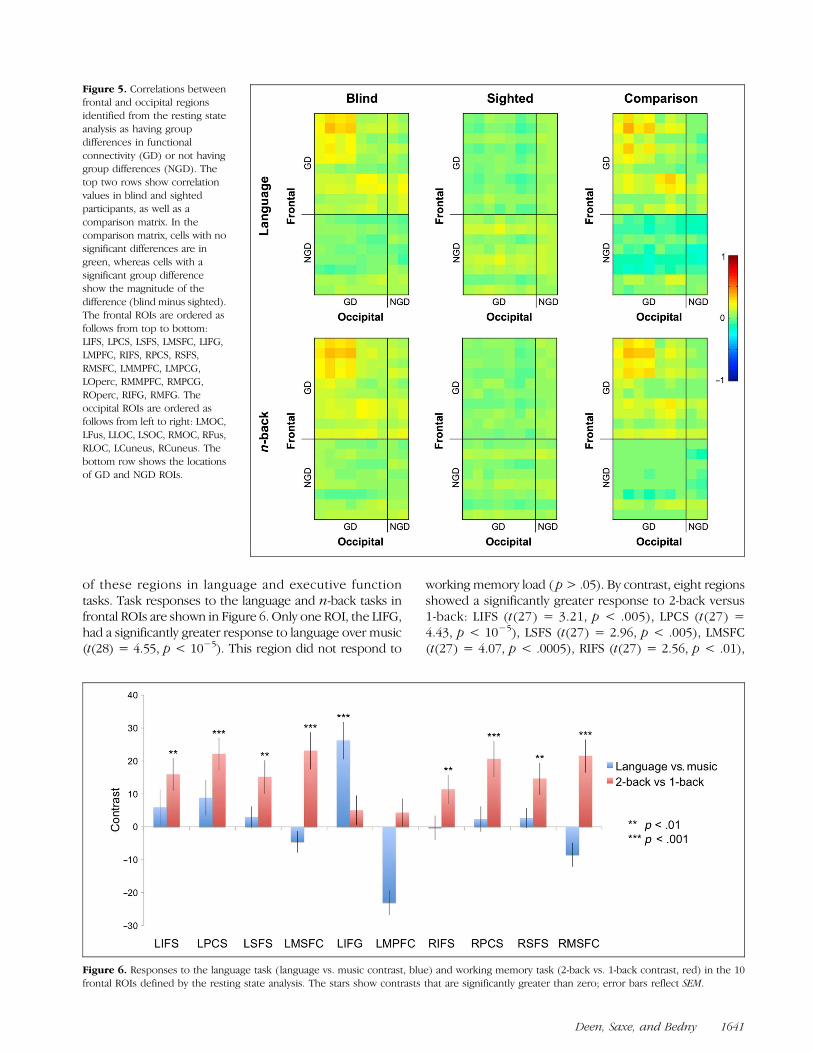
regions of frontal and occipital cortex or widespreadacross these lobes? The regions of frontal and occipitalcortex not identified by the GDC analysis might truly lackgroup differences, or they may have subtle differencesthat were too weak to be detected. To address this, weused task residual data to assess group differences infunctional connectivity of NGD ROIs, which lacked groupdifferences in resting data (Figure 5). Among frontal NGDregions, 6 of 8 regions had no consistent increases infunctional connectivity with occipital regions in blind in-dividuals. Among the remaining two frontal regions,RMFG had consistent increases in functional connectivitywith one occipital region, whereas RIFG had consistent
increases with 5 of 9 occipital regions. This analysis dem-onstrates that there are frontal regions where functionalconnectivity to the occipital lobe is not increased inblindness, across three data sets.
For the two occipital NGD ROIs, some increased func-tional connectivity with frontal regions was observed intask residual data. LCuneus had consistent increases infunctional connectivity with 9 of 18 frontal regions, andRCuneus had increases with 3 of 18 frontal regions. Thus,we cannot rule out the possibility that all of occipital cor-tex has altered functional connectivity with parts of fron-tal cortex in blindness.
Hemispheric Differences inFunctional Connectivity
Do frontal-occipital correlations in blind individuals differacross hemispheres? A linear mixed model demonstrated
Figure 2. Z-statistic map fortemporal/parietal/frontal restingstate GDC analyses, correctedfor multiple comparisons usinga permutation test to thresholdcluster size. GDC statistics weretransformed to z-statistics basedon their p value. The voxelsshown in frontal, parietal,and temporal cortex have asignificant number of groupdifferences (blind > sighted)in functional connectivity withvoxels in occipital cortex. Graymatter masks are shown ina semitransparent blue color.Slices shown are −10, +42(MNI z-coordinates).
Figure 3. Surface rendering showing ROIs defined from resting state analyses. GD ROIs had group differences in resting state data, whereasNGD ROIs did not. Abbreviations: L = left; R = right; IFS = inferior frontal sulcus; PCS = precentral sulcus; SFS = superior frontal sulcus; MSFC =medial superior frontal cortex; IFG = inferior frontal gyrus; MPFC = medial pFC; MOC = medial occipital cortex; Fus = fusiform gyrus; LOC =ateral occipital cortex; SOC = superior occipital cortex; MMPFC = middle medial pFC; MPCG = medial precentral gyrus; Operc = operculum.
Deen, Saxe, and Bedny 1639
a number of differences based on hemispheric associa-tion. Ipsilateral correlations were stronger than contralat-eral correlations (mean difference = 0.1, z = 3.62, p <.0005). Among ipsilateral correlations, correlations inthe left hemisphere were stronger than those in theright hemisphere (LF-LO vs. RF-RO, mean difference =0.05, z = 3.37, p < 10−3). This is consistent with thefinding of stronger effects in the left hemisphere in theresting state analysis. Among contralateral correlations,correlations with left occipital cortex were strongerthan those with right occipital cortex (RF-LO vs. LF-RO,mean difference = 0.04, z = 2.01, p < .05). The last
two effects indicate that frontal-occipital correlationsare stronger for left than right occipital cortex, whetheripsi- or contralateral.
Functional Profile of Frontal Regions withAltered Connectivity
A key question for the current analysis was, what arethe functional properties of frontal regions overcon-nectivity to occipital cortex in blindness? We addressedthis question by characterizing the frontal GD ROIs intwo analyses. First, we investigated the functional response
Figure 4. Top and middle rows:correlation matrices in blindand sighted groups, fromlanguage and n-back taskresidual data and GD ROIsdefined from the resting stateanalysis. Each cell in the matrixshows the correlation betweentwo ROIs. Matrix indices 1–17correspond to the followingROIs: LMOC, LFus, LLOC,LSOC, RMOC, RFus, RMOC,LIFS, LPCS, LSFS, LMSFC, LIFG,LMPFC, RIFS, RPCS, RSFS,RMSFC. Bottom row: matricesshowing group differences incorrelation strengths. Cells withno significant group differenceare in green, whereas cellswith a significant groupdifference show the magnitudeof the difference (blind minussighted).
1640 Journal of Cognitive Neuroscience Volume 27, Number 8
of these regions in language and executive functiontasks. Task responses to the language and n-back tasks infrontal ROIs are shown in Figure 6. Only one ROI, the LIFG,had a significantly greater response to language over music(t(28) = 4.55, p < 10−5). This region did not respond to
working memory load ( p> .05). By contrast, eight regionsshowed a significantly greater response to 2-back versus1-back: LIFS (t(27) = 3.21, p < .005), LPCS (t(27) =4.43, p < 10−5), LSFS (t(27) = 2.96, p < .005), LMSFC(t(27) = 4.07, p < .0005), RIFS (t(27) = 2.56, p < .01),
Figure 5. Correlations betweenfrontal and occipital regionsidentified from the resting stateanalysis as having groupdifferences in functionalconnectivity (GD) or not havinggroup differences (NGD). Thetop two rows show correlationvalues in blind and sightedparticipants, as well as acomparison matrix. In thecomparison matrix, cells with nosignificant differences are ingreen, whereas cells with asignificant group differenceshow the magnitude of thedifference (blind minus sighted).The frontal ROIs are ordered asfollows from top to bottom:LIFS, LPCS, LSFS, LMSFC, LIFG,LMPFC, RIFS, RPCS, RSFS,RMSFC, LMMPFC, LMPCG,LOperc, RMMPFC, RMPCG,ROperc, RIFG, RMFG. Theoccipital ROIs are ordered asfollows from left to right: LMOC,LFus, LLOC, LSOC, RMOC, RFus,RLOC, LCuneus, RCuneus. Thebottom row shows the locationsof GD and NGD ROIs.
Figure 6. Responses to the language task (language vs. music contrast, blue) and working memory task (2-back vs. 1-back contrast, red) in the 10frontal ROIs defined by the resting state analysis. The stars show contrasts that are significantly greater than zero; error bars reflect SEM.
Deen, Saxe, and Bedny 1641
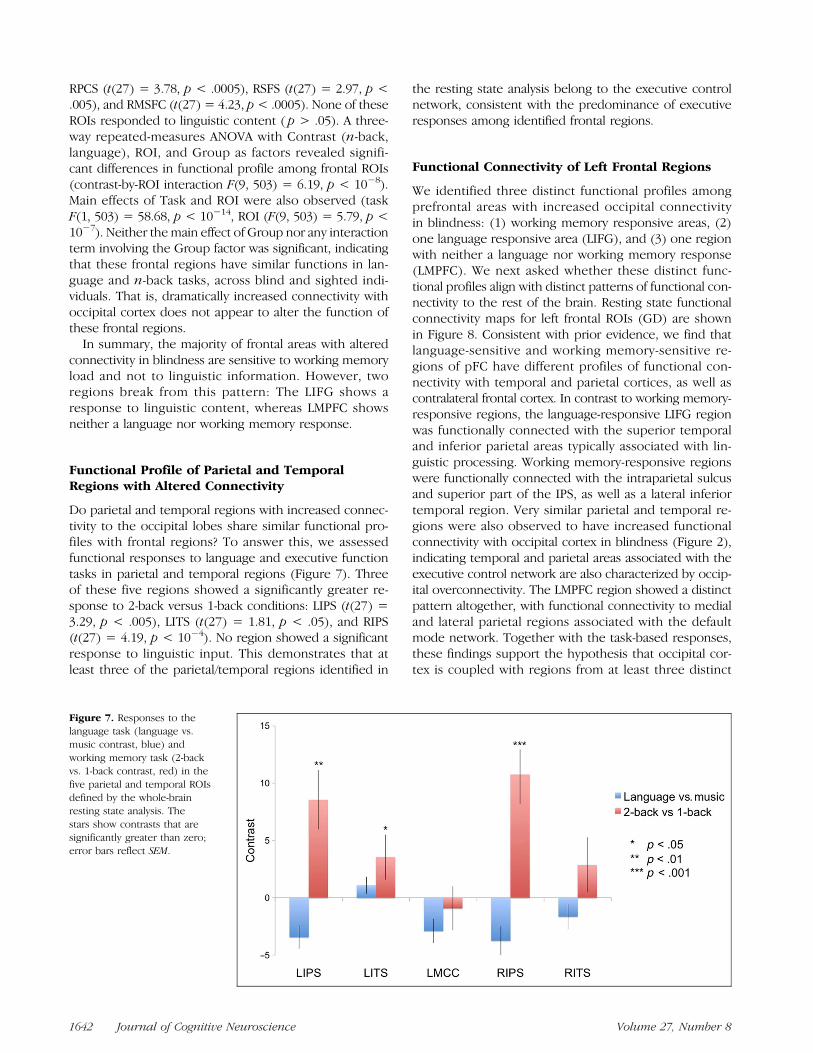
RPCS (t(27) = 3.78, p < .0005), RSFS (t(27) = 2.97, p <.005), and RMSFC (t(27) = 4.23, p< .0005). None of theseROIs responded to linguistic content ( p > .05). A three-way repeated-measures ANOVA with Contrast (n-back,language), ROI, and Group as factors revealed signifi-cant differences in functional profile among frontal ROIs(contrast-by-ROI interaction F(9, 503) = 6.19, p < 10−8).Main effects of Task and ROI were also observed (taskF(1, 503) = 58.68, p < 10−14, ROI (F(9, 503) = 5.79, p <10−7). Neither themain effect of Group nor any interactionterm involving the Group factor was significant, indicatingthat these frontal regions have similar functions in lan-guage and n-back tasks, across blind and sighted indi-viduals. That is, dramatically increased connectivity withoccipital cortex does not appear to alter the function ofthese frontal regions.
In summary, the majority of frontal areas with alteredconnectivity in blindness are sensitive to working memoryload and not to linguistic information. However, tworegions break from this pattern: The LIFG shows aresponse to linguistic content, whereas LMPFC showsneither a language nor working memory response.
Functional Profile of Parietal and TemporalRegions with Altered Connectivity
Do parietal and temporal regions with increased connec-tivity to the occipital lobes share similar functional pro-files with frontal regions? To answer this, we assessedfunctional responses to language and executive functiontasks in parietal and temporal regions (Figure 7). Threeof these five regions showed a significantly greater re-sponse to 2-back versus 1-back conditions: LIPS (t(27) =3.29, p < .005), LITS (t(27) = 1.81, p < .05), and RIPS(t(27) = 4.19, p < 10−4). No region showed a significantresponse to linguistic input. This demonstrates that atleast three of the parietal/temporal regions identified in
the resting state analysis belong to the executive controlnetwork, consistent with the predominance of executiveresponses among identified frontal regions.
Functional Connectivity of Left Frontal Regions
We identified three distinct functional profiles amongprefrontal areas with increased occipital connectivityin blindness: (1) working memory responsive areas, (2)one language responsive area (LIFG), and (3) one regionwith neither a language nor working memory response(LMPFC). We next asked whether these distinct func-tional profiles align with distinct patterns of functional con-nectivity to the rest of the brain. Resting state functionalconnectivity maps for left frontal ROIs (GD) are shownin Figure 8. Consistent with prior evidence, we find thatlanguage-sensitive and working memory-sensitive re-gions of pFC have different profiles of functional con-nectivity with temporal and parietal cortices, as well ascontralateral frontal cortex. In contrast to working memory-responsive regions, the language-responsive LIFG regionwas functionally connected with the superior temporaland inferior parietal areas typically associated with lin-guistic processing. Working memory-responsive regionswere functionally connected with the intraparietal sulcusand superior part of the IPS, as well as a lateral inferiortemporal region. Very similar parietal and temporal re-gions were also observed to have increased functionalconnectivity with occipital cortex in blindness (Figure 2),indicating temporal and parietal areas associated with theexecutive control network are also characterized by occip-ital overconnectivity. The LMPFC region showed a distinctpattern altogether, with functional connectivity to medialand lateral parietal regions associated with the defaultmode network. Together with the task-based responses,these findings support the hypothesis that occipital cor-tex is coupled with regions from at least three distinct
Figure 7. Responses to thelanguage task (language vs.music contrast, blue) andworking memory task (2-backvs. 1-back contrast, red) in thefive parietal and temporal ROIsdefined by the whole-brainresting state analysis. Thestars show contrasts that aresignificantly greater than zero;error bars reflect SEM.
1642 Journal of Cognitive Neuroscience Volume 27, Number 8
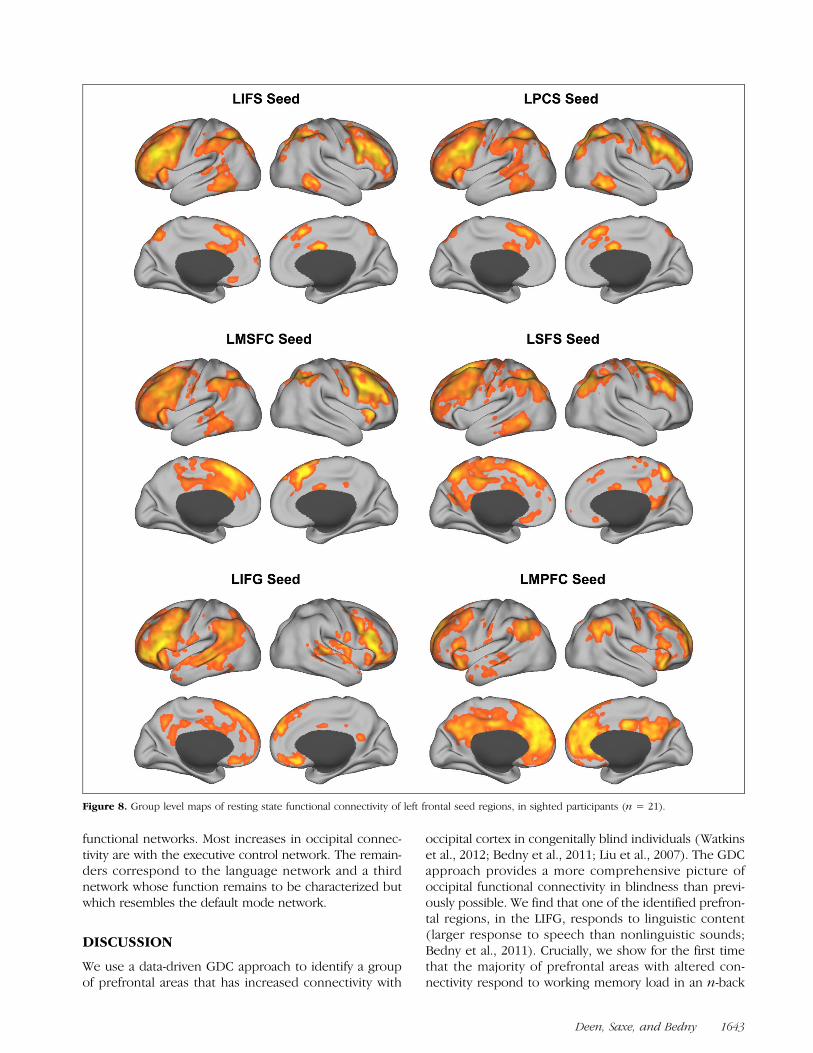
functional networks. Most increases in occipital connec-tivity are with the executive control network. The remain-ders correspond to the language network and a thirdnetwork whose function remains to be characterized butwhich resembles the default mode network.
DISCUSSION
We use a data-driven GDC approach to identify a groupof prefrontal areas that has increased connectivity with
occipital cortex in congenitally blind individuals (Watkinset al., 2012; Bedny et al., 2011; Liu et al., 2007). The GDCapproach provides a more comprehensive picture ofoccipital functional connectivity in blindness than previ-ously possible. We find that one of the identified prefron-tal regions, in the LIFG, responds to linguistic content(larger response to speech than nonlinguistic sounds;Bedny et al., 2011). Crucially, we show for the first timethat the majority of prefrontal areas with altered con-nectivity respond to working memory load in an n-back
Figure 8. Group level maps of resting state functional connectivity of left frontal seed regions, in sighted participants (n = 21).
Deen, Saxe, and Bedny 1643
task, but not to linguistic content. These findings indicatethat, in blindness, the occipital lobe has altered interactionswith frontal regions belonging to multiple networks, with apredominance of regions associated with the executivecontrol network.
Implications of Resting State Group Differencesfor Anatomy and Function
One straightforward interpretation of increased func-tional connectivity between occipital and prefrontalcortices would be to infer a strengthened anatomicalpathway. However, prior diffusion tensor imaging studieswith blind individuals argue against this possibility. Thefrontal and occipital lobes are connected by the in-ferior fronto-occipital fasciculus and by a portion ofthe superior longitudinal fasciculus extending into theoccipital lobe (Forkel et al., 2014). Contrary to thehypothesis of increased anatomical connectivity, inferiorfronto-occipital fasciculus shows reduced white matterintegrity in blindness (Shu, Liu, et al., 2009). In general,white matter tracts connecting occipital cortex to therest of the brain are diminished in blind individuals, show-ing reduced fractional anisotropy or increased meanor radial diffusivity (Bridge, Cowey, Ragge, & Watkins,2009; Shu, Li, Li, Yu, & Jiang, 2009; Shu, Liu, et al., 2009;Park et al., 2007; Shimony et al., 2006). Thus, all extantdata suggest that the functional changes observed hereoccur in the absence of increased long-range anatomicalconnections.
At the opposite extreme, an alternative hypothesis isthat increased “functional connectivity” does not reflectchanges in fronto-occipital connectivity per se, but onlyin coactivation. fcMRI measures correlations in hemody-namic responses; two regions could appear to be con-nected when in fact they are both independently drivenby external stimuli or ongoing cognitive activity. In thecurrent context, for example, left occipital cortex of blindindividuals might coactivate with LIFG because both re-gions (independently) play a role in linguistic process-ing. However, we consider this interpretation unlikely.Our study, like prior reports, did not observe increasedfunctional connectivity between occipital cortex andother regions involved in language processing, such asleft temporal regions (Watkins et al., 2012; Bedny et al.,2011), suggesting that a role in language processing isnot sufficient to increase functional connectivity withoccipital areas. Second, we find that increased functionalcorrelations were stable across rest and two different taskcontexts, suggesting that the observed group differencesare robust to substantial variations in ongoing cognitiveactivity.
Therefore, we hypothesize that increased resting statecorrelations in blind individuals reflect increased inter-action or information flow between occipital cortex andlanguage as well as executive function regions of the fron-tal lobe. In sighted adults, occipital and frontal cortices in-
teract during visual attention and visual working memorytasks (Zanto, Rubens, Thangavel, & Gazzaley, 2011; Moore& Armstrong, 2003; Kastner & Ungerleider, 2000; Miller,Erickson, & Desimone, 1996). There is also some evidencethat in the absence of a task, fronto-occipital correlationsare higher in sighted individuals during visually attentivestates (Liu, Dong, Zuo, Wang, & Zang, 2013; McAvoyet al., 2012), although these correlations are substantiallymore restricted in spatial extent than those observed here.Increased fronto-occipital connectivity in blind individualscould reflect an expansion and repurposing of this func-tional connection for nonvisual processing.A key open question, regarding this interpretation,
concerns the direction of information flow between pre-frontal and occipital regions. Prefrontal regions mighttransmit information to occipital cortex, providing a meansfor the occipital lobe to receive nonvisual information. Onthe other hand, prefrontal regions may receive informa-tion processed by occipital cortex for further processingor maintenance. This directionality could potentially betested using techniques with relatively high temporaland spatial resolution, such as magnetoencephalography.
Implications for the Function of OccipitalCortices in Blindness
How do the present resting state results inform hypothesesabout the functional role of occipital cortex in blind individ-uals? Like prior studies, we find that occipital cortex is func-tionally connected with an area of the frontal lobe that isspecifically involved in language processing (Watkinset al., 2012; Bedny et al., 2011). This observation is consis-tent with the hypotheses that a subset of left occipital cor-tex contributes to language processing in blindness (Bednyet al., 2011; Burton, Snyder, Conturo, et al., 2002; Burton,Snyder, Diamond, et al., 2002; Röder et al., 2002). We alsofind that the majority of identified prefrontal areas respondto working memory load and not to linguistic content. Ad-ditionally, occipital cortex has increased functional connec-tivity with temporal and parietal regions associated with theexecutive control network. These results raise the possibil-ity that, in addition to language-related plasticity, parts ofoccipital cortex contribute to executive and working mem-ory functions in blind individuals. Although this hypothesisremains to be tested directly, it is consistent with severallines of evidence. First, during sensory tasks, occipital cor-tices of blind individuals are sensitive to attention and taskdemands. For example, two studies reported responsesonly for target and/or distractor stimuli, but not for nontar-get stimuli during auditory and tactile change detectiontasks (Weaver & Stevens, 2007; Kujala et al., 2005). Occip-ital cortex responds more during an auditory and tactilediscrimination tasks than control tasks with matching sen-sory input and motor output (Voss, Gougoux, Zatorre,Lassonde, & Lepore, 2008; Gougoux et al., 2005; Sadatoet al., 1996). These data point to a functional role beyondsensory analysis.
1644 Journal of Cognitive Neuroscience Volume 27, Number 8
Further support for the hypothesis that occipital areascontribute to executive processes comes from studies ofverbal memory in blind individuals. Occipital areas areactive when blind individuals recall words from memoryor generate verbs to heard nouns (Raz, Amedi, & Zohary,2005; Amedi et al., 2003). TMS to the occipital corteximpairs verb generation in blind individuals (Amedi,Floel, Knecht, Zohary, & Cohen, 2004). As a group, blindindividuals are better than sighted at remembering listsof words, and those blind individuals with better long-term memory have higher occipital responses during ver-bal memory tasks (Raz, Striem, Pundak, Orlov, & Zohary,2007; Amedi et al., 2003). An intriguing possibility is thatthese behavioral gains result because blind individuals usevisual cortex as a secondary working memory resource.An alternative possibility is that executive function
regions in prefrontal and parietal cortex are correlatedwith language-responsive areas in occipital cortex, perhapsbecause many online language tasks require executive andworking memory functions (Thompson-Schill, Bedny, &Goldberg, 2005). Although the majority of frontal regionswith increased connectivity in blindness did not respondselectively to linguistic input versus music, this does notpreclude the possibility that these regions play a role inlinguistic processing. Intriguingly, fronto-occipital func-tional connectivity in blindness was stronger in the leftthan in the right hemisphere, including in regions witha working memory response and no selective responseto language. Although any interpretation of the cause orrelevance of this lateralization is highly speculative, onepossibility is that these functional connections are latera-lized because they do relate to linguistic processing andto occipital responses to linguistic stimuli.
Developmental Mechanisms of Plasticity
Another set of questions for future research concerns thedevelopmental mechanism and timing of connectivitychanges. Are fronto-occipital correlations present in in-fants but suppressed by visual input during developmentin sighted children? Or are these correlations acquired byoccipital cortex only in the absence of visual input? Re-latedly, what is the causal relationship between occipitalfunctional plasticity and changes in fronto-occipital cor-relations in blindness? Are occipital and frontal areasfunctionally connected because of frequent coactivationduring development (Dosenbach et al., 2007; Fair et al.,2007)? Alternatively, the opposite causal mechanism isalso possible: Increased connectivity to prefrontal regionsmight enable functional plasticity of occipital cortex.Differentiating between these developmental accounts
will require characterizing both functional plasticity andfunctional connectivity to pFC in the occipital cortex ofblind infants and children or of adults who became blindat different ages. For example, one previous study foundthat functional connectivity between prefrontal and occip-ital regions was increased in adults who were blind
throughout childhood but not those who became blindafter age 9, despite decades of subsequent blindness(Bedny et al., 2010).
Finally, a key question about these results concernstheir implications for efforts to restore sight to blind indi-viduals. Individuals who grow up without vision and thenrecover sight in adulthood have lasting impairments invisual perception (Lewis & Maurer, 2005; Maurer, Lewis,& Mondloch, 2005; Le Grand, Mondloch, Maurer, & Brent,2004; Fine et al., 2003; but see Ostrovsky, Andalman, &Sinha, 2006). Such impairments are believed to result fromlocal microcircuitry changes within occipital cortex in theabsence of vision (Espinosa & Stryker, 2012; Hensch,2005). However, altered connectivity of occipital cortexwith more remote regions like pFC may also interfere withsight recovery. For example, the frontal lobe is believed tomodulate occipital responses to stimuli based on currenttask demands and attention. Changes in frontal-occipitalconnectivity could alter these functions. Future researchshould therefore test whether increased connectivity toprefrontal regions affects visual functions in occipital cortexafter sight recovery.
Conclusion and Future Directions
Using a data-driven approach for assessing whole-braingroup differences in functional connectivity, we mappedregions of frontal and occipital cortex with increasedsynchronization in blind adults. Although much of occipi-tal cortex had increased correlations, functional connec-tivity was increased only with a specific set of prefrontalregions, belonging to several functional networks. Themajority of the overconnected prefrontal areas respondto working memory load, whereas one responded to lin-guistic content. Our findings open a range of questions forfuture research: How exactly does increased functionalconnectivity relate to altered functional responses inoccipital cortex? And what is the developmental trajectoryof increased fronto-occipital functional connectivity?Addressing these questions will further our understandingof the mechanisms underlying cortical plasticity.
Acknowledgments
This research was funded by a grant from the David and LucilePackard Foundation to R. S. B. D. was supported by an NSFgraduate research fellowship.
Reprint requests should be sent to Ben Deen, Room 46-4021,43 Vassar St., Massachusetts Institute of Technology, Cambridge,MA 02139, or via e-mail: [email protected].
REFERENCES
Al-Aidroos, N., Said, C. P., & Turk-Browne, N. B. (2012). Top–down attention switches coupling between low-level andhigh-level areas of human visual cortex. Proceedings of theNational Academy of Sciences, U.S.A., 109, 14675–14680.
Deen, Saxe, and Bedny 1645
Amedi, A., Floel, A., Knecht, S., Zohary, E., & Cohen, L. G.(2004). Transcranial magnetic stimulation of the occipitalpole interferes with verbal processing in blind subjects.Nature Neuroscience, 7, 1266–1270.
Amedi, A., Raz, N., Pianka, P., Malach, R., & Zohary, E. (2003).Early ‘visual’ cortex activation correlates with superior verbalmemory performance in the blind. Nature Neuroscience,6, 758–766.
Bedny, M., Konkle, T., Pelphrey, K., Saxe, R., & Pascual-Leone,A. (2010). Sensitive period for a multimodal response inhuman visual motion area MT/MST. Current Biology, 20,1900–1906.
Bedny, M., Pascual-Leone, A., Dodell-Feder, D., Fedorenko, E.,& Saxe, R. (2011). Language processing in the occipital cortexof congenitally blind adults. Proceedings of the NationalAcademy of Sciences, U.S.A., 108, 4429–4434.
Behzadi, Y., Restom, K., Liau, J., & Liu, T. T. (2007). Acomponent based noise correction method (CompCor)for BOLD and perfusion based fMRI. Neuroimage,37, 90.
Biswal, B., Yetkin, F. Z., Haughton, V. M., & Hyde, J. S. (1995).Functional connectivity in the motor cortex of resting humanbrain using echo-planar MRI. Magnetic Resonance inMedicine, 34, 537–541.
Bridge, H., Cowey, A., Ragge, N., & Watkins, K. (2009).Imaging studies in congenital anophthalmia revealpreservation of brain architecture in ‘visual’ cortex.Brain, 132, 3467–3480.
Burton, H., Snyder, A., Conturo, T., Akbudak, E., Ollinger, J., &Raichle, M. (2002). Adaptive changes in early and late blind:A fMRI study of Braille reading. Journal of Neurophysiology,87, 589–607.
Burton, H., Snyder, A., Diamond, J., & Raichle, M. (2002).Adaptive changes in early and late blind: A fMRI study of verbgeneration to heard nouns. Journal of Neurophysiology, 88,3359–3371.
Chai, X. J., Castañón, A. N., Ongür, D., & Whitfield-Gabrieli, S.(2012). Anticorrelations in resting state networks withoutglobal signal regression. Neuroimage, 59, 1420–1428.
Collignon, O., Vandewalle, G., Voss, P., Albouy, G.,Charbonneau, G., Lassonde, M., et al. (2011). Functionalspecialization for auditory-spatial processing in the occipitalcortex of congenitally blind humans. Proceedings of theNational Academy of Sciences, U.S.A., 108, 4435–4440.
Dosenbach, N. U. F., Fair, D. A., Miezin, F. M., Cohen, A. L.,Wenger, K. K., Dosenbach, R. A. T., et al. (2007). Distinctbrain networks for adaptive and stable task control inhumans. Proceedings of the National Academy of Sciences,U.S.A., 104, 11073–11078.
Duncan, J., & Owen, A. M. (2000). Common regions of thehuman frontal lobe recruited by diverse cognitive demands.Trends in Neurosciences, 23, 475–483.
Espinosa, J. S., & Stryker, M. P. (2012). Developmentand plasticity of the primary visual cortex. Neuron, 75,230–249.
Fair, D. A., Dosenbach, N. U., Church, J. A., Cohen, A. L.,Brahmbhatt, S., Miezin, F. M., et al. (2007). Developmentof distinct control networks through segregation andintegration. Proceedings of the National Academy ofSciences, U.S.A., 104, 13507–13512.
Fedorenko, E., Behr, M. K., & Kanwisher, N. (2011). Functionalspecificity for high-level linguistic processing in the humanbrain. Proceedings of the National Academy of Sciences,U.S.A., 108, 16428–16433.
Fedorenko, E., Duncan, J., & Kanwisher, N. (2013). Broaddomain generality in focal regions of frontal and parietalcortex. Proceedings of the National Academy of Sciences,U.S.A., 110, 16616–16621.
Fine, I., Wade, A. R., Brewer, A. A., May, M. G., Goodman,D. F., Boynton, G. M., et al. (2003). Long-term deprivationaffects visual perception and cortex. Nature Neuroscience,6, 915–916.
Forkel, S. J., Thiebaut de Schotten, M., Kawadler, J. M.,Dell’Acqua, F., Danek, A., & Catani, M. (2014). The anatomyof fronto-occipital connections from early blunt dissections tocontemporary tractography. Cortex, 56, 73–84.
Forman, S. D., Cohen, J. D., Fitzgerald, M., Eddy, W. F., Mintun,M. A., & Noll, D. C. (1995). Improved assessment ofsignificant activation in functional magnetic resonanceimaging (fMRI): Use of a cluster size threshold. MagneticResonance in Medicine, 33, 636–647.
Friston, K. J., Worsley, K. J., Frackowiak, R., Mazziotta, J. C.,& Evans, A. C. (2004). Assessing the significance of focalactivations using their spatial extent. Human BrainMapping, 1, 210–220.
Gougoux, F., Zatorre, R. J., Lassonde, M., Voss, P., &Lepore, F. (2005). A functional neuroimaging study of soundlocalization: Visual cortex activity predicts performance inearly-blind individuals. PLoS Biology, 3, e27.
Greve, D. N., & Fischl, B. (2009). Accurate and robust brainimage alignment using boundary-based registration.Neuroimage, 48, 63.
Gweon, H., Dodell-Feder, D., Bedny, M., & Saxe, R. (2012).Theory of mind performance in children correlates withfunctional specialization of a brain region for thinkingabout thoughts. Child Development, 83, 1853–1868.
Hensch, T. K. (2005). Critical period plasticity in local corticalcircuits. Nature Reviews Neuroscience, 6, 877–888.
Kastner, S., & Ungerleider, L. G. (2000). Mechanisms ofvisual attention in the human cortex. Annual Review ofNeuroscience, 23, 315–341.
Kujala, T., Palva, M. J., Salonen, O., Alku, P., Huotilainen, M.,Järvinen, A., et al. (2005). The role of blind humans’ visualcortex in auditory change detection. Neuroscience Letters,379, 127–131.
Le Grand, R., Mondloch, C. J., Maurer, D., & Brent, H. P. (2004).Impairment in holistic face processing following early visualdeprivation. Psychological Science, 15, 762–768.
Lewis, T. L., & Maurer, D. (2005). Multiple sensitive periodsin human visual development: Evidence from visuallydeprived children. Developmental Psychobiology, 46,163–183.
Liu, D., Dong, Z., Zuo, X., Wang, J., & Zang, Y. (2013).Eyes-open/eyes-closed dataset sharing for reproducibilityevaluation of resting state fMRI data analysis methods.Neuroinformatics, 11, 469–476.
Liu, Y., Yu, C., Liang, M., Li, J., Tian, L., Zhou, Y., et al. (2007).Whole brain functional connectivity in the early blind.Brain, 130, 2085–2096.
Marchini, J. L., & Ripley, B. D. (2000). A new statisticalapproach to detecting significant activation in functionalMRI. Neuroimage, 12, 366–380.
Maurer, D., Lewis, T. L., & Mondloch, C. J. (2005). Missingsights: Consequences for visual cognitive development.Trends in Cognitive Sciences, 9, 144–151.
McAvoy, M., Larson-Prior, L., Ludwikow, M., Zhang, D.,Snyder, A. Z., Gusnard, D. L., et al. (2012). Dissociatedmean and functional connectivity BOLD signals in visualcortex during eyes closed and fixation. Journal ofNeurophysiology, 108, 2363–2372.
Miller, E. K., Erickson, C. A., & Desimone, R. (1996). Neuralmechanisms of visual working memory in prefrontal cortex ofthe macaque. The Journal of Neuroscience, 16, 5154–5167.
Moore, T., & Armstrong, K. M. (2003). Selective gating ofvisual signals by microstimulation of frontal cortex. Nature,421, 370–373.
1646 Journal of Cognitive Neuroscience Volume 27, Number 8
Nichols, T. E., & Holmes, A. P. (2002). Nonparametricpermutation tests for functional neuroimaging: A primerwith examples. Human Brain Mapping, 15, 1–25.
Ostrovsky, Y., Andalman, A., & Sinha, P. (2006). Vision followingextended congenital blindness. Psychological Science, 17,1009–1014.
Park, H.-J., Jeong, S.-O., Kim, E. Y., Kim, J. I., Park, H., Oh, M.-K.,et al. (2007). Reorganization of neural circuits in the blindon diffusion direction analysis. NeuroReport, 18, 1757–1760.
Power, J. D., Barnes, K. A., Snyder, A. Z., Schlaggar, B. L., &Petersen, S. E. (2012). Spurious but systematic correlationsin functional connectivity MRI networks arise from subjectmotion. Neuroimage, 59, 2142–2154.
Ptito, M., Moesgaard, S. M., Gjedde, A., & Kupers, R. (2005).Cross-modal plasticity revealed by electrotactile stimulationof the tongue in the congenitally blind. Brain, 128, 606–614.
Raz, N., Amedi, A., & Zohary, E. (2005). V1 activation incongenitally blind humans is associated with episodicretrieval. Cerebral Cortex, 15, 1459–1468.
Raz, N., Striem, E., Pundak, G., Orlov, T., & Zohary, E. (2007).Superior serial memory in the blind: A case of cognitivecompensatory adjustment. Current Biology, 17, 1129–1133.
Röder, B., Stock, O., Bien, S., Neville, H., & Rösler, F. (2002).Speech processing activates visual cortex in congenitally blindhumans. European Journal of Neuroscience, 16, 930–936.
Sadato, N., Okada, T., Kubota, K., & Yonekura, Y. (2004). Tactilediscrimination activates the visual cortex of the recently blindnaive to Braille: A functional magnetic resonance imagingstudy in humans. Neuroscience Letters, 359, 49–52.
Sadato, N., Pascual-Leone, A., Grafman, J., Ibanez, V., Deiber,M.-P., Dold, G., et al. (1996). Activation of the primaryvisual cortex by Braille reading in blind subjects. Nature,380, 526–528.
Shimony, J., Burton, H., Epstein, A., McLaren, D., Sun, S., &Snyder, A. (2006). Diffusion tensor imaging reveals whitematter reorganization in early blind humans. CerebralCortex, 16, 1653–1661.
Shu, N., Li, J., Li, K., Yu, C., & Jiang, T. (2009). Abnormaldiffusion of cerebral white matter in early blindness.Human Brain Mapping, 30, 220–227.
Shu, N., Liu, Y., Li, J., Li, Y., Yu, C., & Jiang, T. (2009).Altered anatomical network in early blindness revealedby diffusion tensor tractography. PLoS One, 4, e7228.
Thompson-Schill, S. L., Bedny, M., & Goldberg, R. F. (2005).The frontal lobes and the regulation of mental activity.Current Opinion in Neurobiology, 15, 219–224.
Triantafyllou, C., Hoge, R. D., Krueger, G., Wiggins, C. J.,Potthast, A., Wiggins, G. C., et al. (2005). Comparisonof physiological noise at 1.5 T, 3 T and 7 T andoptimization of fMRI acquisition parameters. Neuroimage,26, 243–250.
Triantafyllou, C., Hoge, R. D., & Wald, L. L. (2006). Effect ofspatial smoothing on physiological noise in high-resolutionfMRI. Neuroimage, 32, 551–557.
Voss, P., Gougoux, F., Zatorre, R. J., Lassonde, M., & Lepore, F.(2008). Differential occipital responses in early- and late-blindindividuals during a sound-source discrimination task.Neuroimage, 40, 746–758.
Watkins, K. E., Cowey, A., Alexander, I., Filippini, N., Kennedy,J. M., Smith, S. M., et al. (2012). Language networks inanophthalmia: Maintained hierarchy of processing in‘visual’ cortex. Brain, 135, 1566–1577.
Weaver, K. E., & Stevens, A. A. (2007). Attention and sensoryinteractions within the occipital cortex in the early blind:An fMRI study. Journal of Cognitive Neuroscience, 19,315–330.
Winkler, A. M., Ridgway, G. R., Webster, M. A., Smith, S. M.,& Nichols, T. E. (2014). Permutation inference for thegeneral linear model. Neuroimage, 92, 381–397.
Woolrich, M. W., Behrens, T. E. J., Beckmann, C. F., Jenkinson,M., & Smith, S. M. (2004). Multilevel linear modelling forfMRI group analysis using Bayesian inference. Neuroimage,21, 1732–1747.
Woolrich, M. W., Ripley, B. D., Brady, M., & Smith, S. M. (2001).Temporal autocorrelation in univariate linear modeling offMRI data. Neuroimage, 14, 1370–1386.
Zanto, T. P., Rubens, M. T., Thangavel, A., & Gazzaley, A. (2011).Causal role of the prefrontal cortex in top–down modulationof visual processing and working memory. NatureNeuroscience, 14, 656–661.
Deen, Saxe, and Bedny 1647