Embed Size (px)
Citation preview
Obtaining Good %T and %R Measurements (Excerpts from a draft of the upcoming Third Edition of Practical Production of Optical
Thin Films by Ron Willey)
2.2.4 Types of Reflecting Surfaces
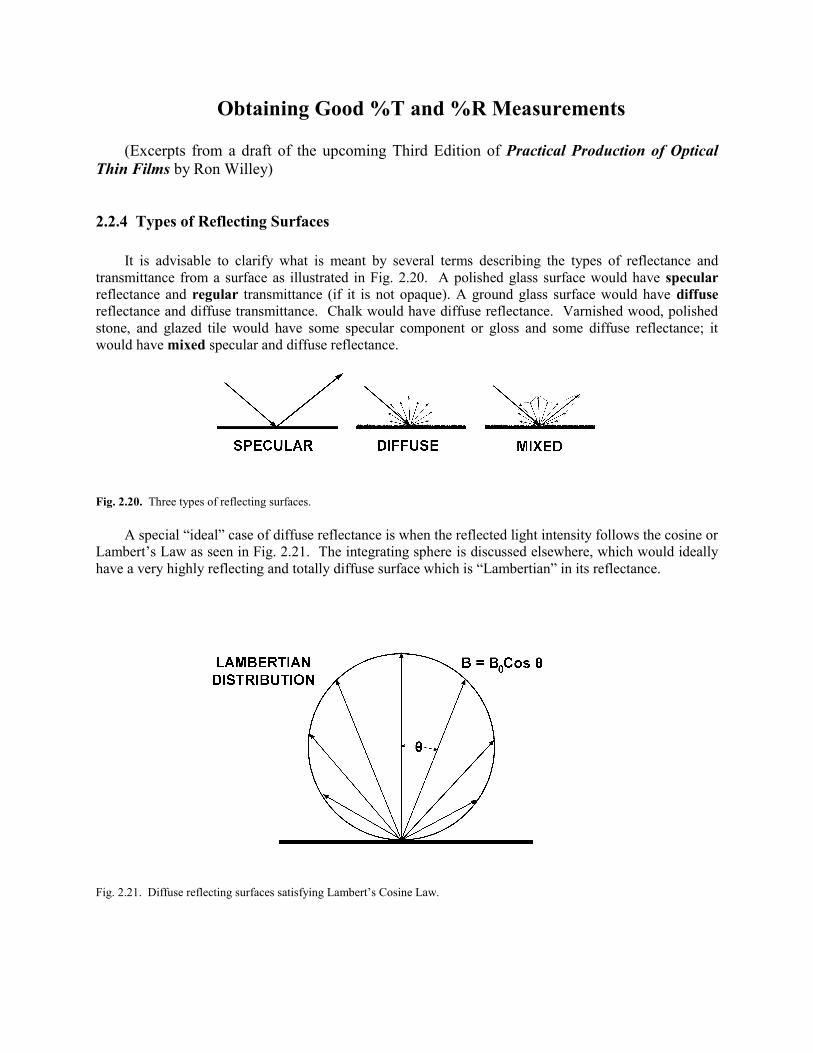
It is advisable to clarify what is meant by several terms describing the types of reflectance and
transmittance from a surface as illustrated in Fig. 2.20. A polished glass surface would have specular
reflectance and regular transmittance (if it is not opaque). A ground glass surface would have diffuse
reflectance and diffuse transmittance. Chalk would have diffuse reflectance. Varnished wood, polished
stone, and glazed tile would have some specular component or gloss and some diffuse reflectance; it
would have mixed specular and diffuse reflectance.
Fig. 2.20. Three types of reflecting surfaces.
A special “ideal” case of diffuse reflectance is when the reflected light intensity follows the cosine or
Lambert’s Law as seen in Fig. 2.21. The integrating sphere is discussed elsewhere, which would ideally
have a very highly reflecting and totally diffuse surface which is “Lambertian” in its reflectance.
Fig. 2.21. Diffuse reflecting surfaces satisfying Lambert’s Cosine Law.
2.2.6. Measuring Transmittance
There are occasional papers in the journals and sections in texts on the fine points of the
measurement of optical coatings such as Arndt et al.59
, but seldom a review of "common" practice for a
person new to the field. We will here attempt to help with that problem of "how to measure" before
embarking on what to do with those measurements.
Different spectrophotometers have different f-number beams in their sample compartments and
different minimum sample sizes in their beams. Older instruments may have been f/10 while some newer
ones may be f/4. This beam convergence/divergence may need to be taken into account where coatings
are angle sensitive. For example, a 100 GHz DWDM filter will shift a significant portion of its
bandwidth (0.4 nm) with a one degree tilt. This means that such a filter cannot be properly measured with
an ordinary spectrophotometer because the beam divergence will distort the band shape significantly. A
typical beam in a grating instrument is also a millimeter or more wide and about a centimeter high at its
smallest point. Again, the DWDM filter of ~1.5 mm square could not be measured properly in such a
beam. A new family of instruments have appeared for the DWDM field such as Optical Spectrum
Analyzers (OSAs). These are built around the tunable lasers, Gradient Index Lenses (GRINs), and the
fiber optics of the field that they serve. They usually measure in Decibels (dB) rather than %T. Although
an OSA is very different in detail, in the final result it is a spectrophotometer.
Infrared instruments are subject to effects of the absorption of water vapor and CO2 in the
atmosphere. These are most noticeable at about 2.7, 3.2, and 6.2 m for H2O, and at 2.7, 4.3, and 15 m
for CO2. If the atmosphere in the instrument changes from when the 100%T calibration was run to when
the sample is run, there may be spectral artifacts at some of these wavelengths. If this is a problem, the
instrument can be purged with dry nitrogen to eliminate the effects. Similar things can be said for regions
of the ultraviolet (UV, 200-400 nm). The region from 40 to 200 nm in the UV is referred to as the vacuum
ultraviolet (VUV) because the atmosphere absorbs at those short wavelengths and instruments must be
evacuated to be effective. We understand that a dry nitrogen purge might be usable for some cases in the
UV.
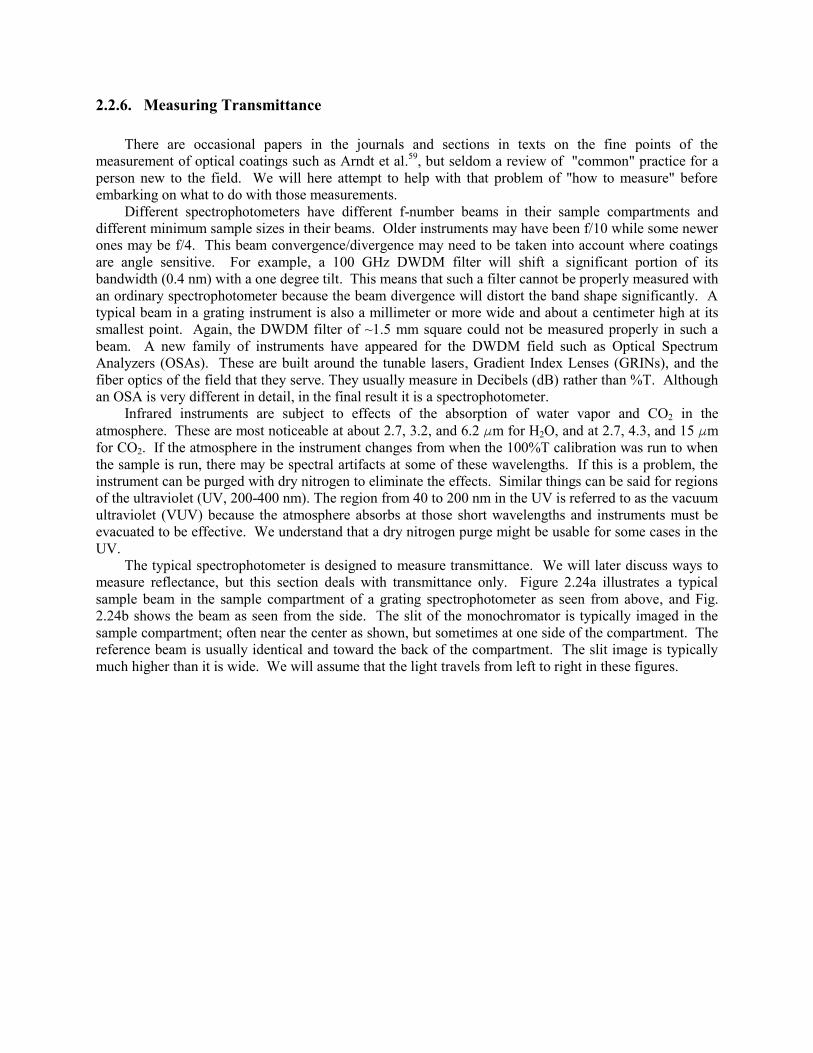
The typical spectrophotometer is designed to measure transmittance. We will later discuss ways to
measure reflectance, but this section deals with transmittance only. Figure 2.24a illustrates a typical
sample beam in the sample compartment of a grating spectrophotometer as seen from above, and Fig.
2.24b shows the beam as seen from the side. The slit of the monochromator is typically imaged in the
sample compartment; often near the center as shown, but sometimes at one side of the compartment. The
reference beam is usually identical and toward the back of the compartment. The slit image is typically
much higher than it is wide. We will assume that the light travels from left to right in these figures.
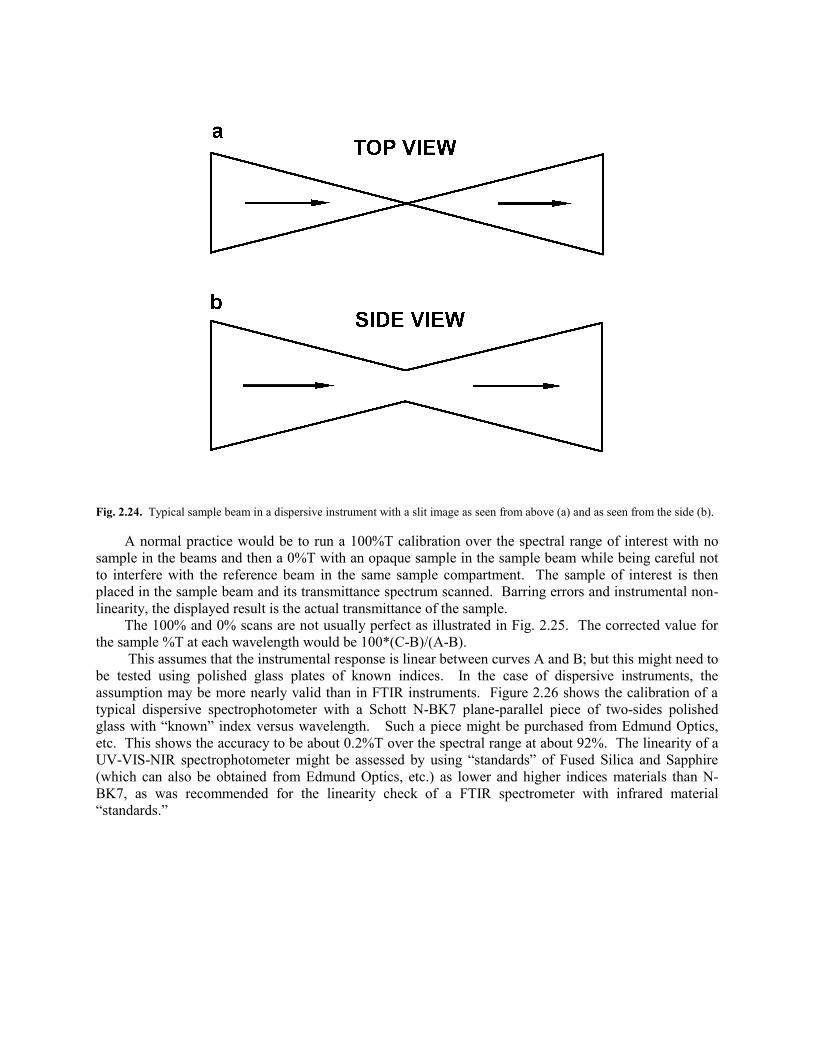
Fig. 2.24. Typical sample beam in a dispersive instrument with a slit image as seen from above (a) and as seen from the side (b).
A normal practice would be to run a 100%T calibration over the spectral range of interest with no
sample in the beams and then a 0%T with an opaque sample in the sample beam while being careful not
to interfere with the reference beam in the same sample compartment. The sample of interest is then
placed in the sample beam and its transmittance spectrum scanned. Barring errors and instrumental non-
linearity, the displayed result is the actual transmittance of the sample.
The 100% and 0% scans are not usually perfect as illustrated in Fig. 2.25. The corrected value for
the sample %T at each wavelength would be 100*(C-B)/(A-B).
This assumes that the instrumental response is linear between curves A and B; but this might need to
be tested using polished glass plates of known indices. In the case of dispersive instruments, the
assumption may be more nearly valid than in FTIR instruments. Figure 2.26 shows the calibration of a
typical dispersive spectrophotometer with a Schott N-BK7 plane-parallel piece of two-sides polished
glass with “known” index versus wavelength. Such a piece might be purchased from Edmund Optics,
etc. This shows the accuracy to be about 0.2%T over the spectral range at about 92%. The linearity of a
UV-VIS-NIR spectrophotometer might be assessed by using “standards” of Fused Silica and Sapphire
(which can also be obtained from Edmund Optics, etc.) as lower and higher indices materials than N-
BK7, as was recommended for the linearity check of a FTIR spectrometer with infrared material
“standards.”
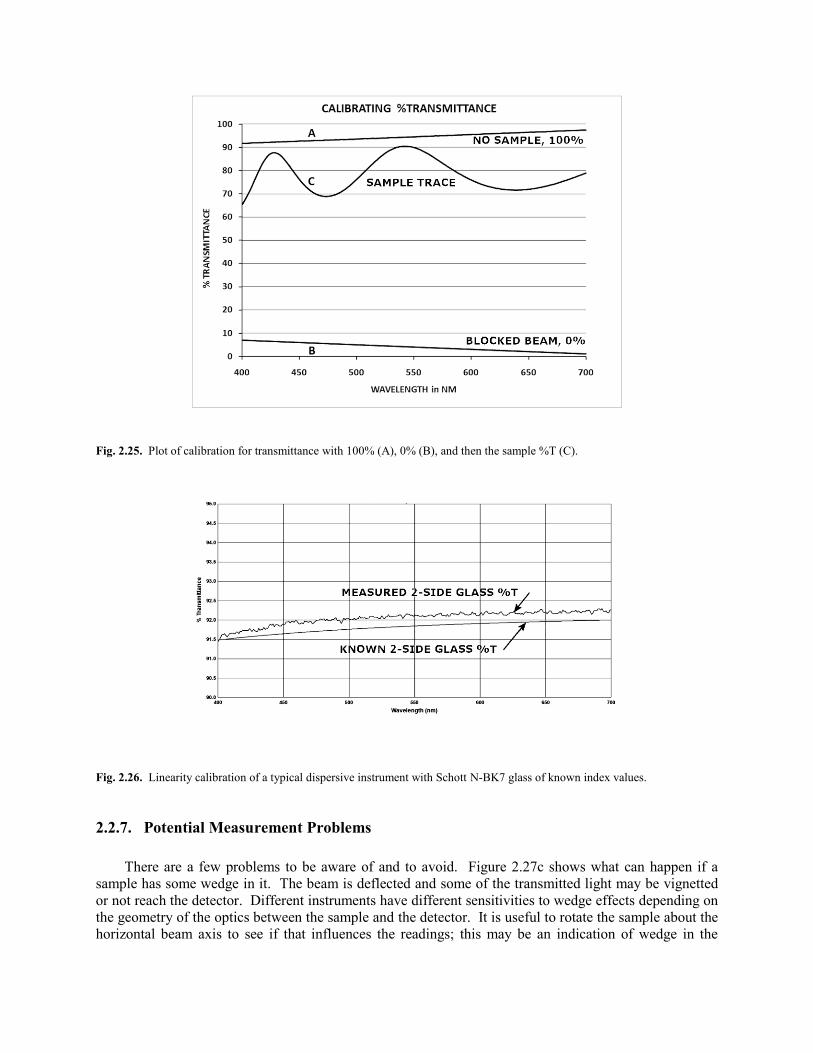
Fig. 2.25. Plot of calibration for transmittance with 100% (A), 0% (B), and then the sample %T (C).
Fig. 2.26. Linearity calibration of a typical dispersive instrument with Schott N-BK7 glass of known index values.
2.2.7. Potential Measurement Problems
There are a few problems to be aware of and to avoid. Figure 2.27c shows what can happen if a
sample has some wedge in it. The beam is deflected and some of the transmitted light may be vignetted
or not reach the detector. Different instruments have different sensitivities to wedge effects depending on
the geometry of the optics between the sample and the detector. It is useful to rotate the sample about the
horizontal beam axis to see if that influences the readings; this may be an indication of wedge in the
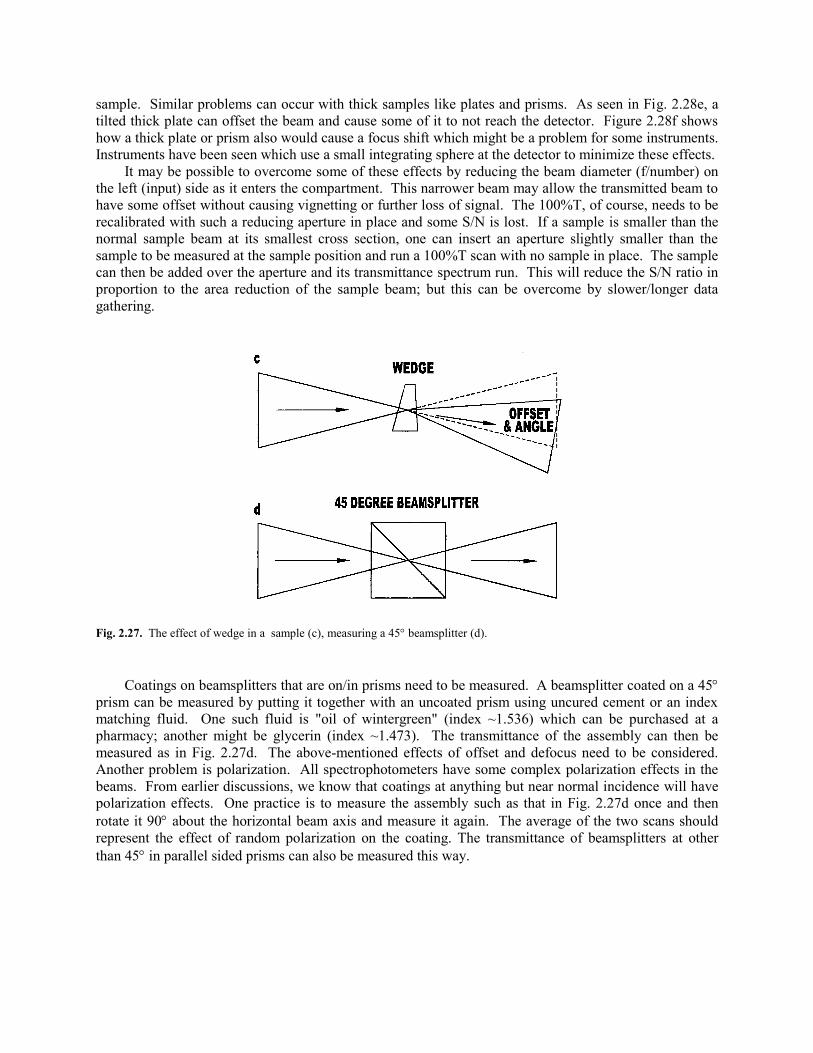
sample. Similar problems can occur with thick samples like plates and prisms. As seen in Fig. 2.28e, a
tilted thick plate can offset the beam and cause some of it to not reach the detector. Figure 2.28f shows
how a thick plate or prism also would cause a focus shift which might be a problem for some instruments.
Instruments have been seen which use a small integrating sphere at the detector to minimize these effects.
It may be possible to overcome some of these effects by reducing the beam diameter (f/number) on
the left (input) side as it enters the compartment. This narrower beam may allow the transmitted beam to
have some offset without causing vignetting or further loss of signal. The 100%T, of course, needs to be
recalibrated with such a reducing aperture in place and some S/N is lost. If a sample is smaller than the
normal sample beam at its smallest cross section, one can insert an aperture slightly smaller than the
sample to be measured at the sample position and run a 100%T scan with no sample in place. The sample
can then be added over the aperture and its transmittance spectrum run. This will reduce the S/N ratio in
proportion to the area reduction of the sample beam; but this can be overcome by slower/longer data
gathering.
Fig. 2.27. The effect of wedge in a sample (c), measuring a 45 beamsplitter (d).
Coatings on beamsplitters that are on/in prisms need to be measured. A beamsplitter coated on a 45
prism can be measured by putting it together with an uncoated prism using uncured cement or an index
matching fluid. One such fluid is "oil of wintergreen" (index ~1.536) which can be purchased at a
pharmacy; another might be glycerin (index ~1.473). The transmittance of the assembly can then be
measured as in Fig. 2.27d. The above-mentioned effects of offset and defocus need to be considered.
Another problem is polarization. All spectrophotometers have some complex polarization effects in the
beams. From earlier discussions, we know that coatings at anything but near normal incidence will have
polarization effects. One practice is to measure the assembly such as that in Fig. 2.27d once and then
rotate it 90 about the horizontal beam axis and measure it again. The average of the two scans should
represent the effect of random polarization on the coating. The transmittance of beamsplitters at other
than 45 in parallel sided prisms can also be measured this way.
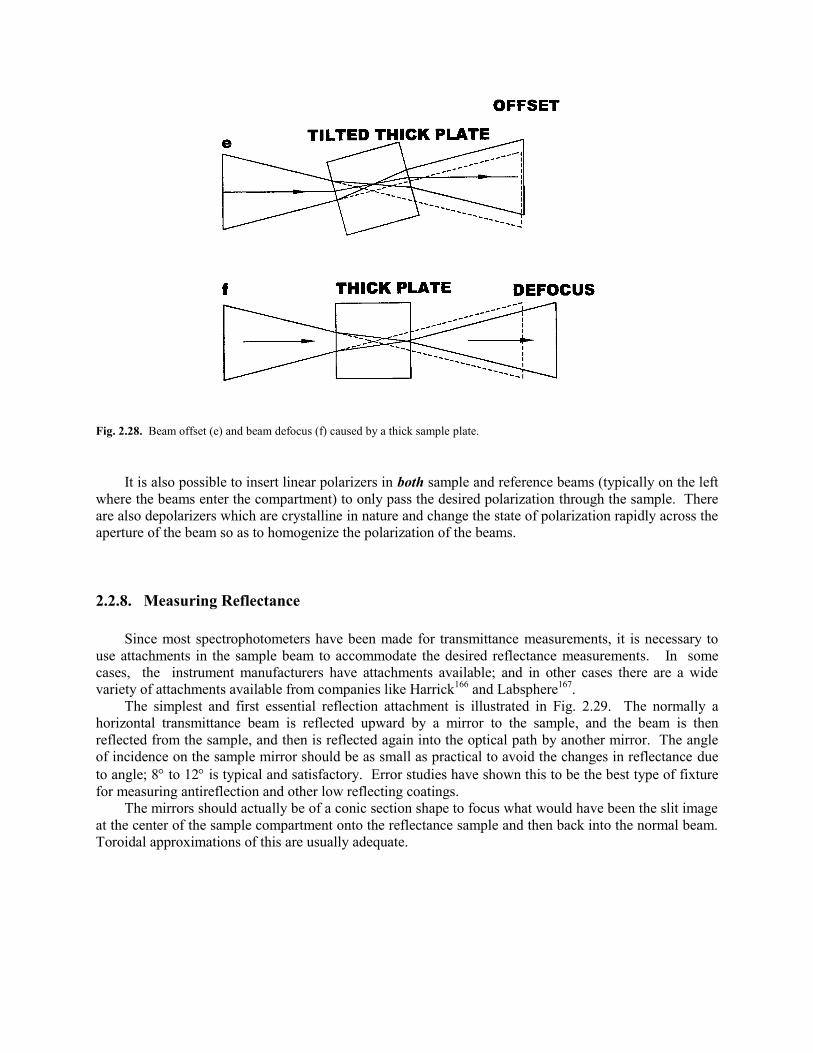
Fig. 2.28. Beam offset (e) and beam defocus (f) caused by a thick sample plate.
It is also possible to insert linear polarizers in both sample and reference beams (typically on the left
where the beams enter the compartment) to only pass the desired polarization through the sample. There
are also depolarizers which are crystalline in nature and change the state of polarization rapidly across the
aperture of the beam so as to homogenize the polarization of the beams.
2.2.8. Measuring Reflectance
Since most spectrophotometers have been made for transmittance measurements, it is necessary to
use attachments in the sample beam to accommodate the desired reflectance measurements. In some
cases, the instrument manufacturers have attachments available; and in other cases there are a wide
variety of attachments available from companies like Harrick166
and Labsphere167
.
The simplest and first essential reflection attachment is illustrated in Fig. 2.29. The normally a
horizontal transmittance beam is reflected upward by a mirror to the sample, and the beam is then
reflected from the sample, and then is reflected again into the optical path by another mirror. The angle
of incidence on the sample mirror should be as small as practical to avoid the changes in reflectance due
to angle; 8 to 12 is typical and satisfactory. Error studies have shown this to be the best type of fixture
for measuring antireflection and other low reflecting coatings.
The mirrors should actually be of a conic section shape to focus what would have been the slit image
at the center of the sample compartment onto the reflectance sample and then back into the normal beam.
Toroidal approximations of this are usually adequate.
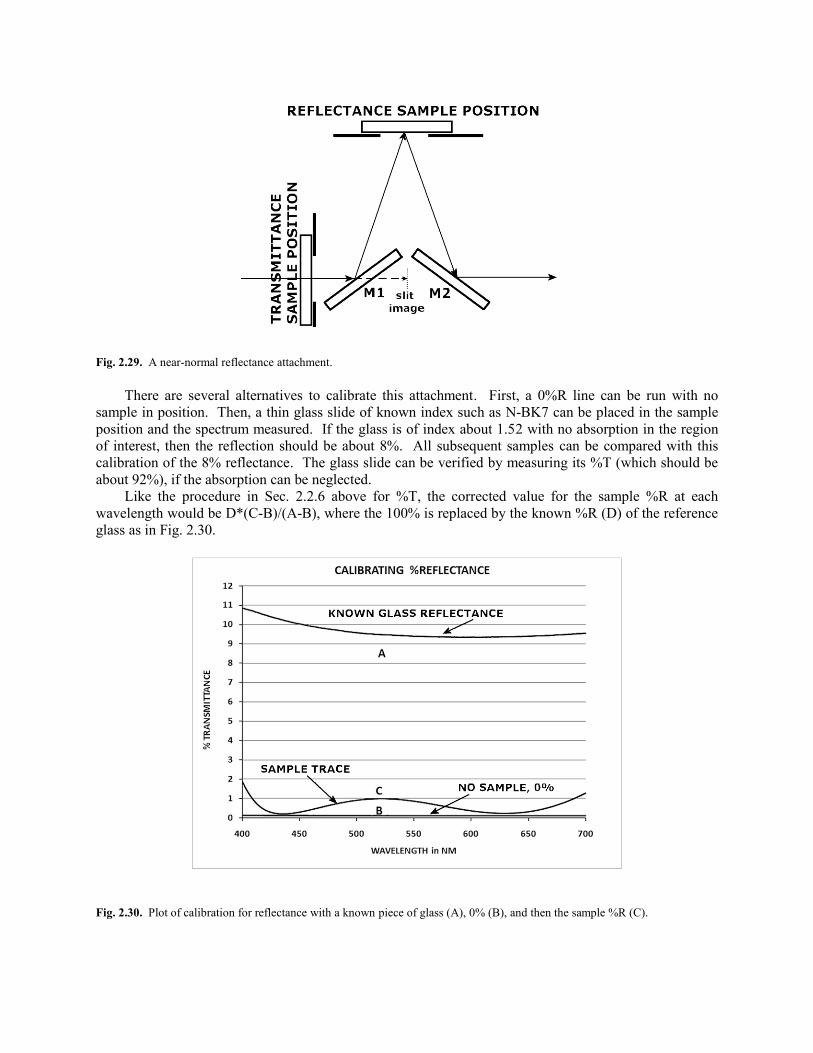
Fig. 2.29. A near-normal reflectance attachment.
There are several alternatives to calibrate this attachment. First, a 0%R line can be run with no
sample in position. Then, a thin glass slide of known index such as N-BK7 can be placed in the sample
position and the spectrum measured. If the glass is of index about 1.52 with no absorption in the region
of interest, then the reflection should be about 8%. All subsequent samples can be compared with this
calibration of the 8% reflectance. The glass slide can be verified by measuring its %T (which should be
about 92%), if the absorption can be neglected.
Like the procedure in Sec. 2.2.6 above for %T, the corrected value for the sample %R at each
wavelength would be D*(C-B)/(A-B), where the 100% is replaced by the known %R (D) of the reference
glass as in Fig. 2.30.
Fig. 2.30. Plot of calibration for reflectance with a known piece of glass (A), 0% (B), and then the sample %R (C).

Another alternative is to measure only the one-side reflectance of a known glass. This can be done
several ways. As illustrated in Fig. 2.31, one approach is to coarse grind the back side of a sample so that
the light reflected from the back is scattered widely, and hopefully very little of the light from the rear
surface gets back into the beam that reaches the detector. The suitability of this approach will be more
dependent on the f/number of the instrument. Some people further blacken the ground surface with a
black making pen to reduce the reflection from the ground side. We recommend however to paint the
back side of the flat witness with what amounts to an index matching fluid filled with carbon black (black
paint). In this case, all the light reaching the rear surface enters the vehicle (which has an index near that
of the glass, thus producing very little reflection at the interface) of the black lacquer (such as black
KrylonTM
spray paint) and is absorbed by the carbon black, thus only the front surface reflection is
measured. It can be useful to use the last case illustrated in Fig. 2.31, where a single witness piece is
painted black on one area for %R measurements and the rest is left clear for %T measurements.
Fig. 2.31. Ways to treat %R witness samples for accurate measurement. For calibration of one-side reflectance, there are a few additional geometries that can be used. Some
facilities use a two-side polished witness glass of known index with a significant wedge between the
bottom and top surfaces. The back surface should then be at such an angle that none of the light reflected
from it gets back into the sample beam that reaches the detector. This wedge would then reflect about 4%
depending on the exact index of the glass. A variant of this wedge technique is to have a coating sample
on a thin plane parallel glass witness piece which is then oiled to such a wedge with index matching fluid
such as oil of wintergreen or glycerin to create the same effect as the wedge alone.
Two recommended examples of eliminating the effects of the second side reflectance of a
Reflectance Standard are shown in Figs. 2.32 and 2.33. Here prisms are used which have had all sides
except the reference surface painted with black paint to capture the transmitted light through the first
surface. This double light trap should be very effective as a replacement for the oiled wedge mentioned
above. Prisms of N-BK7 and Fused Silica (without any coating) can be obtained from Edmund Optics,
etc., for a reasonable price, and then painted with Black Krylon spray paint to be reflectance “standards.”
However, simply painting the back of plane-parallel witnesses should be adequate for this work in most
facilities.

Fig. 2.32. A light trap possibility for a one-side calibration standard or and oil-on second-side reflection remover.
Fig. 2.33. Another light trap possibility for a one-side calibration standard or and oil-on second-side reflection remover.
2.2.9. Checking Linearity of Reflectance Measurements
It is appropriate to check the linearity of the %R measurements also, since erroneous measurements
have caused extensive problems in the AR coating industry. Figure 2.34 illustrates the procedure where
the known glass such as N-BK7 is used in both its two-side and one-side reflectances. The two-side
reflection is used the calibrate as described in Fig. 2.30; then the one-side can be used to check linearity
against its known value. In the case of Fig. 2.34, we see an error of about 0.4%R.
In Fig. 2.35, further checking is done using Fused Silica in two-side and one-side %R after the N-
BK7 calibration. This shows about 0.3%R error for one-side and a “crossing” from plus to minus errors
on the two-side reflectance. Such tests indicate the confidence level which can be expected from any
given measurements.
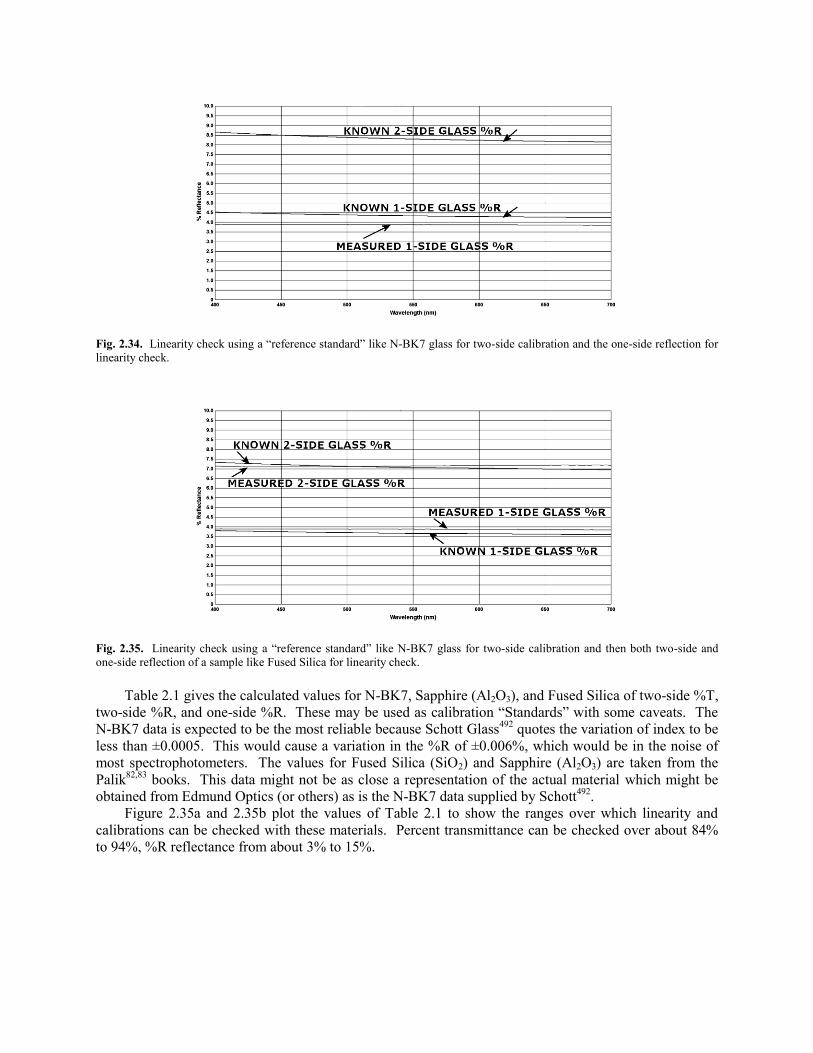
Fig. 2.34. Linearity check using a “reference standard” like N-BK7 glass for two-side calibration and the one-side reflection for
linearity check.
Fig. 2.35. Linearity check using a “reference standard” like N-BK7 glass for two-side calibration and then both two-side and
one-side reflection of a sample like Fused Silica for linearity check.
Table 2.1 gives the calculated values for N-BK7, Sapphire (Al2O3), and Fused Silica of two-side %T,
two-side %R, and one-side %R. These may be used as calibration “Standards” with some caveats. The
N-BK7 data is expected to be the most reliable because Schott Glass492
quotes the variation of index to be
less than ±0.0005. This would cause a variation in the %R of ±0.006%, which would be in the noise of
most spectrophotometers. The values for Fused Silica (SiO2) and Sapphire (Al2O3) are taken from the
Palik82,83
books. This data might not be as close a representation of the actual material which might be
obtained from Edmund Optics (or others) as is the N-BK7 data supplied by Schott492
.
Figure 2.35a and 2.35b plot the values of Table 2.1 to show the ranges over which linearity and
calibrations can be checked with these materials. Percent transmittance can be checked over about 84%
to 94%, %R reflectance from about 3% to 15%.
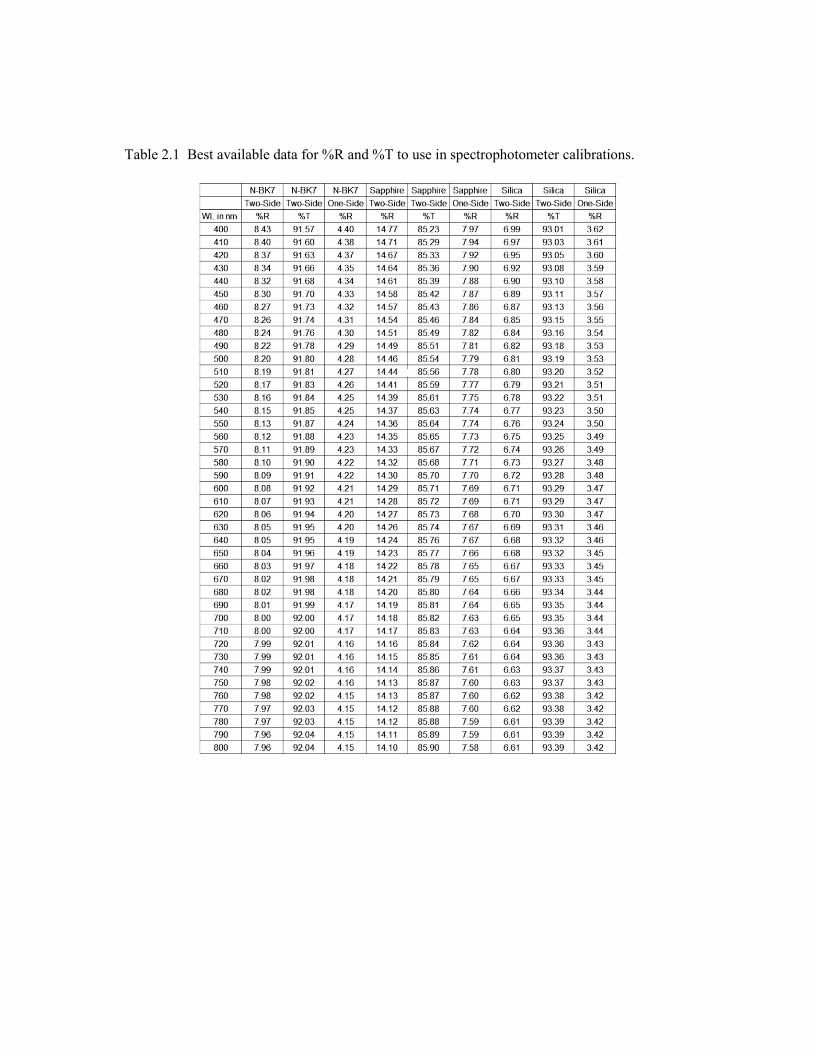
Table 2.1 Best available data for %R and %T to use in spectrophotometer calibrations.
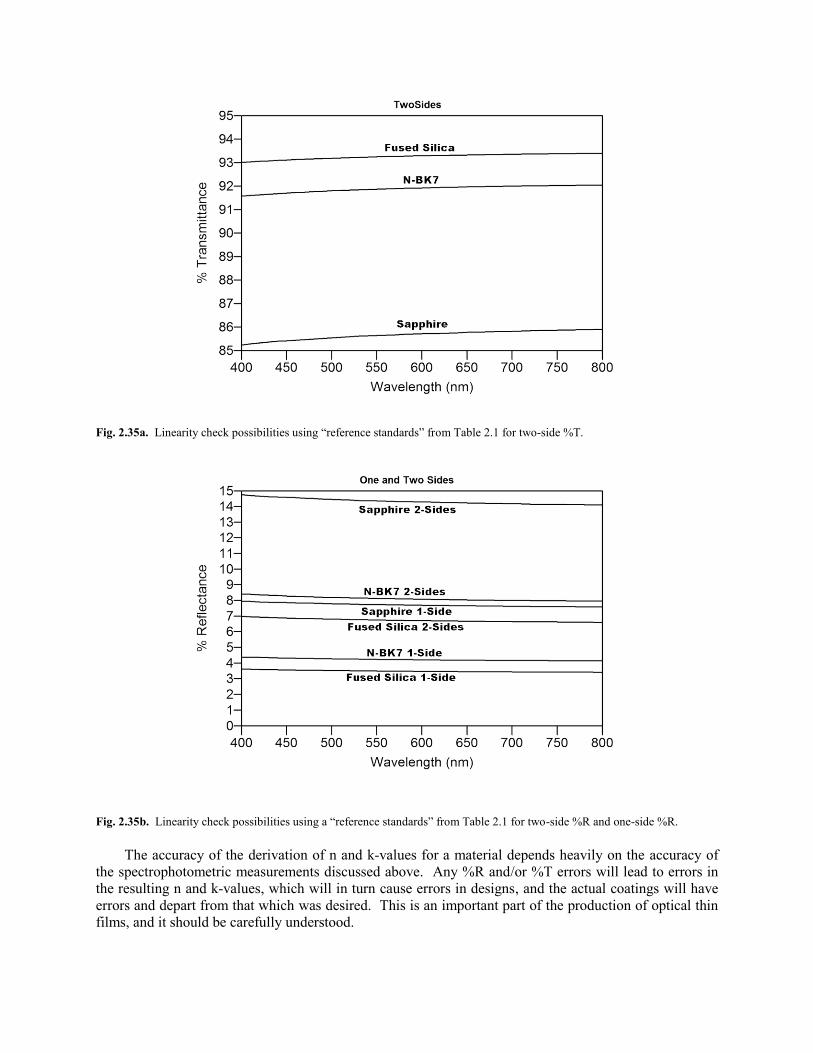
Fig. 2.35a. Linearity check possibilities using “reference standards” from Table 2.1 for two-side %T.
Fig. 2.35b. Linearity check possibilities using a “reference standards” from Table 2.1 for two-side %R and one-side %R.
The accuracy of the derivation of n and k-values for a material depends heavily on the accuracy of
the spectrophotometric measurements discussed above. Any %R and/or %T errors will lead to errors in
the resulting n and k-values, which will in turn cause errors in designs, and the actual coatings will have
errors and depart from that which was desired. This is an important part of the production of optical thin
films, and it should be carefully understood.
REFERENCES
59. D. P. Arndt, R. M. A. Azzam, J. M. Bennett, J. P. Borgogno, C. K. Carniglia, W. E. Case, J. A. Dobrowolski, U. J. Gibson, T.
T. Hart, F. C. Ho, V. A. Hodgkin, W. P. Klapp, H. A. Macleod, E. Pelletier, M. K. Purvis, D. M. Quinn, D. H. Strome, R.
Swenson, P. A. Temple, and T. F. Thonn: "Multiple determination of the optical constants of thin-film coating materials,"
Appl. Opt. 23, 3571-3596 (1984).
82. E. D. Palik: Handbook of Optical Constants of Solids, (Academic Press, Boston, 1985).
83. E. D. Palik: Handbook of Optical Constants of Solids II, (Academic Press, Boston, 1991).
166. Harrick Scientific Corp., 88 Broadway, Ossining, NY 10562-0997.
167. Labsphere, Inc., Shaker St., North Sutton, NH 03260-0070.
492. Schott Glass Catalogs, http://www.us.schott.com/advanced_optics/english/our_products/materials/data_tools/index.html