Embed Size (px)
Citation preview
Observing Home Wireless Experience through WiFi
APs
Observing Home Wireless Experience through WiFi
APsMobiCom ‘13 September 2013
A. Patro, S. Govindan, S. BanerjeeUniversity of Wisconsin Madison
Presented by Bob Kinicki
PEDS Seminar18 November 2013
MotivationMotivation
Generally, while home WiFi users get reasonably good performance most of the time, there remain instances when home network performance remains frustratingly slow.
Most researchers over the last decade have deployed passive sniffers to understand and evaluate specific wireless characteristics. 2PEDS 18 November 2013 Home AP Measurement
Research GoalsResearch Goals
1. To perform a more systematic study of WiFi experience in home environments and provide a detailed characterization.
2. To evaluate the community’s collective intuition of WiFi network performance.
3PEDS 18 November 2013 Home AP Measurement

ObjectivesObjectives
To answer these questions:– How often does home WiFi provide good,
mediocre or bad performance?– When performance is bad –what are the
causes and how long does it persist?– How much interference do we see and what
sources provide the interference?– How do users configure their WiFi networks?
4PEDS 18 November 2013 Home AP Measurement
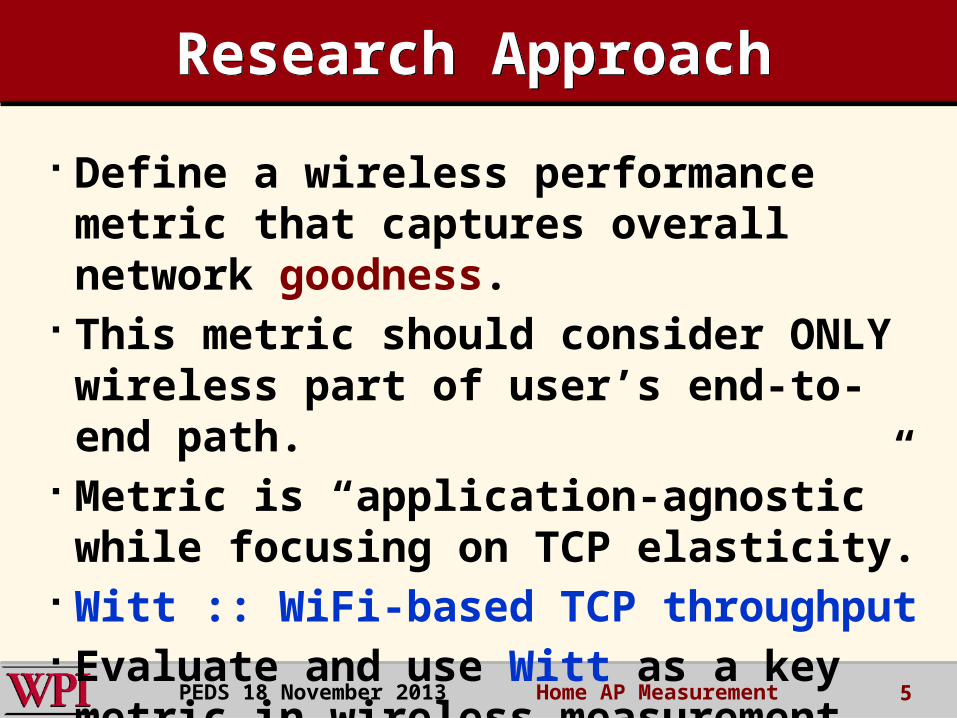
Research ApproachResearch Approach
Define a wireless performance metric that captures overall network goodness.
This metric should consider ONLY wireless part of user’s end-to-end path.
Metric is “application-agnostic” while focusing on TCP elasticity.
Witt :: WiFi-based TCP throughput Evaluate and use Witt as a key metric in wireless measurement study.
5PEDS 18 November 2013 Home AP Measurement
OutlineOutline
Introduction WiSe Infrastructure and Framework
How was Witt constructed? Use Witt to Classify WiFi Experience
Analyze detailed Results from Measurement Study– To answer the posed questions.
Summary and Critique 6PEDS 18 November 2013 Home AP Measurement
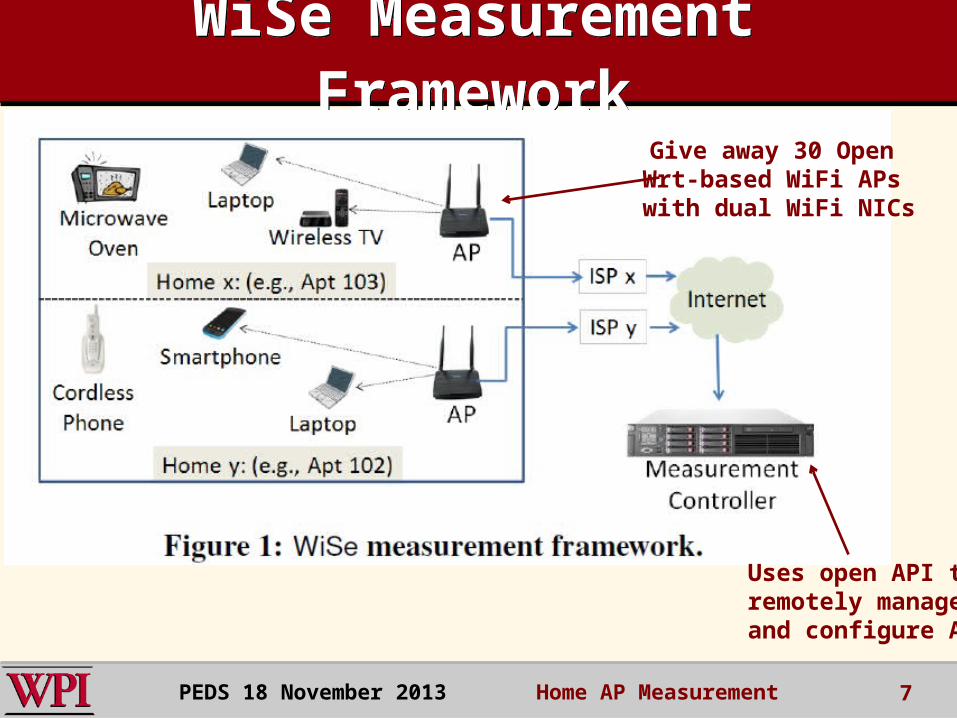
WiSe Measurement Framework
WiSe Measurement Framework
7
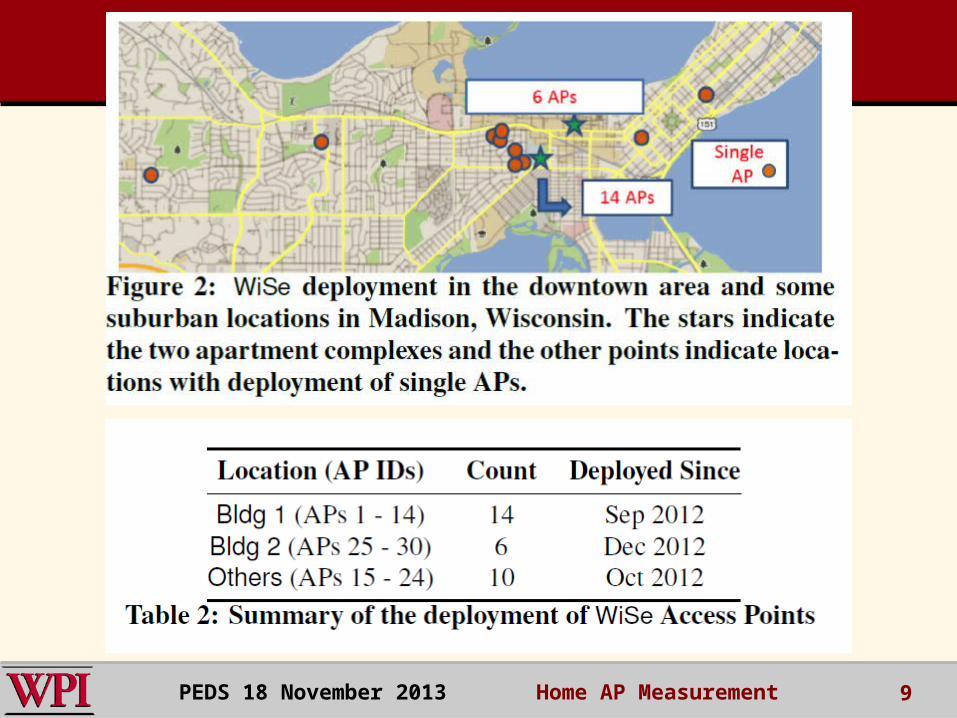
Give away 30 OpenWrt-based WiFi APs with dual WiFi NICs
Uses open API toremotely manageand configure APs
PEDS 18 November 2013 Home AP Measurement
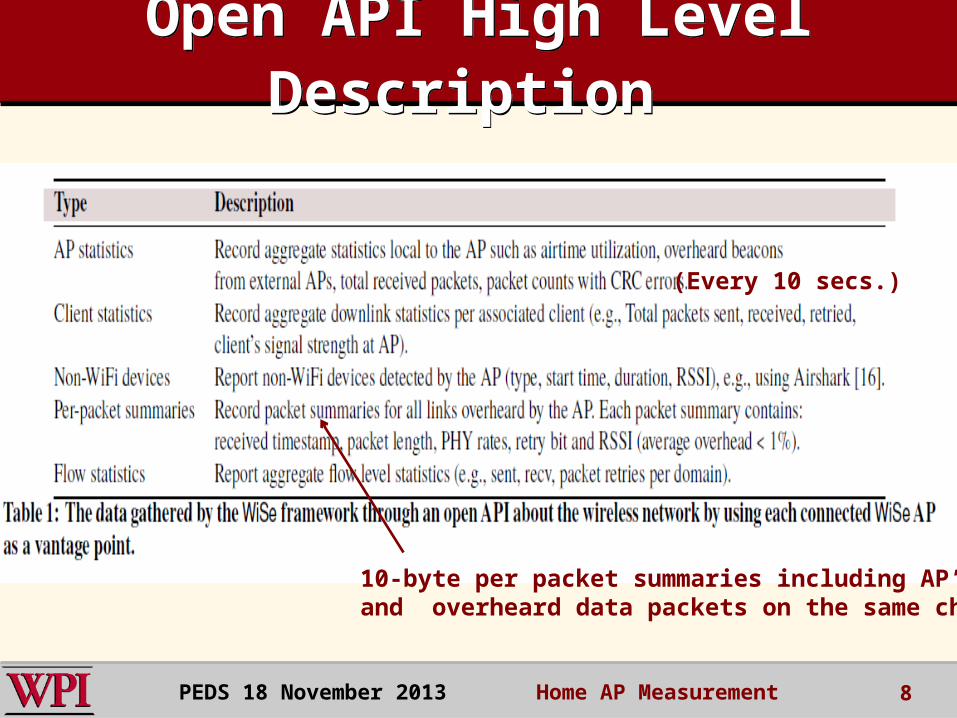
Open API High Level Description
Open API High Level Description
8
(Every 10 secs.)
10-byte per packet summaries including AP’s own linksand overheard data packets on the same channel
PEDS 18 November 2013 Home AP Measurement
9PEDS 18 November 2013 Home AP Measurement
Wide-Ranging Daily WiFi Usage
Wide-Ranging Daily WiFi Usage
10
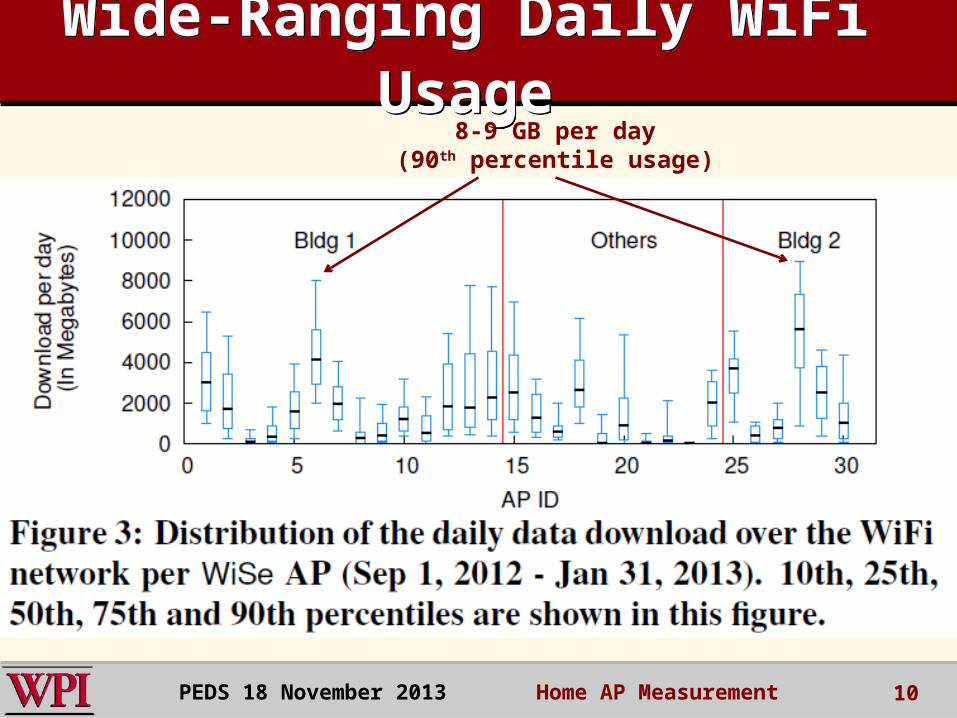
8-9 GB per day(90th percentile usage)
PEDS 18 November 2013 Home AP Measurement
OutlineOutline
Introduction WiSe Infrastructure and Framework
How was Witt constructed? Use Witt to Classify WiFi Experience
Analyze detailed Results from Measurement Study– To answer the posed questions.
Summary and Critique 11PEDS 18 November 2013 Home AP Measurement
Witt: WiFi-based TCP ThroughputWitt: WiFi-based TCP Throughput
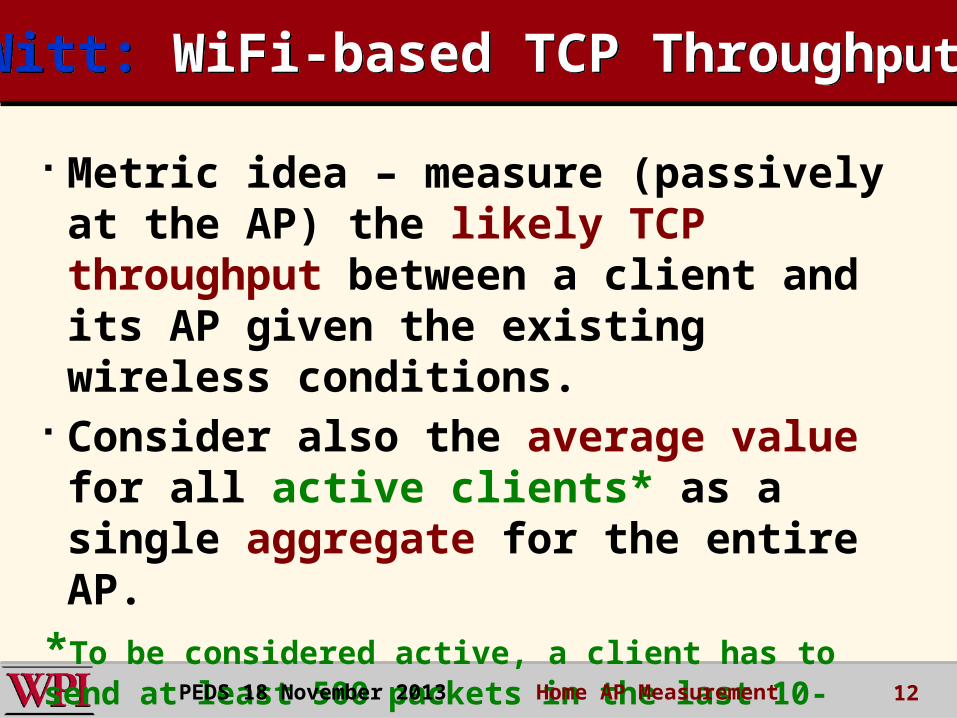
Metric idea – measure (passively at the AP) the likely TCP throughput between a client and its AP given the existing wireless conditions.
Consider also the average value for all active clients* as a single aggregate for the entire AP.
*To be considered active, a client has to send at least 500 packets in the last 10-second window. 12PEDS 18 November 2013 Home AP Measurement
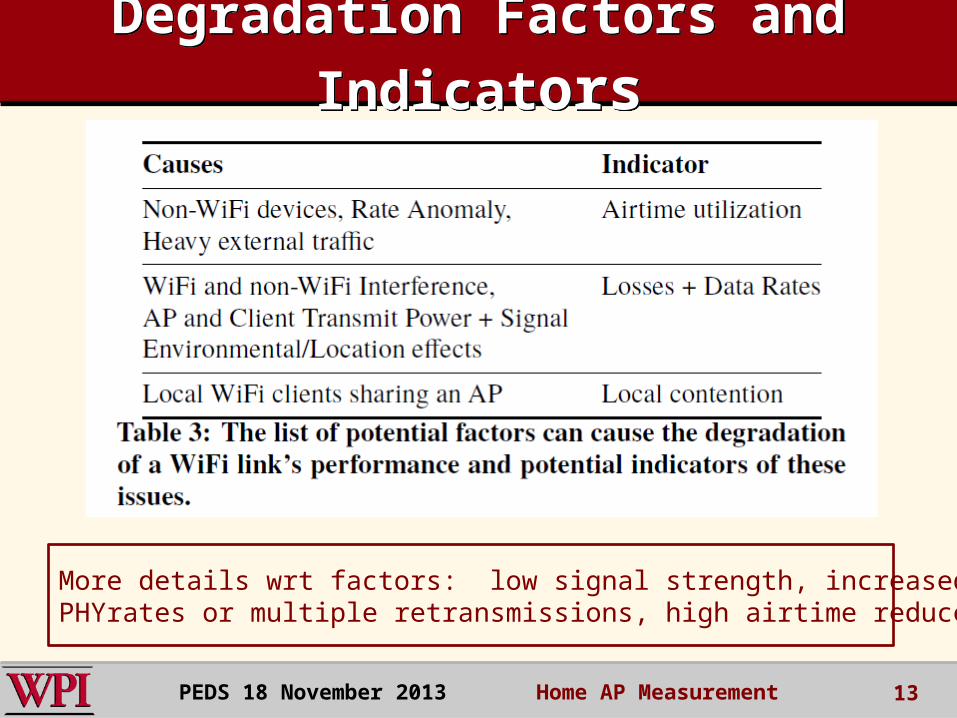
Degradation Factors and Indicators
Degradation Factors and Indicators
13
More details wrt factors: low signal strength, increased delay due to reduced PHYrates or multiple retransmissions, high airtime reduces ability to send
PEDS 18 November 2013 Home AP Measurement

How to measure Witt?How to measure Witt?Collect ‘ground truth’ measurements under a variety of conditions.
– Four of their own clients (laptops) co-existed with WiSe APs at eight different deployment locations in the apartment buildings.
– Iperf TCP download run between WiSE APs and clients for 20 seconds.
– Clients ran throughput measurements in intervals of 5 to 10 minutes over the course of a week.
14PEDS 18 November 2013 Home AP Measurement
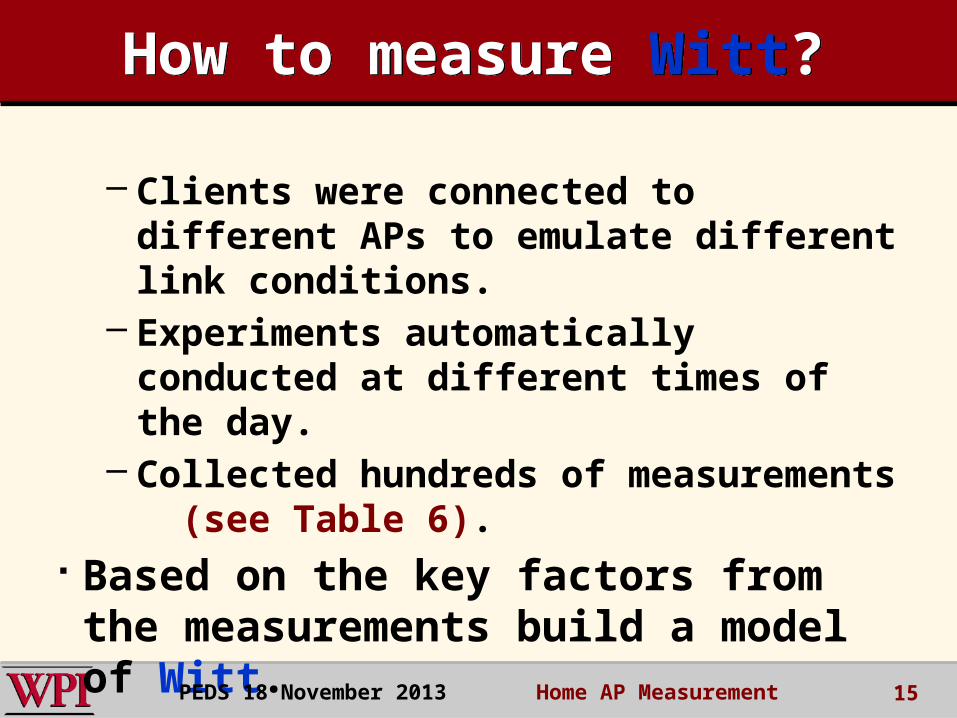
How to measure Witt?How to measure Witt?
– Clients were connected to different APs to emulate different link conditions.
– Experiments automatically conducted at different times of the day.
– Collected hundreds of measurements (see Table 6).
Based on the key factors from the measurements build a model of Witt.
Use benchmarks to evaluate Witt.15PEDS 18 November 2013 Home AP Measurement
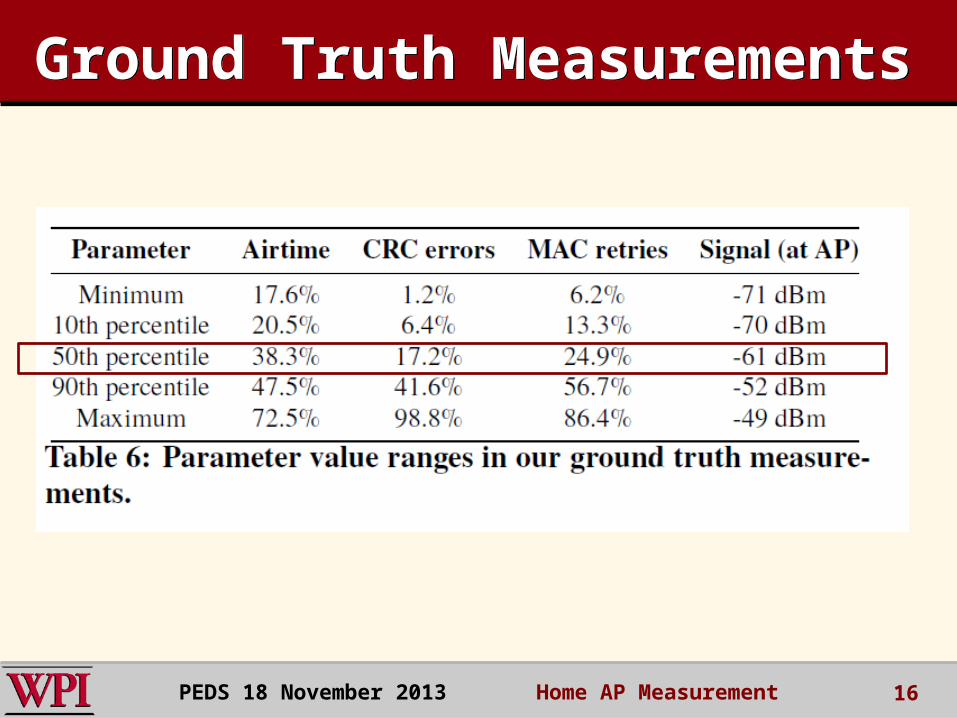
16
Ground Truth MeasurementsGround Truth
Measurements
PEDS 18 November 2013 Home AP Measurement
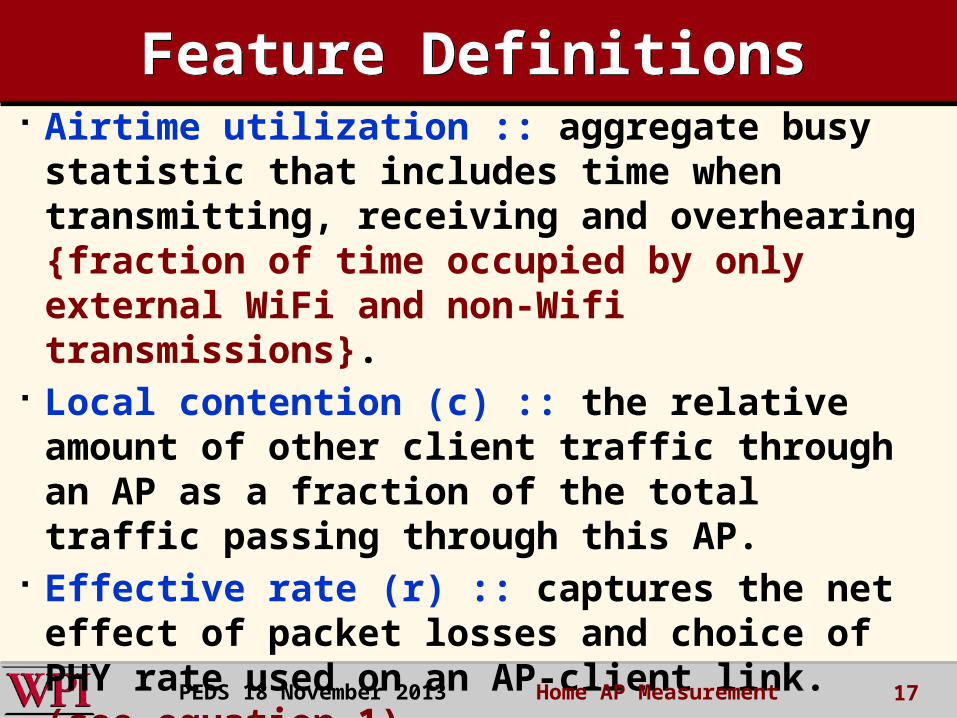
Airtime utilization :: aggregate busy statistic that includes time when transmitting, receiving and overhearing {fraction of time occupied by only external WiFi and non-Wifi transmissions}.
Local contention (c) :: the relative amount of other client traffic through an AP as a fraction of the total traffic passing through this AP.
Effective rate (r) :: captures the net effect of packet losses and choice of PHY rate used on an AP-client link. (see equation 1)
Link experience (link_exp) :: (see equation 2)
17
Feature DefinitionsFeature Definitions
PEDS 18 November 2013 Home AP Measurement
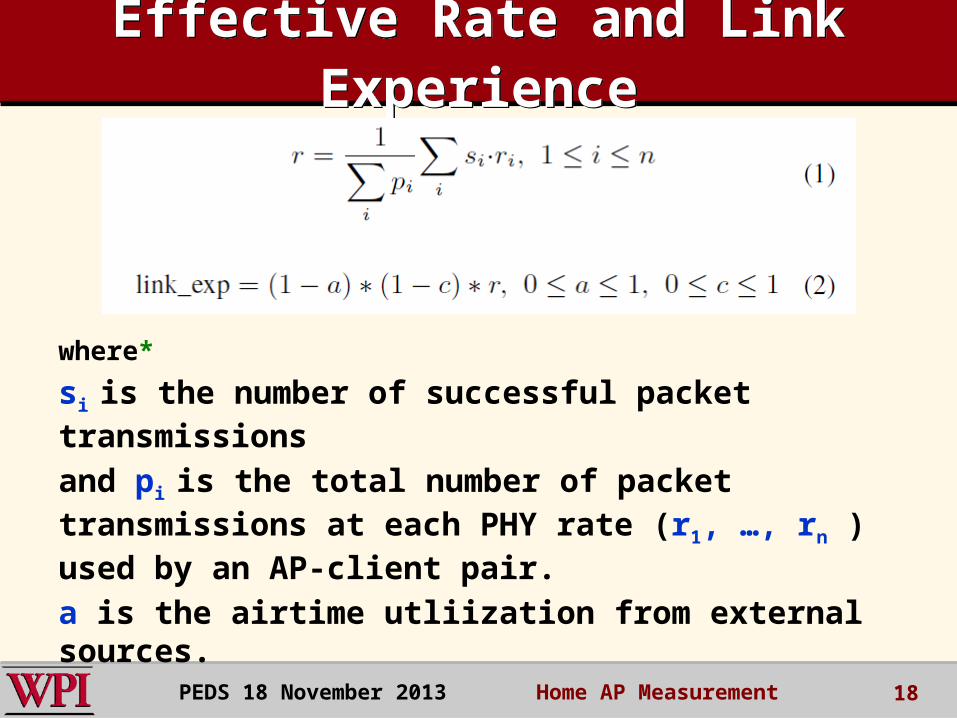
Effective Rate and Link Experience
Effective Rate and Link Experience
18
where*
si is the number of successful packet transmissionsand pi is the total number of packet transmissions at each PHY rate (r1, …, rn ) used by an AP-client pair.a is the airtime utliization from external sources.
*Note – all features are based on aggregate stats per link (collected over 10 second intervals).
PEDS 18 November 2013 Home AP Measurement
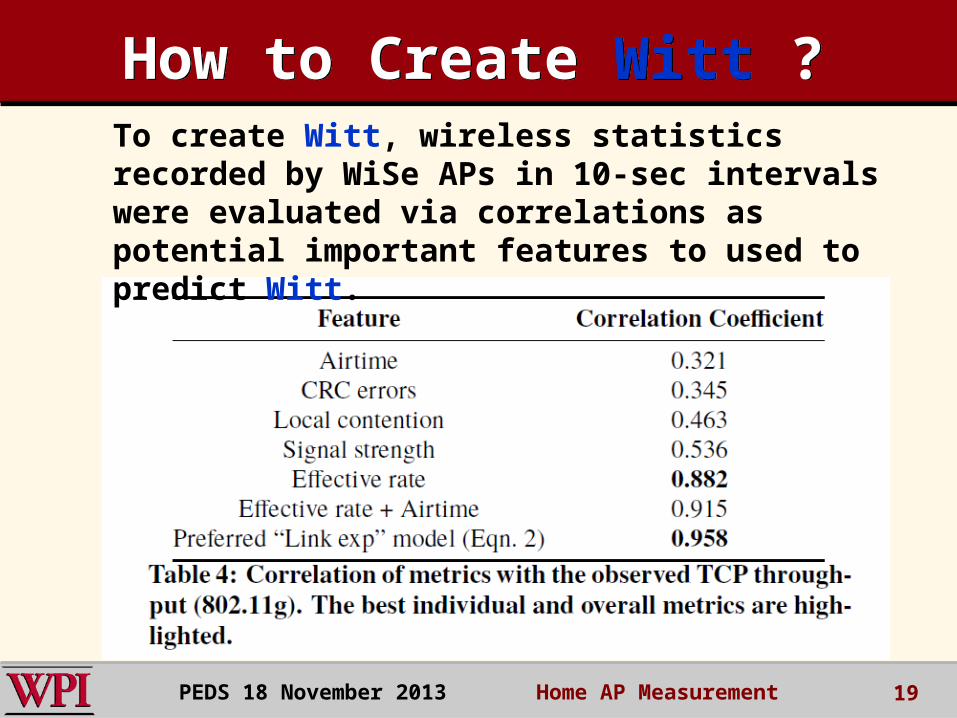
19
How to Create Witt ?How to Create Witt ?To create Witt, wireless statistics recorded by WiSe APs in 10-sec intervals were evaluated via correlations as potential important features to used to predict Witt.
PEDS 18 November 2013 Home AP Measurement
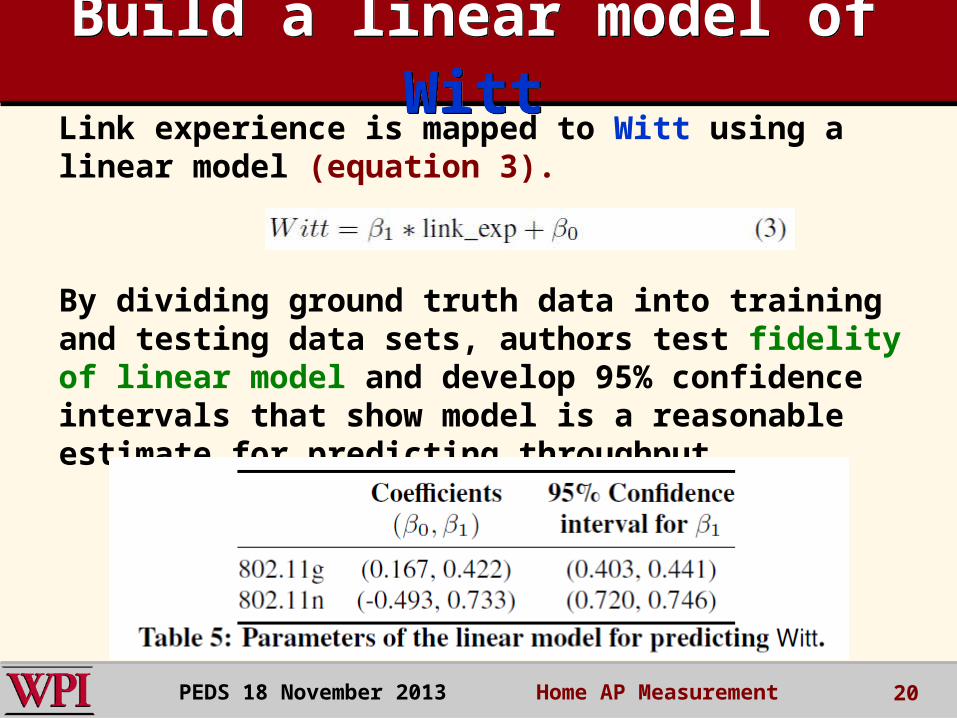
Build a linear model of Witt
Build a linear model of Witt
Link experience is mapped to Witt using a linear model (equation 3).
By dividing ground truth data into training and testing data sets, authors test fidelity of linear model and develop 95% confidence intervals that show model is a reasonable estimate for predicting throughput.
20PEDS 18 November 2013 Home AP Measurement
Benchmarks to Evaluate Witt
Benchmarks to Evaluate Witt
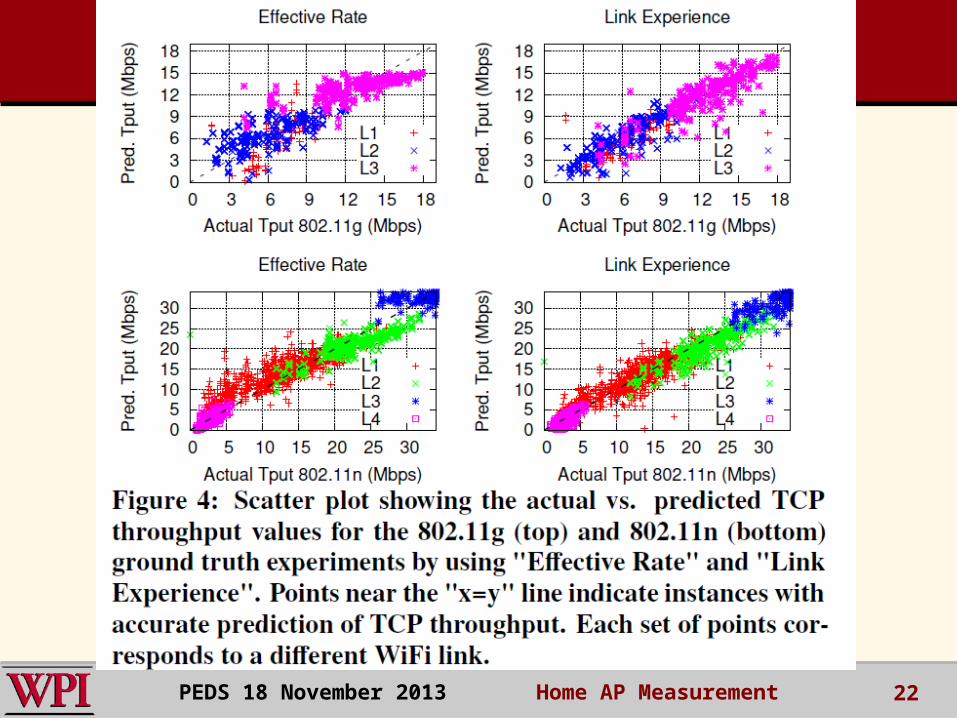
Ground truth TCP throughput measurements are compared against predicted TCP throughputs using linear regression of effective rate and link experience (see Figure 4).
CDF of errors between actual vs predicted TCP throughputs using different metrics (see Figure 5).
21PEDS 18 November 2013 Home AP Measurement
22PEDS 18 November 2013 Home AP Measurement
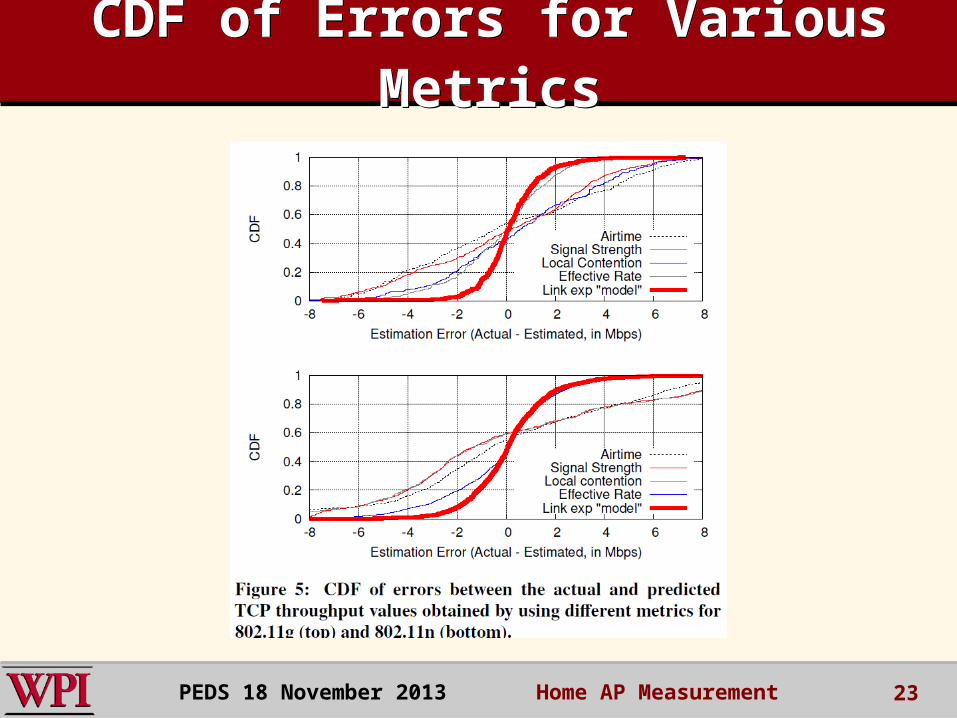
CDF of Errors for Various MetricsCDF of Errors for Various Metrics
23PEDS 18 November 2013 Home AP Measurement
OutlineOutline
Introduction WiSe Infrastructure and Framework
How was Witt constructed? Use Witt to Classify WiFi Experience
Analyze detailed Results from Measurement Study– To answer the posed questions.
Summary and Critique 24PEDS 18 November 2013 Home AP Measurement
Use Witt to ClassifyWireless ExperienceUse Witt to ClassifyWireless Experience
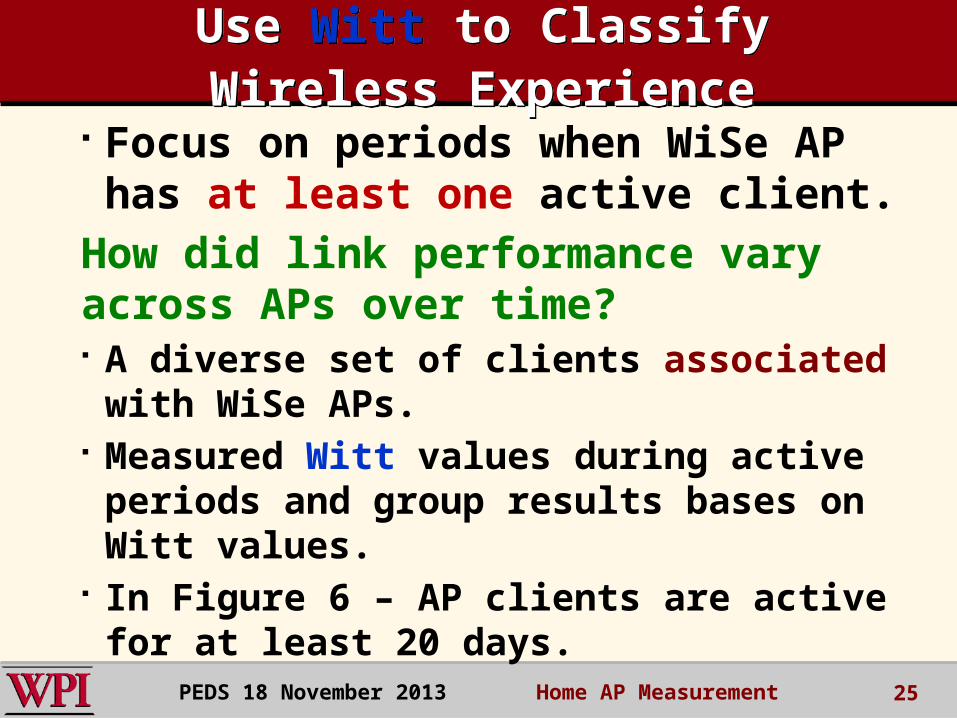
Focus on periods when WiSe AP has at least one active client.
How did link performance vary across APs over time? A diverse set of clients associated with WiSe APs.
Measured Witt values during active periods and group results bases on Witt values.
In Figure 6 – AP clients are active for at least 20 days.
25PEDS 18 November 2013 Home AP Measurement
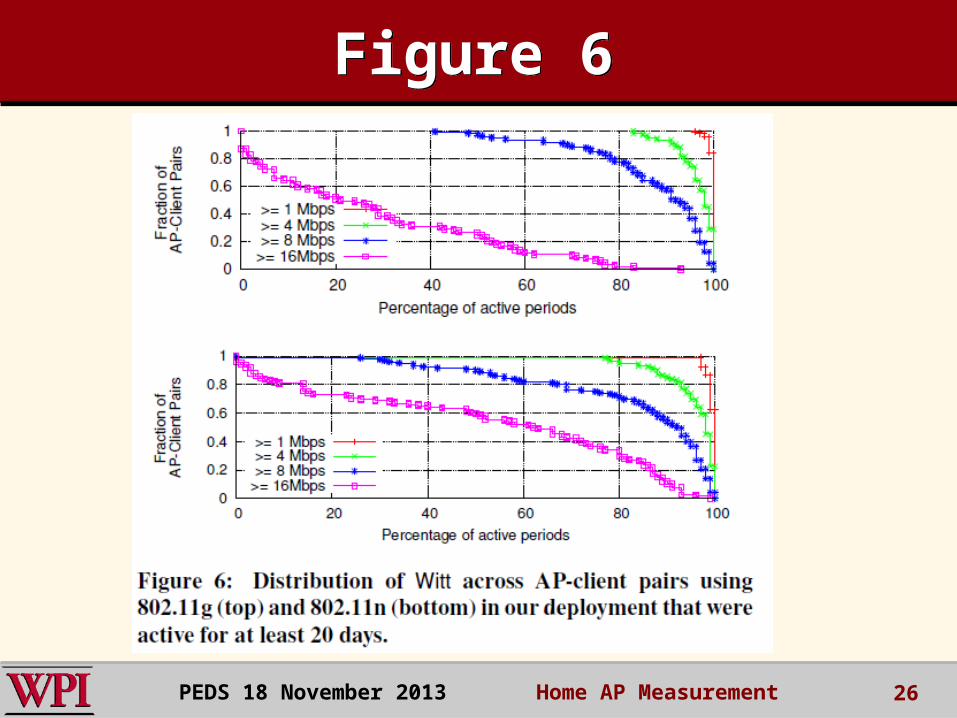
Figure 6Figure 6
26PEDS 18 November 2013 Home AP Measurement
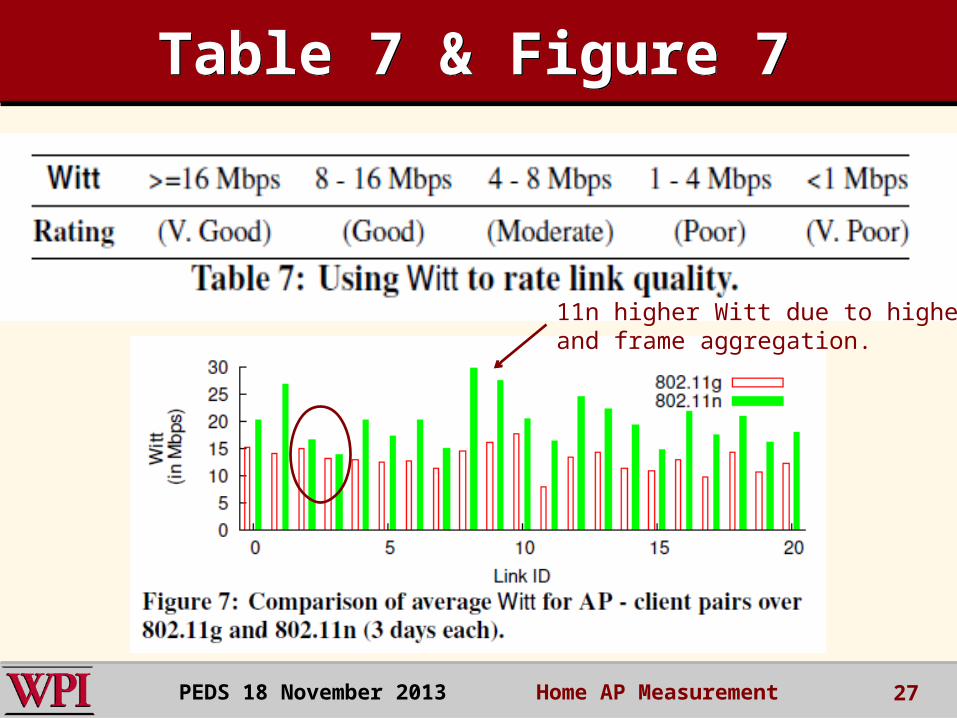
Table 7 & Figure 7Table 7 & Figure 7
27PEDS 18 November 2013 Home AP Measurement
11n higher Witt due to higher PHY ratesand frame aggregation.
Over 80 days (Nov 2012 – Jan 2013) detected 186 and 2031 minutes of “Very Poor” and “Poor” instances across all 30 WiSe APs (2.1% of the active periods).– Very poor periods rare; Poor periods occur
intermittently depending on link and location. Aggregated instances of poor performance across WiSe APs in each apartment.
28
Causes for Poor Wireless Experience
Causes for Poor Wireless Experience
PEDS 18 November 2013 Home AP Measurement
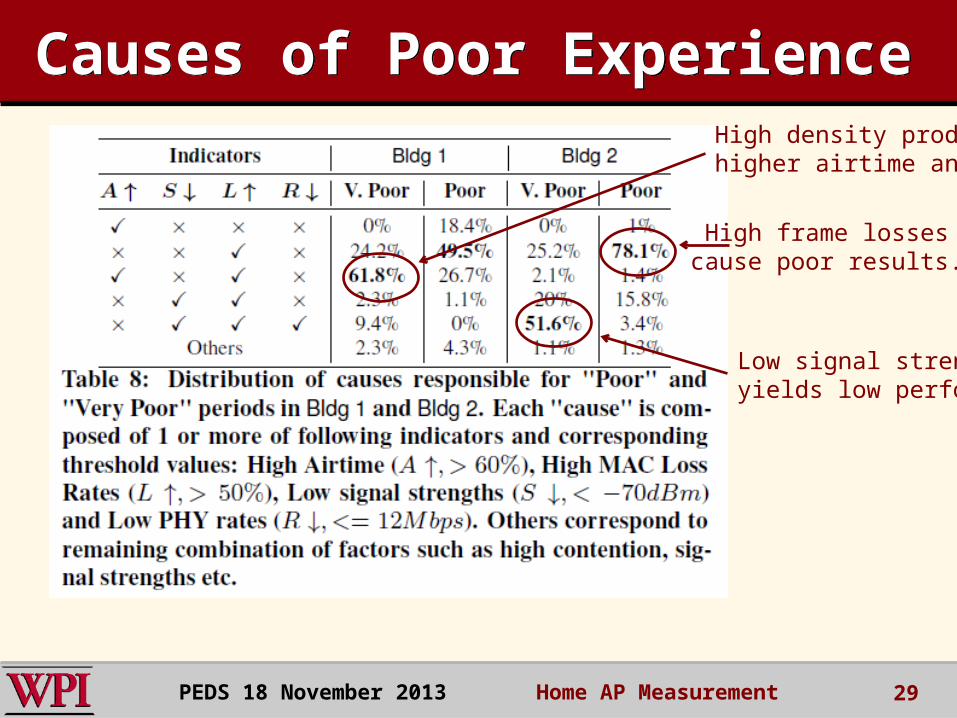
Causes of Poor ExperienceCauses of Poor Experience
29
High density produceshigher airtime and losses.
Low signal strengthyields low performance.
High frame lossescause poor results.
PEDS 18 November 2013 Home AP Measurement
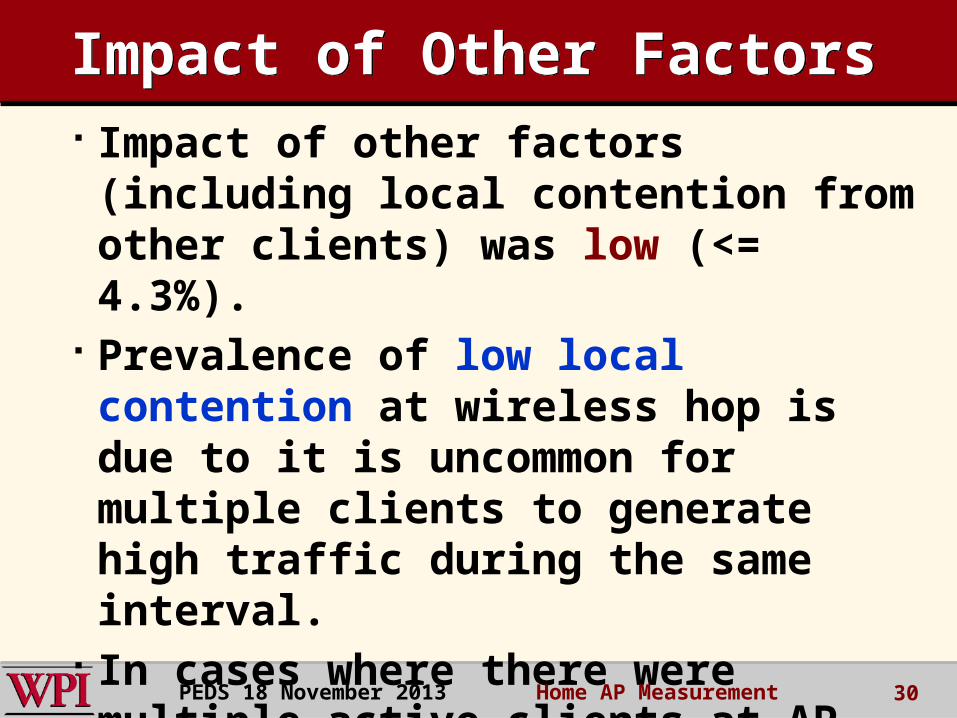
Impact of Other FactorsImpact of Other Factors Impact of other factors (including local contention from other clients) was low (<= 4.3%).
Prevalence of low local contention at wireless hop is due to it is uncommon for multiple clients to generate high traffic during the same interval.
In cases where there were multiple active clients at AP, bottleneck at the wired link led to lower contention.
30PEDS 18 November 2013 Home AP Measurement
31
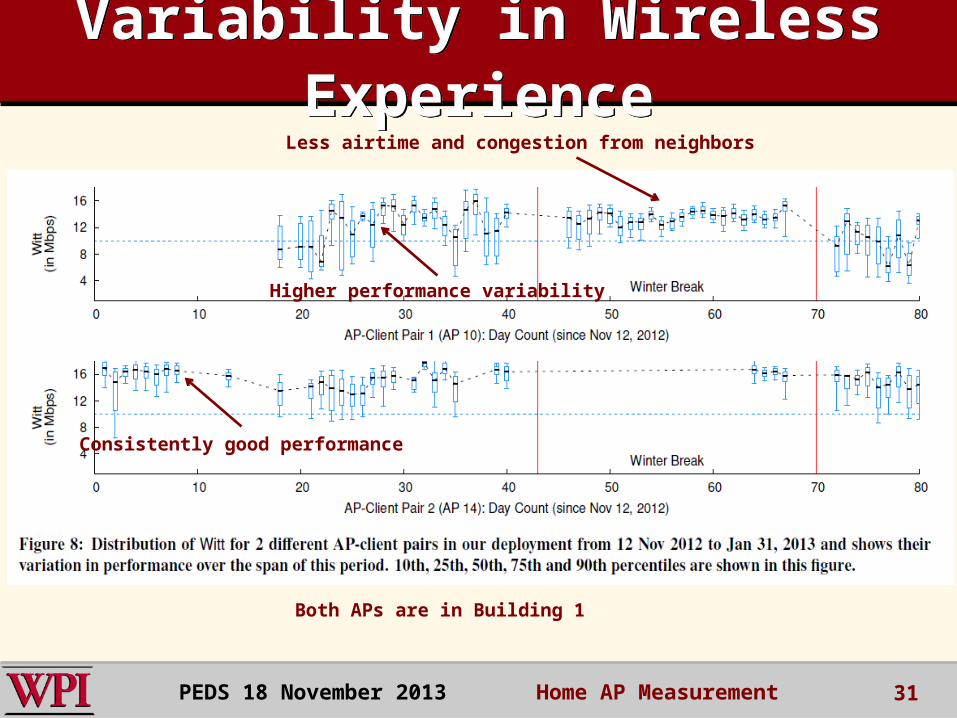
Variability in Wireless Experience
Variability in Wireless Experience
Consistently good performance
Higher performance variability
Less airtime and congestion from neighbors
PEDS 18 November 2013 Home AP Measurement
Both APs are in Building 1
OutlineOutline
Introduction WiSe Infrastructure and Framework
How was Witt constructed? Use Witt to Classify WiFi Experience
Analyze detailed Results from Measurement Study– To answer the posed questions.
Summary and Critique 32PEDS 18 November 2013 Home AP Measurement
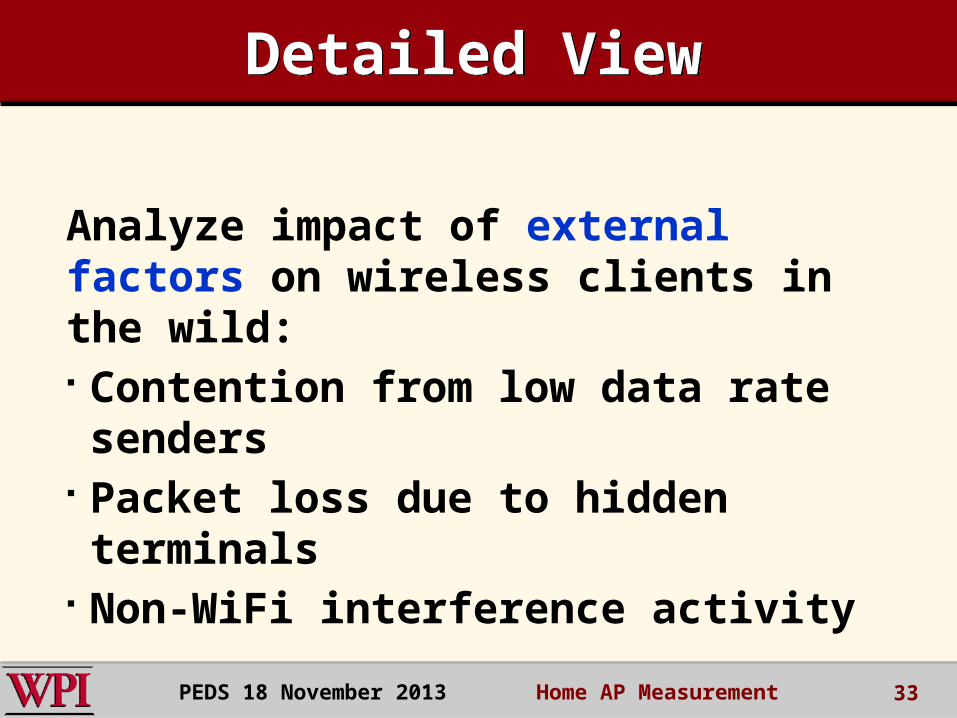
Detailed ViewDetailed View
Analyze impact of external factors on wireless clients in the wild: Contention from low data rate senders
Packet loss due to hidden terminals
Non-WiFi interference activity
33PEDS 18 November 2013 Home AP Measurement
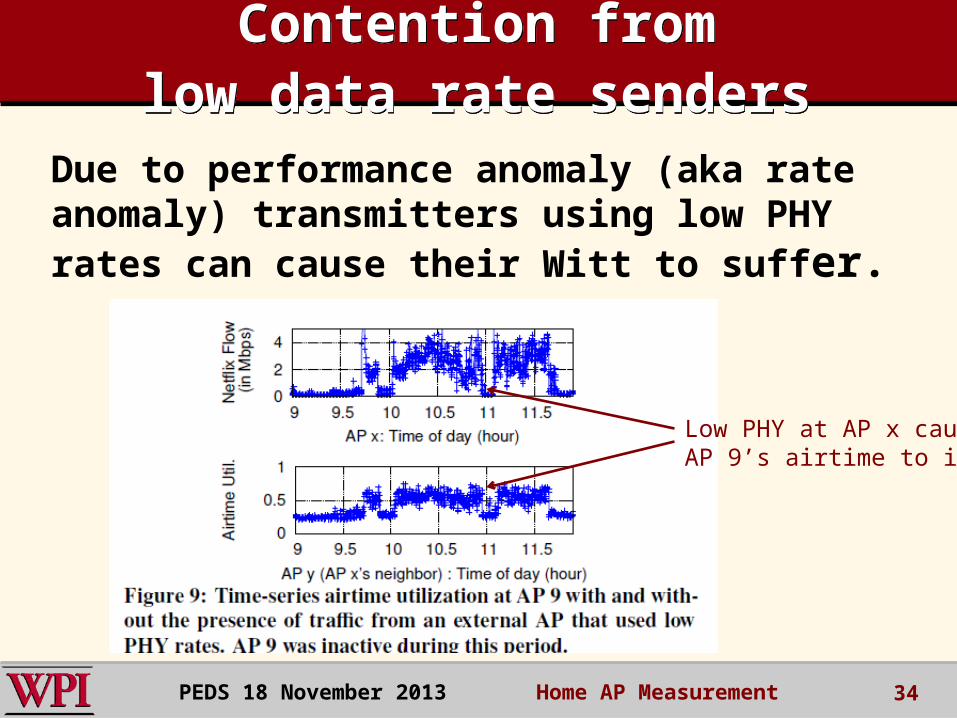
Contention fromlow data rate senders
Contention fromlow data rate senders
Due to performance anomaly (aka rate anomaly) transmitters using low PHY rates can cause their Witt to suffer.
34
Low PHY at AP x causesAP 9’s airtime to increase.
PEDS 18 November 2013 Home AP Measurement
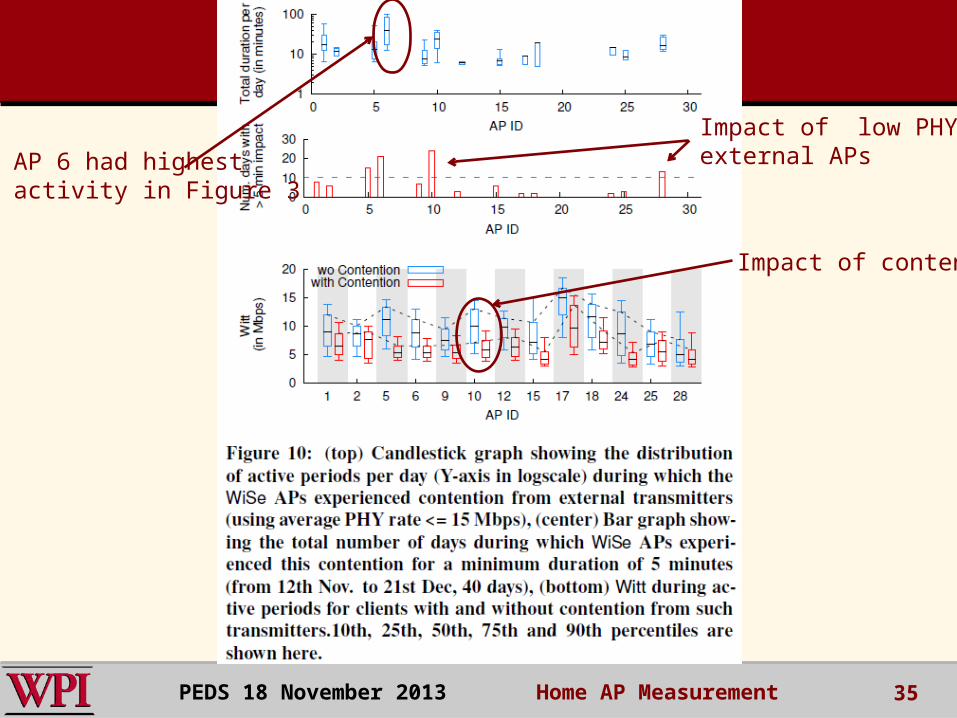
Figure 10Figure 10
35
Impact of contention
Impact of low PHY fromexternal APs AP 6 had highest
activity in Figure 3
PEDS 18 November 2013 Home AP Measurement
Packet Loss due to Hidden Terminals
Packet Loss due to Hidden Terminals
High packet loss was a major cause for “Poor” cases.
Hidden Terminals (HT) are an external factor that can reduce link’s Witt by increasing packet loss.
Used synchronized and merged packet summaries from multiple APs in Bldg 1 to compute HT events in 15-second epochs.
Packet loss at a receiver due to overlapping packet transmissions from the interferer is the main cause for a hidden terminal event. 36PEDS 18 November 2013 Home AP Measurement
Packet Loss due to Hidden Terminals
Packet Loss due to Hidden Terminals
For 15 second “epochs”, epoch is marked as HT event for WiSe AP when one of its link’s loss rates is 40% higher for packets overlapped in time by the interferer compared to packets not overlapped by any other transmitter.
Required constraint of 1000 packet minimum for a link and minimum of 100 packet overlaps from potential interferer per epoch to check for HT conflict (makes this a conservative estimate of interference experienced).
37PEDS 18 November 2013 Home AP Measurement
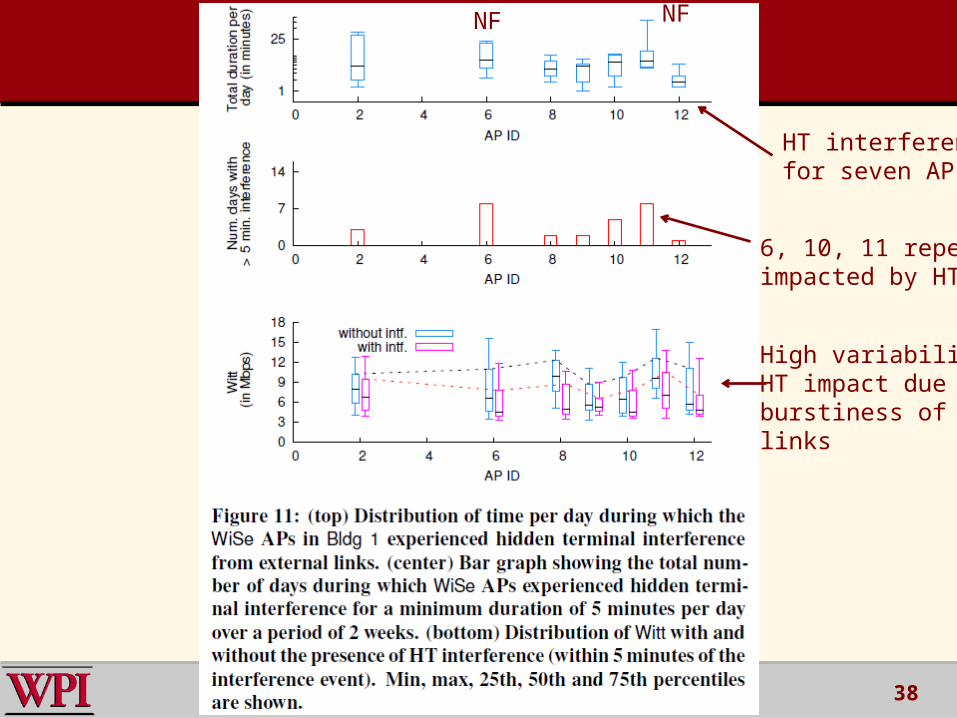
38
HT interferencefor seven APs
6, 10, 11 repeatedlyimpacted by HTs
High variability inHT impact due highburstiness of WiFilinks
NF NF
High Burstiness of TrafficHigh Burstiness of Traffic Only about 10% of total periods of continuous activity at the WiSe APs
lasted more than three minutes.{explains small periods of interference in homes}
Example – Netflix video streaming APs 6 and 11 (NF in Figure 11) periods of highest interference coincided with usage of Netflix. APs are more sensitive to HT interference issues during periods of high activity.
39PEDS 18 November 2013 Home AP Measurement
Non-WiFi Interference Activity
Non-WiFi Interference Activity
Interference by commonly available non-WiFi devices can degrade WiFi link performance (e.g,. Microwaves).
These devices do NOT have carrier sense before transmitting.
Authors use Airshark to detect presense of non-WiFi devices.
Since microwaves impact channels 8-11, conducted 30 day experiment with APs using channel 11.
40PEDS 18 November 2013 Home AP Measurement
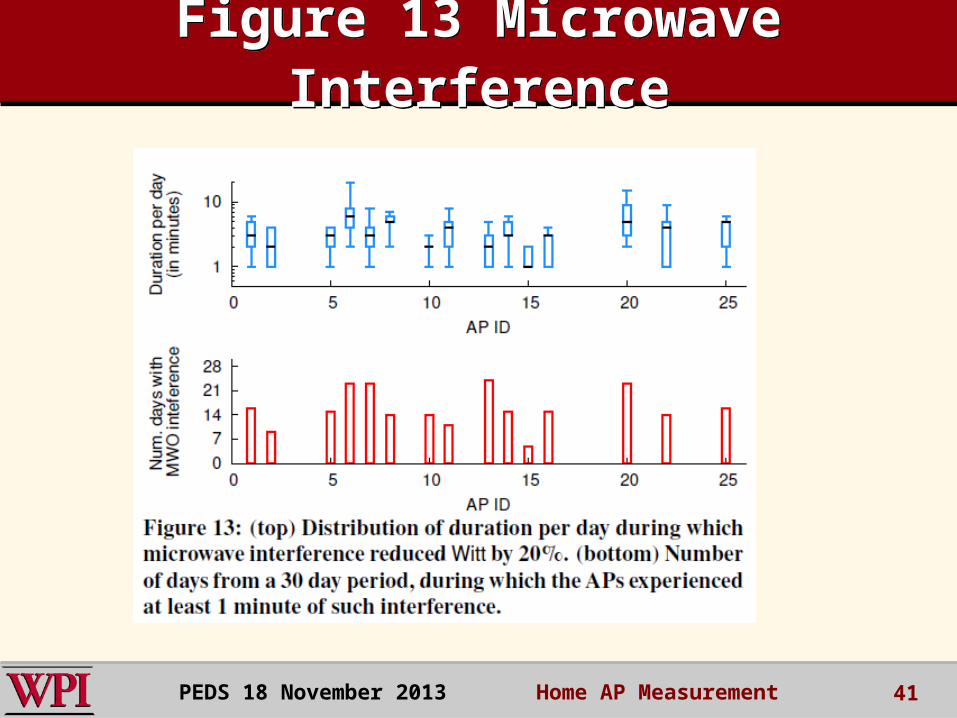
Figure 13 Microwave Interference
Figure 13 Microwave Interference
41PEDS 18 November 2013 Home AP Measurement
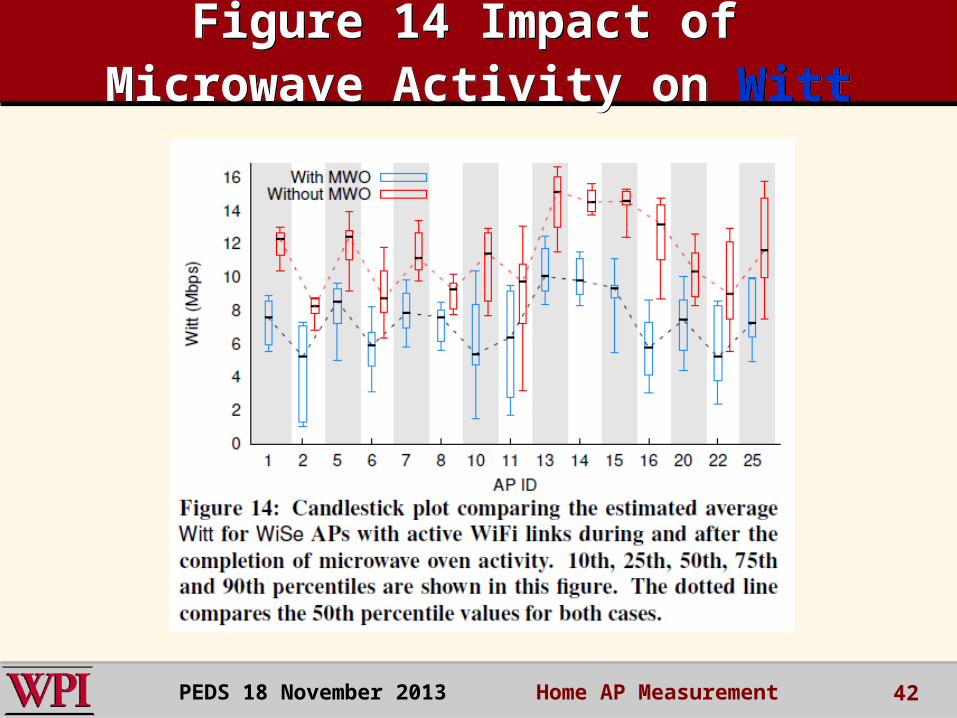
Figure 14 Impact of Microwave Activity on Witt
Figure 14 Impact of Microwave Activity on Witt
42PEDS 18 November 2013 Home AP Measurement
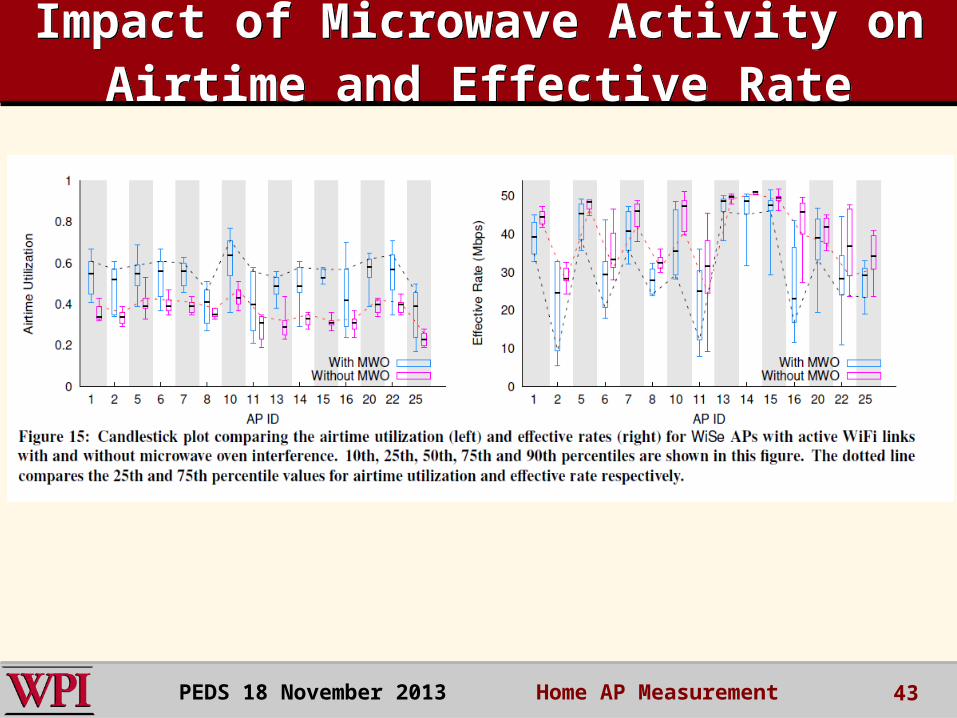
Impact of Microwave Activity on Airtime and Effective Rate
Impact of Microwave Activity on Airtime and Effective Rate
43PEDS 18 November 2013 Home AP Measurement
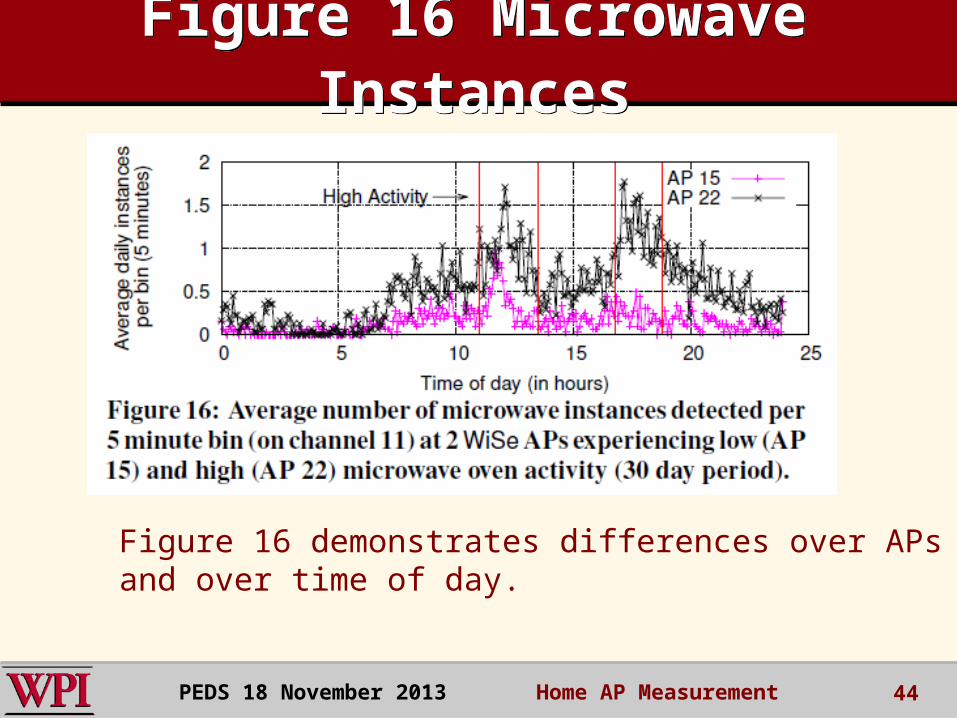
Figure 16 Microwave Instances
Figure 16 Microwave Instances
44
Figure 16 demonstrates differences over APsand over time of day.
PEDS 18 November 2013 Home AP Measurement
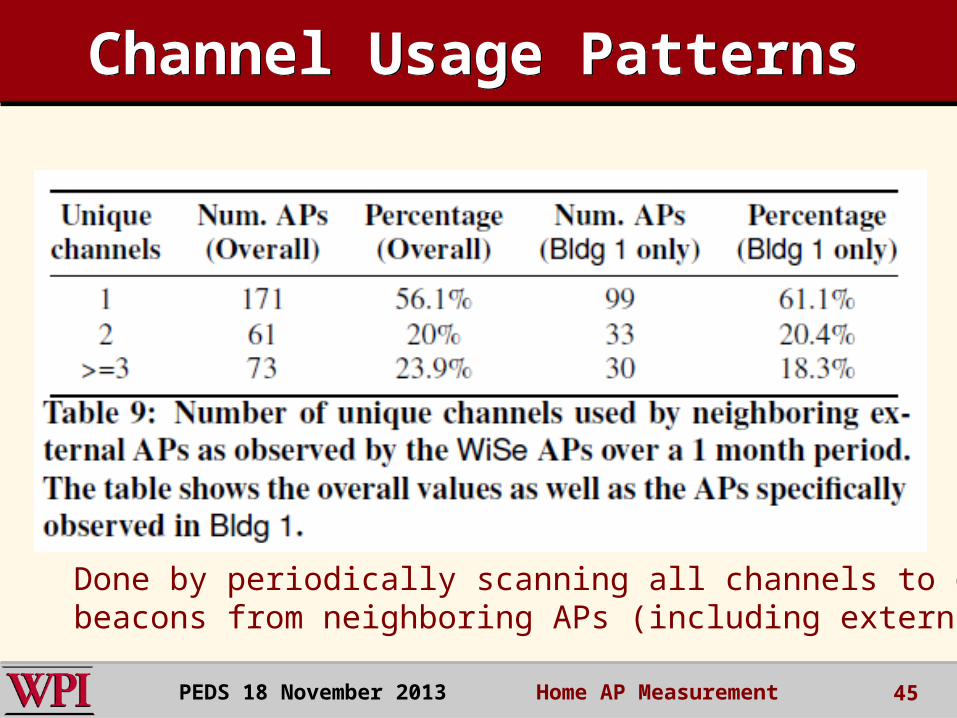
Channel Usage PatternsChannel Usage Patterns
45
Done by periodically scanning all channels to overhearbeacons from neighboring APs (including external APs).
PEDS 18 November 2013 Home AP Measurement
Section 5 SummarySection 5 Summary
Impact of interference (WiFi and non-WiFi) depends on the traffic of both link and interferer. Majority of interference durations are short.
Some interferers had high impact on the APs (e.g., microwave ovens severely degraded performance of some APs).
46PEDS 18 November 2013 Home AP Measurement
Learning the context about interference activity (e.g., time of day) can enable APs to avoid interference.
Majority of APs observed use static channel configurations.
47
Section 5 Summary (cont)Section 5 Summary (cont)
PEDS 18 November 2013 Home AP Measurement
ConclusionsConclusions
WiSe APs are used to measurement wireless properties in homes.
Simple metric, Witt , is developed, tested and used in this investigation.
Paper provides detailed results about causes of poor performance, contention from low data rate senders, packet loss caused by hidden terminals, and interference due to non-WiFi devices.
48PEDS 18 November 2013 Home AP Measurement

CritiqueCritique
Did authorsanswer these questions:
– How often does home WiFi provide good, mediocre or bad performance? Y
– When performance is bad –what are the causes and how long does it persist? Y
– How much interference do we see and what sources provide the interference? Y
– How do users configure their WiFi networks? N
49PEDS 18 November 2013 Home AP Measurement
Critique/QuestionsCritique/QuestionsTop Level comments: Paper is structured well. Scientific methodology (factors and features) was strong.
Used very thorough experimentation with unusual set up.
Several graphs/experiments were not well-explained
Is Witt the only important metric?50PEDS 18 November 2013 Home AP Measurement
Critique/QuestionsCritique/QuestionsMore detailed comments: Provide little analysis of non-apartment performance.
There were a number of small grammar mistakes.
Figures/Tables and descriptive prose not always close together.
While many good, detailed results are given, this does not inform well my intuition on wireless behavior. 51PEDS 18 November 2013 Home AP Measurement
Questions?
Thank you!
52
Observing Home Wireless Experience through WiFi
APs
Observing Home Wireless Experience through WiFi
APs
PEDS 18 November 2013 Home AP Measurement