Embed Size (px)
Citation preview
HAL Id: hal-01627824https://hal.archives-ouvertes.fr/hal-01627824
Submitted on 2 Nov 2017
HAL is a multi-disciplinary open accessarchive for the deposit and dissemination of sci-entific research documents, whether they are pub-lished or not. The documents may come fromteaching and research institutions in France orabroad, or from public or private research centers.
L’archive ouverte pluridisciplinaire HAL, estdestinée au dépôt et à la diffusion de documentsscientifiques de niveau recherche, publiés ou non,émanant des établissements d’enseignement et derecherche français ou étrangers, des laboratoirespublics ou privés.
Observatory of Strategic Developments ImpactingUrban Logistics (2017 version)
Laetitia Dablanc, Zeting Liu, Martin Koning, Jens Klauenberg, Leise Kelli deOliveira, Corinne Blanquart, François Combes, Nicolas Coulombel, Mathieu
Gardrat, Adeline Heitz, et al.
To cite this version:Laetitia Dablanc, Zeting Liu, Martin Koning, Jens Klauenberg, Leise Kelli de Oliveira, et al.. Ob-servatory of Strategic Developments Impacting Urban Logistics (2017 version). [Research Report]IFSTTAR - Institut Français des Sciences et Technologies des Transports, de l’Aménagement et desRéseaux. 2017, 221p. �hal-01627824�

D.2.1 – CITYLAB Observatory of Strategic Developments Impacting Urban Logistics (2017) 1
EUROPEAN COMMISSION INNOVATION and NETWORKS EXECUTIVE AGENCY
HORIZON 2020 PROGRAMME for RESEARCH and INNOVATION
Reducing impacts and costs of freight and service trips in urban areas (Topic: MG-5.2-2014) Grant agreement no: 635898
Deliverable 2.1
CITYLAB Observatory of Strategic Developments Impacting Urban Logistics (2017 version)

CITYLAB – City Logistics in Living Laboratories
D.2.1 – CITYLAB Observatory of Strategic Developments Impacting Urban Logistics (2017)
2
Disclaimer
This document reflects the views of the author(s) and does not necessarily reflect the views or policy of the European Commission. Whilst efforts have been made to ensure the accuracy and completeness of this document, the CITYLAB consortium shall not be liable for any errors or omissions, however caused.
This Deliverable is the second one of three: one more will update the current version, in February 2018.

CITYLAB – City Logistics in Living Laboratories
D.2.1 – CITYLAB Observatory of Strategic Developments Impacting Urban Logistics (2017)
3
Document Control Sheet
Project no.: 635898 Acronym CITYLAB
Project Title City Logistics in Living Laboratories
Work Package WP 2 Title: Knowledge development and data management
Deliverable no.: D2.1 (version 2)
Title: Observatory of Strategic Developments Impacting Urban Logistics
Version 1 Revision 0
Issue Date February 28, 2017
Dissemination Level Public
Future references CITYLAB Deliverable D 2.1 version 2 (2017). Observatory of Strategic Developments Impacting Urban Logistics. www.citylab-project.eu.
Author(s) Laetitia Dablanc & Zeting Liu
Co-author(s)
Martin Koning Jens Klauenberg Leise Kelli de Oliveira Corinne Blanquart François Combes Nicolas Coulombel Mathieu Gardrat Adeline Heitz Saskia Seidel
WP Leader Michael Browne, University of Gothenburg
Internal Reviewers Nina Nesterova, Hans Quak, Fraser Mcleod, Jardar Andersen
Project Manager Walter Mauritsch (INEA)
CITYLAB consortium by Living Lab
Living lab Municipal partner(s) Industrypartner(s) Researchpartner(s)
Brussels Brussels Mobility Procter &Gamble Services Vrije Universiteit Brussel
London Transport for London TNT
Gnewt Cargo
University of Westminster
Oslo Oslo commune Steen &Strøm TOI
Paris Mairie de Paris IFSTTAR
DLR
Randstat Gemeente Rotterdam PostNL TNO
Rome Roma Capitale Poste Italiane
MeWare SRL
Università degli studi Roma Tre
Southampton Southampton City Council Meachers Global Logistics University of Southampton
Networking and outreachpartner
POLIS

CITYLAB – City Logistics in Living Laboratories
D.2.1 – CITYLAB Observatory of Strategic Developments Impacting Urban Logistics (2017)
4
Table of Contents
Executive summary ............................................................................................................... 6
Full Summary of Findings ...................................................................................................... 8
Initial objectives of Deliverable 2.1 and degree of completion ...............................................15 Initial objectives ................................................................................................................15 Degree of completion of objectives ...................................................................................16
Introduction ..........................................................................................................................17 What and whom is this Observatory for? ..........................................................................17 What is in the Observatory? .............................................................................................18 What is in the 2017 version of the Observatory? ..............................................................18
I. Logistics sprawl .................................................................................................................19
I.1. What is logistics sprawl? Spatial patterns related to warehouses ...................................19 I. 1.1 The development of warehouses in large metropolitan areas ..................................19 I. 1.2 Megaregions and logistics facilities ..........................................................................20 I. 1.3 Logistics sprawl: comparative indicators for 25 case studies and main findings .......21 I. 1.4 Impacts of logistics sprawl on freight vehicle-kms ....................................................28 I. 1.5 Would moving logistics facilities “back to the city” bring benefits? ............................31
I. 2. Key conceptual relationships .........................................................................................35 I. 2.1 Increase in the number of warehouses ....................................................................35 I. 2.2 Logistics sprawl .......................................................................................................35
I. 3. Focus 1: A theoretical exploration of the cost structure of urban logistics ......................36 I. 3.1 A simplified representation of freight transport .........................................................36 I. 3.2 The cost structure of the supply chain ......................................................................37 I. 3.3 Optimal location of the warehouse ...........................................................................40 I. 3.4 Analysis of the cost structure of the supply chain .....................................................42 I. 3.5 Conclusion ...............................................................................................................43
I.4 Focus 2: The environmental impact of urban freight ........................................................44 I. 4.1. Research strategy ...................................................................................................46 I.4.2. Data .........................................................................................................................52 I.4.3. Results ....................................................................................................................62 I.4.4. Conclusion ...............................................................................................................68 I.4.5. Bibliography .............................................................................................................69
I.5 Conclusion on logistics sprawl .........................................................................................72
II. E-commerce and urban freight .........................................................................................74
II.1 E-commerce and challenges for urban freight: state of the art ........................................74 II.1.1 Definition of e-commerce, structure and actors ........................................................74 II.1.2. E-commerce and urban traffic .................................................................................77 II.1.3 E-commerce and urban logistics ..............................................................................80 II.1.4 New trends in e-commerce and urban logistics ........................................................87 II.1.5. The special issue of instant deliveries .....................................................................89 II.1.6 E-commerce and new trend in urban warehousing ..................................................92
II.2 E-commerce indicators ...................................................................................................97
II.3 Elements for urban planning and public decision-making ...............................................99

CITYLAB – City Logistics in Living Laboratories
D.2.1 – CITYLAB Observatory of Strategic Developments Impacting Urban Logistics (2017)
5
II.3.1 E-commerce and urbantraffic ...................................................................................99 II.3.2 Substitution between shopping trips and deliveries ................................................ 102 II.3.3 E-commerce, logistics facilities and urban freight................................................... 103 II. 3.4 Delivery options in urban, suburban and rural areas ............................................. 107
II.4 Conclusion on e-commerce .......................................................................................... 109
III. Service trips................................................................................................................... 111 III.1 Introduction .............................................................................................................. 111 III.2 In-depth analysis of the German survey KiD 2010 on service traffic ........................ 118 III.3 Summary: What to learn from the analysis of service trips and service traffic? ........ 129
IV. General conclusion and table of impacts ....................................................................... 131 IV.1 General conclusions applying to logistics sprawl and e-commerce .......................... 131 IV.2 Impact Table: impacts of new trends on urban freight mobility and city life .............. 133 IV.3 General conclusions applying to service trips .......................................................... 137
V. References.................................................................................................................... 139 References for logistics sprawl ....................................................................................... 139 References for e-commerce ........................................................................................... 140 References for service traffic .......................................................................................... 144
VI. Appendices ................................................................................................................... 146 Appendix 1. Table of logistics sprawl indicators .............................................................. 146 Appendix 2. Logistics sprawl case studies ...................................................................... 148 Appendix 3. Detailed calculations for Section I.3 ............................................................ 210 Appendix 4. Table of e-commerce indicators .................................................................. 214

CITYLAB – City Logistics in Living Laboratories
D.2.1 – CITYLAB Observatory of Strategic Developments Impacting Urban Logistics (2017)
6
Executive summary
Urban freight living labs need to operate in full recognition of the challenges that will shape the mobility of goods in urban areas in the future. These challenges are several: macro-economic, micro-economic, demographic, technological, societal, and legal. To help CITYLAB cities implement their urban freight initiatives, a better understanding of these challenges is necessary. This is what this Observatory of strategic developments impacting urban logistics intends to do, by providing data and analysis on some of the most important, or less well known, trends that will shape the urban mobility of goods in the future.
This second version (2017) of the Observatory provides data and analyses on 1) Logistics Sprawl; 2) E-commerce; and 3) Service trips. Our findings about the main impacts of these three trends for cities involved in urban freight living labs are the following:
- The number of logistics facilities (in their diversity: warehouses, fulfilment centres, distribution centres, cross-dock terminals) is increasing in cities, especially cities of some logistics importance as large consumer markets and/or logistics hubs processing the flow of goods generated by the global economy. These facilities are generally located in suburban areas, but a new niche market of urban warehouses is emerging.
- Both e-commerce and logistics sprawl generate a rise in freight vehicles in urban areas, dominated by small vehicles, while medium to large lorries are relatively less important. These vehicles performing delivery operations are visible in neighbourhoods and at times of day when they were not identified before: residential neighbourhoods, residential building blocks, side streets, in the early evening and on week-ends. Emerging new types of vehicles (clean delivery vehicles, two and three wheelers) are now visible in urban centres.
- Innovations in the urban supply chains include diverse forms of pick-up points and click-and-collect solutions, while the recent but extremely rapid rise in technologies and algorithms supporting instant deliveries (on-demand deliveries within less than two hours) brings with it a flourish of new companies connecting customers, suppliers and independent couriers, often using bicycles.
- The overall impact of these new trends on energy and carbon emission related to urban freight is difficult to assess. Urban freight in general, for the Paris region, brings the following environmental impact: the share of traffic-related CO2, NOx and PM10 due to urban freight is 2.5 times larger than the share of vans and trucks in the regional traffic. The contribution of urban freight to air pollution is larger in the city of Paris. Social costs of air pollution caused by road traffic in general amount to 0.9% of the regional GDP in 2012. Some of the new trends bring more CO2 emissions, such as the relocation of logistics facilities far away in the suburbs, as de-consolidated shipments are delivered to urban consumers and businesses in smaller and more numerous vans. Some trends bring less CO2 emissions, with a rise in cleaner vehicles and innovative solutions such as drop-off/pickup points or bike-supported instant deliveries. Substitution patterns between personal mobility and professional freight mobility can be a good, or a bad, thing for CO2 emissions, depending on the initial circumstances and the way personal shopping was done before online orders.
- What is certain is that these changes bring diversity in the urban traffic flow. Instant couriers are using all sorts of transport modes, including foot, bicycles, electrically assisted cargocycles, motorbikes, and various types of vans and lorries. This can negatively impact traffic management, road safety and conflicts in road uses, congestion, air pollution. Also, the trends we have looked at bring new types of urban jobs, with many unresolved legal issues and poor working conditions in many instances. New types of logistics buildings bring architectural diversity and

CITYLAB – City Logistics in Living Laboratories
D.2.1 – CITYLAB Observatory of Strategic Developments Impacting Urban Logistics (2017)
7
innovation in cities, but also complaints about noise, aesthetics, as well as congestion and pollution at entrance and exit points.
- These environmental and social impacts have been so far poorly documented and researched. Consumers are the main drivers of the changes we have observed, but they are also the residents or visitors of urban areas, and for that they carry an important share of the burdens, as well as the benefits, of the new landscape of urban logistics.
- Service trips are trips in commercial traffic induced by service oriented activities. According to the German study KiD 2010 service traffic accounts for 11.8% of traffic in terms of trips and for 19.9% in terms of kilometres travelled. There are differences in terms of vehicle types and economic sectors but few variations in terms of spatial types.
- An observatory on service traffic must take into account light duty vehicles and passenger cars in general. Establishment based analysis as well as vehicle based analysis can give detailed insight in traffic generation and traffic behaviour in service traffic.

CITYLAB – City Logistics in Living Laboratories
D.2.1 – CITYLAB Observatory of Strategic Developments Impacting Urban Logistics (2017)
8
Full Summary of Findings
This second version of CITYLAB’s Observatory of strategic developments impacting urban logistics provides a set of indicators, shown in Appendices I.1 and II.1, as well as, throughout the document, analyses of these indicators and conclusions on how observed trends impact the mobility of goods in cities today and in the future.
Urban freight living labs need to operate in full recognition of the challenges that will shape the mobility of goods in urban areas in the future. These challenges are several: macro-economic, micro-economic, demographic, technological, societal, and legal.
To help CITYLAB cities implement their urban freight initiatives, a better understanding of these challenges is necessary. This is what this Observatory intends to do, by providing data and analysis on some of the most important, or less well known, trends that will shape the urban mobility of goods in the future.
We have chosen to focus on the following topics:
- Land use issues and logistics sprawl;
- New ways of servicing supply chains (including e-commerce and e-grocery, instant deliveries, recycling and the circular economy);
- Growing importance of service trips.
As mentioned above, these trends, which are defined below, do not represent the whole range of challenges that will shape urban freight. They represent some of these challenges. The reasons we do not encompass a general overview of the drivers of future urban freight mobility are several, with a first reason being the necessary limitation in time and workforce of our CITYLAB 2.1 team. Another more legitimate reason is that these topics have not been researched much insofar as they impact the urban mobility of goods (and the mobility of people carrying goods).
This second deliverable covers land use issues and logistics sprawl, e-commerce and e-grocery supply chains, including instant deliveries, and service trips. The next and final version of the deliverable, due in one year, will update all the data and add circular economy to the analysis, as well as a full analysis of the net environmental impact of logistics sprawl.
For logistics sprawl and e-commerce, we have collected data, compared and analysed these data, and provided a list of ‘conceptual relationships’ that contribute to the identification of simple relationships between trends and the urban mobility of goods. We have introduced an ‘Impact Table’ identifying impacts on various stakeholders and activities.
Here are the specific additions made to this second version compared with the first version (D2.1 V1, February 2016).
- General update of the document’s contents and findings.
- Detailed update of logistics sprawl cases: nine case studies have been added, with a total number of cases now at 25.
- Detailed update of e-commerce data and analysis, including a new chapter on “instant deliveries” in large cities.
- A “Focus 2” on the environmental impact of urban freight has been added. This thorough study (mixing empirical data and modelling of data from Paris metropolitan area in France) is the first step of an evaluation of emissions and emissions’ impacts of logistics sprawl. This research will be finalized in version 3 of the Observatory (D2.1 V3 February 2018).

CITYLAB – City Logistics in Living Laboratories
D.2.1 – CITYLAB Observatory of Strategic Developments Impacting Urban Logistics (2017)
9
- A new section on service trips.
Limitations of this work are the following. Data on logistics sprawl is emerging, through a growing number of case studies in several world regions. These case studies are still limited in number (less than thirty), and not always comparable in terms of methodology and scope. More case studies are on-going and we are hopeful we can enlarge our sources of information for the final of the deliverable. In the summer of 2016, a special session about logistics sprawl took place during the World Conference on Transport research in Shanghai, and provided feedbacks for our analysis (seven case studies), and various works throughout the world are still adding case studies. For example, we have included a case from Shenzhen, China, coming from a recent PhD dissertation (defended in February 2017).
Data on e-commerce is now quite widespread, at least for Europe and North America. However, missing are data sources that specifically focus on urban areas. The behaviour of urban residents regarding e-commerce and e-delivery, as compared with the rest of the population, is not well known, and even less examined in terms of impacts on mobility and urban supply chains. Other limitations regard conceptual relationships, for both topics. Some of our propositions are based on assumptions and hypotheses that require further verification, largely because of lack of comparable data. For logistics sprawl, we carried out a more theoretical exercise using modelling techniques, in order to verify theoretically some of our assumptions. This exercise confirmed that the related relationships we suggested were robust, which makes it interesting to develop further this theoretical work in the future.
Data on service trips is heterogeneous from European countries. Definitions vary. A clear understanding on the conceptual relationships between service trips and urban freight is yet to be established.
Our main findings are the following.
1) "Logistics sprawl" (LS) is the spatial deconcentration of logistics facilities and distribution centres in metropolitan areas. It has been a noticeable spatial pattern for the last decades in large cities around the world, as identified by about twenty case studies covering mostly European and North American cities, with Tokyo, Belo Horizonte and Bogota in addition. We have organized the data collected in these case studies under 17 indicators.
All indicators have been examined and compared. The main results of this data collection, comparison and analysis are the following.
- The number of warehouses per million of urban residents ranges from 6 (Tokyo) to 239 (greater Gothenburg). We excluded the focused studies here, as they do not include all the warehouses in an urban area. This indicator varies with the definition of a warehouse and the accurateness of the database: comparisons are actually difficult as the type of warehouses can vary from one case study to another, and data sources have issues and are not perfect.
- The number of warehouses per million of residents has increased overtime in all case studies except Amsterdam, Montreal, Randstadt, Tokyo, and Vancouver. Vancouver decreased by one warehouse in ten years.
- Logistics sprawl has happened in 17 case studies. It did not happen in Amsterdam, Belo Horizonte, Cali, Bogota, Halifax, Montreal, Seattle and Toronto GTA.
- The average increase of the LS indicator (increase in average distance of warehouses to their barycentre (= centre of gravity)) is 0.31 km/year.
The main conceptual relationships between logistics sprawl and the urban mobility of goods are the following.
a) Most cities can expect a continued increase in the number of warehouses located in the metropolitan area. Furthermore:

CITYLAB – City Logistics in Living Laboratories
D.2.1 – CITYLAB Observatory of Strategic Developments Impacting Urban Logistics (2017)
10
- The increase in the number of logistics facilities overtime is positively related to the importance of the role of global logistics hub played by an urban area.
- The increase in the number of logistics facilities overtime is positively related to the increase in the digitalization of retail (increase in B2C demand) in an urban area.
- As B2C demand increases in large metropolitan areas, the demand for small logistics buildings within the urban area increases.
- The increase in the number of warehouses over time is larger in megaregions. - The increase in the number of warehouses over time is larger in big cities within
megaregions.
b) Logistics sprawl can be expected to continue in many cities, in the following manners:
- Logistics sprawl is positively related to the differential in land/rent values for logistics land uses between suburban and central areas in an urban region
- Logistics sprawl is positively related to the availability of large land parcels in suburban settings
- Logistics sprawl is negatively related to the degree of regional logistics land use control
- The degree of logistics sprawl varies with the type of logistics terminal (i.e. stronger for distribution and fulfilment centres, weaker for parcel transport terminals)
- Logistics sprawl generates an increase in the number of freight vehicle-kilometres within the urban region if its rate is higher, on the same time period, than economic and residential sprawl.
- Additional vehicle-kilometres induced by logistics sprawl are likely to impact less densely populated areas, thus generating less diffused transport externalities (local pollutants, noise, accidents).
In order to analyse the potential causes of logistics sprawl, we have built a simple analytical model of the cost structure of urban logistics. Even on a simple case, the model illustrates the nonlinear relationship between the land use market, the parameters of urban logistics (vehicle speed, workday duration, costs and the demand) and the location of a warehouse. In particular, the research shows that an increase in the demand for pickup and delivery operations results in warehouses locating further away from cities, as a result of transport operations weighing relatively less in their cost function. On the other hand, the model hints to how an emerging market for very reactive logistics needs to be accompanied by logistic facilities coming back in city centres, despite the price. Finally, the model shows that the location of logistic facilities is determined by the rent gradient, not its absolute value: if rents are uniformly high, warehouses will have no need to move far from the city centre. This brings some important implications: there is economic ground to the idea of giving some space to logistic facilities near city centres in order to improve the efficiency of urban logistics. However, this should be done in a careful way, lest a mechanical increase in rents in these areas cancels the initial objective of the action.
Environmental impact of urban freight. In a first step towards an assessment of the environmental impact of logistics sprawl, we calculated the environmental impact of urban freight using the Paris case as an example. The results are the following: the share of traffic-related CO2, NOx and PM10 due to urban freight is 2.5 times larger than the share of vans and trucks in the regional traffic. By contrast, private cars are the main source of CO and NMVOC. Moreover, we show that the contribution of urban freight to air pollution is larger in the city of Paris. Lastly, social costs of air pollution caused by road traffic in general amount to 0.9% of the regional GDP in 2012. If we consider only vans and trucks, collective losses are equal to 0.4% of the economic wealth created in the Paris region.
2) E-commerce is defined by the OECD as “the sale or purchase of goods or services, conducted over computer networks by methods specifically designed for the purpose of receiving or placing of orders. (…) Payment and the ultimate delivery of the goods or services do not have to be conducted online. An e-commerce transaction can be between
CITYLAB – City Logistics in Living Laboratories
D.2.1 – CITYLAB Observatory of Strategic Developments Impacting Urban Logistics (2017)
11
enterprises, households, individuals, governments, and other public or private organizations”. We show that in a large range of countries, global business to consumer e-commerce sales have increased sharply over the last decade, driven by a growing online population and changes in consumer behaviours. China (the world’s largest B2C country), the US and the UK account for 61% of total B2C e-commerce sales in the world. However, online retail of goods accounts for only about 6% of world retail.
What we have been looking at for the Observatory is e-commerce including only the sales of goods, not services, although the data has not always been easy to differentiate. In the US and Europe, it represents about 55% of overall B2C e-commerce.
In the document, we have analysed the structure and main players of e-commerce, and its relationships to urban logistics and urban traffic. Some innovations in the way e-commerce deliveries are being carried out have been identified. Actually, e-commerce appears to be one of the main drivers for city logistics innovations in terms of new operators, green operations, and the use of new types of vehicles. Impacts also include the type and location of new urban distribution centres, as e-retailers are getting (spatially) closer to the customers, in order to serve them more rapidly.
One special trend is the quick development of instant deliveries, based on the use of digital platforms and self-contracted couriers. In Paris, there are 0.2 instant deliveries per home per week (Dablanc et al., 2017). Instant deliveries could represent in 2016 about 12% of B2C related deliveries and pick-ups, and 2.5% of total deliveries and pick-ups in the Paris region. The main conclusion from this preliminary evaluation is that freight trips generated by instant deliveries are rather significant already. Although the phenomenon is still mainly concentrated on food and grocery deliveries, it is emerging in general parcels. Instant deliveries raise concerns about increasing bike traffic and road safety, the sustainability of the business model, and labour conditions of couriers.
We came up with the proposition of several conceptual relationships between e-commerce development and the urban mobility of goods. These are the following:
a) Relationships between e-commerce and urban traffic
The growth of e-commerce revenue results in higher parcels volume.
The growth rates of e-commerce sales and of urban freight traffic are different.
‘Instant deliveries’ increase heterogeneity of urban freight traffic.
Growth in freight transportation due to e-commerce also depends on return rates and needs for reverse logistics.
b) Substitution between shopping trips and deliveries
Urban traffic due to e-commerce depends on the substitution between personal travels (motorized or non-motorized shopping trips) and deliveries.
The shift from personal travel to freight transport depends on the type of goods.
Growth in freight transport due to e-commerce depends on the level and nature of the substitution with shopping trips.
Instant deliveries may reduce shopping trips for e-grocery.
c) Relationships between e-commerce, logistics facilities and urban freight
Interestingly, e-commerce use is quite similar in suburban (even rural) areas and urban areas.
E-commerce leads to the rise in the number of logistics facilities

CITYLAB – City Logistics in Living Laboratories
D.2.1 – CITYLAB Observatory of Strategic Developments Impacting Urban Logistics (2017)
12
The location of these logistics facilities depends on their size and the maturity of market.
The location of these logistics facilities depends on their size.
The rise in same-day and instant deliveries leads to the increase of sortation centres close to customers.
Land use patterns influence urban freight traffic for home deliveries.
The environmental impacts of delivery services are different according to land use patterns.
The use of environmental friendly vehicles is influenced by urban charging facilities.
d) Delivery options in urban, suburban and rural areas
Potential choice of delivery options is increasingly the same in urban, suburban and rural areas.
Trends for the development of delivery options depend on the land use.
Preference for delivery options is different according to the land use.
Instant delivery service is more popular in large cities but emerging in medium size cities
Click-and-collect solutions grow faster than home delivery.
The type of delivery solutions depends on consumers’ habits.
More home delivery means higher failed delivery.
One general conclusion we can confirm in this second version of CITYLAB’s Observatory of strategic developments impacting urban logistics is that logistics facilities (in their diversity: warehouses, fulfilment centres, distribution centres, cross-dock terminals) are increasing in cities, especially cities of some logistics importance as large consumer markets and/or logistics hubs processing the flow of goods generated by the global economy.
These facilities are generally located in suburban areas, but a new niche market of urban warehouses is emerging.
Other changes include the rise in freight vehicles in urban areas, dominated by small vehicles, while medium to large lorries are relatively less important. These vehicles performing delivery operations are visible in neighbourhoods and at times of day when they were not identified before: residential neighbourhoods, residential building blocks, side streets, in the early evening and on week-ends. Emerging new types of vehicles (clean delivery vehicles, two and three wheelers) are now visible in urban centres.
Innovations in the urban supply chains also include diverse forms of pick-up points and click-and-collect solutions, while the recent but extremely rapid rise in technologies and algorithms supporting instant deliveries brings with it a flourish of new companies connecting customers, suppliers and independent messengers.
3) Service trips are trips in commercial traffic induced by service oriented activities. An economic service is a transaction in which no physical goods are exchanged between supplier and receiver. It is a type of economic activity that is intangible.
Data on service trips is heterogeneous from European countries. Definitions vary.
The analysis of service traffic concerning used vehicles, commercial sectors and spatial types shows, that mainly light duty vehicles and passenger cars are used for service traffic. Service traffic is done with high shares in the construction sector, human health

CITYLAB – City Logistics in Living Laboratories
D.2.1 – CITYLAB Observatory of Strategic Developments Impacting Urban Logistics (2017)
13
and social work activities, professional, scientific and technical activities, the wholesale and retail trade sector, and the manufacturing sector.
According to the Germany study KiD 2010 service traffic accounts for 11.8% of traffic in Germany in terms of trips and for 19.9% in terms of kilometres travelled. Vehicles used for service traffic conduct on average 3.2 service trips per day with an average trip length of 22.8 kilometres. Accordingly the daily tour length in service traffic is on average 73.8 kilometres. There are differences in terms of vehicle types and economic sectors. There are only few variations in terms of spatial types.
In service-related traffic there are on the one hand vehicles which are characterized by only a few stops and little road performance per day. On the other hand many cars visit numerous customers and participate a lot in traffic. Four corporate factor groups (internal structures, internal processes, external structures, and external processes) play a role in travel behaviour in service traffic. Company-related factors, especially corporate structure, are decisive for corporate vehicles’ travel patterns. Further efforts are needed to identify proper ways for the possibility to influence service traffic generation. In general the strategy of avoid-shift-improve could be applied to service traffic. The premise will be not to avoid traffic rather than to improve traffic.
An observatory on service traffic must take into account light duty vehicles and passenger cars in general. Studies and surveys on service traffic that should contribute to the observatory must concentrate on the identified economic sectors. A special focus on spatial types in the observatory is not necessarily needed.
For the development of an observatory of service traffic there is need for definition of the observed object. Establishment based analysis as well as vehicle based analysis can give detailed insight in traffic generation and traffic behaviour in service traffic. To combine both kinds of studies could link knowledge ideally. A starting point for a better observation of service traffic may be to conduct surveys as KiD 2010 in Germany in other countries on national basis as well. Furthermore this must be enhanced with local or regional establishment based surveys where whole companies and their fleets are included.
The overall impact of these new trends on energy and carbon emission related to urban freight is difficult to assess. We made a try at the environmental impact of urban freight in general, using Paris as a case study, as shown below: the share of traffic-related CO2, NOx and PM10 due to urban freight is 2.5 times larger than the share of vans and trucks in the regional traffic. The contribution of urban freight to air pollution is larger in the city of Paris. And social costs of air pollution caused by road traffic in general amount to 0.9% of the regional GDP in 2012. As for the new trends, some of them bring more CO2 emissions, such as the relocation of logistics facilities far away in the suburbs, as de-consolidated shipments are delivered to urban consumers and businesses in smaller and more numerous vans. Some trends bring less CO2 emissions, with a rise in cleaner vehicles and innovative solutions such as drop-off/pick-up points. Substitution patterns between personal mobility and professional freight mobility can be a good, or a bad, thing for CO2emissions, depending on the initial circumstances and the way personal shopping was done before online orders.
What is certain is that these changes bring diversity in the urban traffic flow. Instant couriers are using all sorts of transport modes, including foot, bicycles, electrically assisted cargocycles, motorbikes, and various types of vans and lorries. This can negatively impact traffic management, road safety and conflicts of road uses, congestion, air pollution. Also, the trends we have looked at bring new types of urban jobs, with many unresolved legal issues and poor working conditions in many instances. New types of logistics buildings bring architectural diversity and innovation in cities, but also complaints about noise, aesthetics, as well as congestion and pollution at entrance and exit points.
CITYLAB – City Logistics in Living Laboratories
D.2.1 – CITYLAB Observatory of Strategic Developments Impacting Urban Logistics (2017)
14
These environmental and social impacts have been so far poorly documented and researched. Consumers are the main drivers of the changes we have observed, but they are also the residents or visitors of urban areas, and for that they carry an important share of the burdens, as well as the benefits, of the new landscape of urban logistics.

CITYLAB – City Logistics in Living Laboratories
D.2.1 – CITYLAB Observatory of Strategic Developments Impacting Urban Logistics (2017)
15
Initial objectives of Deliverable 2.1 and degree of completion
Initial objectives As indicated in our proposal, this deliverable of Task 2.1 follows the initial objective as formulated below:
"Establish and operate an Observatory of Strategic Developments Impacting Urban Logistics. This task establishes and operates an observatory of strategic developments and trends that impact urban logistics. The Commission call for 5.2 noted several of these important trends. This is essentially a top-down task building on knowledge held within the CITYLAB project as a result of the partners’ extensive engagement in understanding key trends in urban logistics. The focus in this task is to use the CITYLAB project partners and the wider network of supporting partners to capture the key trends that are influencing urban logistics now and for the period to 2030 (the target date for the EU goal of virtually CO2 free city logistics). The task will start with drawing a map of the best updated data available on urban freight. It will then develop a framework within which to consider major trends that are impacting on urban freight including:
- Land use issues and logistics sprawl
- New ways of servicing supply chains (including e-commerce and e-grocery, recycling and the circular economy) Growing importance of service trips
These trends are relevant for developing and implementing actions and measures in the CITYLAB living labs that help mitigate the freight impacts associated with them.
In terms of land use and logistics sprawl the focus is on the relationship between land use and logistics demand, and effects of sprawl, with the consequences on possible freight mitigation strategies. Logistics sprawl is the spatial deconcentration of logistics facilities and distribution centres in metropolitan areas (Dablanc and Ross, 2012). Warehouse location has a direct impact on the distance over which goods are moved in urban areas. Impacts of different land uses and logistics spatial patterns as well as impacts of urban planning will be assessed. We will study the differentiated locational patterns of logistics centres across European metropolitan areas, identifying the microeconomic causes underlying logistics sprawl, comparing various urban forms with respect to the efficiency (both economic and environmental) of urban logistics. The techniques developed by partners will be used to build a comprehensive assessment of how logistics land use patterns will influence urban freight transport across a range of cities and how the consequences could be dealt with.
In terms of new ways of servicing supply chains one of the focuses will be on obtaining a better understanding of impacts of trends in e-commerce, e-grocery, same day delivery for e-commerce, smaller shipment sizes, smaller and environmentally friendly delivery vehicles, and the use of pick-up points and locker banks. We will compare developments across several countries and cities, including the impact of major actors such as Amazon with new e-grocery services recently introduced in Europe. The other focus is on recycling and the circular economy and the impact that changes in legislation and operations in this field are having on logistics efficiency in urban areas. For example, the rise of recycling has increased the demand for transport to avoid products entering the waste stream. On the other hand, so called circular economy activities based on short supply chains and recycling and re-use have reduced vehicle-kilometres travelled for waste transport. These trends are complicated because they have happened in rather different ways in different countries – we will explore these impacts and variations in them in different locations.
Service trips are poorly understood as they are difficult to capture through normal transport surveys and statistics. This task will provide more detailed understanding of the rationale for

CITYLAB – City Logistics in Living Laboratories
D.2.1 – CITYLAB Observatory of Strategic Developments Impacting Urban Logistics (2017)
16
service trips and the possibilities to reduce, combine, or manage these trips in other ways will be addressed. However, cities rely on services for their economic well-being and these activities form a significant part of the traffic flow in the urban area. We will make use of existing surveys to better understand the pattern and rationale for a range of service trips (such as the KID Survey in Germany). In addition, we will draw on examples and case studies that have targeted service traffic such as the planning for the London Olympic Games.
The objective of this investigation of these trends and their urban freight impacts is to gather information and data (essentially through desk research). This will thereby provide a better understanding of how business and consumer trends will exert pressure on urban freight transport services."
Degree of completion of objectives
This second Deliverable (in a total of three for the duration of CITYLAB) has achieved the following:
- 95% completion of data collection of logistics sprawl case studies and comparative analysis. Some case studies which were not fully available/completed when finalizing the first report have been completed. This is the case for Brussels, Belo Horizonte (whole metropolitan area), Cali, Bogota. London, however, has not been completed. Additional case studies have been made and could be included as well: Chicago, Calgary, Halifax, Montreal, Winnipeg, Shenzhen. All this is presented in Sections I-1 and I-2, as well as Appendices I.1 and I.2 of the present document.
- 100% completion of the study of microeconomic causes underlying logistics sprawl. This is presented in Section I.3 of the present document.
- 33% completion of the study on the environmental impact of logistics sprawl. The base study is completed (Focus 2 in Section I.4 of this second report). This has secured the methodology for the remaining research. Two pieces of research are still needed: we need to single out warehouses (as opposed to all business establishments) in the 2012 environmental assessment; and we need to repeat that assessment for 2000. The two years will then be compared.
- 80% completion of the study of e-commerce trends and comparison across countries and cities. A major effort has been made to identify the best sources of information and collect data (Section II.1, Section II.2, Appendices). A detailed analysis has been made on the potential impacts of these trends on urban freight mobility (Section II.3). Specifically urban data has been difficult to collect, as urban e-commerce surveys are scarce. Comprehensive surveys in Paris and Lyon, in France, have been made but are only very partially available today (February 2017). Hopefully they will be available for the next version of the Deliverable in February 2018. The research on instant deliveries has been completed.
- 80% completion of service trips analysis. This analysis is presented in Section III of the document. In the final version of the Deliverable, we will update and further the data collection, and better integrate findings with the impact table (Section IV-2) and with the other trends impacting urban freight. We will provide a better understanding on the conceptual relationships between service trips and urban freight is yet to be established.
- 0% completion of the circular economy analysis. This will be done for the final version of the Deliverable in February 2018.
CITYLAB – City Logistics in Living Laboratories
D.2.1 – CITYLAB Observatory of Strategic Developments Impacting Urban Logistics (2017)
17
Introduction
What and whom is this Observatory for?
Urban freight living labs need to operate in full recognition of the challenges that will shape the mobility of goods in urban areas in the future. These challenges are several: macro-economic, micro-economic, demographic, technological, societal, and legal. To help CITYLAB cities implement their urban freight initiatives, a better understanding of these challenges is necessary.
This is what this Observatory of strategic developments impacting urban logistics intends to do, by providing data and analysis on some of the most important, or less well known, trends that will shape the urban mobility of goods in the future.
For each of the trends we chose to focus on (land use and logistics sprawl; e-commerce; circular economy; service trips - see below for a more detailed description of each trend), the Observatory will provide a collection of actual data, as up to date as can be found in the literature and statistics databases; it will provide evidence – or hypotheses - of causal relationships between trends and the urban mobility of goods; and it will provide analyses of the impacts of these trends on the different stakeholders involved in urban freight (transport companies, shippers and receivers, consumers, public authorities, agencies, business groups) and on the urban environment.
Three Deliverables had been planned initially: one in 2016 (done), one in 2017 (this one) and one in 2018. The second Deliverable (this version) looks at three of the four trends: land use and logistics sprawl, e-commerce, service trips. The remaining trend (circular economy) will be included in the 2018 version, although work has started on data collection.
This Observatory works in the following manner for the duration of the CITYLAB project:
- it is publicly available on-line, in the form of the Deliverable (only the latest version will be available, i.e. in the following weeks, the 2017 version when approved), including Appendices and Impact Table.
- The main findings are presented during CITYLAB events such as local or plenary workshops, as well as external events.
- A final updated version will be provided when the last Deliverable (2018) is finalized. It will include the analysis of all trends, including the circular economy and service trips.
A key additional objective for the Observatory is to make it permanent, so that it continues to be updated and available after the end of the CITYLAB project. The best available options to reach that goal will be examined and a strategy will be proposed in the final version of the Deliverable (2018). IFSTTAR is willing to examine the possibility of being the leading academic institution to keep and update the Observatory. It will do so within the new National Observatory on Logistics (ONL) if this Observatory is established at IFSTTAR1. It will do so with partners such as ECTRI and potentially the Joint Research Centre. IFSTTAR will also contact the International Transport Forum (ITF/OECD) to propose that the Observatory of New Trends Impacting Urban Freight contribute to the ITF annual Transport Outlook.
Dissemination of the Observatory’s results, in a summarized and user-friendly way, is actively promoted targeting private as well as public stakeholders. A brochure has been identified and will be made by IFSTTAR in the first semester of 2017, in cooperation with CITYLAB dissemination tasks’ leaders.
1 The decision is pending at the government level in France. It should be made within year 2017.

CITYLAB – City Logistics in Living Laboratories
D.2.1 – CITYLAB Observatory of Strategic Developments Impacting Urban Logistics (2017)
18
What is in the Observatory?
As a whole, the Observatory is focusing on the following topics:
- Land use issues and logistics sprawl;
- New ways of servicing supply chains (including e-commerce and e-grocery, recycling and the circular economy);
- Growing importance of service trips.
These trends do not represent the whole range of challenges that shape urban freight. They represent some of these challenges. The reasons we do not encompass a general overview of the drivers of future urban freight mobility are several, with a first reason being the necessary limitation in time and workforce of the CITYLAB 2.1 team. Another more legitimate reason is that the topics we have selected have not been researched much insofar as they impact the urban mobility of goods (and the mobility of people carrying goods).
What is in the 2017 version of the Observatory?
This second Deliverable covers land use issues and logistics sprawl, e-commerce, e-grocery and instant delivery services and supply chains; and service trips. The next version of the deliverable, due in one year, will cover the circular economy, the data of which have started to be collected, as well as a finalized research on the environmental impact of logistics sprawl.
On logistics sprawl and e-commerce, we have provided a list of ‘conceptual relationships’ that contribute to the identification of simple relationships between trends (i.e. logistics sprawl and e-commerce) and the urban mobility of goods. We have introduced an ‘Impact Table’ identifying impacts on various stakeholders and activities. This Impact Table will be updated with service trips and the circular economy in the final version of the Deliverable.
Three main sections follow: one about land use and logistics sprawl issues (Section I); one about e-commerce and e-grocery issues (Section II); and one about service trips (Section III). Conclusions of findings can be found after each section. A general conclusion provides common findings as well as an Impact Table. Appendices provide the collected data on each trend.
CITYLAB – City Logistics in Living Laboratories
D.2.1 – CITYLAB Observatory of Strategic Developments Impacting Urban Logistics (2017)
19
I. Logistics sprawl
Laetitia Dablanc Leise Kelli de Oliveira Martin Koning François Combes Nicolas Coulombel Mathieu Gardrat Adeline Heitz Jens Klauenberg
I.1. What is logistics sprawl? Spatial patterns related to warehouses
"Logistics sprawl" is the spatial deconcentration of logistics facilities and distribution centres in metropolitan areas (Cidell, 2010; Dablanc and Ross, 2012). It has been a noticeable spatial pattern for the last decades in large cities around the world, especially cities with a strong logistics activity. Logistics sprawl can have impacts on freight mobility within the metropolitan area.
Logistics sprawl is one of the spatial patterns that can be related to warehouses. Through the literature and case studies, the following three spatial patterns related to the location of logistics facilities can be identified:
- a pattern of polarization of logistics facilities in megaregions - within a megaregion, a pattern of polarization of logistics facilities around the
main urban conurbations - Within the main conurbation, a pattern of logistics sprawl.
In the following sub-sections, we will detail these patterns. We will see that logistics facilities tend to increase in numbers, especially in megaregions and large metropolitan areas. At the metropolitan level, we will examine patterns of logistics sprawl. We will then examine the impacts of logistics sprawl on cities. A research on the environmental impact of logistics sprawl has been started (Koning, Coulombel, Dablanc, Gardrat), and the first results will be presented here (section I.4). This specific research will be completed for the third version (February 2018) of the Observatory report.
I. 1.1 The development of warehouses in large metropolitan areas
There are more warehouses today than a few decades ago, and these freight facilities tend to concentrate in large metropolitan areas.
Starting in the 1980s, the world entered a “new distribution economy” (Hesse and Rodrigue, 2004), an economy largely dependent upon efficient and increasingly globalized networks of goods distribution and just-in-time operations. This has led to a reduction in large inventories of intermediate and final products, but also to a concomitant rise in logistics facilities (Movahedi et al., 2009): global supply chains require more freight centres, and the way these facilities are spatially organized has become a key feature of an efficient goods distribution network. The efficiency of goods’ distribution depends increasingly upon the optimal location

CITYLAB – City Logistics in Living Laboratories
D.2.1 – CITYLAB Observatory of Strategic Developments Impacting Urban Logistics (2017)
20
and sizing of freight terminals. Freight transportation costs have decreased and for many industries they have become “trivial” (Glaeser and Kohlhase, 2004). Transport is now “out of consideration in economic geography” (Hall et al., 2006). Low freight costs create what Rodrigue (2004) calls an “increased locational flexibility” for freight and logistics facilities. The opportunity for good regional and national networking between facilities within a supply chain is a key factor. “Ultimately, the changed geography of warehousing is not just about the restructuring of space within metropolitan areas, it is about the spaces connecting metropolitan, regional and national economies. The proliferation and expansion of warehouses and their predilection for easily accessed suburban sites is being driven by the thickening of long-distance linkages among distant economies” (Bowen, 2008, p. 386).
Another interesting element is that this increase in the number of freight and logistics terminals in large metropolitan areas seems to go together with an increase in the average size of warehouses, both in surface footprint (built m2) and in in-door volume (m3). See Figure I.1 for an illustration.
Figure I.1 Share of warehouses> 50,000m2 in total logistics space take-up in France, the UK and the Netherlands Source: CBRE (http://news.cbre.eu/xxl-warehouses-become-darling-of-european-industrial-and-logistics-market)
I. 1.2 Megaregions and logistics facilities
Despite higher land prices, logistics facilities tend to concentrate in “megaregions” rather than in more isolated regions. Megaregions can be defined as large “networks of metropolitan centres and their surrounding areas… spatially and functionally linked through environmental, economic and infrastructure interactions” (Ross, 2009).
The concept of megaregions is particularly fitted to the analysis of freight transport systems, because freight’s market areas, driven by global supply chain organizations, are largely disconnected from one single city. Terminals such as regional distribution centres and cross dock terminals are spatially organized on a regional and multicity basis.
Below is a map of European megaregions (Figure I.2).

CITYLAB – City Logistics in Living Laboratories
D.2.1 – CITYLAB Observatory of Strategic Developments Impacting Urban Logistics (2017)
21
Figure I.2 Megaregions in Europe Source: http://www.creativeclass.com/_v3/whos_your_city/maps/#Mega-Regions_of_Europe.Courtesy of R. Florida.
Many activities have tended to concentrate in megaregions, as part of a general relocation of capital, people, services, and production and distribution activities in large urban conurbations.
Interestingly, and despite the fact that logistics cannot afford a high cost of land, logistics activities seem to participate in the same general trend of polarization in megaregions. Even more interestingly, within megaregions, large cities seem to attract logistics faster than smaller cities or more rural areas. As an example, the average distance of warehouses to their geometrical centre in the Paris megaregion (the Parisian basin, seen around Paris on Figure I.1) went from 155 km in 2000 to 110 km in 2012 (Heitz, Dablanc 2015).
In that case, the logistics system will seek to minimize costs by other means (including decentralization in areas with cheaper land around the main metropolitan areas).
I. 1.3 Logistics sprawl: comparative indicators for 25 case studies and main findings
This section focuses on the metropolitan level, looking at spatial patterns of freight facilities over time. Twenty-five case studies have been identified, from Europe, the US and Canada, and a few other regions.
I. 1.3.1 Case studies and selected indicators
Data has been collected from the following case studies of logistics sprawl carried out in recent scientific works:

CITYLAB – City Logistics in Living Laboratories
D.2.1 – CITYLAB Observatory of Strategic Developments Impacting Urban Logistics (2017)
22
- Amsterdam, the Netherlands - Atlanta, USA - Belo Horizonte, Brazil - Berlin, Germany - Bogota, Colombia* - Brussels, Belgium* - Calgary, Canada* - Cali, Colombia* - Chicago, USA* - Gothenburg, Sweden - region - Gothenburg, Sweden – metro area - Halifax, Canada* - Los Angeles, USA - Montreal, Canada* - Paris, France - all warehouses - Paris, France - parcel and express cross-dock terminals - Rotterdam, the Netherlands - Seattle, USA - Shenzen, China* - The Randstadt, the Netherlands - Tokyo, Japan - Toronto, Canada - Greater Golden Horseshoe - Toronto, Canada - Greater Toronto Area - Vancouver, Canada* - Winnipeg, Canada*
* Added from D2.1 (2016) version
Appendix 1 presents a table with a summary of some of the main data collected. Appendix 2 provides the detailed data collected for each case study as well as information on the source of the work.
Table I.1 below presents the indicators collected for each of the case studies.
Table I.1. Indicators collected for logistics sprawl case studies
Name and size of studied metropolitan area
Type of metropolitan area (Monocentric or rather monocentric; Polycentric or rather polycentric; Megaregion)
Population
Population density
Name of warehouse data source and brief description
Number of warehouses (specify year(s))
Number of warehouses per million people (specify year(s))
Number of warehouses per 1000 km2 (specify year(s))
Average size of warehouses (specify year(s)) (can be any indicator such as m2, m3 or number of employees)
Time period studied for logistics sprawl analysis
Average distance of warehouses to centre of gravity (most recent year) (NB this doesn’t apply to megaregional types of urban regions)
Change in average distance of warehouses to centre of gravity (over the years)
Change in average distance of warehouses to centre of gravity per year
Cluster indicator

CITYLAB – City Logistics in Living Laboratories
D.2.1 – CITYLAB Observatory of Strategic Developments Impacting Urban Logistics (2017)
23
Type of land use control (Strictly local; Some sort of metropolitan-wide land use control; Some sort of region-wide or state-wide land use control)
Other comments/information
Scientific or technical references
These indicators are presented in Appendices 1 and 2, and are analysed in sub-section I.1.3.3 below.
I. 1.3.2 Presentation of two case studies
Out of the 25 identified case studies, we have selected two from Europe to present two examples of logistics sprawl, with contrasting geographic and size situations. One, from Paris, shows the example of a very large monocentric city included in an important megaregion. The other one, from Sweden, shows the example of Gothenburg, a smaller city, not included in a megaregional context, but with an important interurban corridor towards a capital city 470 kilometres away.
Paris parcel transport terminals’ relocation over time
In Figure I.3, two maps from Paris are shown displaying the location of parcel and express transport companies’ terminals in 1974 and in 2010 (Andriankaja, 2014). Parcel and express transport represents around one third of total urban freight activity (in commercial vehicle-trips).
The standard distance of these terminals to their barycentre went from 6.3 km in 1974 to 18.1 km in 2010. Therefore, during this period, it can be said that the relocation of parcel and express transport companies’ terminals has generated approximately an average of ten additional kilometres per delivery round from the terminal to deliver goods inside Paris.
According to Andriankaja (2014), this spatial relocation of parcel transport terminals supplying Paris has generated about 16,500 additional tonnes of CO2 in 2010 compared with 1974, all other things being equal.

CITYLAB – City Logistics in Living Laboratories
D.2.1 – CITYLAB Observatory of Strategic Developments Impacting Urban Logistics (2017)
24
Figure I.3. Location of parcel and express transport terminals in the Paris metropolitan area, 1974-2010 (city of Paris = area within the most central ring-road)
Source: Andriankaja, 2014
Gothenburg warehouses’ relocation over time
In Figure I.4, two maps from Gothenburg (large region) are shown displaying the location of warehouses in 2000 and 2014. The standard distance to their centre of gravity went from 79.3 km in 2000 to 81.4 km in 2014. At the same time, warehouses have clustered: the k-nearest neighbours indicator2 went from 25.5 km to 13.3 km.
The warehouses relocated along the main roads from Gothenburg to Stockholm, around the principal urban settlements.
Gothenburg is still the main host of the warehouses in the metropolitan area. The presence of a large maritime port helps concentrate a large number of warehouses, which is increasing
2

CITYLAB – City Logistics in Living Laboratories
D.2.1 – CITYLAB Observatory of Strategic Developments Impacting Urban Logistics (2017)
25
in the Gothenburg municipality between 2000 and 2014 (+33.1%).
Figure I.4 Location of warehouses in the Gothenburg region in 2000 and 2014. Source: Heitz et al., 2016.
I. 1.3.3 Comparative analysis of indicators
We carried out a comparative analysis of Table I.1 indicators (see Appendix 1 as well as Appendix 2 for specific data collected for each case study). There are 25 case studies observed, and 21 urban areas covered, as Paris, Toronto, Gothenburg and the cities in the Randstadt are being looked at different scales or for different freight sectors.
The main findings are the following:
- The number of warehouses per million of residents ranges from 6 (Tokyo) to 239 (greater Gothenburg). (We only look at general studies here). This varies with the definition of a warehouse and the accurateness of the database: comparisons are actually difficult as the type of warehouses can vary from one case study to another,

CITYLAB – City Logistics in Living Laboratories
D.2.1 – CITYLAB Observatory of Strategic Developments Impacting Urban Logistics (2017)
26
and data sources have issues and are not perfect.
- The number of warehouses per million of residents has increased over time in all case studies except Amsterdam, Montreal, The Randstadt, Tokyo and Vancouver. Vancouver decreased one warehouse in 10 years.
- Logistics sprawl has happened in 17 case studies. It did not happen in Amsterdam, Belo Horizonte, Cali, Bogota, Halifax, Montreal, Seattle and Toronto GTA.
- The average increase of the LS indicator (increase in average distance of warehouses to their barycentre) is 0.31 km/year.3
The observations across each of the indicators presented in Appendix 1 are the following:
- Name and size of studied metropolitan area
There are 25 case studies observed, and 21 regions covered, as Paris, Toronto, Gothenburg and the cities in The Randstadt are being looked at different scales or for different freight sectors.
Most are metropolitan (or megaregional) areas (17). Calgary, Cali, Halifax, Montreal, Shenzhen, Vancouver and Winnipeg are looked at the city (municipal) level.
Their sizes range from 798 km2 (City of Cali) to 87,940 (greater Los Angeles), with an average size of 12,675 km2 (The Randstadt and Toronto GGH excluded).
- Type of metropolitan area (Monocentric or rather monocentric; Polycentric or rather polycentric; Megaregion).
Most case studiesare monocentric. Four are polycentric (Los Angeles and The Randstad are obvious polycentric areas; Berlin and Tokyo are somewhat polycentric). There is one obvious megaregion, the Randstadt. Greater Los Angeles can also be considered both a metropolitan area and a megaregion.
- Population
Population varies from 390,328 (Halifax) to 34.5 million (greater Tokyo), with an average of 6.71 (The Randstadt, Gothenburg region and Toronto GGH excluded).
- Population density
Population density varies from 70 (Greater Gothenburg) to 5,328 (Shenzhen) inhabitants per km2, with an average of 1,017 (Randstadt, Gothenburg region and Toronto GGH excluded).
- Name of warehouse data source and brief description
Data sources vary. Some case studies focus on one specific sector (parcel/express for one of the Paris cases; general cargo (groupage) large hubs for the Berlin case). Most case studies cover all sectors, but sources can be very different, covering a very comprehensive definition of a "warehouse" (such as in Tokyo, with a size limit of only 400 m2 and Shenzhen, with 250 m2), or quite a limited definition, such as for many North American cases (own-account distribution centres are generally not included). Size limits also differentiate warehouses, with Tokyo not excluding small warehouses for example. Canadian studies (Calgary, Halifax, Montreal, Vancouver, Winnipeg and Toronto) have "cleaned" the North American NAICS database, eliminating mini-storage facilities wrongly associated with the "warehouse and storage" category.
- Number of warehouses and number of warehouses per million people
3 Calculated for sixteen case studies (Atlanta, Belo Horizonte, Berlin, Bogota, Brussels, Calgary, Cali, Chicago, Gothenburg (metro), Halifax, Los Angeles, Montreal, Paris (all warehouses), Shenzhen, Tokyo, Toronto GGH, Vancouver and Winnipeg).

CITYLAB – City Logistics in Living Laboratories
D.2.1 – CITYLAB Observatory of Strategic Developments Impacting Urban Logistics (2017)
27
In the latter years observed, the number of warehouses ranges from 9 (Halifax) to 1,660 (Shenzhen) (specific studies excluded, such as Paris 2, Berlin and Brussels). What is more interesting is to compare the number of warehouses per million of residents. This ranges from 6 (Tokyo) to 239 in greater Gothenburg. This varies with the definition of a warehouse (see above) and the accurateness of the database (see above too). However, it can also reveal some specificities: Gothenburg is an industrial and logistics hub for Sweden, and this is reflected in a high rate of warehouses per capita. Los Angeles compared with Toronto (using the same data source) has a higher rate of warehouses per capita, which also indicates its important role as a logistics hub for North America.
Another indicator was calculated showing the annual rate of growth of the number of warehouses per capita. Belo Horizonte and Seattle lead the list of cases (more than 19% annual growth rate), while Tokyo has seen an annual decrease of 18%.
- Number of warehouses per 1000 km2
This ranges from 2 (Halifax) to 850 in Shenzhen, both municipalities.
- Average size of warehouses
This information is generally not included in the case studies, except for Belo Horizonte (2477 m2, on average) and Bogota (382 m2). Other sources will be further investigated.
- Time period studied for logistics sprawl analysis
A lot of the case studies cover a time-period more or less corresponding to the decade starting in 2000. Some case studies stop before the beginning of the world economic downturn (2008). Some cover a rather small time period (Dutch cities and Shenzhen, China). Some case studies look at very long periods (Paris, second study, starting from the 1970s, and Tokyo, covering the period of the housing market bubble in Japan, which ended in 2003).
- Average distance of warehouses to centre of gravity
This is part of the logistics sprawl indicators. This ranges from 2.5 km (Cali) to 82 km (Gothenburg) (all case studies considered except The Randstadt).
- Change in average distance of warehouses to centre of gravity (over the years) and Change in average distance of warehouses to centre of gravity per year
- All case studies except eight (Amsterdam, Belo Horizonte, Bogota, Cali, Halifax, Montreal, Seattle and Toronto GTA) have experienced logistics sprawl (increase in the average distance). This ranges from 1.2 km (Toronto GTA) to 11.8 km (Paris, second study on parcels/express). More interestingly is the indicator per year, as time periods vary from one case study to another. It ranges from 0.06 km per year (Belo Horizonte) to 0.95 km per year (Toronto GGH). The average increase is 0.31 km/year.4
- Cluster indicator
This information is generally not included in the case studies. Other sources will be further investigated.
- Type of land use control (Strictly local; Some sort of metropolitan-wide land use control; Some sort of region-wide or state-wide land use control)
4 Calculated for sixteen case studies (Atlanta, Belo Horizonte, Berlin, Brussels, Calgary, Cali, Chicago, Gothenburg (metro), Halifax, Los Angeles, Montreal, Paris (all warehouses), Tokyo, Toronto GGH, Vancouver and Winnipeg).

CITYLAB – City Logistics in Living Laboratories
D.2.1 – CITYLAB Observatory of Strategic Developments Impacting Urban Logistics (2017)
28
This has been introduced in the data collection and list of indicators as it can represent an important explicative variable for differences in logistics sprawl. Regional types of land use control (Seattle, cities in the Netherlands, Toronto GTA), are associated with limited or non-existing logistics sprawl. This requires much further detailed examination before drawing general conclusions, but may show an interesting trend.
- Other comments/information
Several case studies have looked at sprawl indicators for economic activities in general, as well as population, in order to compare it with the logistics sprawl indicator. In all cases, economic activities (or jobs, or establishments) have sprawled much less than logistics facilities.
I. 1.4 Impacts of logistics sprawl on freight vehicle-kms
I. 1.4.1 More freight vehicle-kms within a metropolitan area
Logistics sprawl generates economies of scale for the logistics industry but has impacts on urban landscapes. One consequence of the deconcentration of freight terminals in suburban areas is the increase in distances travelled within metropolitan areas by trucks and vans to deliver commodities to urban areas where jobs and businesses remain relatively more concentrated. Andriankaja (2014) has estimated the net CO2 emissions’ impacts of the relocation of parcel cross-dock facilities serving the Paris region to an addition of 16,500 tonnes in 2010 compared with 1974.
The following Figure I.5 shows a hypothetical (and abstract) metropolitan journey of a freight shipment that is part of an Amazon transaction within the Los Angeles metropolitan area in California.
Figure I.5. A shipment’s journey within the Los Angeles metropolitan area Source of map: GoogleMaps
Many shipments for Amazon arrive in maritime containers from Asia to the Ports of Long Beach and Los Angeles. Containers are then processed and goods are dispatched on trucks
CITYLAB – City Logistics in Living Laboratories
D.2.1 – CITYLAB Observatory of Strategic Developments Impacting Urban Logistics (2017)
29
servicing Amazon fulfilment centres in the eastern part of the city, about 100 kilometres away from the ports. Some of these goods are then distributed to Los Angeles final consumers, for example households living in West L.A. In this case (hypothetical but realistic), a total of 200 kilometres have been necessary within the Los Angeles area in order to connect a point of origin (the ports) to a point of final destination (a house in West L.A.) that are only 45 kilometres apart.
I. 1.4.2 Less freight vehicle-kms on a global scale?
While increasing within metropolitan areas because of logistics sprawl, freight vehicle-kms can at the same time decrease on a more global scale. As large distribution hubs are located further away from dense and central neighbourhoods, and usually closer to major freight corridors (especially highway nodes), coming in and out of these centres can be more direct, more simple and can therefore be organized through better consolidated modes of transport (large trucks, trains, barges). Distribution centres serving a national market are better off when placed far away from the dense areas of the region they belong to.
However, as Figure I.6 below (from Raimbault, 2014) shows, there is not always a geographical “logic” in the precise location of distribution centres within a metropolitan area. This map shows how large French retailers’ distribution centres are located in the Paris region. Many distribution centres serving a national area (in red on the map) remain located close to the dense area of Paris, whereas many DCs serving mostly Parisian stores (in green on the map) are located in faraway suburbs.

CITYLAB – City Logistics in Living Laboratories
D.2.1 – CITYLAB Observatory of Strategic Developments Impacting Urban Logistics (2017)
30
Figure I.6. French retail industry’s distribution centres in the Paris region Source: Raimbault (2014)
This map shows that the minimization of metropolitan transport distances is not the main driver for the location of logistics terminals.
I.1.4.3. Other issues related to impacts of logistics sprawl
Logistics sprawl can bring un-anticipated types of environmental benefits. As distribution centres are relocated in less populated areas, the amount of truck traffic they locally generate may be detrimental to a fewer total number of people in terms of direct local pollutants such as NOx and particulate matters. Similarly, noise and accidents issues are better managed in a suburban logistics park than in a warehouse located within an urban environment. In Section I.4 below, we began the examination of this hypothesis in detail for the case of the Paris region. This work is not completed yet and we cannot yet conclude on the net environmental impact of logistics sprawl for the Paris case. It will be completed for the last version (February 2018) of Deliverable 2.1.
There are therefore trade-offs linked to the location of freight and logistics facilities. A global assessment is required in order to reach relevant conclusions about logistics sprawl’s impacts.

CITYLAB – City Logistics in Living Laboratories
D.2.1 – CITYLAB Observatory of Strategic Developments Impacting Urban Logistics (2017)
31
I. 1.5 Would moving logistics facilities “back to the city” bring benefits?
If logistics sprawl brings additional freight vehicle-kilometres within metropolitan areas, could a reverse trend (logistics facilities closer to the city centres) bring benefits? Some private initiatives can be identified ranging from large multi-story facilities to small-scale urban logistics service depots. Some policies on land use and planning promote the relocation of logistics facilities into urban environments.
I. 1.5.1 A new urban logistics real estate market
A new urban logistics real estate market is emerging in some parts of the world, especially in Asia and very large cities in Europe and North America.
In Japan, Korea or Hong Kong, large multi-story logistics facilities have been developed in dense areas of the largest conurbations. Below are two photos: one from Seoul, Korea, the other one is a photo of a seven-story logistics facility in Tokyo built and managed by Prologis, the largest logistics developer in the world.
Figure I.7. Prologis urban logistics terminal in Tokyo (built in 2005) Photo: Prologis
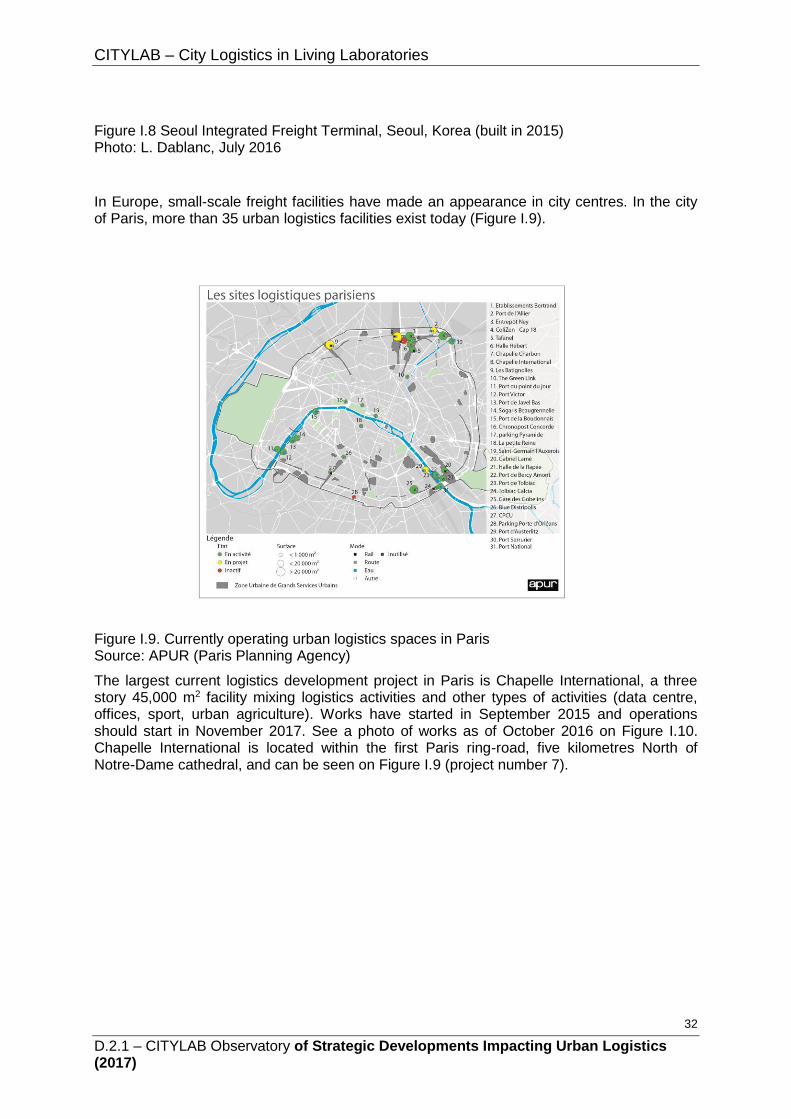
CITYLAB – City Logistics in Living Laboratories
D.2.1 – CITYLAB Observatory of Strategic Developments Impacting Urban Logistics (2017)
32
Figure I.8 Seoul Integrated Freight Terminal, Seoul, Korea (built in 2015) Photo: L. Dablanc, July 2016
In Europe, small-scale freight facilities have made an appearance in city centres. In the city of Paris, more than 35 urban logistics facilities exist today (Figure I.9).
Figure I.9. Currently operating urban logistics spaces in Paris Source: APUR (Paris Planning Agency)
The largest current logistics development project in Paris is Chapelle International, a three story 45,000 m2 facility mixing logistics activities and other types of activities (data centre, offices, sport, urban agriculture). Works have started in September 2015 and operations should start in November 2017. See a photo of works as of October 2016 on Figure I.10. Chapelle International is located within the first Paris ring-road, five kilometres North of Notre-Dame cathedral, and can be seen on Figure I.9 (project number 7).

CITYLAB – City Logistics in Living Laboratories
D.2.1 – CITYLAB Observatory of Strategic Developments Impacting Urban Logistics (2017)
33
Figure I.10. Chapelle International Sogaris logistics hotel building site, October 2016 Source: photo L. Dablanc
In Lyon, France, four small urban logistics terminals are currently operating. One larger project is under consideration involving the port of Lyon.
In many European cities, urban consolidation centres have also emerged. These terminals have usually been established with a commitment from city authorities (through labelling, regulations or direct subsidies) (Browne et al., 2005; Leonardi et al., 2015).
In the US, Amazon’s faster delivery services (Amazon Prime Now, Amazon Fresh, Amazon Pantry) require the company to use warehouses closer to major consumer markets. In New York City, Amazon has set up a 5,000 sq metre distribution centre on the 5th floor of a Manhattan building on 37th street. Several thousands of products are picked up and delivered within one to two hours after order. In Boston, Amazon leased a 10,000 m2 warehouse in a logistics area that hosts grocery and food distributors and is about nine kilometres from downtown Boston. “The ability to deliver goods to Boston within an hour was the main reason Amazon wanted to lease the space” (quote from the president of the company representing the land owner in the transaction, quoted in the Boston Globe, C. Woodward, Sept 10, 2015).
In total, as mentioned by Conwell (2015), Amazon’s strategy for one hour delivery involved (at the end of 2015) 40 urban local delivery terminals, of about 1,500 to 5,000 m2 each. Today (early 2017), there may be twice as many terminals, although exact figures are not available. The main European cities have an Amazon Prime Now service, which involves one urban terminal in Paris (of 5000 m2) and another one planned, two in Milan, several in the UK, one in Berlin, etc.
Conwell (2015) also mentioned urban strategies from developers such as Prologis, particularly in San Francisco and Seattle which have recently experienced the development of multi-story logistics facilities less than three or four miles from the city centre.
I. 1.5.2 Local policies towards urban logistics terminals: from regulatory obstacles to promotional strategies
One obstacle to the emergence of large urban logistics facilities is the local authorities’ requirements. For example, in Paris, one requirement for logistics buildings in the 2006 Paris zoning code is that they be served by railway or river. In that case, efficient urban intermodal

CITYLAB – City Logistics in Living Laboratories
D.2.1 – CITYLAB Observatory of Strategic Developments Impacting Urban Logistics (2017)
34
services, for the moment costly and complex, will be key to the success of an effective return of logistics to the heart of cities. Chapelle International (Figure I.9 above) will have a rail component, which added a lot to the overall cost of the required investments.
Without the connection to rail and waterway, logistics may be able to re-enter the city only in the form of smaller structures, which can blend into small logistics spaces and modest distribution centres.
Close cooperation with the urban planning authorities, real estate practitioners, market experts and practitioners will be an indispensable condition to the development of urban logistics buildings.
The economic feasibility is specifically influenced by land costs, and in particular by the size of the differential between office space and residential real estate prices on the one hand, and logistics land prices on the other hand.
Acceptability from residents for the introduction of new logistics buildings in urban environments will require great care provided to architectural, environmental and landscaping quality of the building, as well as planning for quiet and non-polluting operations afterwards. A building such as Chapelle International in Paris will bring several dozen vehicles in and out of the site everyday, including some heavy trucks, as rail will not provide 100% of the incoming goods. A specific care was taken to provide specific road entrances and exits to the site. The use of natural gas and electric vehicles will be promoted.
From the point of view of real estate practitioners, urban logistics buildings will be easier to develop when technical standards are established. Standardization should potentially improve profitability for the investors. Public authorities have a role to play in the establishment of these technical standards.
Recent public initiatives towards the promotion of urban logistics facilities can be noted. Below (Figure I.11) is a map from the new Paris zoning law (adopted in 2016). This map specifically focuses on urban logistics activities. All coloured spots will have a vocation for logistics activities.
Figure I.11. Strategy for urban logistics terminals in the 2016 Paris zoning law. In green, existing logistics sites. In yellow: development in progress. All other colours: potential logistics sites for the future. Source: map from APUR, released by Paris Department of Planning, December 2015

CITYLAB – City Logistics in Living Laboratories
D.2.1 – CITYLAB Observatory of Strategic Developments Impacting Urban Logistics (2017)
35
I. 2. Key conceptual relationships
In this section, we identify a number of key conceptual relationships that help understand spatial patterns of logistics facilities and help foresee future trends for these facilities.
These are mostly hypotheses, made from the literature and from the case studies. As the number of case studies and data collection increase, as well as diversify, these relationships will be further tested towards final (in)validation.
The 9 case studies on logistics sprawl that have been added to this report (D2.1 V2, 2017) compared with the previous report (D2.1 V1, 2016) validate our hypotheses.
I. 2.1 Increase in the number of warehouses
- The increase in the number of logistics facilities over time is positively related to the importance of the role of global logistics hub played by an urban area.
- The increase in the number of logistics facilities over time is positively related to the increase in the digitalization of retail (increase in B2C demand) in an urban area.
- As B2C demand increases in large metropolitan areas, the demand for small logistics buildings within the urban area increases.
- The increase in the number of warehouses over time is larger in megaregions. - The increase in the number of warehouses over time is larger in big cities within
megaregions.
I. 2.2 Logistics sprawl
- Logistics sprawl is positively related to the differential in land/rent values for logistics land uses between suburban and central areas in an urban region
- Logistics sprawl is positively related to the availability of large land parcels in suburban settings
- Logistics sprawl is negatively related to the degree of regional logistics land use control
- The degree of logistics sprawl varies with the type of logistics terminal (i.e. stronger for distribution and fulfilment centres, weaker for parcel transport terminals)
- Logistics sprawl generates an increase in the number of freight vehicle-kilometres within the urban region if its rate is higher, on the same time period, than economic and residential sprawl.
- Additional vehicle-kilometres induced by logistics sprawl are likely to impact less densely populated areas, thus generating less diffused transport externalities (local pollutants, noise, accidents).

CITYLAB – City Logistics in Living Laboratories
D.2.1 – CITYLAB Observatory of Strategic Developments Impacting Urban Logistics (2017)
36
I. 3. Focus 1: A theoretical exploration of the cost structure of urban logistics
François Combes, CEREMA
The causes and impacts of logistics sprawl are not easy to identify. The function of many of the logistic facilities at the periphery of metropolitan areas is to make the connection between interurban logistics and urban logistics, also known as the last-kilometre. It allows supply chains to benefit both from the economies of scales of long distance interurban freight transport where shipments are carried together by large capacity vehicles and from the efficiency of urban freight transport, where small vehicles make tours to deliver several shipments in one operation.
The location of warehouses is a strategic decision in a supply chain. Locating a warehouse close to the metropolitan area it provisions reduces transport costs on the urban side, but may increase them on the regional and national side, and most probably increases land/rental costs. Urban locations, in many cases, may also just prove impossible due to the lack of adequate land parcels. This basic reasoning, while qualitatively simple, involves complicated, nonlinear relationships that this section aims to clear up, at least partially.
The objective of this section is to present a simplified, theoretical approach of the costs of urban logistics, with the objective to illustrate the various mechanisms at work, and to answer, at least partially and qualitatively, to some of these questions. The approach is inspired from Daganzo (2005): simplified geographical hypotheses are adopted (such as: the city consists of two uniform zones, the centre and the periphery), in order to design a tractable analytical model. The model takes into account explicitly several important parameters: land use costs, transport costs, the duration of drivers' work days, vehicle speed in the city centre and periphery, and the amount of deliveries in the city centre. Comparative statics are derived in order to analyse the role of the model's parameters in the location of warehouses at the edge of the city.
I. 3.1 A simplified representation of freight transport
Urban logistics is a complex issue. Shipments arriving in cities, or leaving them, can be carried in many ways, for shippers and receivers with very varied demands. In a simplified manner, one can consider that for a given shipment, freight transport can be organized in three ways (Figure I.11):
- (a) ‘one-to-one transport’: have a vehicle carry the shipment alone, from the plant to the customer and then come back;
- (b) ‘one-to-many transport’: have a vehicle carry multiple shipments, from the plant to a series of customers in the city and then come back;
- (c) ‘many-to-many transport’: have a heavy goods vehicle move all the shipments due a certain day or week to a warehouse located near the city, then load them in smaller vehicles which deliver them to the customers.
This basic segmentation disregards multimodal transport, where the sequence of operations is necessarily even more complex. It also disregards the problem of the choice of vehicle, to which it is closely related.

CITYLAB – City Logistics in Living Laboratories
D.2.1 – CITYLAB Observatory of Strategic Developments Impacting Urban Logistics (2017)
37
Figure I.11. Three typical transport organizations Source: F. Combes
Each organization corresponds to a specific demand: option (a) is more adapted to large shipper-receiver flows whereas option (c) is relevant for small flows of fast moving goods; option (b) is somewhat intermediate (Combes and Tavasszy, 2015). The main advantages of option (c) over the two others are that it allows using simultaneously small vehicles and large vehicles in the same supply chain. On the other hand, it requires a building and the associated land/rent and transhipment costs.
Option (c) is particularly interesting when studying logistics sprawl: by contrast with options (a) and (b), it is extremely efficient in an urban context for many commodity types; it also raises both transport and land use issues. The objective of the following sections is to develop a simple model of that option, in order to better understand the economic mechanisms involved.
I. 3.2 The cost structure of the supply chain
Let us now set the assumptions of the model. Consider a shipper sending commodities to a city of area A from a plant or a national warehouse located far from that city. The supply chain between that plant and the customers in the city consists of a sequence of successive stages, which can be described as follows: the commodities are transported from that plant to a warehouse located at distance l from the city centre (a). The commodities are unloaded in the warehouse and stored, and sorted, and then loaded into smaller vehicles to be delivered to the customers in the city (b); each of those vehicles makes a round, delivering several customers in the process. The round consists of an approach movement and a return movement (c), and all the intermediate movements inside the city, between the consecutive delivery locations (d). Figure I.12 describes this sequence. It shows how one shipment (the red box) is carried from a plant to a customer through a cross-docking platform, together with many other shipments that have distinct origins and destinations. The grey, dashed lines depict the movements of other vehicles, delivering or picking up shipments from or towards other destinations.

CITYLAB – City Logistics in Living Laboratories
D.2.1 – CITYLAB Observatory of Strategic Developments Impacting Urban Logistics (2017)
38
Figure I.12. Description of the transport operation Source: F. Combes
The total transport and transshipment costs consist of three components: the cost of carrying the commodities from the plant to the warehouse, the warehouse and transshipment costs, and the cost of carrying the commodities from the warehouse to customers. The first cost component is not critical in the context of this research: the commodities are transported by heavy goods vehicles over typically long distances, and the corresponding cost does not depend much on the location of the warehouse or on what happens on the city side.
The second cost component is critical in the context of this research. It consists of the fixed and variable cost of the warehouse Cw. Out of simplicity, let us assume that the warehouse's size is proportional to its throughput, and that its rental and operating costs are both proportional to its size, and decreasing functions of the distance of the warehouse to the city centre (on the basis of the radial symmetry assumption). Let cw(l) denote the warehouse and transhipment cost, in monetary unit per shipment. The warehouse cost is:
𝐶𝐶 = 𝐶𝐶_𝐶𝐶
The third cost component is the transport cost on the city side, or the last-kilometre transport cost, Ct. It is also of utmost interest in the context of this research. Each vehicle delivers multiple customers by making rounds. The more customers there are in a round, the less costly it is to deliver to each of them. However, round's lengths are constrained. In practice, several types of constraints, or regimes, can be distinguished. The following two will be examined in this research:
- Regime 1: the round's length is constrained by the duration of the driver's work dayH. (H depends on whether deliveries are made in the morning and pickups in the afternoon or during the whole day).
- Regime 2: the round's length is constrained by the delivery lead time expected by the customers, and that delivery lead time is lower than the driver's work day duration. If customers expect to be delivered in less than H hours after ordering, the round's duration cannot5 be larger than H.
These two regimes are not very different from the perspective of the supply side: in both cases, the round duration cannot exceed H. The main distinction will be on the demand side; under regime 2 the round duration H is endogenous.
The following two other regimes could also be considered:
- Regime 3: the round's length is constrained by the capacity of the vehicle: there can be no more shipments in the vehicle than it is technically designed to carry.
5This is a simplifying assumption. It may be - theoretically - possible for the shipper to dispatch before customers actually order, thus anticipating the delivery process, given adequate forecasting technologies. However difficult this may seem, the paper will hopefully show the extremely strong financial appeal of such an organization.

CITYLAB – City Logistics in Living Laboratories
D.2.1 – CITYLAB Observatory of Strategic Developments Impacting Urban Logistics (2017)
39
- Regime 4: the round's length is constrained by the vehicle's autonomy.
Studying these regimes would be instructive, but would add a significant layer of complexity to the modelling work, without being central to the issue of this research. Regime 3 is not an absolute constraint: it is in fact related to the issue of the choice of vehicle capacity. Regime 4 is only a constraint for some transport technologies. Electric vehicles can be concerned, internal combustion or hybrid vehicles will not.
For the time being, consider the number of shipments to be delivered during a period of duration H as given and equal to F. Then, the length of each round will depend on the length of the approach and return movements, approximately l, and also on the distance between
two consecutive customers in the city centre. Let denote this distance. It is very difficult to compute exactly, as finding the rounds that minimize the transport cost is known to be a NP-hard problem. However, it can also be approximated. Intuitively, if the area of the city is
multiplied by 4 and the number of customers to deliver is unchanged, then is only multiplied by 2. This is illustrated by Figure I.13: if there are two times more delivery points in an area of given size, the average distance between two successive points in an optimal round decreases by the square root of 2.
Figure I.13. Relationship between the number of delivery points and transport distances Source: F. Combes
In general, in a uniform area, is approximately equal to:
𝐶 = 𝐶√𝐶
𝐶
withk a positive constant (Daganzo, 2005). Now, denote by va (resp. vz) the vehicle speed outside (resp. inside) the city centre. Consider a vehicle delivering x customers. The round's duration is then:
𝐶 = 2𝐶
𝐶𝐶
+ 𝐶 (ℎ +𝐶
𝐶𝐶
)
whereh is the time a delivery actually takes, or the idle time for the vehicle at each customer's, and x is unknown. In both regimes 1 and 2, the round’s duration is constrained: d = H. This equation has important implications: the number of locations which can be delivered during a given round depends on the distance of the warehouse to the city centre. More precisely: the farther the warehouse from the city centre:
- the more time it will take for vehicles to reach the city centre; - the less customers a vehicle will be able to deliver; - the higher the unit transport cost (i.e. the transport cost per delivery).
As a matter of fact, it is possible, with a few calculations (Appendix 3), to derive the transport cost function. The transport consists of two basic components: the vehicle operating cost cl, assumed proportional to the distance covered, and the workforce and vehicle capital cost ch, proportional to the time vehicles and drivers are operated.

CITYLAB – City Logistics in Living Laboratories
D.2.1 – CITYLAB Observatory of Strategic Developments Impacting Urban Logistics (2017)
40
The transport cost function is then6:
𝐶𝐶 =
𝐶𝐶
𝐶𝐶
ℎ𝐶 + (1
𝐶𝐶
𝐶𝐶
𝐶𝐶
+ 𝐶𝐶) 𝐶√𝐶𝐶 (1)
When the warehouse is located farther from the centre, the useful time during a round Hr, i.e. the round’s duration once removed the duration of the approach and return movement, decreases.
The other cost component in the supply chain is the rental cost Cw. The total cost is the sum of Ct and Cw:
𝐶 = (𝐶𝐶(𝐶) +𝐶𝐶
𝐶𝐶
ℎ) 𝐶 + (1
𝐶𝐶
𝐶𝐶
𝐶𝐶
+ 𝐶𝐶) 𝐶√𝐶𝐶
The unit cost is:
𝐶
𝐶= 𝐶𝐶(𝐶) +
𝐶𝐶
𝐶𝐶
ℎ+ (1
𝐶𝐶
𝐶𝐶
𝐶𝐶
+ 𝐶𝐶) 𝐶√𝐶
𝐶
The analysis of the unit cost shows the crucial role of the density of delivery points in the cost function: the unit cost actually decreases when the number of deliveries increases. Indeed, when there are more deliveries in a given area, the average distance between each of them decreases; this allows vehicles to do more vehicles during the same round. The increase in density has thus two effects on the total cost: a direct one through the reduction in distance between two successive deliveries, and an indirect one through the decrease in the number of approach and return movements.
Now, observe that the cost depends on the distance between the city centre and the platform. The immediate question is whether there is a distance for which the total cost and minimum and what its value is.
I. 3.3 Optimal location of the warehouse
The contribution to the cost function of the warehouse's distance to the city centre is twofold. On the one hand, the closer the warehouse to the city centre, the higher the rental and building costs; on the other hand, the lower the transport costs. Let us assume that cw is a differentiable function of l. The optimal distance is defined here as the distance which minimizes the total cost for a fixed demand. Then, if the optimal length is not a border solution7, a necessary condition for l to be optimal is that:
𝐶𝐶
𝐶𝐶= 0
Equivalently (Appendix 3):
𝐶𝐶𝐶
′ + 2𝐶𝐶𝐶
ℎ𝐶
𝐶𝐶
+ 2𝐶𝐶𝐶
ℎ𝐶
𝐶𝐶2 𝐶𝐶
= 0 (2)
6Where cR = 2cl l + chH denotes the “fixed” part of the transport cost, i.e. the part which does not depend on ; and Hr = H – 2l/va denotes the duration of the round once removed the duration of the approach and return
movements. 7That is to say, the optimum is not to locate the warehouse in the city centre or at its far periphery, but somewhere in the middle of these two extremes.

CITYLAB – City Logistics in Living Laboratories
D.2.1 – CITYLAB Observatory of Strategic Developments Impacting Urban Logistics (2017)
41
Where ho = h + /vz is the duration of a delivery operation, including the corresponding transport. At the optimal location, the additional cost of being one kilometre closer to the city centre should be equal to the travel cost it saves. If it were not the case, it would be profitable for the warehouse to relocate somewhere else. The travel cost savings come from the reduced length of the approach and return movements and from the fact that less rounds are necessary to deliver F customers when the warehouse is closer to the city centre. Note that
the optimal location appears to be independent on F; it doesn't: the density parameter , which depends on F, influences both ho and HR.
The warehouse's optimal location does not depend on the rental costs gradient, but on its variation. The willingness of the shipper to pay to reduce the warehouse's distance to the centre increases with l: the impact of l on the number of rounds is stronger when l is large. If the variation of the rental cost is constant or decreasing with l (i.e. if the rental curve is decreasing and convex), then the optimal location is necessarily unique. The optimal price in the case of an interior solution is illustrated in Figure I.14 with a generic sample, with an interior solution. If the rate is convex and decreasing fast enough, then the solution is unique; but in general many configurations are possible8.
Figure I.14. Variation of the cost functions with the warehouse’s location Source: F. Combes
Let us now examine how the optimal distance depends on the various parameters of the model. Examination of the cost function (see Appendix 3) allows concluding that in general:
- The optimal distance decreases with cl and ch: when the kilometre cost or the hour cost of operating a vehicle increases, transport costs more; it is then profitable to be closer to the city centre.
- The optimal distance decreases with h: the slower the delivery and pickup operations, the heavier they weight in the transport cost. When the duration of these operations increases, it is profitable to bring the warehouse closer to the city centre.
- The optimal distance increases with H. Under Regime I, when the work's day duration increases, the relative weight of the approach and return movements decreases in the cost function. It is not necessary to pay as much to be close to the city centre.
8The right hand side of the equation increases from 2Fcl ho/H + 2 FcRho/H2va to when l goes from 0 to H - 2l/va. Therefore, the optimal length is never larger than H - 2l/va$.If the rate gradient cw' is always lower than 2clho/H + 2cRho/H2va then the warehouse will locate inside the zone it serves. If the rate cw is convex and decreasing, and the rate gradient is not too low, then a unique interior solution exists. If not, an interior solution may still exist. For l a zero of the derivative of the cost function to be an optimum, it is necessary, but not sufficient, that cw be decreasing and that cw'' be larger than the differential of the rest of the equation’s LHS with respect to l.
0
2
4
6
8
10
12
14
16
0 4 8 12 16 20 24 28 32 36 40
Co
st
Distance of the warehouse to the city centre
Rent cost
Transport cost
Total cost

CITYLAB – City Logistics in Living Laboratories
D.2.1 – CITYLAB Observatory of Strategic Developments Impacting Urban Logistics (2017)
42
This is true as well with the delivery time under Regime II: warehouses need to be closer from the city centre to deliver customers quickly in a cost-efficient way.
- The optimal distance increases with vz and va: when the vehicle speed increases in the city centre or during the approach and return movement, it is possible to deliver more customers with a given round. Transport weighs comparatively less in the cost function; it is profitable to locate the warehouse further from the city centre.
- The optimal distance decreases with , i.e. increases with F. When there are more delivery or pickup operations, they are denser in a given area. Each operation costs less, so that transport weighs comparatively less in the cost function; it is profitable to locate the warehouse further from the city centre.
These results can be summarized as follows (Table I.2): if any of the cost parameter increases, the optimal distance decreases; if any of the speed parameter increases, the optimal distance increases; if the unit cost of a delivery operation increases, due to a longer delivery duration or to a lesser delivery location density, the optimal distance decreases; under Regime 1, if the work day constraint H increases, the optimal location increases; under Regime 2, if customers want to be delivered faster (i.e. H decreases), the optimal location
decreases. Finally, if the average distance increases, the optimal location decreases.
Table I.2. Variation of the optimal warehouse’s location with the model’s parameters.
Increasing Parameter Variation of warehouse location
vehicle operating cost cl Closer to the city centre Driver cost and vehicle ownership cost ch Closer to the city centre Duration of delivery operation h Closer to the city centre Maximal round duration H Farther fromthe city centre Vehicle speed in the city’s periphery vz Farther from the city centre Vehicle speed in the city centreva Farther from the city centre
Density of delivery locations 1/ Farther from the city centre
Amount of deliveries F Farther from the city centre
It should be noted that when the total demand increases, then the optimal distance increases. Indeed, the more customers for a given warehouse, the higher the density of delivery locations, hence the unit cost decreases and the benefit to be close to the city centre is not as large. As a consequence, logistic sprawl could be caused as much by the exogenous trends of logistics of the past decades such as the development of e-commerce which increased the quantity of pickup and delivery operations in cities, as by the evolution of the land use market.
On the other hand, it should also be noted that when the constraint on the round’s duration H is very strong (e.g. customers are to be delivered two hours or less after ordering, it is cost efficient for warehouses to locate near city centres, despite the rent cost, provided the customers are ready to pay for the additional cost).
I. 3.4 Analysis of the cost structure of the supply chain
The cost structure of the supply chain and the consequences in terms of regulation depend
directly on the relationship between F and C. If were fixed then the cost function would be linear; there would be no returns to scale9; and thus no ground for regulation10, and the
9To the extent where several strong assumptions hold, including the constant returns to scale of the warehousing costs.
CITYLAB – City Logistics in Living Laboratories
D.2.1 – CITYLAB Observatory of Strategic Developments Impacting Urban Logistics (2017)
43
marginal cost and the average cost would be equal. However, is not fixed, and the marginal cost of an additional customer in the time period is (Appendix 3):
𝐶𝐶 = 𝐶𝐶 +
1
2𝐶𝐶𝐶 + 𝐶𝐶
ℎ𝐶 − 𝐶
2𝐶𝐶
𝐶𝐶 (3)
It can be compared to the average cost C/F derived earlier. The marginal cost is lower than the average cost: the cost structure of the supply chain of this model exhibits increasing returns to scale. The difference between the marginal cost and the average cost is the marginal external cost of an additional customer.
𝐶
𝐶− 𝐶𝐶 = −
1
2𝐶𝐶𝐶 − 𝐶𝐶
ℎ𝐶 − 𝐶
2𝐶𝐶
𝐶𝐶
This difference derives from two causes: first, an increase in density reduces the distance between two successive operations inside the city centre, and thus the corresponding cost. Second, this also allows delivering more locations during the same time: the cost pertaining to the approach and return movements from and to the warehouse is shared among more customers.
The negative marginal external cost is exactly symmetric to the positive marginal external cost of congestion in road transport. Not only does an additional driver on a given road suffer from the traffic jam; by contributing to the traffic jam it also inflicts on all the other drivers a marginally increased travel time. In the case of urban logistics it is the contrary: an additional customer will cost less than the average cost because it has good chances to be on the way between two existing customers. A large amount of new customers will increase the overall efficiency of urban logistics, because there will be more locations to deliver to and less distance between each of these locations. Indeed, it can be considered as a source of economies of agglomeration, although one difficult to confirm empirically.
From the perspective of market structure, whichever way the market works, the prices will always be larger than the marginal cost, without regulation (i.e. subsidies). As a consequence, the demand will be lower than it would be at its first-best optimal level11. This is a typical market failure, which calls for a correction.
This correction can take many forms. The most obvious, but perhaps the politically least realistic one is that of a direct subsidy to urban logistics, notwithstanding the fact that a careful analysis of market structure would be required to confirm the feasibility and efficiency, even from a theoretical standpoint. Other indirect means can be considered, such as urban planning options. A possible urban planning option would be to assign land to logistic premises. This raises complex issues, such as how and where this should be done, and also whether and how the resulting land use prices should be controlled, to actually correct the imperfection. Those questions are still open.
I. 3.5 Conclusion
In order to analyse the potential causes of logistics sprawl, this section presents a simple analytical model of the cost structure of urban logistics. Even on a simple case, the model illustrates the complex and nonlinear relationship between the land use market, the parameters of urban logistics (vehicle speed, workday duration, costs and the demand)
10This statement is made from a neoclassical economic perspective, where regulation is called for in the presence of market imperfections, and aims at correcting them, partially or totally. Besides, the statement disregards the regulation of all the transport externalities: congestion, accidents, noise, pollution and GHG emissions, for which other instruments exist. 11This optimal level is the one that would be obtained by a 'benevolent planner' or, perhaps a little – but not much – more realistically, if all inhabitants planned together the location of warehouses

CITYLAB – City Logistics in Living Laboratories
D.2.1 – CITYLAB Observatory of Strategic Developments Impacting Urban Logistics (2017)
44
and the location of a warehouse. In particular, the research shows that an exogenous increase in the demand for pickup and delivery operations results in warehouses locating away further from cities, as a result of transport operations weighing relatively less in their cost function. On the other hand, the model hints to how an emerging market for very reactive logistics needs to be accompanied by logistic facilities coming back in city centres, despite the price. Finally, the model shows that the location of logistic facilities is determined by the rent gradient, not its absolute value: if rents are uniformly high, warehouses will have no need to move far from the city centre.
Besides, the section briefly sketches some possible implications in terms of market structure and equilibrium pricing. Even accounting for the limitations of the model, urban logistics is most probably characterized by economies of scales. This results in non-trivial conclusions in terms of the efficiency of the market, and also of the policy actions that could or should be taken to address potential market imperfections. In particular, one conclusion is that there is economic ground to the idea of giving some space to logistic facilities near city centres in order to improve the efficiency of urban logistics, for the benefit of city centres’ inhabitants; however, this should be done in a careful way, lest a mechanical increase in rents in these areas cancels the initial objective of the action.
At this stage, this line of research is very much a work in progress. Many directions still need to be explored: the most important one is to consider an endogenous level of demand. Next, the implications in terms of market structure and potential ground for the implementation of policy measures should also be closely examined. From a technical perspective, it is necessary to extend the model to an endogenous demand, where the amount of pickup and delivery operation derives from the price charged by shippers. This demand could be generic, or could derive from models of inventory theory. The second option, while it needs an empirical validation, is useful insofar as it explains why pickup and delivery frequency has value to the inhabitants of the city centre.
This work will leave many open questions for the medium to long term. One particularly important question, both technically and empirically, is about how the urban logistics market works. Markets with economies of scales are complicated to study; they are often characterized by monopolistic competition. In our context, a particular question is whether this competition leads to spatial specialization of logistic service providers and carriers or not. In other words, do they compete in the same areas in the city centre, irrespective of the location of warehouses, or do they tend to locate in distinct territories? The answer depends most probably on the market segment, and data will be required at some point to explore the question further.
The implication of this question on this work is direct, as it governs the density of pickup and delivery operations as perceived by a given operator: if many operators compete over the same area, then the efficiency of urban logistics is much lower than if each operator operates in a zone of which the competition is virtually absent. The second important question pertains to the externalities of urban freight transport: congestion, pollution, noise, and accidents. It should be studied together with the policy instruments already in place to address them. Precisely, the question is: to what extent do the conclusions obtained in this study still hold when these externalities are accounted for?
I.4 Focus 2: The environmental impact of urban freight Authors: Martin Koning, IFSTTAR Nicolas Coulombel, IFSTTAR Laetitia Dablanc, IFSTTAR

CITYLAB – City Logistics in Living Laboratories
D.2.1 – CITYLAB Observatory of Strategic Developments Impacting Urban Logistics (2017)
45
Mathieu Gardrat, LAET
In this section, we look at the actual environmental impact of urban freight. This is part of a research looking at the environmental impact of logistics sprawl. This section is the first step. The next steps will be finalized for the third report of the Observatory (D2.1 V3 February 2018).
We are interested in the whole variety of factors that determine the environmental emissions linked to logistics activities. Total environmental emissions are identified in the following as
𝐶𝐶𝐶𝐶𝐶. They are formalized in the case of the pollutant j as12:
𝐶𝐶𝐶𝐶𝐶 = 𝐶𝐶
𝐶𝐶 × ∑ 𝐶𝐶𝐶 × 𝐶𝐶
𝐶 × 𝐶𝐶𝐶𝐶
𝐶
(1),
where 𝐶𝐶𝐶𝐶 corresponds to the number of logistics operators in a given area, 𝐶𝐶
𝐶 to the volume of (daily, monthly, yearly) movements made by each operator with class k vehicles
(trucks of vans for instance), 𝐶𝐶𝐶 describes the mean distance travelled during individual
movements, and 𝐶𝐶𝐶𝐶 is the pollutant j emission factor (in g/km) of class k vehicles.
Based on figures in Table 1, it is tempting to conclude that the environmental impact of LS is
negative (𝐶𝐶𝐶1𝐶 − 𝐶𝐶𝐶0
𝐶 > 0) because 𝐶1𝐶 > 𝐶0
𝐶. However, more peripheral logistics
terminals will coincide with 𝐶1𝐶 > 𝐶0
𝐶 only if customers (goods’ receivers) have moved away from city centres to a lesser extent than warehouses have. In addition, a diachronic assessment made on a “ceteris paribus” basis is not relevant if other driving factors of
𝐶𝐶𝐶𝐶𝐶 are simultaneously evolving. Dynamic cities are likely to host more logistics
operators over time (𝐶1𝐶𝐶 > 𝐶0
𝐶𝐶) and organizational changes in the logistic sector (Aljohani and Thompson, 2016) or varying needs of customers may alter the volume of goods’
movements (𝐶1𝐶 ≠ 𝐶0
𝐶). Above all, an abundant literature in mechanical engineering or environmental sciences (André and Hammarstrom, 2000; Knecht, 2008; SETRA, 2009; Ntziachristos et al., 2009; Alagumalai, 2014) has shown that combustion engines, through legal standards on emissions limits, have made huge progresses and led to substantial
decreases in unitary emission factors (𝐶1𝐶𝐶 < 𝐶0
𝐶𝐶). As a consequence, a sound analysis
should consider modifications in all variables affecting 𝐶𝐶𝐶𝐶𝐶.
Second, the use of averaged emission factors can lead to misleading conclusions due to the non-linear (generally U-shaped) relationship between pollutant emissions and traffic speeds (André and Hammarstrom, 2000; Ntziachristos and Samaras, 2000; DETR, 2000; SETRA, 2009). Since vehicle speed depends on the flow of cars, vans, trucks simultaneously present on the roads (Akçelik, 1991; TRB, 2010; Ortuzar and Willumsen, 2011; Moridpour et al., 2015; Müller and Schiller, 2015), it may be particularly relevant to feed the emission model with insights from traffic engineering studies, as done by Zhou et al. (2015) or Patil (2016). Conducting this kind of analysis within a spatial framework should allow us to assess whether the (potential) additional freight trips caused by LS take place in far suburban areas (characterized by low traffic densities, higher speeds and lower unitary emissions) or in dense areas (where more and slower vehicles are found, thus inducing higher emissions). We believe this approach to be of special interest if we consider not only the changes in emissions caused by logistics-related trips (LRTs), but also the associated damages: aside from CO2 which has global consequences (Tol, 2009), the negative impacts of local pollutants are positively correlated with the total number of exposed people (CGSP, 2013; Ricardo-AEA, 2014). This composition effect is likely to weigh in the total environmental impact of LS.
12 Our empirical analysis is limited to the analyses of carbon dioxide (CO2), carbon monoxide (CO), fine particulate matter (PM10), nitrogen oxides (NOx) and non-methane volatile organic compounds (NMVOC).

CITYLAB – City Logistics in Living Laboratories
D.2.1 – CITYLAB Observatory of Strategic Developments Impacting Urban Logistics (2017)
46
By empirically modeling the environmental footprint of LRTs in the Paris region, this research constitutes a first step towards a better understanding of the environmental impact of LS.
While we initially got access to localized economic information for 2000 and 2012, it is worth noting that the oldest data displayed major inconsistencies, in terms of jobs’ and economic establishments’ volumes. Therefore, this article focuses only on the environmental footprint of LRTs in the Paris region for 2012, using reliable input data and adopting a broad definition of logistical operations: we do not distinguish trips originating from “pure” logistics establishments (warehouses, distribution centres, etc.) and those linked to other economic activities. Even if we analyze urban freight in general, rather than vehicles’ movements from or towards logistics facilities, we believe this “static” study to be of interest. First, it allows testing the operability of the proposed methodology. Second, it provides one spatially differentiated measurement of the pollutant emissions caused by LRTs. This work differs from Airparif (2013) - that has estimated pollutants emissions in the Paris region for 2010 – because it did not decompose the results across various areas. We expect to access economic data for 2000 in the near future. This information will enable us to propose for the next deliverable (D2.1 V3, February 2018) a diachronic analysis on the environmental impact of LS, with a clear distinction between trips made to and from logistics facilities and those originating from other economic establishments.
The rest of this section is structured as follows. We present the research strategy, which combines three successive modeling exercises. This analysis has been designed to assess emissions due to LRTs but we also consider emissions caused by private passengers.13 Our case study, the Paris region, is presented then, including input data. Estimated pollutant emissions and corresponding social damages are discussed then we summarize findings for this deliverable (D2.1 V2) and present the research strategy for the next deliverable (D2.1 V3).
I. 4.1. Research strategy
I.4 1.1 Model architecture
Figure 1 illustrates the four phases of our modeling exercise. One crucial, starting-point ingredient relates to the knowledge of logistics-related trips (LRTs). As compared with private passengers, Origin-Destination (OD) matrices for freight are hardly available in many urban areas, although data collection efforts have been observed over the last decade (Allen et al., 2007; Figliozzi et al., 2007).14 To palliate this lack of information, we take advantage of the Simetab-Freturb softwares (developed by the Laboratory of Planning and Transportation Economics at Lyon 2 University, see Routhier and Toilier, 2007; Gardrat et al., 2014). Freturb and Simetab provide “generation coefficients” (number of weekly deliveries and pick-ups) of business establishments located in a given area. By crossing data on goods’ emissions and attractions per zone with Euclidean distances, Freturb then “distributes” the total freight flows across areas, thus providing OD matrices for trips made by trucks and vans.
We want to base our pollutant estimates directly on vehicles’ speeds. To do so, we combine OD matrices for both freight and private trips - the latter being exogenously drawn from official data – with the physical attributes of the road network and the vehicles’ usage costs. Thanks to the TransCAD software, we then identify the routes chosen by drivers who are
13 We ignore road traffic (and associated pollutant emissions) from public buses, motorized two-wheelers and cabs. 14 Whilst using a general methodology similar to the one presented on Figure 1, the study by Airparif (2013) on pollutant emissions in the Paris region does not rely on OD matrices for freight vehicles. It rather uses count data on some road segments of the regional network. Other main differences come from the evaporation of pollutants, that we ignore here, and from the structure of the vehicles’ fleet, for which we are not using the same data source. Also, we propose some estimates of the social costs of air pollution due to freight traffic in the Paris region.

CITYLAB – City Logistics in Living Laboratories
D.2.1 – CITYLAB Observatory of Strategic Developments Impacting Urban Logistics (2017)
47
assumed to behave rationally, i.e. according to “Wardrop’s equilibrium principles” (see Small and Verhoef, 2007; or Ortuzar and Willumsen, 2011). This multi-class assignment model gives us detailed information on the volume, the composition of traffic flows (cars, vans or trucks) and the vehicles’ speeds, for each road link.
The third modeling step is focused on pollutant emissions, from road private transport in general, and from LRTs in particular. Calculations are made with the Copcete software (Demeules and Larose, 2012), developed by the French Ministry of Environment to facilitate the socioeconomic appraisal of transport projects.15 This tool requires information on traffic flows and vehicles’ speeds as input data, at the road-link level and differentiated across vehicle classes. After selecting the technological composition of the fleet, the infrastructures’ characteristics and the pollutants under study (up to 30), Copcete estimates total emissions due to the circulation and, if desired, evaporation cycles, for each road segment and from each vehicle’s class.
Figure 1 – The four phases of the model
Outcome Software Input data
Step 1:Creating OD matrices for
freight and logistics operations(vans and trucks)
Step 2:Determining the multi-class
assignment equilibrium(flows and speeds at the segment level)
Step 3:Estimating the pollutant emissions
(for cars, vans and trucks)
Step 4:Assessing the impacts(individual exposure,
monetary values)
SimetabFreturb
TransCAD
Copcete
Municipal boundaries
Euclidean distances
Location of sectoral jobs/firms
Location of households
OD matrices for private cars
Costs parameters for vehicles
Characteristics of roads
Composition of the vehicles’ fleet
Pre-determined zoning
External costs of pollutants
Sources: authors’ elaboration.
Whereas the (simple) methodology used to assess the social impacts of pollutant emissions will be discussed in section 4, we now briefly present each sub-model.
I.4.1.2 Generating OD matrices for freight with Simetab and Freturb
Freturb has multiple applications for urban freight analyses (see Routhier and Toilier, 2007). It is used in this research only to generate and to distribute freight flows in the Paris region.
15 We are using the 4th version of the Copcete calculator. For a detailed presentation, see Demeules and Larose (2012).

CITYLAB – City Logistics in Living Laboratories
D.2.1 – CITYLAB Observatory of Strategic Developments Impacting Urban Logistics (2017)
48
Urban freight surveys collected in France during the 1990’s (Patier and Routhier, 2008) have
made explicit that the number of weekly movements (𝐶𝐶) generated by one economic establishment16 (e) is explained by its sectoral activity (a), its number of employees (o), and
the nature of its premises (p). Hence, the total number of movements 𝐶𝐶 in the zone z is:
𝑴𝑴 = ∑ 𝑴𝑴(𝑴,𝑴,𝑴)
𝑴∈𝑴
(𝑴).
The combination of these economic variables defines one typology of establishments heterogeneous in their “generation behaviours”. This classification is based on 116
categories 𝐶(𝐶, 𝐶, 𝐶).
Goods movements can also be categorized according to their transport characteristics: the vehicle class k used for the trip (vans, rigid or articulated trucks), the management mode m (third party logistics, own account transport shipper or own account transport consignee) and the type of routes r (direct or round trips):
𝐶𝐶 = ∑ 𝐶𝐶,𝐶 × ƒ𝐶,𝐶,𝐶
𝐶,𝐶,𝐶,𝐶
(𝐶) (3),
where ƒ𝐶,𝐶,𝐶 is the frequency of characteristics (𝐶, 𝐶, 𝐶) for the category ε and 𝐶𝐶,𝐶 is the
number of movements generated by the establishments of category ε in the zone z.
By knowing the volume of goods’ movements in each zone and their categorization, Freturb
then estimates the total number of trips in a zone z (tz) as:
𝐶𝐶 = 𝐶𝐶𝐶 + 𝐶𝐶𝐶 + 𝐶𝐶 (4),
where 𝐶𝐶𝐶 refers to the direct trips, 𝐶𝐶𝐶 to the starting and ending trips of one delivery
round and 𝐶𝐶 to the connecting trips of delivery rounds. The distance of each trip type is determined through geographical variables (distance to the centre of each zone, density of activity) and the characteristics (𝐶, 𝐶, 𝐶) of the establishments’ category ε.
Lastly, Freturb applies one typology of trips, defined by their vehicle class, their type, their management mode and their routes’ length. According to this 25 class categorization, the beginning of each τ-type trip which touches the zone 𝐶𝐶 matches the movement of τ-
type trips generated in 𝐶𝐶. The resulting distribution matrix for each vehicle class k is:
𝐶𝐶𝐶 = ∑[𝐶𝐶𝐶(𝐶)]
𝐶
(5).
Equation (5) defines one OD matrix for freight trips (made by vans or trucks) in a given urban area and provides the empirical material for the traffic assignment model. Obviously, the many flows behind this OD matrix can be decomposed across economic sectors, so that it is possible to isolate those originating from specific activities (e.g. logistics establishments).
The French SIRENE dataset is the best input data to estimate the generation and the distribution of freight flows in urban areas with Freturb17. It provides information on the
economic characteristics (𝐶, 𝐶, 𝐶) of the establishments in France, at the municipal level. Our dataset on the Paris region informs us about firms’ activities (a) and sizes (o), but we are ignorant about the establishments’ premises (p). Fortunately, it remains possible to feed Freturb with more basic local data thanks to Simetab (Gardrat et al., 2014).
16 A firm is a legal business entity that may be made of several establishments (i.e. locations). In what follows, we will use both terms interchangeably. 17 The SIRENE database describes every establishment in France, including the type of activity, the number of employees, the nature of the premises, their location. Every establishment in France has to be declared in this database when created. SIRENE therefore is not considered as a survey-based source.

CITYLAB – City Logistics in Living Laboratories
D.2.1 – CITYLAB Observatory of Strategic Developments Impacting Urban Logistics (2017)
49
Simetab allows adjusting the characteristics and the number of establishments observed in a
given zone according to the 𝐶 categories of firms. The model thus relies on a typology of urban spaces determined through social, economic and spatial characteristics available at the national level. The categorization assumes that each type of urban space presents its own economic structure and is associated with a distribution of the characteristics (𝐶, 𝐶, 𝐶). The underlying typology comes from the analyses of different SIRENE files, in different French metropolitan areas (Lyon, Bordeaux, Paris…) and for various years (Gardrat et al., 2014).
Using statistical classification methods on socioeconomic and geographical local information, Simetab first defines urban categories (highly residential, lower density area, high tertiary activity, commercial...) that differ in their economic structures. “Multiple discriminant analyses” are then applied to allocate each zone observed in the dataset to one urban type. The correction of establishments’ characteristics is made by comparing the economic structure of the zones to their typological counterparts. Therefore, Simetad makes it possible to “match” each firm observed in the dataset with a typology 𝐶(𝐶, 𝐶, 𝐶), thus insuring the operability of Freturb.
I.4.1.3 Finding the multi-class traffic equilibrium with TransCAD
The second modeling step aims at determining road traffic conditions (vehicle flows and speeds) in the Paris region using a standard multi-class traffic assignment model. All calculations presented in this research are performed with the TransCAD software.
Assignment models – also sometimes called “network models” – simulate the route choice behaviour of users on a transport network. Originally designed to determine the use of particular road infrastructures or of transit routes for a given time period (typically the morning or evening peak hours), they can also be used to derive the “shortest path” between any OD pair, and the corresponding travel time, distance and speed (Coulombel and Leurent, 2013). In our case, the assignment model is primarily used for later purpose, thus providing sound empirical material for the estimates of pollutant emissions caused by road traffic in the Paris region.
Road congestion generally plays a key role in traffic assignment models (Small and Verhoef, 2007; Ortuzar and Willumsen, 2011). As more individuals use the same road, it becomes congested and the travel time (the inverse of speed) increases. This phenomenon is often represented by a “volume-delay function” (VDF), also called “link congestion (or performance) function” (Akçelik, 1991; TRB, 2010). This technical relationship describes how does the service quality (the link travel time) evolve when the road demand (the flow of vehicles) increases? The most widespread VDF – used here – comes from the American Bureau of Public Roads (BPR, see TRB, 2010):
𝐶𝐶 = 𝐶𝐶𝐶 × (1 + α × (𝐶
𝐶)
𝐶
) (6),
where 𝐶𝐶 is the congested travel time on a given road segment, 𝐶𝐶𝐶 the free-flow travel time (when the road is “empty”, i.e. a function of the maximal-legal speed), 𝐶 the flow of
traffic and 𝐶 the link theoretical capacity (depending on the number and on the width of lanes). The congestion parameters α and 𝐶 (> 0) vary according to the characteristics of the
considered link (road type, geometry …), they describe the deviation of 𝐶𝐶 from 𝐶𝐶𝐶 when
the “flow-to-capacity ratio” (𝐶
𝐶) grows.
As congestion starts to build up and travel time increases, some drivers start to turn to alternative routes, which increases the traffic flow on the corresponding roads and decreases the travel speed therein. This phenomenon develops until a traffic equilibrium – called “Wardrop's equilibrium” – is reached (Small and Verhoef, 2007; Ortuzar and Willumsen,

CITYLAB – City Logistics in Living Laboratories
D.2.1 – CITYLAB Observatory of Strategic Developments Impacting Urban Logistics (2017)
50
2011). At the equilibrium, for any given OD pair, the “generalized cost” of travel of all alternative paths taken by users are equalized (the cost of unused paths being greater than this minimum cost), i.e. drivers do not have any incentive to select an alternative route.
In our model, the generalized cost of travel associated to a path p is given by:
𝐶𝐶𝐶𝐶 = 𝐶𝐶𝐶𝐶 × 𝐶𝐶𝐶 + 𝐶𝐶 × 𝐶𝐶 (7),
where the superscript k still characterizes the class of vehicles, the variables 𝐶𝐶𝐶 and 𝐶𝐶
denote the travel time and the length of path p respectively. The parameter 𝐶𝐶𝐶𝐶 is the
“value of travel time savings” of class k users and the parameter 𝐶𝐶 represents the monetary kilometric cost (including fuel, insurance, depreciation….).18
From (7), we understand that the route choice of drivers involves a trade-off between travel time and distance (thus monetary costs) (Small and Verhoef, 2007; Coulombel and Leurent, 2013). Accordingly, the path(s) with the minimum generalized cost would generally be neither the fastest nor the shortest, but rather a compromise between the two.
Thanks to the OD matrices for LRTs estimated with Simetab-Freturb, our model will comprise four user classes, discriminating both the type of trips and the type of vehicles: cars, vans, rigid trucks, and articulated trucks. Whereas the first class regroups all kinds of trips (commuting, leisure …) made by private cars, the last three classes are exclusively associated to LRTs. Importantly, each class is associated with different values of travel time and kilometric costs (see sub-section 3.3), so that route choices may differ from one class to another for a given OD. It is worth noting, however, that all vehicle classes travel on a given road-link at the same speed once the Wardrop’s equilibrium is reached.
Lastly, let us precise that each type of vehicle does not weigh the same in the congestion function (6) when working with a multi-class assignment model (Moridpour et al., 2015; Müller and Schiller, 2015):
𝐶 = ∑ 𝐶𝐶𝐶𝐶 × 𝐶𝐶
𝐶
(8).
Equation (8) expresses the total flow on the considered road segment (𝐶) into one common metric. Thus the “private cars equivalency factor” (𝐶𝐶𝐶𝐶) describes the amount of road space occupied by class k vehicles, as compared to one car. These coefficients allow accounting for the different congestion impacts of different vehicles classes (Webster and Elefteriadou, 1999; TRB, 2010).
I.4.1.4 Estimating pollutant emissions with Copcete
Copcete (Demeules and Larose, 2012) is based on the COPERT IV methodology (Ntziachristos et al., 2009), developed along successive European projects to facilitate the completion by Member States of “national emissions inventories” from road transport. It compiles emission factors obtained through laboratory experiments for various driving cycles representative of real traffic conditions (in terms of mean speeds, load rates, slopes of the roads), various vehicle classes, weights and technologies (Euro standards, differentiated by energy type) and various pollutants (officially regulated or not). The European Environment
18 Tolls are not included in equation (7) because almost all highways are free in the Paris region. There are exceptions, however, such as the A14 highway and a tunnel-section of the A86. Furthermore, while highways are otherwise free in the central parts of the Paris region, tolls are enforced in the most peripheral parts. Overall, the importance of tolls remains limited, hence the simplifying assumption.

CITYLAB – City Logistics in Living Laboratories
D.2.1 – CITYLAB Observatory of Strategic Developments Impacting Urban Logistics (2017)
51
Agency frequently updates and publishes this whole information in the form of “Emissions Guidebook”.19
Figure 2 – NOx emissions of diesel vehicles
Sources: authors’ elaboration from EEA (2016).
In this research, we consider only “exhaust emissions” from road traffic and we neglect those linked to the evaporation of pollutants. As illustrated on Figure 2 for nitrogen oxides (NOx), the unitary emissions proposed in Copcete depend greatly on the vehicle classes and on the engines’ technologies. For a given legal standard and a traffic speed of 15 km/h, trucks emit three times more NOx than (diesel) vans, themselves polluting twice more than (diesel) private cars. Also, the effect of technological changes is substantial. Considering one truck driving at 20 km/h, Euro 4 vehicles emit around three times less NOx per kilometer than Pre-Euro vehicles. Lastly, unitary emissions are not a linear function of traffic speed. Whereas the emission-speed relationship for cars, vans and “old” trucks is U-shaped and reaches its minimal value around 50-70 km/h, it is decreasing for Euro 4 trucks, especially at low traffic speeds.
Importantly, the unitary emissions of trucks are modelled in Copcete as a positive function of the roads’ slope and of the load rates of vehicles (the higher these parameters, the higher the energy consumption, thus the emissions). The COPERT IV methodology (Ntziachristos et al., 2009) also takes into account, for “small” vehicles (cars and vans), the over-emissions due to “cold-start phases”, i.e. when engines are not hot yet. From a theoretical point of view, the correction factor should depend on climatic conditions and on the share of distances driven at “non-stabilized regime” (a function of the number of stops). In practice, Copcete estimates the over-emissions based on the average trip distance (Demeules and Larose, 2012).
19 See: http://www.eea.europa.eu/publications/emep-eea-guidebook-2016

CITYLAB – City Logistics in Living Laboratories
D.2.1 – CITYLAB Observatory of Strategic Developments Impacting Urban Logistics (2017)
52
Feeding Copcete with the outcome of the traffic assignment model is straightforward because this software has been coded to estimate pollutant emissions at the road segment
level. Formally, the total emissions of pollutant j on the road-link s (𝐶𝐶𝐶𝐶𝐶𝐶) are calculated
as:
𝐶𝐶𝐶𝐶𝐶𝐶 = 𝐶𝐶 × ∑ ∑∅𝐶
𝐶 × 𝐶𝐶𝐶 × 𝐶𝐶
𝐶𝐶(𝐶𝐶)
𝐶𝐶
(9),
where 𝐶𝐶 describes the length of the road segment s (in kilometers), ∅𝐶𝐶 refers to the share
of vehicles using the technology x within the total flow 𝐶𝐶𝐶 of the vehicles class k, and
𝐶𝐶𝐶𝐶(𝐶𝐶) is the unitary emission factor of pollutant j (generally in g/km) for the class k
vehicles using the technology x, i.e. a function of the traffic speed (𝐶𝐶).20
Because Copcete is used here to assess the environmental impact of LRTs, we need information on the share of vans and trucks within total traffic, on a given road segment. Thanks to the combination of Freturb and TransCAD, we fortunately have this knowledge. Moreover, Copcete considers the precise composition of the French vehicles’ fleet for a given year, in terms of vehicles’ legal standards, energy types and weights.
I.4.2. Data
I.4.2.1 Socioeconomic data
The “Ile-de-France” (IdF) region is made of 1,300 municipalities distributed over 12,058 km2. For the purpose of this article, we also call it the Paris metropolitan area, although specific definitions of the latter exist. Accounting for 18% of the national population and for 30% of the French GDP in 2012, the Paris metro area is one of the wealthiest areas in Europe, but also one of the most heavily congested (Inrix, 2014).21 Concerns related to air pollution from road transport are of major interest to elected officials (Ile-de-France, 2016) and the population, as illustrated by the last waves of the Eurobarometer survey (EC, 2016).
In order to facilitate the presentation of input data and the interpretation of the results, we divide the Paris region according to the spatial classification proposed by the Quinet report (CGSP, 2013), i.e. the official guidelines for transport projects’ appraisals in France. We add to this categorization the city of Paris.22
Despite voluntary policies implemented in the 1960’s-70’s to decentralize population and economic activities within IdF (Shearmur and Alvergne, 2003), Figure 3 and Table 2 show that the metropolitan region remains mostly mono-centric, with population densities that decline quickly with respect to the distance to Paris. Whereas the city of Paris hosted 2.2 million individuals in 2012 and had a (very high) population density of 23,700 inh./km2, these figures were equal to 77,000 inhabitants and 28 inh./km2 respectively for “interurban areas”, i.e. rural municipalities on the average 62 km away from Paris centre.
Figure 3 – The Ile-de-France region
20 It is worth noting that Copcete differentiates traffic speed of small vehicles (cars and vans) and of large vehicles (trucks). 21 Around 60% of kilometers of delays registered in France are located in IdF (URF, 2013), where motorists spent in 2013 an average of 55.1 hours per year in traffic jams, only behind London and Stuttgart (INRIX, 2014). 22 We recognize that the terminology of urban areas may be misleading but we closely follow the one proposed by the Quinet report (CGSP, 2013).
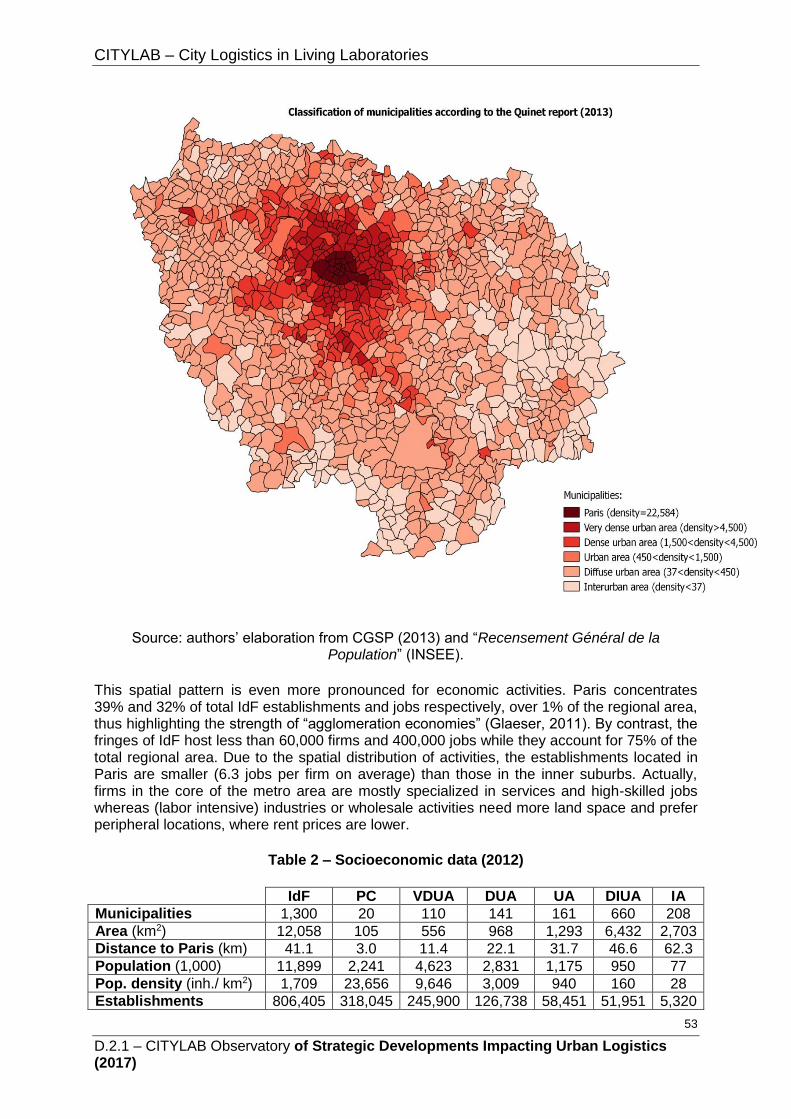
CITYLAB – City Logistics in Living Laboratories
D.2.1 – CITYLAB Observatory of Strategic Developments Impacting Urban Logistics (2017)
53
Source: authors’ elaboration from CGSP (2013) and “Recensement Général de la Population” (INSEE).
This spatial pattern is even more pronounced for economic activities. Paris concentrates 39% and 32% of total IdF establishments and jobs respectively, over 1% of the regional area, thus highlighting the strength of “agglomeration economies” (Glaeser, 2011). By contrast, the fringes of IdF host less than 60,000 firms and 400,000 jobs while they account for 75% of the total regional area. Due to the spatial distribution of activities, the establishments located in Paris are smaller (6.3 jobs per firm on average) than those in the inner suburbs. Actually, firms in the core of the metro area are mostly specialized in services and high-skilled jobs whereas (labor intensive) industries or wholesale activities need more land space and prefer peripheral locations, where rent prices are lower.
Table 2 – Socioeconomic data (2012)
IdF PC VDUA DUA UA DIUA IA
Municipalities 1,300 20 110 141 161 660 208
Area (km2) 12,058 105 556 968 1,293 6,432 2,703
Distance to Paris (km) 41.1 3.0 11.4 22.1 31.7 46.6 62.3
Population (1,000) 11,899 2,241 4,623 2,831 1,175 950 77
Pop. density (inh./ km2) 1,709 23,656 9,646 3,009 940 160 28
Establishments 806,405 318,045 245,900 126,738 58,451 51,951 5,320

CITYLAB – City Logistics in Living Laboratories
D.2.1 – CITYLAB Observatory of Strategic Developments Impacting Urban Logistics (2017)
54
Jobs (1,000) 5,949.2 1,900.2 2,074.6 1,106.6 485.5 362.3 20.0
Jobs density (jobs/ km2) 988 27,824 4,326 1,050 389 60 8
Estab. size (jobs/estab.) 5.4 6.3 7.8 7.8 7.2 4.9 2.4
Sources: areas and populations from “Recensement Général de la Population” (INSEE), economic activities from a partial “SIRENE” database (INSEE).
Notes: “PC” refers to Paris city, “VDUA” to very dense urban area, “DUA” to dense urban area, “UA” to urban area, “DIUA” to diffused urban area and “IA” to interurban area.
I.4.2.2 OD matrices
As explained previously, the economic dataset at our disposal is a “partial” SIRENE database. Whereas we have information on the number of establishments per municipality, on their sectoral classification and on their size, we are ignorant about the nature of their premises. As a consequence, we rely on the Simetab model to “match” each observed establishment with its typological counterpart. This enables us to feed the Freturb software with an estimated SIRENE database and to calculate the “generation coefficients” of the firms in IdF, as well as the transport characteristics of the freight operations. Table 3 illustrates the outcome of this first modeling exercise.
Table 3 – Characteristics of freight operations23
IdF PC VDUA DUA UA DIUA IA
Operations per estab. (/week) 6.3 4.9 6.6 7.5 8.8 7.1 5.1
Direct trips movements (%) 29.8 26.9 28.4 29.4 30.1 34.2 50.7
Third party operators movements (%) 41.2 40.2 41.4 41.7 44.1 39.7 31.1
Sources: authors’ calculations from Freturb and Simetab. Notes: “PC” refers to Paris city, “VDUA” to very dense urban area, “DUA” to dense urban
area, “UA” to urban area, “DIUA” to diffused urban area and “IA” to interurban area.
Each establishment emits and/or receives an average of 6.3 freight operations per week. Crossing this mean generation coefficient with the total number of establishment in the Paris region (800,000), we find an overall amount of 5.08 million freight operations per week. It appears that each establishment in central Paris generates fewer operations (4.9/week) as compared to suburban firms. This heterogeneity is due to the size of the firms (smaller in Paris) but also to their varying economic specialization (services emit and receive fewer goods than retailing, industries, or wholesale). Moreover, around 30% of freight movements are direct, with a higher share in interurban areas (50%) where consolidation is hardly possible. Lastly, around 40% of goods’ movements are operated by third party transport companies. Own account freight is slightly more represented in interurban areas (70%) because small firms (services for people, small retails) are more likely to make their deliveries and/or goods’ collections alone (Toilier et al., 2015).24
Table 4 – OD matrices for freight trips and private cars (2012)
Daily trips from:
PC VDUA DUA UA DIUA IA Total
PC 1,129,372
144,280 (11.7%)
495,943 74,516 (13.1%)
107,198 31,665 (22.8%)
28,178 15,990 (36.2%)
25,771 11,649 (31.1%)
1,272 630
(33.1%)
1,787,737 278,732 (13.5%)
23 An operation, or a movement, is either a delivery or a pick-up of freight. 24 Small retail, crafts and services are the categories with the highest proportion of own account transport, together with agriculture.
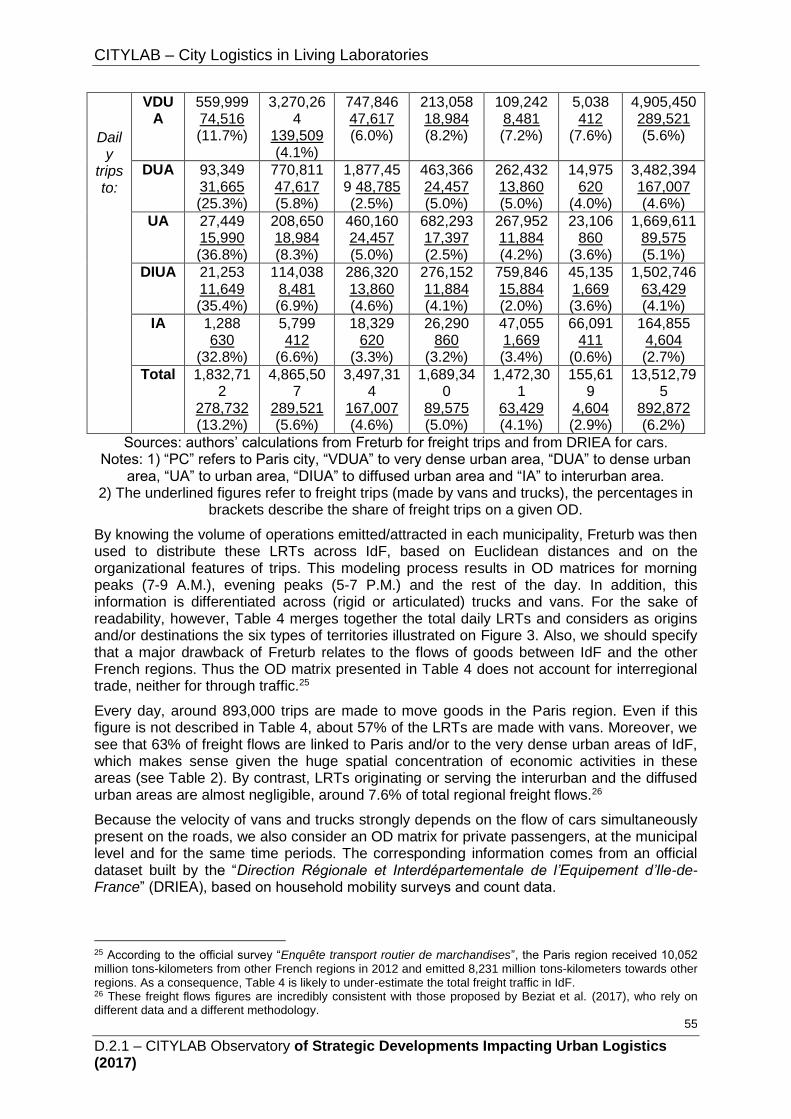
CITYLAB – City Logistics in Living Laboratories
D.2.1 – CITYLAB Observatory of Strategic Developments Impacting Urban Logistics (2017)
55
Daily
trips to:
VDUA
559,999 74,516 (11.7%)
3,270,264
139,509 (4.1%)
747,846 47,617 (6.0%)
213,058 18,984 (8.2%)
109,242 8,481 (7.2%)
5,038 412
(7.6%)
4,905,450 289,521 (5.6%)
DUA 93,349 31,665 (25.3%)
770,811 47,617 (5.8%)
1,877,459 48,785 (2.5%)
463,366 24,457 (5.0%)
262,432 13,860 (5.0%)
14,975 620
(4.0%)
3,482,394 167,007 (4.6%)
UA 27,449 15,990 (36.8%)
208,650 18,984 (8.3%)
460,160 24,457 (5.0%)
682,293 17,397 (2.5%)
267,952 11,884 (4.2%)
23,106 860
(3.6%)
1,669,611 89,575 (5.1%)
DIUA 21,253 11,649 (35.4%)
114,038 8,481 (6.9%)
286,320 13,860 (4.6%)
276,152 11,884 (4.1%)
759,846 15,884 (2.0%)
45,135 1,669 (3.6%)
1,502,746 63,429 (4.1%)
IA 1,288 630
(32.8%)
5,799 412
(6.6%)
18,329 620
(3.3%)
26,290 860
(3.2%)
47,055 1,669 (3.4%)
66,091 411
(0.6%)
164,855 4,604 (2.7%)
Total 1,832,712
278,732 (13.2%)
4,865,507
289,521 (5.6%)
3,497,314
167,007 (4.6%)
1,689,340
89,575 (5.0%)
1,472,301
63,429 (4.1%)
155,619
4,604 (2.9%)
13,512,795
892,872 (6.2%)
Sources: authors’ calculations from Freturb for freight trips and from DRIEA for cars. Notes: 1) “PC” refers to Paris city, “VDUA” to very dense urban area, “DUA” to dense urban
area, “UA” to urban area, “DIUA” to diffused urban area and “IA” to interurban area. 2) The underlined figures refer to freight trips (made by vans and trucks), the percentages in
brackets describe the share of freight trips on a given OD.
By knowing the volume of operations emitted/attracted in each municipality, Freturb was then used to distribute these LRTs across IdF, based on Euclidean distances and on the organizational features of trips. This modeling process results in OD matrices for morning peaks (7-9 A.M.), evening peaks (5-7 P.M.) and the rest of the day. In addition, this information is differentiated across (rigid or articulated) trucks and vans. For the sake of readability, however, Table 4 merges together the total daily LRTs and considers as origins and/or destinations the six types of territories illustrated on Figure 3. Also, we should specify that a major drawback of Freturb relates to the flows of goods between IdF and the other French regions. Thus the OD matrix presented in Table 4 does not account for interregional trade, neither for through traffic.25
Every day, around 893,000 trips are made to move goods in the Paris region. Even if this figure is not described in Table 4, about 57% of the LRTs are made with vans. Moreover, we see that 63% of freight flows are linked to Paris and/or to the very dense urban areas of IdF, which makes sense given the huge spatial concentration of economic activities in these areas (see Table 2). By contrast, LRTs originating or serving the interurban and the diffused urban areas are almost negligible, around 7.6% of total regional freight flows.26
Because the velocity of vans and trucks strongly depends on the flow of cars simultaneously present on the roads, we also consider an OD matrix for private passengers, at the municipal level and for the same time periods. The corresponding information comes from an official dataset built by the “Direction Régionale et Interdépartementale de l’Equipement d’Ile-de-France” (DRIEA), based on household mobility surveys and count data.
25 According to the official survey “Enquête transport routier de marchandises”, the Paris region received 10,052 million tons-kilometers from other French regions in 2012 and emitted 8,231 million tons-kilometers towards other regions. As a consequence, Table 4 is likely to under-estimate the total freight traffic in IdF. 26 These freight flows figures are incredibly consistent with those proposed by Beziat et al. (2017), who rely on different data and a different methodology.

CITYLAB – City Logistics in Living Laboratories
D.2.1 – CITYLAB Observatory of Strategic Developments Impacting Urban Logistics (2017)
56
Table 4 shows that private passengers make around 13.5 million trips by car every day in the Paris region. Put differently, LRTs account for 6.2% of daily motorized trips in IdF. As compared to freight flows, car trips having dense urban areas, urban areas and diffused urban areas as origins and/or destinations are substantial (49% of total passenger trips). In addition, the share of individual trips made by cars and related to Paris is only 11%. This is consistent with the high performances of public transport networks in the core of the Paris metro area. Lastly, freight vehicles account for 30% of total trips on ODs linking Paris to outer suburbs.
I.4.2.3 Road network and traffic data
The knowledge of OD matrices for private passengers and LRTs is useful to estimate pollutant emissions only once combined with road capacities. Since different roads permit different maximal speeds and, a different number of lanes, and are used by different volumes of vehicles, one important ingredient for the traffic assignment model relates to the capacities of the road infrastructures. We here rely on the stock of roads modelled by the DRIEA in 2008.
Table 5 shows that this network is made of 39,420 segments, whose total length is about 20,500 km. As mapped on Figure 4, the network is strongly radial, yet with three concentric bypasses. It encompasses the most important roads in IdF but it does not include small streets in cities or rural roads in outer suburbs. In spite of this shortcoming, we see that the road density – a proxy of the infrastructures’ supply - declines with respect to the urban centre (from 10 km of roads/km2 in central Paris to 1 km of roads/km2 in interurban areas). By contrast, the maximal (legal) speeds are higher in peripheral areas (63 km/h in diffused areas vs. 44 km/h in Paris). Lastly, the average figures for the theoretical capacities presented in Table 5 are biased for Paris. Because the ring-road (i.e. the biggest urban highway in Europe) belongs here to the municipality of Paris, the corresponding supply of roads automatically increases. On the average, each kilometer of roads in IdF could receive a flow of 1,700 vehicles per hour.
Table 5 – Characteristics of the road network
IdF PC VDUA DUA UA DIUA IA
Road segments 39,420 4,688 10,959 10,184 6,370 6,406 813
Total roads’ length (km) 20,480 1,033 3,220 3,479 2,990 7,554 2,204
Road density (km/km2) 1.7 9.8 5.8 3.6 2.3 1.2 0.8
Maximal speed (km/h) 58.2 43.7 54.8 61.4 64.1 63.3 62.6
Theoretical capacities (veh./h) 1,709 2,121 1,702 1,564 1,660 1,701 1,705
Sources: authors’ calculations from DRIEA and TransCAD. Notes: “PC” refers to Paris city, “VDUA” to very dense urban area, “DUA” to dense urban
area, “UA” to urban area, “DIUA” to diffused urban area and “IA” to interurban area.
Figure 4 – Road network for the Paris region

CITYLAB – City Logistics in Living Laboratories
D.2.1 – CITYLAB Observatory of Strategic Developments Impacting Urban Logistics (2017)
57
Source: authors’ elaboration with TransCAD, from DRIEA.
As explained in sub-section 2.3, the traffic assignment model is based on individuals’ trade-offs between travel time and monetary costs. To determine the generalized cost of trips (see equation (7)), we thus need parameters that describe the usage costs of vehicles27, their individuals’ occupancy and their load weight, and the values of travel time savings (for passengers, professional drivers and goods). Table 6 lists the values used for computations as well as the PCE factors (reflecting the road space occupied by vans and trucks as compared to one private car, see equation (8)).
Table 6 – Costs and technical parameters
Cars Vans Trucks
Monetary costs (euro/km) 0.271 0.365 0.842
Vehicle occupancy (ind./veh.) 1.3 1.0 1.0
Time value of individuals (euros/h) 10.7 9.8 9.8
Load weight (tons/veh.) 0.0 0.294 1.941
Time value of goods (euro/ton/h) 0.0 0.6 0.6
Private car equivalency factor 1.0 1.5 2.0-2.5
Sources: Beziat et al. (2017). Note: we consider a PCE factor of 2 is for rigid trucks and a value of 2.5 for articulated
trucks.
27 For the sake of simplicity, we consider constant energy costs whereas Copcete would allow endogeneizing them according to traffic speed and the consumption of diesel or gasoline.

CITYLAB – City Logistics in Living Laboratories
D.2.1 – CITYLAB Observatory of Strategic Developments Impacting Urban Logistics (2017)
58
Thanks to this complete set of data, the TransCAD software was used to determine the equilibrium assignment over the regional road network. This second modeling step informs us about traffic flows and vehicle speeds at the road segment level. Table 7 presents weighted averages (for morning and evening peaks, off-peaks). The mean flow of cars on one kilometer of road in IdF is 376 vehicles per hour. By contrast, the average flow of freight vehicles is equal to 41 vehicles per hour (22 vans/hour and 19 trucks/hour).28 Considering the PCE factors and the theoretical road capacities, we deduce one average “flow-to-capacity ratio” of 0.24. This intersection between roads demand and supply implies one mean travel speed of 49.6 km/h. Recall that our multi-class assignment model does not allow differentiating the velocity across vehicles’ classes.
Table 7 – Results of the traffic assignment model
IdF PC VDUA DUA UA DIUA IA
Flow of cars (veh./h) 376 589 434 337 322 262 189
Flow of vans (veh./h) 22 65 28 16 12 7 2
Flow of trucks (veh./h) 19 47 22 14 12 7 2
Flow-to-capacity ratio 0.24 0.35 0.29 0.24 0.20 0.16 0.10
Speed of vehicles (km/h) 49.6 31.0 42.2 49.1 56.6 66.5 73.8
Sources: authors’ calculations from TransCAD. Notes: “PC” refers to Paris city, “VDUA” to very dense urban area, “DUA” to dense urban
area, “UA” to urban area, “DIUA” to diffused urban area and “IA” to interurban area.
When looking at territorial differences (see Figure 5 for a map of the network’s usage during the morning peaks), we observe a clear relationship between population densities, traffic flows and travel speeds. The Parisian roads are the most heavily used (701 veh/h), implying the lowest average speed (31 km/h). At the other extreme, mean flows are smaller in diffused or interurban areas and traffic speeds are twice higher (66-73 km/h). For what concerns freight vehicles, we see that vans are more intensively used than trucks in the central areas of IdF. In outer suburbs, both types of vehicles are equally used.
Figure 5 – Usage of the road network in the morning peaks
28 Adding vans and trucks flows, we find that freight vehicles account for 10.3% of the total traffic flow. This higher share of LRT as compared to the 6.2% figure presented in Table 4 comes from the average distance traveled by freight vehicles: 16.9 km vs. 11.7km for private cars.

CITYLAB – City Logistics in Living Laboratories
D.2.1 – CITYLAB Observatory of Strategic Developments Impacting Urban Logistics (2017)
59
Source: authors’ elaboration with TransCAD.
The results of the traffic assignment model can also be aggregated by summing the distances travelled by each vehicle class, within each macro-zone (see Table 8). Doing so, we find that around 155 million vehicle*kilometers (vkm) are travelled daily in IdF. The city of Paris concentrates 11% of motorized mobility whereas the fringes of the metropolitan region account for 30% of travelled distances, despite low population and jobs densities. In addition, LRTs make up around 8% of total driven kilometers. However, these average figures hide heterogeneous patterns. Thus vans and trucks are responsible for 16% of travelled distances in the French capital city while they account for a low 2.6% in interurban areas, where cars are more preeminent. This difference is explained by higher jobs per capita ratios in dense areas, explaining the intensity of freight transport vs. passenger transport.
Table 8 – Aggregated results
IdF PC VDUA DUA UA DIUA IA
Total vkm (M/day) 154.5 16.5 37.0 30.9 23.8 38.8 7.6
Share in total vkm (%) 100.0 10.7 23.9 20.0 15.4 25.1 4.9
Freight vkm by vans (M/day) 6.4 1.5 2.0 1.3 0.7 0.8 0.1
Freight vkm by trucks (M/day) 5.7 1.1 1.7 1.2 0.8 0.9 0.1
Private passengers vkm (M/day) 142.4 13.9 33.3 28.4 22.3 37.1 7.4
Share of freight (%) 7.8 15.8 10.0 8.1 6.3 4.4 2.6

CITYLAB – City Logistics in Living Laboratories
D.2.1 – CITYLAB Observatory of Strategic Developments Impacting Urban Logistics (2017)
60
Sources: authors’ calculations from TransCAD. Notes: “PC” refers to Paris city, “VDUA” to very dense urban area, “DUA” to dense urban
area, “UA” to urban area, “DIUA” to diffused urban area and “IA” to interurban area.
I.4.2.4 Pollutants and vehicle fleet
The combustion of gasoline or diesel to power the vehicles’ engines implies the emission in the atmosphere of various pollutants. Whereas Copcete allows estimating exhaust emissions for a huge variety of pollutants (30, see the complete list in Demeules and Larose, 2012), we restrain our analysis to carbon dioxide (CO2), carbon monoxide (CO), fine particulate matter (PM10), nitrogen oxides (NOx) and non-methane volatile organic compounds (NMVOC). Apart from CO2, which contributes to global warming and whose socioeconomic impacts are worldwide (Tol, 2009), even if unevenly distributed, the other pollutants generate various diseases (cardio-vascular or respiratory in particular) to the exposed (local) populations (Kampa and Castanas, 2008; Ricardo-AEA, 2014; WHO, 2016).
Table 9 – Pollutants under study
Pollutant
Share of regional emissions due to
road transport (2010)
2012 emission factors at 50 km/h (g/km)
2012 emission factors at 30 km/h (g/km)
Cars Vans Trucks Cars Vans Trucks
CO2 29% 166.22 212.99 733.67 201.13 276.67 933.02
CO 56% 1.31 0.37 1.30 1.11 0.58 1.80
NOx 55% 0.50 0.79 4.97 0.61 0.99 6.97
PM10 25% 0.07 0.09 0.64 0.07 0.10 0.67
NMVOC 16% 0.11 0.07 0.10 0.13 0.09 0.18
Sources: Airparif (2013) and authors’ calculations from Copcete. Notes: emission factors are based on a roads’ slope of 0°, on a load rate of 50% for trucks
and on an average distance of 6 km (for the over-emissions due to “cold-start phases”).
As illustrated in Table 9, road transport is responsible for a rather significant share of the total pollutant emissions. Cars, vans and trucks traffic emit the majority of CO and NOx in IdF, as well as 25% of the whole PM10.29 In addition, it seems particularly relevant to assess the environmental impact of LRTs because the average emission factors of vans and trucks are generally larger than those of cars, except for CO and NMVOC. The emission figures proposed in Table 9 have been calculated with Copcete considering traffic speeds of 30 km/h (typical of central Paris, see Table 7) and of 50 km/h (in suburbs). In most cases, it is clear that slow vehicles pollute more (André and Hammarstrom, 2000). Remind that we ignore here the emissions linked to the evaporation of pollutants.
Copcete considers the detailed structure of the vehicles’ fleet in France, from 1990 to 2030, based on the analyses and projections of one large scale annual survey (“Enquête Parc Auto – IFSTTAR”). Three comments are required before discussing Table 10. First, the reported percentages do no not refer to the share of cars, trucks or vans complying with the different Euro standards, but rather to the share of the total distances travelled with these different vehicles. Second, Copcete also provides detailed information on the weights’ distribution of each vehicle class. For the sake of readability, Table 10 aggregates the weight categories
29 The 16% figure proposed for NMVOC integrates the emissions caused by motorized two-wheelers, the prime source of emission for this pollutant (Airparif, 2013). Moreover, we must specify that Copcete does not allow estimating PM below 10 micrometers. As a consequence, PM2.5 and PM1 are considered into PM10.

CITYLAB – City Logistics in Living Laboratories
D.2.1 – CITYLAB Observatory of Strategic Developments Impacting Urban Logistics (2017)
61
but we shall use the disaggregated information for estimates.30 Third, we should ideally work with the actual vehicle fleet in the Paris region. Because this information is hardly available, we rely on the composition proposed at the national level, thus neglecting any potential regional specificity in that dimension (see Carteret et al., 2015).
Table 10 – 2012 vehicle fleet distribution (in % of travelled distances)
Cars Vans Trucks
Gasoline Diesel Others Gasoline Diesel Diesel
Pre-Euro 1.9% 1.3% - 0.2% 2.1% 0.2%
Euro 1 2.6% 3.1% - 0.1% 3.6% 0.6%
Euro 2 5.4% 6.3% - 0.2% 7.0% 7.9%
Euro 3 4.4% 19.9% - 0.2% 23.5% 23.6%
Euro 4 7.7% 28.1% - 0.2% 38.7% 33.6%
Euro 5 3.7% 15.1% - 0.1% 24.1% 34.1%
Total 25.7% 73.8% 0.5% 1.0% 99.0% 100%
Sources: Copcete and “Enquête Parc Auto – IFSTTAR”.
The fleet’s structure shows that diesel vehicles make up the huge majority of kilometers driven in France. This specificity can be explained by the national tax system that favored, until recently, diesel fuels (Mayeres and Proost, 2001; Santos, 2017). Above all, Euro 2 or older vehicles account for no more than 12.5% of the fleet in 2012, with a low share of 8.7% for trucks. For freight vehicles, the most recent technologies (Euro 4 or 5) are the most represented. Let us precise that next calculations for trucks rely on a constant load rate of 50% and on a road slope of 0°. Also, the estimates of over-emissions due to “cold-start phases” are based on an average trips distance of 6 km.
It is worth noting that Copcete does not operate for all traffic speeds (Demeules and Larose, 2012). Car and van emissions can be estimated only for speeds ranging from 10 km/h to 130 km/h. For trucks, the range is 12-86 km/h. As a consequence, the traffic speeds given by the traffic assignment model were adjusted to feed Copcete. Table 11 illustrates that changes were not that important, except for trucks in very diffused urban areas (these areas accounting, however, for a small fraction of total observations).
Table 11 – Corrections of vehicle speeds for Copcete
IdF PC VDUA DUA UA DIUA IA
Speed of vehicles - TransCAD (km/h) 49.6 31.0 42.2 49.1 56.6 66.5 73.8
Speed of cars and vans - Copcete (veh./h)
49.6 31.1 42.2 49.1 56.6 66.5 73.8
Share of corrected observations (%) 0.4 1.2 0.7 0.4 0.1 0.6 0.0
Speed of trucks - Copcete (veh./h) 48.3 31.1 41.9 48.1 54.5 63.3 69.7
Share of corrected observations (%) 6.1 2.0 1.4 2.9 6.2 18.1 36.4
Sources: authors’ calculations.
30 In the same type of ideas, we do not differentiate rigid and articulated trucks in Table 10 whereas Copcete will do so for the calculations presented in the next section.
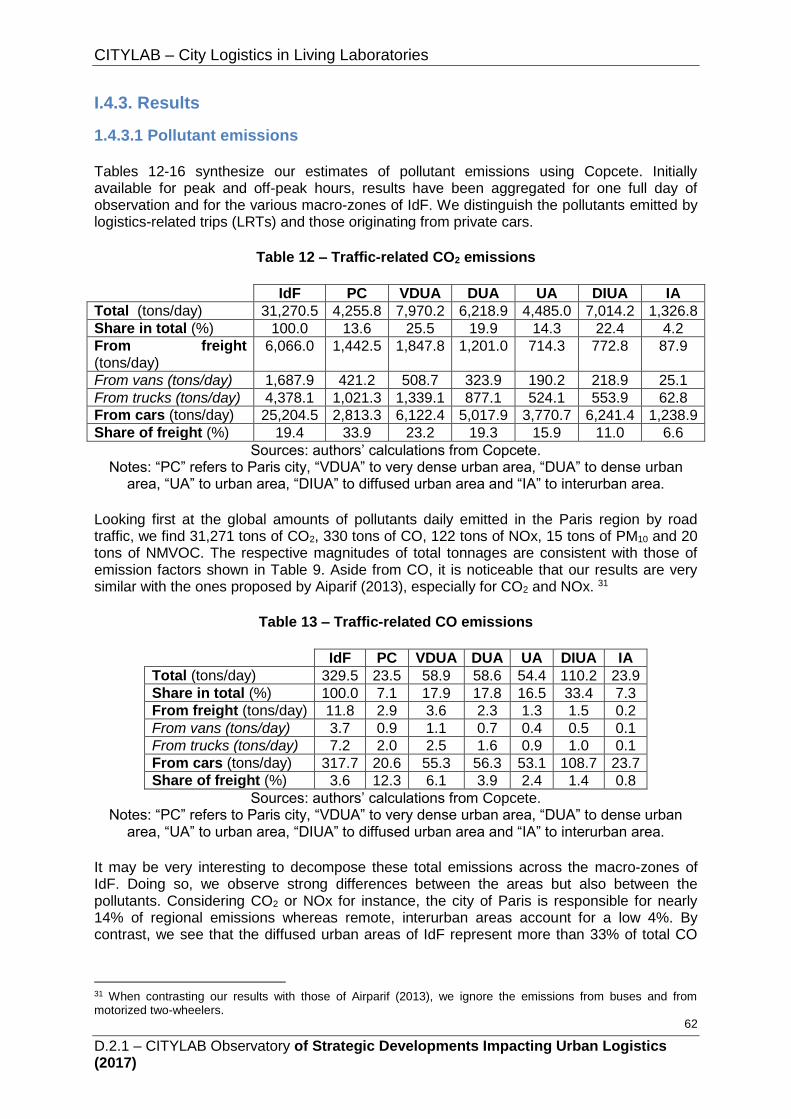
CITYLAB – City Logistics in Living Laboratories
D.2.1 – CITYLAB Observatory of Strategic Developments Impacting Urban Logistics (2017)
62
I.4.3. Results
1.4.3.1 Pollutant emissions
Tables 12-16 synthesize our estimates of pollutant emissions using Copcete. Initially available for peak and off-peak hours, results have been aggregated for one full day of observation and for the various macro-zones of IdF. We distinguish the pollutants emitted by logistics-related trips (LRTs) and those originating from private cars.
Table 12 – Traffic-related CO2 emissions
IdF PC VDUA DUA UA DIUA IA
Total (tons/day) 31,270.5 4,255.8 7,970.2 6,218.9 4,485.0 7,014.2 1,326.8
Share in total (%) 100.0 13.6 25.5 19.9 14.3 22.4 4.2
From freight (tons/day)
6,066.0 1,442.5 1,847.8 1,201.0 714.3 772.8 87.9
From vans (tons/day) 1,687.9 421.2 508.7 323.9 190.2 218.9 25.1
From trucks (tons/day) 4,378.1 1,021.3 1,339.1 877.1 524.1 553.9 62.8
From cars (tons/day) 25,204.5 2,813.3 6,122.4 5,017.9 3,770.7 6,241.4 1,238.9
Share of freight (%) 19.4 33.9 23.2 19.3 15.9 11.0 6.6
Sources: authors’ calculations from Copcete. Notes: “PC” refers to Paris city, “VDUA” to very dense urban area, “DUA” to dense urban
area, “UA” to urban area, “DIUA” to diffused urban area and “IA” to interurban area.
Looking first at the global amounts of pollutants daily emitted in the Paris region by road traffic, we find 31,271 tons of CO2, 330 tons of CO, 122 tons of NOx, 15 tons of PM10 and 20 tons of NMVOC. The respective magnitudes of total tonnages are consistent with those of emission factors shown in Table 9. Aside from CO, it is noticeable that our results are very similar with the ones proposed by Aiparif (2013), especially for CO2 and NOx. 31
Table 13 – Traffic-related CO emissions
IdF PC VDUA DUA UA DIUA IA
Total (tons/day) 329.5 23.5 58.9 58.6 54.4 110.2 23.9
Share in total (%) 100.0 7.1 17.9 17.8 16.5 33.4 7.3
From freight (tons/day) 11.8 2.9 3.6 2.3 1.3 1.5 0.2
From vans (tons/day) 3.7 0.9 1.1 0.7 0.4 0.5 0.1
From trucks (tons/day) 7.2 2.0 2.5 1.6 0.9 1.0 0.1
From cars (tons/day) 317.7 20.6 55.3 56.3 53.1 108.7 23.7
Share of freight (%) 3.6 12.3 6.1 3.9 2.4 1.4 0.8
Sources: authors’ calculations from Copcete. Notes: “PC” refers to Paris city, “VDUA” to very dense urban area, “DUA” to dense urban
area, “UA” to urban area, “DIUA” to diffused urban area and “IA” to interurban area.
It may be very interesting to decompose these total emissions across the macro-zones of IdF. Doing so, we observe strong differences between the areas but also between the pollutants. Considering CO2 or NOx for instance, the city of Paris is responsible for nearly 14% of regional emissions whereas remote, interurban areas account for a low 4%. By contrast, we see that the diffused urban areas of IdF represent more than 33% of total CO
31 When contrasting our results with those of Airparif (2013), we ignore the emissions from buses and from motorized two-wheelers.

CITYLAB – City Logistics in Living Laboratories
D.2.1 – CITYLAB Observatory of Strategic Developments Impacting Urban Logistics (2017)
63
emissions. These results are probably linked to the spatial differences in traffic speeds (see Tables 7 and 11) since vehicles’ velocity determines the emission factors.
Table 14 – Traffic-related NOx emissions
IdF PC VDUA DUA UA DIUA IA
Total (tons/day) 122.5 17.5 30.5 23.7 17.5 27.9 5.4
Share in total (%) 100.0 14.3 24.9 19.3 14.3 22.8 4.4
From freight (tons/day) 35.9 9.0 11.1 7.0 4.1 4.2 0.5
From vans (tons/day) 5.9 1.5 1.8 1.1 0.7 0.7 0.1
From trucks (tons/day) 30.0 7.5 9.3 5.9 3.4 3.5 0.4
From cars (tons/day) 86.6 8.5 19.4 16.7 13.4 23.7 4.9
Share of freight (%) 29.3 51.4 36.4 29.5 23.4 15.1 9.3
Sources: authors’ calculations from Copcete. Notes: “PC” refers to Paris city, “VDUA” to very dense urban area, “DUA” to dense urban
area, “UA” to urban area, “DIUA” to diffused urban area and “IA” to interurban area.
In order to further investigate this issue, one can propose a spatial indicator of “emissions’ intensity” by dividing - for a considered pollutant - the share of regional emissions from a given zone with the corresponding share in total traffic (Table 8). As made clear in Table 17, this indicator is generally decreasing with respect to the population density, except for CO. Put differently: the urban areas characterized by a high concentration of individuals and low traffic speeds are responsible for a share of regional emissions more than proportional than the volume of road traffic they receive.
The proposed methodology enables us to isolate the pollutant emissions caused by LRTs. We conclude that vans and trucks account for 20-30% of CO2, NOx and PM10 emitted in the Paris region. By contrast, freight vehicles are responsible for a reduced share of CO and NMVOC emissions (4% and 6% respectively). Once again, these varying environmental impacts of LRTs are consistent with the emissions factors presented in Table 9. Note also that trucks pollute systematically more than vans whereas they account for 43% of the total freight trips presented in the OD matrix (Table 4) and 47% of the distances travelled with freight vehicles.32
Table 15 – Traffic-related PM10 emissions
IdF PC VDUA DUA UA DIUA IA
Total (tons/day) 14.82 1.92 3.73 2.97 2.19 3.39 0.62
Share in total (%) 100.0 13.0 25.2 20.0 14.8 22.9 4.2
From freight (tons/day) 4.38 0.89 1.31 0.90 0.57 0.64 0.07
From vans (tons/day) 0.67 0.15 0.20 0.13 0.08 0.10 0.01
From trucks (tons/day) 3.71 0.74 1.11 0.77 0.49 0.54 0.06
From cars (tons/day) 10.44 1.03 2.42 2.07 1.62 2.75 0.55
Share of freight (%) 29.6 46.4 35.1 30.3 26.0 18.9 11.3
Sources: authors’ calculations from Copcete. Notes: “PC” refers to Paris city, “VDUA” to very dense urban area, “DUA” to dense urban
area, “UA” to urban area, “DIUA” to diffused urban area and “IA” to interurban area.
Table 16 – Traffic-related NMVOC emissions
IdF PC VDUA DUA UA DIUA IA
32 This conclusion may be moderated if one considers ton-kilometer measures instead of traveled distances as the relevant indicator of freight activities.

CITYLAB – City Logistics in Living Laboratories
D.2.1 – CITYLAB Observatory of Strategic Developments Impacting Urban Logistics (2017)
64
Total (tons/day) 20.30 2.36 4.78 3.94 3.02 5.16 1.04
Share in total (%) 100.0 11.6 23.5 19.4 14.9 25.4 5.1
From freight (tons/day) 1.26 0.34 0.39 0.24 0.13 0.14 0.02
From vans (tons/day) 0.52 0.14 0.16 0.10 0.05 0.06 0.01
From trucks (tons/day) 0.74 0.20 0.23 0.14 0.08 0.08 0.01
From cars (tons/day) 19.04 2.02 4.39 3.70 2.89 5.02 1.02
Share of freight (%) 6.2 14.4 8.2 6.1 4.3 2.7 1.9
Sources: authors’ calculations from Copcete. Notes: “PC” refers to Paris city, “VDUA” to very dense urban area, “DUA” to dense urban
area, “UA” to urban area, “DIUA” to diffused urban area and “IA” to interurban area.
From a spatial perspective, the share of emissions caused by LRTs is highly heterogeneous. While representing approximately half of total NOx and PM10 tonnages emitted in the city of Paris, vans and trucks circulating in the fringes of IdF generate a much smaller share of these emissions. In these areas, they emit a very small fraction of NMVOC and CO (respectively 4.6% and 2.2% of total emissions in diffused urban areas and in interurban areas). These different influences are confirmed by the second indicator of emissions’ intensity that focuses only on freight vehicles. As made clear in Table 17, the share of NMVOC and CO emitted by vans and trucks within total emissions is fewer than the share of distances made with these vehicles, whatever the macro-zone considered. By contrast, CO2, NOx and PM10 emissions originating from LRTs are at least 2.5 more important than their traffic share.
Table 17 – Indicator of emissions’ intensity
PC VDUA DUA UA DIUA IA
All traffic 1.27 1.07 1.00 0.93 0.89 0.86
Freight 2.15 2.32 2.38 2.52 2.50 2.53
All traffic 0.66 0.75 0.89 1.07 1.33 1.49
Freight 0.78 0.61 0.48 0.38 0.32 0.31
All traffic 1.34 1.04 0.97 0.93 0.91 0.90
Freight 3.25 3.64 3.64 3.71 3.41 3.58
All traffic 1.21 1.05 1.00 0.96 0.91 0.86
Freight 2.94 3.51 3.74 4.13 4.30 4.35
All traffic 1.08 0.98 0.97 0.97 1.01 0.86
Freight 0.91 0.82 0.75 0.68 0.61 0.73
Sources: authors’ calculations. Notes: “PC” refers to Paris city, “VDUA” to very dense urban area, “DUA” to dense urban
area, “UA” to urban area, “DIUA” to diffused urban area and “IA” to interurban area.
1.4.3.2 Exposure to local pollutants
Road transport is not the only determinant of air quality in IdF (see Table 9 and Airparif, 2013). The concentration of local pollutants in the atmosphere depends on other emissions’ sources (residential or commercial buildings, industries…), located either in the Paris metropolitan area or in other French regions. This is also a function of climatic conditions (temperature, wind) and of the urban topography (buildings’ height and materials), these two factors affecting the dispersion of the pollutants (Moussiopoulos et al., 1996; Di Sabatino et al., 2007). Moreover, the exposure of the individuals varies greatly with respect to the distance from the emission point (the roads in the case of traffic-related emissions) and to the share of the daily time spent outdoor (Karner et al., 2010; Airparif, 2012). Therefore, a

CITYLAB – City Logistics in Living Laboratories
D.2.1 – CITYLAB Observatory of Strategic Developments Impacting Urban Logistics (2017)
65
detailed impact assessment would require additional (and complex) modeling exercises, out of the scope of this research.
To put our results in perspective, we can nevertheless propose a simplified indicator of exposure to local pollutants. We do not look at CO2 emissions, because they impact the world and not IdF only. Moreover we consider jointly the emissions from private cars and
from LRTs. For each pollutant j, the exposure indicator (𝐶𝐶𝐶𝐶𝐶) in the macro-zone z is
calculated as:
𝐶𝐶𝐶𝐶𝐶 =
(𝐶𝐶𝐶𝐶𝐶
𝐶𝐶𝐶𝐶𝐶𝐶 × 𝐶𝐶𝐶𝐶𝐶⁄ )
(𝐶𝐶𝐶𝐶𝐶𝐶𝐶
𝐶𝐶𝐶𝐶𝐶𝐶𝐶𝐶 × 𝐶𝐶𝐶𝐶𝐶𝐶𝐶⁄ )
(10),
where 𝐶𝐶𝐶𝐶𝐶 describes the number of individuals living in one km2 of the zone z, 𝐶𝐶𝐶𝐶𝐶𝐶
is the density of roads on that territory (km/km2) and 𝐶𝐶𝐶𝐶𝐶 corresponds to the volume of
pollutant j daily emitted on one km of infrastructures. The terms in the denominator are the corresponding regional averages so that we are producing a “normalized” indicator.
Table 18 presents the results. In a highly hypothetical world – where road traffic would be the only source of emissions and where pollutants would not displace spatially – we see that each ton of CO emitted in central Paris harms 2.6 more individuals as compared to the same ton emitted in an “average” place of IdF. At the other extreme, pollutants in interurban areas disturb around 10 times fewer individuals than in the regional average case. Whatever the local pollutant considered, the threshold lies between the dense urban areas (above the mean value for IdF) and the urban areas (below). In addition, this indicator of exposure is not monotonic because higher values are found for very dense urban areas as compared to central Paris for NOx and PM10. Lastly, it appears that the spatial differences in exposure to CO are larger than those for other pollutants.
Table 18 – Indicators of exposure to local pollutants emitted by both private cars and freight vehicles (normalized w.r.t. regional averages)
PC VDUA DUA UA DIUA IA
Exposure to CO 2.64 2.17 1.34 0.60 0.24 0.09
Exposure to NOx 1.32 1.56 1.23 0.69 0.35 0.15
Exposure to PM10 1.45 1.55 1.19 0.67 0.35 0.15
Exposure to NMVOC 1.62 1.65 1.22 0.66 0.31 0.13
Sources: authors’ calculations. Notes: “PC” refers to Paris city, “VDUA” to very dense urban area, “DUA” to dense urban
area, “UA” to urban area, “DIUA” to diffused urban area and “IA” to interurban area.
Obviously, this simple indicator requires refinements, notably by considering the precise locations of households relatively to the road infrastructures or the differences between cities of residence and jobs. Despite these shortcomings, we believe it provides a first picture on the heterogeneous exposure to (and impacts of) local pollutants in the Paris region.
1.4.3.3 Social costs of air pollution
Local pollutants are costly for society because exposed individuals are more likely to face various health problems (and reductions in life expectancy), inducing potential earnings’ losses for households and hospital expenditures for society (Ricardo-AEA, 2014; WHO, 2016). They also imply agricultural losses and buildings’ deteriorations (Butlin, 1990; Wahid et al., 1995). Since road users rarely pay specific taxes aimed at covering these damages

CITYLAB – City Logistics in Living Laboratories
D.2.1 – CITYLAB Observatory of Strategic Developments Impacting Urban Logistics (2017)
66
(Santos, 2017), economists generally refer to “external costs” of air pollution. A large literature proposes parameters to translate the emissions of local pollutants from road traffic, and their corresponding damages, into monetary values (CGSP, 2013; Ricardo-AEA, 2014).
We conclude this research by calculating the social costs of air pollution caused by road traffic in the Paris region, isolating the social costs of LRTs. Parameters used for computations come from the Quinet report (CGSP, 2013), initially estimated on the basis of the COPERT IV methodology.33 Table 19 shows that diesel vehicles are more costly for society than gasoline ones, due to larger emissions of local pollutants. Moreover, the marginal external costs are clearly increasing with respect to the density of exposed population. Finally, freight vehicles are more costly than private cars, especially trucks.
Table 19 – External costs of air pollution
PC/VDUA DUA UA DIUA IA
Gasoline cars (euros/100 vkm) 4.137 1.195 0.552 0.460 0.460
Diesel cars (euros/100 vkm) 18.754 5.056 2.022 1.471 1.011
Gasoline vans (euros/100 vkm) 5.792 1.747 0.827 0.735 0.735
Diesel vans (euros/100 vkm) 30.980 8.366 3.218 2.298 1.471
Trucks (euros/100 vkm) 171.541 34.014 16.272 8.641 5.884
Sources: authors’ calculations from CGSP (2013). Notes: “PC” refers to Paris city, “VDUA” to very dense urban area, “DUA” to dense urban
area, “UA” to urban area, “DIUA” to diffused urban area and “IA” to interurban area.
By crossing these costs parameters with the vkm figures presented in Table 8, we conclude that emissions of local pollutants linked to road traffic represent social losses for the Paris region valued at 15.8 million euros/day. One other way to express this cost is to consider the population number in IdF (11.9 million in 2012, see Table 2). In that case, the social cost amounts to 1.3 euros per capita per day. Lastly, we can transpose the 15.8 million euros to a full year. Doing so, the total environmental losses linked to emissions from cars and LRTs (5,767 million euros) correspond to 0.94% of the regional GDP (612,323 million euros in 2012). This figure belongs to the upper-bound of estimates found for European countries (de Palma and Zaouali, 2007). Since the Paris region is denser, our results seem consistent.
Our methodology makes it possible to decompose the social cost of local pollution between areas and vehicle classes. From a spatial point of view, we see that the city of Paris and the very dense urban areas of IdF concentrate more than 80% of the total bill. By contrast, externalities in interurban areas are almost negligible. Very notable, LRTs are responsible for 42% of the total losses whereas they represent only 6% of total trips and 8% of total travelled distances in the Paris region. The social costs of freight trips are especially high in the core of the agglomeration, where trucks and vans account for 55% of total wastes.
Table 20 – Social costs of local pollutants in the Paris region
IdF PC VDUA DUA UA DIUA IA
Total social costs (M euros/day) 15.8 4.4 8.5 1.7 0.5 0.5 0.1
Share in total social costs (%) 100.0 27.8 53.8 10.8 3.2 3.2 0.6
33 External costs presented in Table 19 were adjusted in line with official recommendations to take into account the progress of engines over 2010-2012 (emissions decrease by 6%/year) and the increase in individuals’ wealth (real income is assumed to grow by 2%/year). Because the densest territory proposed by the Quinet report (CGSP, 2013) is characterized by a lower bound of 4,500 ind./km2, we cannot differentiate external costs of air pollution in central Paris and those in the very dense urban areas of IdF.

CITYLAB – City Logistics in Living Laboratories
D.2.1 – CITYLAB Observatory of Strategic Developments Impacting Urban Logistics (2017)
67
From freight (M euros/day) 6.7 2.4 3.5 0.5 0.1 0.1 0.0
From vans (M euros/day) 1.2 0.5 0.6 0.1 0.0 0.0 0.0
From trucks (M euros/day) 5.4 1.9 2.9 0.4 0.1 0.1 0.0
From passengers (M euros/day) 9.1 2.1 5.0 1.2 0.4 0.4 0.1
Share of freight (%) 42.4 54.5 41.2 29.4 20.0 20.0 0.0
Sources: authors’ calculations. Notes: “PC” refers to Paris city, “VDUA” to very dense urban area, “DUA” to dense urban
area, “UA” to urban area, “DIUA” to diffused urban area and “IA” to interurban area.
Our methodology makes it possible to decompose the social cost of local pollution between areas and vehicle classes. From a spatial point of view, we see that the city of Paris and the very dense urban areas of IdF concentrate more than 80% of the total bill. By contrast, externalities in interurban areas are almost negligible. Very notable, LRTs are responsible for 42% of the total losses whereas they represent only 6% of total trips and 8% of total travelled distances in the Paris region. The social costs of freight trips are especially high in the core of the agglomeration, where trucks and vans account for 55% of total wastes.
Finally, the influence of trucks is 4 to 5 times larger than vans’. Hence, we can calculate that social costs linked to the local pollutants emitted by trucks represent 0.32% of the regional GDP (vs. 0.07% for vans). Put differently, public policies should try to ban large freight vehicles from very dense central areas. One possible intervention would substitute large vehicles by vans; given the lowest emission factors of the later vehicles (see Table 9). However, this potential solution may be complicated by organizational features of freight activities. As illustrated in Table 6, trucks carry 6.6 times more goods (expressed in tonnages) than vans. Since the corresponding ratios for external costs never exceed 5.5 (Table 19), the switch from large to smaller vehicles will not automatically coincide with savings in pollution costs.
The figures in Table 20 do not consider the worldwide damages linked to the emissions in the atmosphere of CO2 (Tol, 2009). For that purpose, we can rely on the (official) value of 35.8 euros/ton of CO2, found for 2012 by following the recommendations of the Quinet report (CGSP, 2013). Adding the external costs related to greenhouses gases and climate change does not really affect the results. The additional losses are only equal to 1.0 million euros/day (5% of total environmental costs). If one trusts the monetary equivalents of environmental damages proposed by economists, it is clear that more energy should be devoted to decrease the emissions of local pollutants in dense cities rather than those of CO2. By contrast, public interventions should try to improve the CO2 balance of freight vehicles for interregional trips, when high traffic speeds imply large emission factors and where only a few individuals are harmed by local pollutant emissions.
Table 21 – Social costs of air pollution (including CO2) in the Paris region
IdF PC VDUA DUA UA DIUA IA
Total social costs (M euros/day) 16.8 4.5 8.8 1.9 0.6 0.8 0.1
Share in total social costs (%) 100.0 26.8 52.4 11.3 3.6 4.8 0.6
From freight (M euros/day) 6.8 2.4 3.6 0.6 0.1 0.1 0.0
From vans (M euros/day) 1.3 0.5 0.6 0.1 0.0 0.0 0.0
From trucks (M euros/day) 5.5 1.9 3.0 0.5 0.1 0.1 0.0
From passengers (M euros/day) 10.0 2.2 5.2 1.3 0.5 0.7 0.1
Share of freight (%) 40.5 53.3 40.9 31.6 16.7 12.5 0.0
Sources: authors’ calculations.
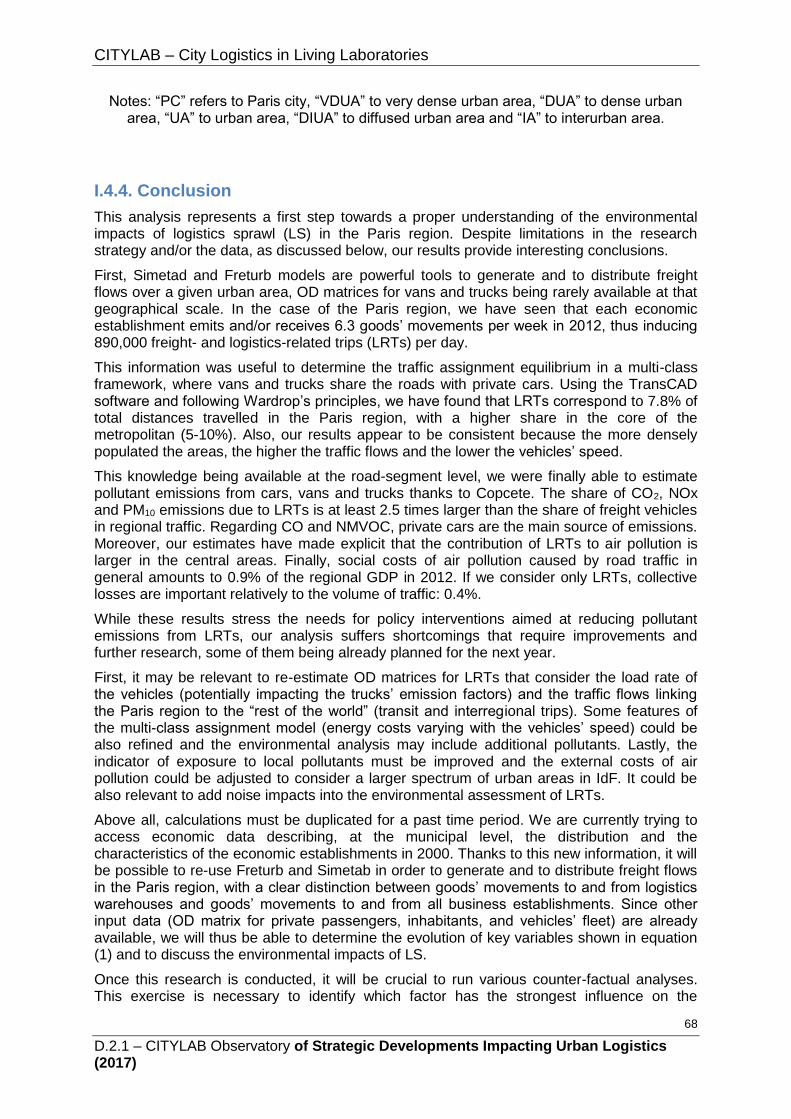
CITYLAB – City Logistics in Living Laboratories
D.2.1 – CITYLAB Observatory of Strategic Developments Impacting Urban Logistics (2017)
68
Notes: “PC” refers to Paris city, “VDUA” to very dense urban area, “DUA” to dense urban area, “UA” to urban area, “DIUA” to diffused urban area and “IA” to interurban area.
I.4.4. Conclusion
This analysis represents a first step towards a proper understanding of the environmental impacts of logistics sprawl (LS) in the Paris region. Despite limitations in the research strategy and/or the data, as discussed below, our results provide interesting conclusions.
First, Simetad and Freturb models are powerful tools to generate and to distribute freight flows over a given urban area, OD matrices for vans and trucks being rarely available at that geographical scale. In the case of the Paris region, we have seen that each economic establishment emits and/or receives 6.3 goods’ movements per week in 2012, thus inducing 890,000 freight- and logistics-related trips (LRTs) per day.
This information was useful to determine the traffic assignment equilibrium in a multi-class framework, where vans and trucks share the roads with private cars. Using the TransCAD software and following Wardrop’s principles, we have found that LRTs correspond to 7.8% of total distances travelled in the Paris region, with a higher share in the core of the metropolitan (5-10%). Also, our results appear to be consistent because the more densely populated the areas, the higher the traffic flows and the lower the vehicles’ speed.
This knowledge being available at the road-segment level, we were finally able to estimate pollutant emissions from cars, vans and trucks thanks to Copcete. The share of CO2, NOx and PM10 emissions due to LRTs is at least 2.5 times larger than the share of freight vehicles in regional traffic. Regarding CO and NMVOC, private cars are the main source of emissions. Moreover, our estimates have made explicit that the contribution of LRTs to air pollution is larger in the central areas. Finally, social costs of air pollution caused by road traffic in general amounts to 0.9% of the regional GDP in 2012. If we consider only LRTs, collective losses are important relatively to the volume of traffic: 0.4%.
While these results stress the needs for policy interventions aimed at reducing pollutant emissions from LRTs, our analysis suffers shortcomings that require improvements and further research, some of them being already planned for the next year.
First, it may be relevant to re-estimate OD matrices for LRTs that consider the load rate of the vehicles (potentially impacting the trucks’ emission factors) and the traffic flows linking the Paris region to the “rest of the world” (transit and interregional trips). Some features of the multi-class assignment model (energy costs varying with the vehicles’ speed) could be also refined and the environmental analysis may include additional pollutants. Lastly, the indicator of exposure to local pollutants must be improved and the external costs of air pollution could be adjusted to consider a larger spectrum of urban areas in IdF. It could be also relevant to add noise impacts into the environmental assessment of LRTs.
Above all, calculations must be duplicated for a past time period. We are currently trying to access economic data describing, at the municipal level, the distribution and the characteristics of the economic establishments in 2000. Thanks to this new information, it will be possible to re-use Freturb and Simetab in order to generate and to distribute freight flows in the Paris region, with a clear distinction between goods’ movements to and from logistics warehouses and goods’ movements to and from all business establishments. Since other input data (OD matrix for private passengers, inhabitants, and vehicles’ fleet) are already available, we will thus be able to determine the evolution of key variables shown in equation (1) and to discuss the environmental impacts of LS.
Once this research is conducted, it will be crucial to run various counter-factual analyses. This exercise is necessary to identify which factor has the strongest influence on the

CITYLAB – City Logistics in Living Laboratories
D.2.1 – CITYLAB Observatory of Strategic Developments Impacting Urban Logistics (2017)
69
evolution of pollutant emissions caused by LRTs. For instance: How many additional tons of pollutants would have been emitted if the vehicles’ fleet was hold constant over 2000-2012? What would be the level of pollutant emissions if the volume of trip generators (households, establishments) and/or their travelled distances were unchanged? What are the impacts of the sectoral definition of logistics activities on their environmental footprint? We believe this information to be primordial because it will enable us to clarify the definition, the measurement and the discussions on the environmental impacts of LS.
I.4.5. Bibliography
Airparif (2012). Caractérisation de la qualité de l’air à proximité des grandes voies de circulation. Rapport thématique, 3ème volet, 72p. Airparif (2013). Bilan des émissions de polluants atmosphériques et de gaz à effet de serre en Ile-de-France pour l’année 2010 et historique 2000/2005. Rapport thématique, 109p. Akçelik, R.. (1991). Travel time functions for transport planning. Australian Road Research, 21-3:49-59. Alagumalai, A. (2014). Internal combustion engines: Progress and prospects. Renewable and Sustainable Energy Reviews, 38: 561-571. Allen, J., Ambrosini, C, Browne, M., Patier, D. & Routhier, J.L.. (2010). Data collection for understanding urban goods movements: Comparison of collection methods and approaches in European countries. in Sustainable urban logistics concepts, methods and information systems, Springer, 71-90. Aljohani, K. & Thompson, R.G. (2016). Impacts of logistics sprawl on the urban environment and logistics: Taxonomy and review of literature. Journal of Transport Geography, 57: 255-263. André, M. & Hammarstrom, U. (2000). Driving speeds in Europe for pollutant emissions estimations. Transportation Research Part D, 5(5): 321-335. Beziat, A., Koning, M. & Tolier, F. (2017). Marginal congestion costs in the case of multi-class traffic: A macroscopic assessment for the Paris region. Working paper in revision in Transport Policy. Butlin, R.N. (1990). Effects of air pollutants on buildings and materials. Proceedings of the Royal Society of Edinburgh, 97B: 255-272. Carteret, M., André, M. & Pasquier, A. (2015). Méthode d’estimation des parcs automobiles et de l’impact des mesures de restriction d’accès sur les émissions de polluants. Projet de recherche ZA-PARC pour l’ADEME, 167p. Champion, A. & Hugo, G. (2004). New forms of urbanization: Beyond the urban-rural dichotomy. Ashgate Publishing Limited, 420p. Cidell, J. (2010). Concentration and decentralization: the new geography of freight distribution in US metropolitan areas. Journal of Transport Geography, 18: 363-371. Commissariat Général à la Stratégie et à la Prospective (2013). L’évaluation socio-économique des investissements publics. Tome 1 – rapport final, Chaired by Quinet, E., 354p. Coulombel, N. & Leurent, F. (2013). Les ménages arbitrent-ils entre coût du logement et coût du transport : une réponse dans le cas francilien. Economie & Statistique, 457-458 : 57-75. Dablanc, L. Blanquart, C., Combes, F., Heitz, A., Klauenberg, J., Koning, M., Liu, Z., de Oliveira, L.K., Seidel, S. (2016) CITYLAB Deliverable 2.1, Observatory of Strategic Developments Impacting Urban Logistics (2016 version), report for the European Commission, 137p. Dablanc, L. (2014) Logistics Sprawl and Urban Freight Planning Issues in a Major Gateway City - The Case of Los Angeles. In J. Gonzalez-Feliu, F. Semet & J.L. Routhier (Eds.), Sustainable Urban Logistics: Concepts, Methods and Information Systems, pp. 49-69. Berlin Heidelberg: Springer-Verlag.

CITYLAB – City Logistics in Living Laboratories
D.2.1 – CITYLAB Observatory of Strategic Developments Impacting Urban Logistics (2017)
70
Demeules, V. & Larose, S. (2012). COPCETE V4 – Outil de calcul des émissions polluantes d’origine routière. Rapport CETE Normandie Centre, 58p. De Palma, A. & Zaouali, N. (2007). Monétarisation des externalités de transport : un état de l’art. ThEMA Working Paper, 37p. Department of the Environment, Transport and the Regions (2000). New directions in speed management – A review of policy. Technical report, London, 49p. Di Sabatino, S., Buccolieri, R., Pulvirenti, B. & Britter, R. (2007). Simulations of pollutant dispersion within idealised urban-type geometries with CFD and integral models. Atmospheric Environment, 41(37): 8316-8329. European Commission (2016). Quality of life in European cities 2015. Flash Eurobarometer 419, 172p. Figliozzi, M.A., Kingdon, L. & Wilkitzki, A. (2007). Analysis of freight tours in a congested urban area using disaggregated data: characteristics and data collection challenges, 2nd annual National Urban Freight Conference, Long Beach, CA. Gardrat, M., Serouge, M., Toilier, F. & Gonzalez-Feliu, J. (2014). Simulating the Structure and Localization of Activities for Decision Making and Freight Modelling: The SIMETAB Model. Procedia-Social and Behavioral Sciences, 125, 147-158. Glaeser, E.L., Kahn, M. & Chu, C. (2001). Job sprawl: Employment location in US metropolitan areas. The Brookings Institution, Survey Series, 8p. Glaeser, E.L. (2011). Triumph of the city: How our greatest invention makes us richer, smarter, greener, healthier and happier. Penguin Press, 352p. Hall, P.G. (1998). Cities in civilization. Panthéon Books, 1169p. Ile-de-France Regional Council (2016). Changeons d’air en Ile-de-France : Plan régional pour la qualité de l’air (2016-2021). Rapport pour le Conseil Régional, 67p. INRIX (2014). The future economic and environmental costs of gridlock in 2030 – an assessment of the direct and indirect economic and environmental costs of idling in road traffic congestion to households in the UK, France, Germany and the USA. Report for INRIX. Kampa, M. & Castanas, E. (2008). Human health effects of air pollution. Environmental Pollution, 151(2): 362-367. Karner, A., Eisinger, D. & Niemeier, D. (2010). Near roadway air quality: Synthesizing the findings from real-world data. Environmental Science and Technology, 44(14): 5334-5344. Knecht, W. (2008). Diesel engine development in view of reduced emission standards. Energy, 33(2): 264-271. Mayeres, I. & Proost, S. (2001). Should diesel cars in Europe be discouraged? Regional Science and Urban Economics, 31(4): 453-470. Moridpour, S., Mazloumi, E. & Mesbah, M. (2015). Impacts of heavy vehicles on surrounding traffic characteristics. Journal of Advanced Transportation, 49-4: 535-552. Moussiopoulos, N., Berge, E., Bohler, T., de Leeuw, F., Gronskei, K.E., Mylona, S. & Tombrou, M. (1996). Ambient air quality, pollutant dispersion and transport models. Report for the EEA, 98p. Müller, S. & Schiller, C. (2015). Improvement of the volume-delay function by incorporating the impact of trucks on traffic-flow. Transportation Planning and Technology 38-8: 878-888. Ntziachristos, L. & Samaras, Z. (2000). Speed dependent representative emission factors of catalyst passenger cars dans influencing parameters. Atmospheric Environment, 34: 4611-4619. Ntziachristos, L., Gkatzoflias, D., Kouridis, C. & Samaras, Z. (2009). COPERT: a European road transport emission inventory model. Information Technologies in Environmental Engineering, Springer, 491-504. Ortuzar, J.D. & Willumsen, L.G. (2011). Modelling Transport 4th Edition. Wiley, 607p. Patier, D. & Routhier, J. L. (2009). How to improve the capture of urban goods movement data. Transport survey methods. Keeping up with a changing world. Emerald, Bingley, 251-287. Patil, G.R. (2016). Emission-based static traffic assignment model. Environmental Modeling & Assessment, 21(5): 629-642.

CITYLAB – City Logistics in Living Laboratories
D.2.1 – CITYLAB Observatory of Strategic Developments Impacting Urban Logistics (2017)
71
RICARDO-AEA (2014). Update of the Handbook on external costs of transport. Report for DG Move, 139 p. Richardson, H.W. & Bae, C.-H.C. (2004). Urban sprawl in Western Europe and the United-States. Ashgate Publishing, 325p. Routhier, J. L. & Toilier, F. (2007). FRETURB V3, a policy oriented software of modelling urban goods movement. WCTR 11th WCTR, Jun 2007, Berkeley, United States. https://halshs.archives-ouvertes.fr/halshs-00963847. Last accessed January 17, 2017. Santos, G. (2017). Road fuel taxes in Europe: Do they internalize road transport externalities? Transport Policy, 53: 120-134. SETRA (2009). Emissions routières de polluants atmosphériques – Courbes et facteurs d’influence. Note d’Information n° 92, 16p. Shearmur, R. & Alvergne, C. (2003). Regional Planning Policy and the Location of Employment in Ile-de-France: Does Policy Matter? Urban Affair Reviews, 39(1): 3-31. Small, K.A. & Verhoef, E.T. (2007). The economics of urban transportation, Ed. Routledge. Toilier, F., Serouge, M., Routhier, J. L., & Patier, D. (2016). How can urban goods movements be surveyed in a megacity? The case of the Paris region. In Taniguchi, E. & Thomson, R. (Ed.) Transportation Research Procedia, Vol. 12, Tenth International Conference on City Logistics, pp. 570-583. Tol, R.S.J. (2009). The economic effects of climate change. Journal of Economic Perspectives, 23(2): 29-51. Transportation Research Board. (2010). Highway Capacity Manual, Transportation Research Board, National Research Council. Union Routière Française (2013). Faits et chiffres 2013 – Statistiques des transports, Rapport annuel. Wahid, A., Maggs, R., Shamsi, SRA., Bell, JNB. & Ashmore, MR. (1995). Effects of air pollution on rice yield in the Pakistan Punjab. Environmental Pollution, 90: 323-329. Webster, N. & Elefteriadou, L., (1999). A simulation study of passenger car equivalents (PCE) on basic freeway sections. Transportation Research Part B, 33-5: 323-336. World Health Organization (WHO) (2016) Ambient (outdoor) air quality and health. Fact sheet. September. www.who.int/mediacentre/facsheets/fs313/en/. Last accessed January 17, 2017. Zhou, X., Tanvir, S., Lei, H., Taylor, J., Liu, B., Rouphail, N.M., Frefy, H.C. (2015). Integrating a simplified emission estimation model and mesoscopic dynamic traffic simulator to efficiently evaluate emission impacts of traffic management strategies. Transportation Research Part D, 37: 123-136.

CITYLAB – City Logistics in Living Laboratories
D.2.1 – CITYLAB Observatory of Strategic Developments Impacting Urban Logistics (2017)
72
I.5 Conclusion on logistics sprawl
As we have seen in these Sections, "Logistics sprawl" is the spatial deconcentration of logistics facilities and distribution centres in metropolitan areas. It has been a noticeable spatial pattern for the last decades in large cities around the world, as identified by twenty five case studies covering European (1/3), North America (1/3) and other regions (1/3). We have organized the data collected in these case studies under 17 indicators.
All indicators have been examined and compared. The main results of this data collection, comparison and analysis are the following.
- The number of warehouses per million of urban residents ranges from 6 (Tokyo) to 239 (greater Gothenburg). This varies with the definition of a warehouse and the accurateness of the database: comparisons are actually difficult as the type of warehouses can vary from one case study to another, and data sources have issues and are not perfect.
- The number of warehouses per million of residents has increased over time in all case studies except Amsterdam, Randstad and Tokyo.
- Logistics sprawl has happened in 17 case studies. It did not happen in Amsterdam, Belo Horizonte, Cali, Bogota, Halifax, Montreal, Seattle and Toronto GTA.
- The average increase of the LS indicator (increase in average distance of warehouses to their barycentre) is 0.31 km/year.
The main conceptual relationships between logistics sprawl and the urban mobility of goods are the following.
a) Most cities can expect a continued increase in the number of warehouses located in the metropolitan area. Furthermore:
- The increase in the number of logistics facilities over time is positively related to the importance of the role of global logistics hub played by an urban area.
- The increase in the number of logistics facilities over time is positively related to the increase in the digitalization of retail (increase in B2C demand) in an urban area.
- As B2C demand increases in large metropolitan areas, the demand for small logistics buildings within the urban area increases.
- The increase in the number of warehouses over time is larger in megaregions. - The increase in the number of warehouses over time is larger in big cities within
megaregions.
b) Logistics sprawl can be expected to continue in many cities, in the following manners:
- Logistics sprawl is positively related to the differential in land/rent values for logistics land uses between suburban and central areas in an urban region
- Logistics sprawl is positively related to the availability of large land parcels in suburban settings
- Logistics sprawl is negatively related to the degree of regional logistics land use control
- The degree of logistics sprawl varies with the type of logistics terminal (i.e. stronger for distribution and fulfilment centres, weaker for parcel transport terminals)
- Logistics sprawl generates an increase in the number of freight vehicle-kilometres within the urban region if its rate is higher, on the same time period, than economic and residential sprawl.
- Additional vehicle-kilometres induced by logistics sprawl are likely to impact less densely populated areas, thus generating less diffused transport externalities (local pollutants, noise, accidents).

CITYLAB – City Logistics in Living Laboratories
D.2.1 – CITYLAB Observatory of Strategic Developments Impacting Urban Logistics (2017)
73
In order to analyse the potential causes of logistics sprawl, we have built a simple analytical model of the cost structure of urban logistics. Even on a simple case, the model illustrates the complex and nonlinear relationship between the land use market, the parameters of urban logistics (vehicle speed, workday duration, costs and the demand) and the location of a warehouse. In particular, the research shows that an exogenous increase in the demand for pickup and delivery operations results in warehouses locating further away from cities, as a result of transport operations weighing relatively less in their cost function. On the other hand, the model hints to how an emerging market for very reactive logistics needs to be accompanied by logistic facilities coming back in city centres, despite the price. Finally, the model shows that the location of logistic facilities is determined by the rent gradient, not its absolute value: if rents are uniformly high, warehouses will have no need to move far from the city centre.
This brings some possible implications in terms of market structure and equilibrium pricing. As urban logistics is most probably characterized by economies of scales, there is economic ground to the idea of giving some space to logistic facilities near city centres in order to improve the efficiency of urban logistics. However, this should be done in a careful way, lest a mechanical increase in rents in these areas cancels the initial objective of the action.
Environmental impact. In a first step towards an assessment of the environmental impact of logistics sprawl, we calculated the environmental impact of urban freight using the Paris case as an example. The results are the following: the share of traffic-related CO2, NOx and PM10 due to urban freight is 2.5 times larger than the share of vans and trucks in the regional traffic. By contrast, private cars are the main source of CO and NMVOC. Moreover, we show that the contribution of urban freight to air pollution is larger in the city of Paris. Lastly, social costs of air pollution caused by road traffic in general amount to 0.9% of the regional GDP in 2012. If we consider only vans and trucks, collective losses are equal to 0.4% of the economic wealth created in the Paris region.

CITYLAB – City Logistics in Living Laboratories
D.2.1 – CITYLAB Observatory of Strategic Developments Impacting Urban Logistics (2017)
74
II. E-commerce and urban freight
Zeting Liu Laetitia Dablanc Corinne Blanquart Saskia Seidel
II.1 E-commerce and challenges for urban freight: state of the art
II.1.1 Definition of e-commerce, structure and actors
II.1.1.1 Definition of e-commerce
OECD defines an e-commerce transaction as “the sale or purchase of goods or services, conducted over computer networks by methods specifically designed for the purpose of receiving or placing of orders. The goods or services are ordered by those methods, but the payment and the ultimate delivery of the goods or services do not have to be conducted online. An e-commerce transaction can be between enterprises, households, individuals, governments, and other public or private organizations” (OECD, 2011). It includes various forms according to the parties involving in the transactions: B2B, B2C, B2G (business to government) and C2C, etc. We concentrate here in the business-to-consumer model.
Global B2C e-commerce sales have increased sharply over the last decade, driven by a growing online population and changes in consumer behaviours. In 2015, global B2C e-commerce turnover has reached $2.3 trillion US dollars for goods (62%) and services (38%), which represents 3.11% of global GDP. China was the world’s largest e-commerce market which accounted for 33.7% of global e-commerce turnover, following by the United States (26.2%), the United Kingdom (7.7%) and Japan (5%) (Source: Ecommerce Foundation,Global B2C E-commerce Report 2016).
In Europe, overall e-commerce turnover of the EU28 plus 19 European countries34 amounted to €455 billion (2.59% of European GDP) in 2015, of which 52% were from goods and 48% were from services (Figure II.1). Online retail is highly concentraed in Europe, with 62% of the sales are generated in three countries – UK (31%), France (14%) and Germany (13%). UK is undoubtable the leader of e-commerce in Europe (Source: Ecommerce Foundation, 2016).
34 These are : Albania, FYR Macedonia, Montenegro, Servia, Turkey, Bosnia & Herzegovina, Kosovo, Iceland, Andorra, Belarus, Liechtenstein, Moldova, Monaco, Norway, Russia, San Marion, Switzerland, Ukraine, Vatican City

CITYLAB – City Logistics in Living Laboratories
D.2.1 – CITYLAB Observatory of Strategic Developments Impacting Urban Logistics (2017)
75
Figure II.1. Key B2C E-commerce Data of Goods & Services, Europe Source: Ecommerce Foundation, 2016
In Europe, regardless of their size, the penetration of e-commerce among firms with 10 or more employees in the EU28 progresses. Tables II.1 and II.235 show thatin 2015, 20% of European firms have sold online. In Ireland, Denmark Germany and Sweden, more than a quarter of firms were involved e-commerce. In total, e-sales represented 16% of total annual turnover of European firms.
Table II.1 E-sales and turnover from e-sales, by size class, 2011 to 2015, EU28 (% enterprises, % total turnover)
Table II.2 E-sales, 2015 (% enterprises)
Source: Eurostat, 2016
35 Eurostat, E-commerce statistics. http://ec.europa.eu/eurostat/statistics-explained/index.php/E-commerce_statistics

CITYLAB – City Logistics in Living Laboratories
D.2.1 – CITYLAB Observatory of Strategic Developments Impacting Urban Logistics (2017)
76
II.1.1.2 Actors and structures of e-commerce
E-commerce does not necessarily imply the removal of physical stores, but rather an evolution of how retailers fulfil orders. E-commerce has therefore led to an increase in innovative combinations of physical and digital solutions through concepts such as click-and- collect and other collection methods (Ericsson, 2014). We can distinct the pure players and multichannel retailing:
Pure players are online selling platforms.
These include online retailers such as Amazon, Cdiscount, Zalando, Wanimo, Zooplus or online market places between sellers/buyers such as eBay, Priceminister, Amazon Marketplace, Le Bon Coin.
Some of these pure players are generalists (Amazon, Cdiscount) and some of them are specialized on one specific sector such as Zalando on garment, Wanimo and Zooplus on pet goods.
Multichannel retailers are mostly physical shops known as brick-and-mortar.
These are traditional businesses such as Carrefour, Auchan, Walmart launching online services in order to catch the share of e-retail market or to test the market before launching a physical shop (such as Tesco before it entered the US market).
However, the distinction between pureplayers and brick-and-mortars is blurring as more and more companies adopt omni-channel distribution strategy.
II.1.1.3 E-commerce logistics and delivery
E-commerce has changed the conventional process of how goods are moved from the seller to the customer. The e-fulfilment process is composed of several steps including inventory management, order fulfilment, shipments, customer enquires and returns. The goods purchased online are in most case delivered by a logistic operator through different ways (home delivery, pick and collect, etc.) that we will study later in this report. The delivery service providers are diversified with most of the e-tailers use at least two subcontratctors (Figure II.2).
Figure II.2: Number of parcel delivery providers used by e-tailers Source: Accenture, 2016, Differentiating Delivery: How to Win theeCommmerce Battle
The growing number of actors in the e-commerce logistics chain raise the concern on the change of urban logistics practice and the freight flows generated by the growth of e-commerce in particular in urban areas.

CITYLAB – City Logistics in Living Laboratories
D.2.1 – CITYLAB Observatory of Strategic Developments Impacting Urban Logistics (2017)
77
II.1.1.4 The specificity of e-grocery
In the e-retail market, e-grocery represents a special issue due to the specific conditions of storage and handling of fresh and cold foods and the high costs of home delivery. In contrast to the average general merchandise order, which comprises from one to three separate items, the online grocery orders can contain dozens of items, many of which are low value, perishable and in need of rapid picking and delivery. In the case of on-line purchased goods provided by existing store-based grocery retailers, in which there are no existing physical distribution channels for home delivery operations, these companies have to decide where to locate storage, order processing, picking and delivery activities. As the online business grows, they tend to switch the shelf-picking model to the dedicated picking model which offers potential for efficiency gains but needs a high sales volume to cover the higher investment costs (DG Move, 2012).Indeed, the profitability of e-grocery is a major issue. In France, the only currently existing model of e-grocery is clicks-and-mortar.36
II.1.2. E-commerce and urban traffic
Due to their different nature, the e-retail of goods and of services has inverse impact on freight traffic. Trends seem to indicate that B2C e-commerce for goods increases the total number of urban freight movements and leads to greater fragmentation of consignments at the city logistics level. It tends to increase the amount and the frequency of deliveries and decreases the size of a single delivery. On the other hand, B2C e-commerce for services can eliminate some journeys by allowing certain products to be downloaded electronically (book, music, home entertainment) (DG Move, 2012).
II.1.2.1 E-commerce and urban freight traffic
The accelerated urbanization will lead to rapid growth of urban freight which is estimated to be tripled in 2050 compared to 2010, as shown in Figure II.4 below.
Figure II.4: Increased urbanization and its impact on passenger and goods mobility demand
36Houra is associated to Cora, and Ooshop to Carrefour

CITYLAB – City Logistics in Living Laboratories
D.2.1 – CITYLAB Observatory of Strategic Developments Impacting Urban Logistics (2017)
78
Source: Arthur D. Little, 2015, Urban logistics: How to unlock value from last mile delivery for cities, transporters and retailers
The increasing volume of e-commerce transactions has created an explosion of freight traffic for personal deliveries in residential areas and office districts previously dominated by personal transport (Ericsson, 2014). In Paris, freight transport generates 1.5 million pick-up and deliveries per week, with 90% carried out by trucks. According to Airparif, HGVs and light commercial vehicles account for 40% of nitrogen oxide emissions and 30% of carbon dioxide emissions (Todd, Lloyd’s Loading, 2016, from figures from Laboratoire Amenagement, Economie, Transports in Lyon).
This amplifies the conflicts on urban goods movement (Nemoto et al., 2001; Russo and Comi, 2012):
Logistics service providers try to minimize logistics costs, which are under pressure due to growing demand from shippers for services such as time-specific deliveries, temperature control and regulations.
Government is assumed to seek maximization of social welfare to reduce negative impacts of growing urban freight transport in environment and quality of life.
Studies suggest that e-commerce does not reduce urban traffic and may even increase it as the reduction of shopping trips is substituted by the increase in delivery trips. However, by using optimization tools and new ITC technologies, it can help to optimize the fleet organization in urban dense areas and thus limit the environmental impact of delivery trips.
Hesse (2002) had suggested that the expansion of e-commerce may lead to the atomization of freight flows as rising carrier competition, increasing order flexibility supports on-time delivery, often with less than a full truck load, at higher frequencies and with smaller vehicles. At the same time, Nemoto estimated that the use of ITC and intelligent transport system (ITS) could make logistics operations more efficient by optimizing fleet management based on real-time traffic data (Nemoto et al., 2001). It is still expected that the use of ITC tools will help logistic companies optimize delivery routing and efficiency, government to provide better transportation infrastructure and information, and consumers to better organize their pick-up trips to avoid congestion (Caglianoa et al., 2015).
Taniguchi and Kakimoto (2003), using modelling techniques of vehicle routing and scheduling with time windows, show that e-commerce can lead to more traffic in urban areas and negative impacts on the environment. When e-commercepenetration rate reaches over 10%, however, the reduction in traffic for shopping by passenger cars overcomes the increase in home delivery truck traffic. Moreover, pickup points and co-operative freight transport systems of home delivery companies and designating time windows by home delivery companies can substantially reduce total running times and NOx emissions. Visser et al. (2014) also highlight that consolidation of home deliveries will increase their efficiency and add more deliveries per trip, which will reduce the number of vehicle-kms per delivery (Visser et al., 2014).
II.1.2.2 E-commerce and customers’ shopping trips
Shopping trips represent approximately 13% of the total energy use for passenger transport in Sweden, and there are similar metrics in other European countries (Hiselius et al., 2012). However, the impact of e-commerce on personal shopping trips is not homogenous according to the period and countries.
A Swedish survey on consumer buying and travel habits based on the travel diaries of regular and not online shoppers (Hiselius et al., 2012) shows that:
- On the whole, those who shop regularly online make the same total number of trips as those who do not shop regularly online;
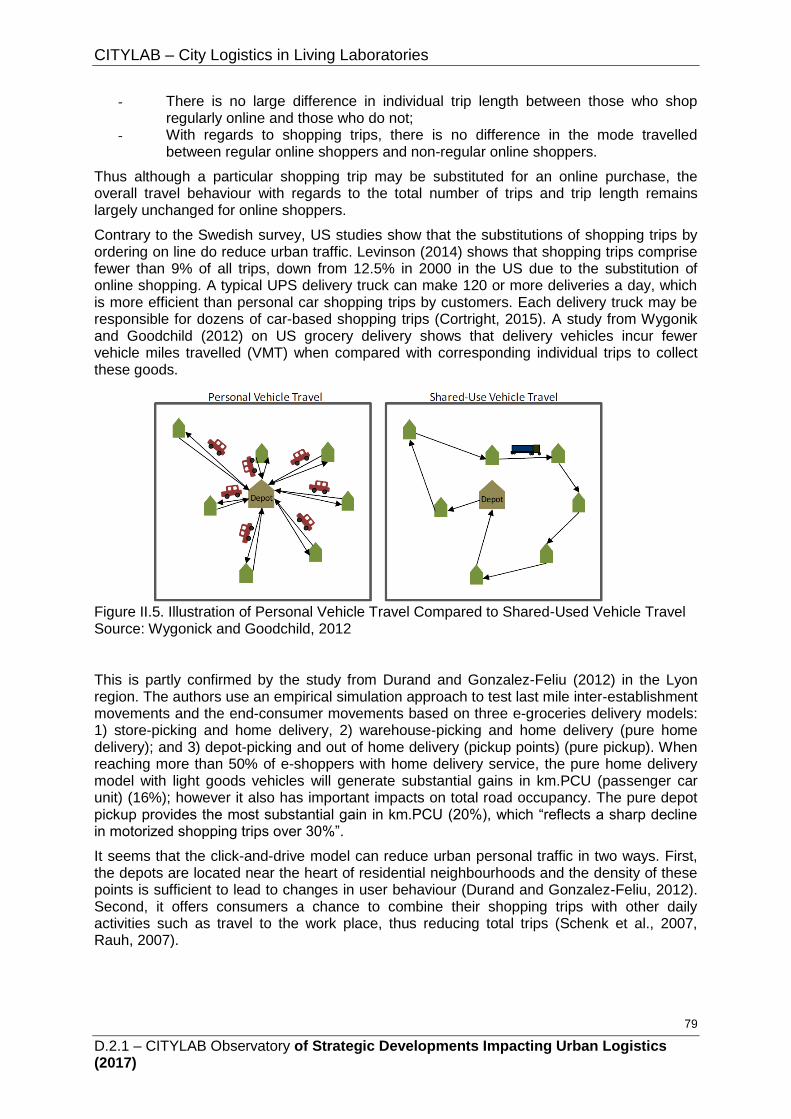
CITYLAB – City Logistics in Living Laboratories
D.2.1 – CITYLAB Observatory of Strategic Developments Impacting Urban Logistics (2017)
79
- There is no large difference in individual trip length between those who shop regularly online and those who do not;
- With regards to shopping trips, there is no difference in the mode travelled between regular online shoppers and non-regular online shoppers.
Thus although a particular shopping trip may be substituted for an online purchase, the overall travel behaviour with regards to the total number of trips and trip length remains largely unchanged for online shoppers.
Contrary to the Swedish survey, US studies show that the substitutions of shopping trips by ordering on line do reduce urban traffic. Levinson (2014) shows that shopping trips comprise fewer than 9% of all trips, down from 12.5% in 2000 in the US due to the substitution of online shopping. A typical UPS delivery truck can make 120 or more deliveries a day, which is more efficient than personal car shopping trips by customers. Each delivery truck may be responsible for dozens of car-based shopping trips (Cortright, 2015). A study from Wygonik and Goodchild (2012) on US grocery delivery shows that delivery vehicles incur fewer vehicle miles travelled (VMT) when compared with corresponding individual trips to collect these goods.
Figure II.5. Illustration of Personal Vehicle Travel Compared to Shared-Used Vehicle Travel Source: Wygonick and Goodchild, 2012
This is partly confirmed by the study from Durand and Gonzalez-Feliu (2012) in the Lyon region. The authors use an empirical simulation approach to test last mile inter-establishment movements and the end-consumer movements based on three e-groceries delivery models: 1) store-picking and home delivery, 2) warehouse-picking and home delivery (pure home delivery); and 3) depot-picking and out of home delivery (pickup points) (pure pickup). When reaching more than 50% of e-shoppers with home delivery service, the pure home delivery model with light goods vehicles will generate substantial gains in km.PCU (passenger car unit) (16%); however it also has important impacts on total road occupancy. The pure depot pickup provides the most substantial gain in km.PCU (20%), which “reflects a sharp decline in motorized shopping trips over 30%”.
It seems that the click-and-drive model can reduce urban personal traffic in two ways. First, the depots are located near the heart of residential neighbourhoods and the density of these points is sufficient to lead to changes in user behaviour (Durand and Gonzalez-Feliu, 2012). Second, it offers consumers a chance to combine their shopping trips with other daily activities such as travel to the work place, thus reducing total trips (Schenk et al., 2007, Rauh, 2007).

CITYLAB – City Logistics in Living Laboratories
D.2.1 – CITYLAB Observatory of Strategic Developments Impacting Urban Logistics (2017)
80
II.1.3 E-commerce and urban logistics
The growing maturity of consumers brings with it new desires and expectations. E-commerce fast development in 2002-2003 started when prices of products sold online became more interesting than prices in physical stores. Today, expectations other than prices prevail. At the top of the wish list, consumers expect fast delivery and convenience throughout each step of the online process. According to Gevaers et al. (2011), although direct-to-consumer deliveries are not new (as evidenced by the mail-order firms of the 1980s and 1990s), the expansion of e-commerce has stimulated their further development.
E-commerce has triggered transformation in the entire distribution system (Hesse, 2002). In B2C e-commerce, two physical distribution models are observed:
- The products flow along existing physical distribution channels, using existing physical distribution channels of express companies and postal networks. In this hub-and-spoke logistics network, last-mile delivery involves transportation over short distances with smaller trucks, and is carried out by the receiving depots in their regions.
- A new physical distribution channel to supply goods to consumers is established by retailers. In this case, logistics operations can be located at existing facilities/stores or in fulfilment centres, which are dedicated to e-commerce orders.
II.1.3.1 The last mile competition of B2C e-commerce
The rapid growth in the number of parcels has drawn attention to certain issues in the final part of the supply chain, which is referred collectively as the lastmile problem. One of the biggest challenges in B2C e-commerce is this last mile delivery to the consumer. Particularly in the e-grocery business it is difficult to combine profitability, customer convenience and traceability. For acceptable delivery costs and prices for customers, the volume and the number of deliveries have to attain a certain threshold (DG Move, 2012).
In e-commerce, the last mile is the final leg in a business-to-consumer delivery service whereby the consignment is delivered to the recipient either at the recipient’s home or at a collection point (Gevaers et al., 2011). As shown in Figure II.3 below, the service can be fulfilled either through a direct delivery to home or to a specific address (e.g. office) (1) or through a delivery to a collection point outside the home (click-and-collect). In the latter case, the consumer will collect the goods at a PUDO (pick-up/drop-off), also known as pickup point (PP); or, (2) in the special case of e-grocery, at a drive (click-and-collect at a special facility, or distribution centre or store) (3).

CITYLAB – City Logistics in Living Laboratories
D.2.1 – CITYLAB Observatory of Strategic Developments Impacting Urban Logistics (2017)
81
Figure II.6. Different business-consumer relations in B2C e-commerce last mile Source: the authors
II.1.3.2The problem of profitability and the development of logistics solutions
The last mile is currently regarded as one of the more expensive, least efficient and most polluting sections of the entire logistics chain due to, for example, the following:
Home deliveries that raise concerns on security and in particular the ‘not-at-home’ problem which leads to high rates of delivery failure and empty trips, which substantially affect the cost, efficiency and environmental performance;
Lack of critical mass in some areas or regions, which will also affect the cost. For example, hypermarkets in Dijon tend to concentrate their home delivery service for goods in urban or dense suburban areas in order to rationalize delivery costs (Motte-Baumvol et al., 2012);
Environmental concerns due to the high use of vans, which results in higher emissions per parcel compared to truck deliveries (Gevaers et al., 2011).
While home delivery remains the main delivery solution, click-and-collect also gains momentum in developed markets (Barclays, 2014), as consumers increasingly opt for the convenience of collection (JLL, 2013). Augereau et al. (2009) identify two categories of collection points: pickup points (PP), comprising networks of tobacconists, dry cleaners, florists, etc.) and automated lockers (referred to as ‘automated packstations’ (APS) by DHL in Germany).
Table II.3. Trends for reception point networks in Europe

CITYLAB – City Logistics in Living Laboratories
D.2.1 – CITYLAB Observatory of Strategic Developments Impacting Urban Logistics (2017)
82
Source: Morganti et al., 2014
It is interesting to observe that the APS model is particularly underdeveloped in France compared to the UK and Germany. Instead, the PP model is well established in France. This may be linked to the early development of the point relais networks for traditional mail order companies 30 years ago. Click-and-collect from the store is another alternative that starts to develop. For example, the French pure player Cdiscount has set up a partnership with the supermarket chain Casino to use the shops of the latter as its pickup points. The physical shops of Darty and Fnac also served as PP for goods sold by their online retailing business unit (which are independent from physical shops).
Analysis of the French PP model shows that the deployment of PP networks is directly linked to population density and frequency. This means that urban areas have larger numbers of PPs than suburban/rural areas. And in suburban and rural areas, PP are more likely located in the centre and main commercial avenues.
As shown in Figure II.5, the PPs are numerous in the western side of the Seine et Marne Department, belonging to the Paris conurbation, where population densities are higher than 1000 per square km. More precisely, within the whole Department, PP distribution patterns show a significant positive correlation with population density, with a predictable decline in PP density in rural areas.

CITYLAB – City Logistics in Living Laboratories
D.2.1 – CITYLAB Observatory of Strategic Developments Impacting Urban Logistics (2017)
83
Figure II.7 Pickup point networks in Seine-et-Marne, 2012- Map by François Fortin Source: Morganti et al., 2014
II.1.3.3 The “click & Collect” solutions in UK
In the UK many major store-based online retailers offer “Click & Collect” services in which the customer can collect their goods from the store of their choice or other standalone collection facility operated by the store-based retailer, rather than having them delivered to the home (for example For example, as well as providing Click & Collect facilities in its stores, Asda the grocery retailer, has also launched Click & Collect facilities at business parks, universities and some London Underground station car parks.
In UK, and notably London, Click & Collect services offered by store-based online retailers are usually made freely available to consumers. Retailers like consumers to use their Click & Collect services for main two reasons: (i) it helps them to avoid performing loss-making home delivery operations and can thereby improve their profit margins, and (ii) it results in the consumer visiting the store and possibly carrying out more shopping while collecting the goods. Thus, retailers with Click & Collect facilities in their stores are opening these facilities up to online-only (pure-play) retailers who can use them as a collection point for their goods. This generates a new revenue stream for store-based online retailers. For example, Boots the Chemist has allowed its stores to be used for ASOS consumer collections, while Argos provides a similar service for eBay consumer collections.
On the contrary, PP and APS are far less used in London and the UK than store-based retailers Click & Collect services, largely because customers usually have to pay additional delivery charges when placing online shopping orders to use locker banks or collections point. It has been reported that the UK is lagging behind some other European countries in terms of the use of collection points and lockers.
Collection points in London are located in either dedicated shops (in high streets or shopping centres), in railway stations (such as Doddle’s outlets) or in existing retail outlets (for instance

CITYLAB – City Logistics in Living Laboratories
D.2.1 – CITYLAB Observatory of Strategic Developments Impacting Urban Logistics (2017)
84
Collect+ in the UK has collection point counters in branches of the following convenience store chains: Londis, Costcutter, Nisa, Spar and McColls).
In terms of collection points, Royal Mail has a network of 11,500 Post Offices and delivery offices in the UK. The largest dedicated collection point provider for online deliveries in the UK is Collect+ which has a network of approximately 6,000 newsagents, convenience stores, supermarkets and petrol stations. It has counters in several convenience stores chains including Costcutter, Nisa, Spar, Londis and McColls. Consumers can arrange to have online purchases from approximately 90 major retail brands delivered to a Collect+ counter for them to then collect their purchases from. These collection points can also be used to return goods to online retailers, as well as for private individuals to send parcels from.
Doddle, a collection point service that commenced in the UK in autumn 2014, allows customers to collect goods ordered online from dedicated Doddle “shops” that are based at railway stations. These “shops” can be used to collect goods ordered from and delivered by a range of online retailers. Doddle has opened collection point “shops” at several London mainline railway stations.
Another UK provider, Parcelly has, since December 2014, been offering consumers a similarly new concept in collection points. In this approach, as with Collect+ and Doddle, rather than collection points being dedicated to a specific delivery company, Parcelly has teamed up with 250 independent retail outlets to offer collection points capable of handling incoming and returned goods from any parcel carrier. Some locker banks have been located in London at railway stations, petrol stations, shopping centres, workplaces and residential estates. Locker banks in the UK have been provided by online-retailers (such as Amazon), parcels carriers (such as DHL), and specialist locker bank providers (such as InPost).
Some online shoppers are selecting to have their orders, especially small non-food items, to the workplace. However, this resulted in delivery bays and post rooms at some workplaces receiving substantial volumes of personal shopping, which is a hindrance to the efficient flow of essential business deliveries within the building. This had led some companies based in London to ban staff from receiving personal deliveries at work. A project initiative by Cross River Partnership has established a website to assist companies and their staff based in London to determine suitable Click & Collect facilities, collection points and locker banks from which personal online shopping can be collected instead from a workplace (see - https://www.clickcollect.london/ ).
II.1.3.4 The special case of French e-grocery
The problem of profitability is particularly delicate for e-grocery. A study from Sinha and Weitzel (2015) on US online retail of groceries and consumer packaged goods shows that most models are hardly profitable if one includes all direct costs (such as delivery) and indirect costs (such as human cost preparing and packing the order) measured by activity-based costing method. Drive (in-vehicle pickup) and delivery by small vans from distribution centres are the most cost-efficienct delivery systems in dense population markets (Sinha and Weitzel, 2015). Intermarché, the third largest French grocery retailer, has developed the largest network of drives in order to “avoid having to make home deliveries and bear the substantial costs associated with the last mile (Lapoule, 2014).
In general, there are four ways for online grocery orders delivery: i) van delivery to home; ii) drives (drive-through outlets); iii) in-store pickup where shoppers drive to the store and pick up the order; and iv) parcel delivered by 3PL (for example the French pure player Telemarket.fr (which has been put in liquidation in 2013) has used parcel delivery through a partnership with Chronopost, see Gavaud, 2010).

CITYLAB – City Logistics in Living Laboratories
D.2.1 – CITYLAB Observatory of Strategic Developments Impacting Urban Logistics (2017)
85
In France, the “drive” has expanded rapidly from 2012 onward.Today, all the major brands in France have developed the drive model, with some variation (Carrelet and Cruzet, 2014; Lapoule, 2014; Saskia et al., 2016). In 2014, there is more drive sites (2 110) than hypermarkets (2 022) in France (Table II.4).In France, drives can be divided into three categories: drive “picking” attached to the store with no storage (which is closest to the in-vehicle pickup common in the US), which is the most common form (but paradoxally serve the least number of customers), drive “déporté” with dark store and storage and drive “accolé” (Saskia et al., 2016).
Table II.4 Drive characteristics in France Source: Saskia et al., 2016
The expansion of drives, or drive-through outlets of goods bought online, is one of the most cost-efficient solutions in dense population areas to cope with a growing number of mobile and active shoppers (in particular young active couples with children). It helps large retailers compensate the loss of shoppers and stagnation of sales in hypermarkets (Gavaud, 2010; Heitz et al., 2011; Fabuconnier, 2012; Carrelet and Cruzet, 2014). Indeed, as consumers’ perception of time and space has changed due to the use of internet and smart phones (m-commerce), super/hypermarkets have to develop new models in order to attract a larger extent of consumer groups outside their traditional catchment areas (for example, from resident to office, less served areas) (Heitz et al., 2011; Fabuconnier, 2012).
II.1.3.4 City logistics: greener and more efficient delivery
Although city logistics is not limited to e-commerce, logistics operators face strong pressures from the increasing volume of parcels due to e-commerce and the ‘delivery wars’. These ‘wars’, for example, are currently represented by new services from e-retailers or logistics providers offering ‘instant delivery’ services to e-shoppers.
It is estimated that 4% of UPS overall volume is tied to Amazon (Hook, 2015). For DHL, e-commerce contributes to 20.9% of the growth of its Post-eCommerce-Parcel (PeP) division in Q3 2015. As highlighted in the study of the European project CITYLOG, the new trends in supply chain management (for example instant delivery and fragmentation of loads linked to e-commerce) results in inefficient truck load with small parcels often carried by ‘empty’ vehicles in major European cities (Trends of Urban Logistics in Europe 201537). Innovations can help service providers increase e-commerce delivery efficiency, at a low cost while limiting emissions and pollution through optimization of routing, ITS, etc.; and propose new services to attract (or sustain) new customers. The last-mile competition in urban areas leads these actors to propose greener, faster, safer and more convenient services. However, these practices are limited to niche markets and many are still at an experimental phase.
A project tested in the Northen Italian province Vicenza is to build an eco-logistic system in a bycentric logistics cluster that links small cities to limit the environmental impact of urban goods distribution (Figures II.8 and II.9). The eco-logistic system serves multiple adjacent cities by using electric vehicles to cover the last 50 miles of distribution with a centralized
37Avaiilable on line: http://www.city-log.eu/sites/default/files/deliverables/CITYLOG_D1.1_Trends.pdf

CITYLAB – City Logistics in Living Laboratories
D.2.1 – CITYLAB Observatory of Strategic Developments Impacting Urban Logistics (2017)
86
terminals serving within the urban areas of the main cities of Bassano Del Grappa, Thiene, Shcio and Valdagno. By intergrating several small cities in the routing, it can achieve the objective of reducing environmental impact while being cost efficiency (Faccio and Gamberi, 2015)38.
Figure II.8 Urban eco-logistic system
Source: Faccio and Gamberi, 2015
Figure II.9 PedemontanaVeneta: analysed cities (red) and potential cities for inclusion (green)
Source: Faccio and Gamberi, 2015
In terms of sustainability, applying the sustainable logistic framework developed by Russo and Comi (2012), Schliwa et al. (2015), Hausladen et al. (2015) rate different delivery methods. The cargo bike solution is considered to have the highest sustainability potential. Schliwa et al. (2015) also argue that if low-carbon vans are beneficial for environmental goals, they do not resolve the problem of traffic congestion and accidents in dense urban areas.Table II.5. Analysis of city logistics concepts according to their potential environmental, social and economic impacts
38Faccio M., Gamberi M., 2015. New City Logistics Paradigm: From the “Last Mile” to the “Last 50 Miles” Sustainable Distribution, Sustainability 7 14873-14894.
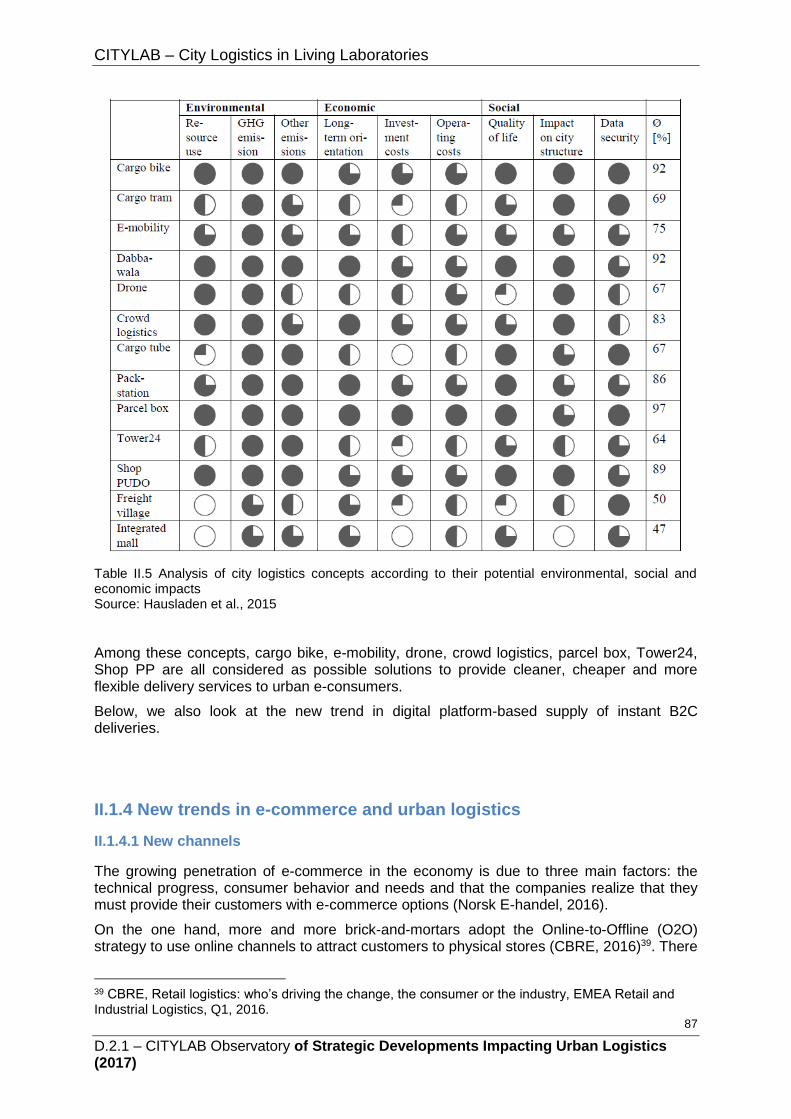
CITYLAB – City Logistics in Living Laboratories
D.2.1 – CITYLAB Observatory of Strategic Developments Impacting Urban Logistics (2017)
87
Table II.5 Analysis of city logistics concepts according to their potential environmental, social and economic impacts Source: Hausladen et al., 2015
Among these concepts, cargo bike, e-mobility, drone, crowd logistics, parcel box, Tower24, Shop PP are all considered as possible solutions to provide cleaner, cheaper and more flexible delivery services to urban e-consumers.
Below, we also look at the new trend in digital platform-based supply of instant B2C deliveries.
II.1.4 New trends in e-commerce and urban logistics
II.1.4.1 New channels
The growing penetration of e-commerce in the economy is due to three main factors: the technical progress, consumer behavior and needs and that the companies realize that they must provide their customers with e-commerce options (Norsk E-handel, 2016).
On the one hand, more and more brick-and-mortars adopt the Online-to-Offline (O2O) strategy to use online channels to attract customers to physical stores (CBRE, 2016)39. There
39 CBRE, Retail logistics: who’s driving the change, the consumer or the industry, EMEA Retail and Industrial Logistics, Q1, 2016.

CITYLAB – City Logistics in Living Laboratories
D.2.1 – CITYLAB Observatory of Strategic Developments Impacting Urban Logistics (2017)
88
is not a universal definition of O2O. It is undoubtly linked to the adoption of omnichannel distribution by distributors to use online virtual vitrine as well as offline physical shop to maximize their exposure to consumer. The physical facility is no more only a shop to sell product, but a multifunctional space as showroomn or warehouse, where customer can experience or pick up product seen online. For example, Walmart are transforming their physical stores to multi-function facilities as show room, mini-fulfilment centre and pick-up point.
In the UK many major store-based online retailers offer “Click & Collect” services in which the customer can collect their goods from the store of their choice or other standalone collection facility operated by the store-based retailer, rather than having them delivered to the home. In London, Sports Direct, a high street and online sports goods retailer, introduced a Click & Collect service that attempt to generate in-store sales as well. Consumers are charged £4.99 for Click & Collect orders, but in return are provided with a £5 voucher, that can only be spent in-store. In this way consumers who use the voucher feel they are getting free Click & Collect services while Sports Direct increases its in-store sales.
On the other hand, consummers also diversify their purchasing behaviour, from browsing online and buying in store to buying online and picking up from a store. In Belgium, an e-commerce survey revealed that 24% goes showrooming and buys online afterwards and 45% searches online and buys offline afterwards (Comeos, 2016)40. The proportion of the Norwegian population that shops online several times a month has increased by 35% from 2014 to 2015 (E-handelsrapporten 2015).
Another trend is that people are becoming increasingly aware of the power they have as consumers, and new technology continues to move power from producers to consumers. Consumers will expect full freedom of choice in terms of delivery methods and delivery times. Fast service at all hours becomes more widespread and creates new, higher expectations with respect to accessibility and speed (customers' expectations routinely go as fas as "instant deliveries", or deliveries in less than two hours). In Oslo and other cities,flexible delivery services adapted to the individual customers’ daily life and needs are expected. (E-handelsrapporten 2015, Dablanc et al., 2016).
II.1.4.2 New actors
One major trend in the e-commerce logistics service market is that lines between players in the logistics chain become increasingly blurred as new business models are already challenging incumbent players.
On the one hand, more and more marketplaces are becoming logistics operators and are increasingly building delivery capabilities. This puts logistics service proviers companies in competition with the e-tailers like Amazon or La Redoute in France or start-ups who provide innovative solutions to satisfy the requirement of speedy urban consumers such as Shutl in UK (bought by eBay) (Figure II.10).
40http://www.comeos.be/menu.asp?id=13540&lng=nl

CITYLAB – City Logistics in Living Laboratories
D.2.1 – CITYLAB Observatory of Strategic Developments Impacting Urban Logistics (2017)
89
Figure II.10 Examples of players and new entrants in the "last-mile-landscape” Source: Roland Berger, 2016
On the other hand, many smaller stores in local areas suffer due to competition from online and large-scale retailers. One response to this has been the creation of localized lastmile delivery brokers within a variety of urban areas, allowing people to buy items from local stores or restaurants and have them delivered by local drivers to the home or office location that is most convenient at the moment (Ericsson, 2014).
For example, in 2013 Google launched Google Shopping Express (now Google Express) in San Francisco and is now also available in Chicago, Boston, Los Angeles, New York, Washington D.C. It allows consumers to order goods from a range of brands available locally (e.g. Costco, Fairway, Target, Walgreens, Toys'R'Us, Staples, L'Occitane, etc.) online (https://www.google.com/express/) or through a mobile application (Google Express). The seller receives the order through an application of Google, and sends an employee to look for the product – as well as other products that will be distributed during the same time slot– and prepare the parcels. A Google truck will pick up all the parcels to its sorting centre, and a small car will redistribute the goods to their destinations according to each order. The cost of each delivery is from zero to US$4.99 and over.
The entry of Amazon into the parcel carrier market with the creation of its own logistics and delivery capability (Amazon Logistics) in some locations in the UK (rather than using existing parcel carriers) has added to this competition (Allan et al., 2016). It is suggested that Amazon Logistics already delivers as many parcels in the UK as some of the largest national carriers (Royal Mail, 2015). The degree of competition in the parcels sector (together with the growing importance of B2C and C2X parcel volumes) has resulted in falls in the revenues that carriers receive per delivery (Pooler, 2016).
II.1.5. The special issue of instant deliveries
The competition of e-commerce in urban areas is moving into the area of "instant deliveries", with e-retailers proposing deliveries in less than two hours. This service is typically carried out by couriers, or “runners” – independent workers, self contractors or individuals – who accept the assignment through digital platforms (Dablanc et al., 2017).
One increasingly well known example of instant delivery is Amazon Prime Now that allows Prime members to order more than 25,000 items (as well as food from area restaurants) and get free delivery within two hours (one hour with a fee) in major cities in the world (mostly the
CITYLAB – City Logistics in Living Laboratories
D.2.1 – CITYLAB Observatory of Strategic Developments Impacting Urban Logistics (2017)
90
US and Europe as of early 2017). Other large retailers provide instant deliveries: in France, Fnac for example also offers two hours delivery by courier in the Paris and Lille regions. Many instant delivery companies have been set up as local start-ups and are currently growing to regional markets (Europe, the US).
In Paris, there are 0.2 instant deliveries per home per week (Dablanc et al., 2017). There are about 1.7 million deliveries and pick-ups per week in the Paris region (Routhier, 2014), of which around 100,000 are instant deliveries. This means that there are 100,000 pick-ups in the same area, as instant deliveries generally require a physical proximity between pick-up and delivery places. Instant deliveries could represent in 2016 about 12% of B2C related deliveries and pick-ups, and 2.5% of total deliveries and pick-ups in the Paris region. The main conclusion from this preliminary evaluation is that freight trips generated by instant deliveries are rather significant already.
The transport modes for instant deliveries could also be identified. Instant deliveries are made by bicycle (88%), by motorbikes and scooters (9%), by other means (pedestrian/roller blades + transit, cargocycles) (3%) (Dablanc et al., 2017). This is very different from urban freight in general, made at 57% by vans, 39% by lorries, 3% by motorbikes, and 1% by bikes and cargocycles (Routhier, 2014). This heavy use of bicycles in Paris is probably an extreme case, due to the French legislation on third party freight transport: any head of a company, or self employed individual, providing a freight transport service with use of a motor vehicle (including scooters, motorbikes and vans) must be registered to the national freight transport register. This can be done after a three-day training, the guarantee of a fixed sum on a bank account for each vehicle used, and a clean police record. This rather strict legislation refrains independent couriers from using motor vehicles, although many violations of the rule have been observed (with a rate of 9% of couriers using scooters or motorbikes, as seen above).
In London, so far, instant deliveries are mainly concentrated on meal and grocery sector as the case of London shows. In London, there has been much growth in the home delivery of meals from take-aways and other restaurants in recent years. Whilst individual restaurants and restaurant chains have been expanding their home delivery services in a gradual manner, most of the growth in the market has resulted from the launch and growth of third-party service providers, who offer meal deliveries from multiple restaurants. These third-party providers are intermediaries between the restaurant and customer and vary in terms of the services they provide to restaurants. Some offer full offer ordering, payment and delivery services, while some only offer ordering and payment services, and the restaurant is responsible for the delivery of food to the customer. These online meal providers that provide their own home delivery services all typically aim to delivery the food to the customer quickly. Deliveroo and UberEATS aim to deliver the meal to the customer within approximately 30 minutes of the order being placed, while Amazon Restaurant) aims for a delivery within 60 minutes. However, only UberEATS currently provides a time guarantee of the delivery arriving within 30 minutes.
Amazon introduced AmazonFresh in the UK in June 2016. This service offers approximately 15,000 items, including fresh food, perishables as well as branded goods such as Coca-Cola, Kellogg’s and Danone. As part of this service, Amazon has also signed a deal with Morrisons to supply fresh and packaged private-label products as well as products from about fifty premium local producers, shops and markets in London. The AmazonFresh service is available to Amazon Prime members (a subscription service that costs £79 per year in the UK. Members pay an additional £6.99 per month for AmazonFresh). AmazonFresh provides same-day delivery for most orders, and one-hour delivery in some areas in Greater London.
This model is made possible by the development of the “gig economy”. This trend could be considered as an innovative solution in the search of a profitable model for customized, flexible and cheap instant delivery services in urban areas, developed by start-ups (and large companies) based on a Uber-like business model of urban last mile logistics.

CITYLAB – City Logistics in Living Laboratories
D.2.1 – CITYLAB Observatory of Strategic Developments Impacting Urban Logistics (2017)
91
The most well known examples are in ready meal deliveries via bike or scooters such as Deliveroo (UK based), TakeEatEasy (originally from Belgium, bankrupt since July 2016), or Foodora from Germany. Most of these companies operate (or operated in the case of TakeEatEasy) all over Europe. US companies are very active too, such as UberEATS (in many cities accross the world), or Postmates. But their activities are not only limited to food delivery. In France, TokTokTok (toktoktok.com) launched in Paris in 2011 and worked with brands such as Fnac, Darty etc. but also with local small businesses (restaurants, flower shops, drug stores, etc. Deliveries are made by couriers who will pick up the order and deliver it to the consumer in one hour. It allows consumers to check their order through an app. In Oslo, Zoopit is a company similar to Uber Rush offering instant deliveries in collaboration with several online stores covering products like electronics, pharmaceuticals and clothes.
However, the sustainability of this business model is under question as TakeEatEasy and TokTokTok were closed in 2016. Others like Deliveroo or Foodora have experienced labour movement and protests (in Milan, in London for the most notable). This is part of a mounting wave of criticism in some European countries against the “uberization of jobs,” i.e. an increase in the share of jobs carried out by independent contractors using digital platforms. Though not as publicized as controversies related to Uber passenger services, instant deliveries are a key part of the discussion. So-called "gig jobs" are considered precarious and devoid of benefits such as right to unionize, health insurance or retirement benefits. In the delivery business, they are also accused of favouring dangerous behaviours on the road, as the revenue made is strictly correlated to the number of delivery tasks accomplished.
Promoting a better work protection for independent contractors is one way forward. A California bill proposal pushed for independent contractors to be able to form their own negotiating organizations. The bill would have required technology companies to meet and negotiate with organized groups of independent contractors. It passed the California Assembly Labor and Employment Committee in 2015 but was then abandoned because of anti-trust concerns (https://techcrunch.com/2016/04/21/california-bill-to-give-gig-workers-organizing-rights-stalls-over-antitrust-concerns/). The recent French law 2016-1088 on Labor, Social Dialogue and Career Protection has introduced the following changes to the French Labor Code applying to independent contractors using digital platforms:
- If they decide on the “characteristics” of the service and its price, digital platforms have a social responsibility towards the workers using them.
- Digital platforms must organize or pay for the insurance for work related accidents (NB for workers earning a minimum annual revenue, whose amount is not yet decided).
- Workers using these platforms have a right to professional training and the digital platform must pay for it (NB for workers earning a minimum annual revenue, whose amount is not yet decided).
- Workers can unionize and their bargaining actions – if reasonable – cannot cause motive for dismissal.
In addition to allowing independent contractors to form their own bargaining organizations, unions also promote the reclassification of independent workers to employees. In the US, several lawsuits in the instant delivery sector have recently resulted in such reclassifications. As referenced in the specialized press, important players such as Instacart, Shyp and Scoobeez (a contractor of Amazon Prime Now), have reclassified some or all of their contractors into employees. One of these lawsuits came from four former drivers working for Amazon Prime Now in Los Angeles and specifically for its subcontractor Scoobeez, a courier company based in Glendale in Orange County. “Amazon goes much further than Uber in controlling drivers' schedules and work activities. Amazon Prime Now drivers work regular shifts for an hourly rate and do not have the option to decline deliveries. They also wear Amazon Prime Now uniforms and are not allowed to work for other firms” (quote from a

CITYLAB – City Logistics in Living Laboratories
D.2.1 – CITYLAB Observatory of Strategic Developments Impacting Urban Logistics (2017)
92
plaintiff, from L.A. Weekly, October 29, 2015). It was reported that Amazon pressured its subcontractor Scoobeez in settling the case, because of the bad publicity and potential large sums involved if the lawsuit would be continued.
The dominant trend between significant reclassifications or the continued use of independent contractors is however somewhat difficult to perceive. In parallel to using subcontracting courier companies, Amazon has also been testing its own digital platform system for delivery gigs, called Amazon Flex. It has been operating in the US and the UK only so far, but the company seems willing to extend it. Flex drivers, whom Amazon calls ”delivery associates”, are independent contractors with a pay advertised as $18 to $25 an hour in the US, and £12 to £15 in the UK.
II.1.6 E-commerce and new trend in urban warehousing
E-commerce dedicated warehouses are growing in numbers (while a lot of e-commerce parcel traffic is also going through, or exclusively going through, regular cross dock facilities from parcel and express transport companies). Most of these facilities are located in the suburban settings. However, as more and more companies adopt omni-channel distribution strategies, e-commerce is transforming warehouse and/or distribution facilities into the retail stores of the future. The develoment of instant delivery requires logistics facilities to be closer to customers in order to reduce time to delivery. Online retailers will pay a premium for relatively small, well-located and well-equipped sites that allow them to gain an advantage over their competitors’ fulfilment times, particularly in terms of sites located in or near urban conurbations from which they can make deliveries to consumers (Goddard, 2017). Thus, e-commerce companies and other retailers are finding “infill” locations sites within urban areas that are repurposed for logistics (Prologis, 2016).
Infill facilities are smaller fulfillment centres built in dense urban areas to support delivery in less than two hours that are filled only with the best selling items typically with less than 20 000 items. It is located in a city and has usually already been developed, but is now vacant and can be re-purposed for new users (Spencer et al., 2016)41. The most well known example is the expansion of Amazon Prime Now hubs in major American cities such as Manhattan.If the distribution centres are not in city centres, they will be located in suburban areas near major highways accessible in 30 minutes access during non-rush hour periods (Phillips, 2016)42.
In Europe, Amazon Prime Now is operating in London and other UK cities, in Berlin, in Milan, and a few other main European cities. It opened its hub in the 18th arrondissement in Paris in 2016 in order to serve the city of Paris.
Figure II.11 beneath provides an example the deploiment of Amazon’s distribution centres in France. Amazon has opened four fulfilment centres in major logistics hubs to cover the French market: Saran (near Orléan) opened in December 2007, Montélimar (between Lyon and Montpellier) opened in August 2010, Sevrey (North to Lyon) opened in September 2012, and Lauwin-Planque (near Lille) opened in Septeber 2013. A new mega fulfilment centre is planned to be opened in Boves (near Amiens) in September 2017.
In Paris, Amazon has opened its first Prime Now Hub at Boulevard Ney in 18th arrondissement in June 2016. The hub, converted from a warehouse of Geodis, is dedicated to deliver to Paris and 20 immediate nearby cities in one hour. It is much smaller (4000 m²) compared to the fulfilment centres and with 26 categories and more than 20,000 references of products, it is organized much more like an urban grocery (see photos on Figure II.12).
41Spencer C., Caton C., Conwell B., Final Delivery: The Last Mile, ULI Fall Meeting: E-commerce Session, http://uli.org/wp-content/uploads/ULI-Documents/Caton_FinalDelivery.pdf 42Phillips R., 2016, Tackling E-commerce's "Last Mile" Warehouse Networks, http://www.naiop.org/en/Magazine/2016/Winter-2016-2017/Business-Trends/Tackling-Ecommerces-Last-Mile-Warehouse-Networks.aspx

CITYLAB – City Logistics in Living Laboratories
D.2.1 – CITYLAB Observatory of Strategic Developments Impacting Urban Logistics (2017)
93
However, as the hub is located in Northern Paris, the Southern arrondissements (13th, 14th, 15th) and some immediate cities cannot be served (LSA, 2016). It is said that Amazon is planning to open a new Prime Now Hub in the South of Paris in 2017.
Amazon Prime Now Hub
Boulevard Ney, 75018 Paris
Figure II.11 Amazon Distribution Network in France

CITYLAB – City Logistics in Living Laboratories
D.2.1 – CITYLAB Observatory of Strategic Developments Impacting Urban Logistics (2017)
94
Source: Data compiled by authors
Left: Amazon’s Lauwin-Planque fulfilment centre
Photo Credt: Le Monde, Dans les entrepôts Amazon de Lauwin-Planque, 03/02/201743
Beneath: Amazon’s Prime Now Hub Paris
Photo credit: LAS Commerce Connecté, Amazon Prime Now : les photos de l'entrepôt parisien, 16/06/201644
Figure II.12 Inside Amazon Prime Now Hub Paris compared to its fulfilment centre
Other companies in particular parcel delivery companies also tend to locate small-sized distribution centre or hub in dense urban centre in order to be closer to their customers (Heitz and Beziat, 2016).45 The case of Beaugrenelle which is observed in CITYLAB project is another example of the effort to convert vacant urban industrial facility into delivery hub to serve dense urban areas with clean vehicle. More recently, in 2016, the City of Paris has launched tenders to transform five other derelict sites into urban logistics hubs to reduce
43 http://abonnes.lemonde.fr/emploi/portfolio/2017/02/03/dans-les-entrepots-amazon-de-lauwin-planque_5074424_1698637.html 44 http://www.lsa-conso.fr/photos/amazon-prime-now-les-photos-de-l-entrepot-parisien,240045/amazon-prime-now.1 45Heitz A., Beziat A., 2016. The parcel industry in the spatial organization of logistics activities in the Paris Region: inherited spatial patterns and innovations in urban logistics systems, Transportation Research Procedia 12, p.812-824.

CITYLAB – City Logistics in Living Laboratories
D.2.1 – CITYLAB Observatory of Strategic Developments Impacting Urban Logistics (2017)
95
pollution from HGVs and minimise the environmental impact from the strong growth in e-commerce.46
In other CITYLAB cities, distribution centres are more likely to be located in nearby suburban areas to servce major cities. In Rome, 3PLs are starting to offer e-commerce-dedicated services to firms adopting online sale strategies and multi-channel retailers. For instance, Save S.r.l., using a 15 000m2 dedicated warehouse situated in the outskirt of Rome (FigureII.13).47
FigureII.13 Save S.r.l. warehouse in Fiano Romano Source: Gatta, 2016
In London, most e-commerce warehouses are located outside, or even very far outside the city limits, up to the Midlands (Birmingham-Leicester-Northampton). The warehouse areas for e-commerce parcels last mile deliveries are mostly around the M25, between Heathrow, Gatwick, Luton and Stansted. This is due to the lack of sufficient availability in UK cities for the urban logistics warehouses needed for last-mile fulfilment (Goddard, 2017). The demand for land in London and the land values are so high that warehousing demand often loses out to land uses with higher values such as luxury residential and office development.
However, in the last couple of years there are some initial signs of a limited quantity of warehousing facilities returning to inner and outer London as a result of the requirements of the online shopping market that requires fulfilment centres in urban locations. These centres are used for vehicle despatch for last-mile deliveries to consumers in both residential and commercial properties. As a result of this the property sector has had to alter its understanding rapidly. Vacancy rates for warehousing property were approximately 20-30% in the UK in 2008, but the vacancy rate has now fallen to record low level. For example, Sainsbury’s recently opened its first purpose-built urban fulfilment centre, which can handle 25 000 orders per week, from which it has been trialling same-day deliveries. It is also
46Stuart Tood, Paris issues tender to develop five urban logistics hubs, Lloyd’s Loading List, July 20, 2016. http://www.lloydsloadinglist.com/freight-directory/news/Paris-issues-tender-to-develop-five-urban-logistics-hubs/66995.htm#.WHz0zbmvjec 47 Other similar examples of the phenomenon previously described can be found at the following web addresses: http://www.outloglogistica.it/logistica-e-commerce, http://www.digiamberardino.com/logistica-e-commerce, http://www.logd.it/ecommerce.html

CITYLAB – City Logistics in Living Laboratories
D.2.1 – CITYLAB Observatory of Strategic Developments Impacting Urban Logistics (2017)
96
planning to operate same-day home deliveries from stores, and is testing an app that will permit deliveries of up to 20 items within one hour of order for consumers living within 3 km of a store.

CITYLAB – City Logistics in Living Laboratories
D.2.1 – CITYLAB Observatory of Strategic Developments Impacting Urban Logistics (2017)
97
II.2 E-commerce indicators
There is only scarce data on e-commerce, in particular urban data, and data about its impact on mobility and traffic.
To develop the analysis on these issues as well as to provide comparison between countries, the following indicators have been selected for this report. Data has been collected when available (see Appendix 4). This list of indicators represents what seems most relevant to us when studying relationships between e-commerce and urban freight.
As seen on the Table in Appendix 4, our sources of data are incomplete. They are from various sources, including official data (Eurostat, OECD), public research institute/universities (Copenhagen Economics), professional association/federations (Universal Postal Union, UPU; International Postal Corporation, IPC; Ecommerce-europe.eu), or private data such as consultants' studies (AT Kearney, Nielsen TradeDimensions).
There are still research gaps in the analysis of the relationships between e-commerce and freight, especially in urban areas. The major one involves data. Freight surveys could be helpful, researching whether the order being shipped was placed electronically or by conventional means. This would also allow questions such as: are e-commerce shipments longer than other shipments? Are they more likely to be international shipments? Detailed case studies could specify the changes in supply chains that are driven by e-commerce and their effects on the quantity and quality of freight services demanded.
A useful database to analyse the links between e-commerce, urban traffic and land use could be structured as shown below. In Appendix 4, we have started filling in data for these categories of indicators:
GENERAL FIGURES
Name and size of studied area
Total B2C e-commerce (goods and services) turnover (€ billion)
Total B2C e-commerce (goods and services) increase (% increase compared to year before)
Share of goods purchased online (%)
Share of services purchased online (%)
E-commerce % on total GDP
Estimated share of online retail of goods in total retail of goods (%)
Average spending per e-shopper (€)
Total grocery e-commerce turnover (€ billion)
Share of grocery e-commerce in total grocery commerce (%)
DELIVERY INDICATORS

CITYLAB – City Logistics in Living Laboratories
D.2.1 – CITYLAB Observatory of Strategic Developments Impacting Urban Logistics (2017)
98
Total shipments parcels (express and non express) B2B, B2C, C2C in million units and euros
Share of B2C and C2C in total shipment parcels
National Postal Operator’s market share relative to B2C parcels and packets shipments (%)
Share of shipments delivered as express delivery by national postal operators (%)
If city case studies are available: share of e-commerce deliveries in total urban deliveries (%)
(example New York City: 800,000 e-commerce deliveries out of 2.2 million deliveries a day, a share of 36%)
LOGISTIC FACILITIES
Number of pick up points
Number of pick-up-point per urban inhabitant
Market share of pick-up points in total number of e-commerce deliveries (%)
Number of automated pick-up points
Number of “drives” (grocery e-commerce pick-up-points)
MARKET STRUCTURE
National Postal Operator’s share of revenue due to e-commerce (%)
Main alternative operators active in B2C deliveries
E-SHOPPERS
Total residents (million)
Internet users (million)
Share of internet users (%)
Total urban residents (million)
Urban internet users (million)
Share of urban internet users (%)

CITYLAB – City Logistics in Living Laboratories
D.2.1 – CITYLAB Observatory of Strategic Developments Impacting Urban Logistics (2017)
99
II.3 Elements for urban planning and public decision-making
E-commerce implies new use of space and new planning issues. It means adapting public decision making to the new reality in retail.
This section highlights the importance of understanding urban planning aspects of city logistics, including managing truck traffic associated with the last mile portion of the e-commerce supply chain.
Citylogistics also means discussing logistics systems for e-commerce: location of logistics centres and their functions, and new operators’strategies in terms of delivery services.
One limitation of our research is that data on e-commerce shipments are scarce, especially for urban areas. Moreover, effects depend on a wide range of factors, very different according to the countries. Lastly, the high speed of changes poses special challenges for forecasting the future of e-commerce and assessing its impacts.
Both data collection and assessment processes are needed to evaluate impacts at detailed local and urban level, regional level, state level and a national level. In the absence of such measures, we have attempted to provide some assumptions from the literature survey, that have to be further tested. These assumptions focus on the relationships between:
- E-commerce and urban traffic - E-commerce and delivery options, as an important driver for urban freight - E-commerce and logistics facilities
II.3.1 E-commerce and urbantraffic
II.3.1.1 The growth of e-commerce revenue results in higher parcels volume
The higher the internet sales the more parcels are sent.According to a study from Barclays (2014), in 2013, letterbox-sized packages and small parcels (i.e. no larger than a standard UK shoebox) made up 59.5% of all deliveries from orders made online, with an estimated average growth of 42% between 2013 and 2018.
The following figures (II.14 and II.15) show the growth of e-commerce sales and the increasing number of parcels in particular domestic parcels between 2000 and 2012. The growing parcel volume follows the trend of e-commerce sales. However, as we can observe, the pace of parcel volume growth is lower than the growth of e-commerce.
On average, parcels and express volumes in Europe have grown by more than 5% annually over the last three years, with the rate of growth increasing to 6.3% in 2014 (Source: Ecommerce Europe: data for 2012 and 2014; IPC, 2015). In Europe alone, the number of parcels/year accounts for more than 4 bn/year in 2014.
Giving the fact that e-commerce includes services and goods (both digital and physical goods), the following questions need to be addressed:
- it is possible that the sales of digital goods are growing faster. - this can also be due to higher added-value per item shipped.

CITYLAB – City Logistics in Living Laboratories
D.2.1 – CITYLAB Observatory of Strategic Developments Impacting Urban Logistics (2017)
100
Figure II.14. Parcel revenue versus volume growth 2012-2014
Source: Accenture, 2016, Achieving High Performance in the Postal Industry
Figure II.15. Global annual E-commerce sales
Source: Prologis, 2016
II.3.1.2 The growth rates of e-commerce sales and of urban freight traffic are different
From 2007 to 2013, Amazon‘s North American sales increased by a factor of 5, from $8 billion to $44 billion. Between 2007 and 2013, the total e-commerce revenues in the United States has doubled, from about $137 billion to about $261 billion according to the U.S. Department of Commerce. However, according to the US DOT data as tabulated by Brookings (assembling several decades of US DOT data on vehicle miles travelled), over this

CITYLAB – City Logistics in Living Laboratories
D.2.1 – CITYLAB Observatory of Strategic Developments Impacting Urban Logistics (2017)
101
same time period truck traffic in urban areas has actually declined (Cortright, 2015,Figure II.16).
Figure II.16 E-commerce sales, Amazon North America sales and Urban Freight Transport Source: Cortright, 2015 * N.A.: North America ** BEA: Bureau of Economic Analysis
The logistics performance can explain this difference in the growth rate, through a load rate optimization, multiple customer deliveries in the same trip, or shorter distances with the development of sortation centres closer to the city centre.
II.3.1.3 Instant delivery will increase urban freight traffic
It is assumed that the more quickly delivery is demanded, the less efficient the delivery trip is (Mokhtarian, 2004). The rise in the “gig economy” and instant deliveries (see above) will increase urban freight traffic, in particularly made by couriers on bike. This will raise the concern on working conditions and safety issues.
II.3.1.4 Growth in freight transportation due to e-commerce depends on the return rates and the reverse needs
Earlier studies estimated customer return rates at 6-15% for mass merchandisers and up to 35% for catalogue and e-commerce retailers (Dowlatshahi, 2005; Sarkis, Meade, Talluri, 2004).

CITYLAB – City Logistics in Living Laboratories
D.2.1 – CITYLAB Observatory of Strategic Developments Impacting Urban Logistics (2017)
102
II.3.2 Substitution between shopping trips and deliveries
II.3.2.1 Urban traffic due to e-commerce depends on the substitution between personal travels and deliveries
Cairns (1997, 1998, 2005) observed reductions in vehicle miles travelled (VMT) between 60 and 80 percent when delivery systems replaced personal travel. The Punakivi team found reductions in VMT as high as 50 to 93 percent (Punakivi and Saranen, 2001; Punakivi et al., 2001; Punakivi and Tanskanen, 2002; Siikavirta et al., 2002). Wygonik and Goodchild (2012) saw reductions of 70-95%.
Looking at personal travelling involved in shopping activities in the Netherlands between 2003 and 2010, the number of trips, total distance and average distance linked to shopping all diminished continually, before stabilizing. Since 2004, the duration of shopping trips has also decreased.
The trends visible in the Netherlands can also be observed in the results of the National Travel Surveys in England and Germany. In 2013 the average person in England made 180 shopping trips, travelling on average 769 miles. These figures are 24% and 14% lower respectively, than the same figures for 1995/97. The decrease in shopping trips has been the largest overall contributor to the 16% fall in all trips in England recorded between 1995/97 and 2013 (Francke, Visser, 2014).
II.3.2.2 The shift from personal travel to freight transport depends on the type of goods
The majority of shopping trips undertaken are for groceries. As such, e-shopping for groceries is likely to lead to a shift from personal travel to freight transportation. In a study by McKinsey and Company, 82 percent of consumers who order groceries online do it as a substitute for frequent regular trips to a grocery store, rather than substituting for infrequent trips to stock up on limited items or for special occasions (Sneader et al., 2000).
II.3.2.3 Growth in freight transport due to e-commerce depends on the level and nature of the substitution with shopping trips
Some studies suggest that e-commerce may lead to more freight trips and more kilometres mainly because e-shopping will lead to substitution of personal travel with home deliveries (Anderson et al, 2003; Cohen, 2000; Dodgson et al, 2002).
Regarding e-commerce, freight transport efficiency compared to shopping trips (and the VMT associated) depends on the extent to which the substituted personal trip was part of a chained trip, and the modal split for shopping related travel (Gärling, Ettema, Friman, 2014).
II.3.2.4 Instant deliveries will reduce shopping trips for e-grocery
Other factors negatively influencing consumers' decisions to purchase groceries online include the need or want for immediate delivery of products. So, more frequent instant deliveries will generate higher freight traffic, but reduce individual shopping trips and thus reduce emissions as a whole.
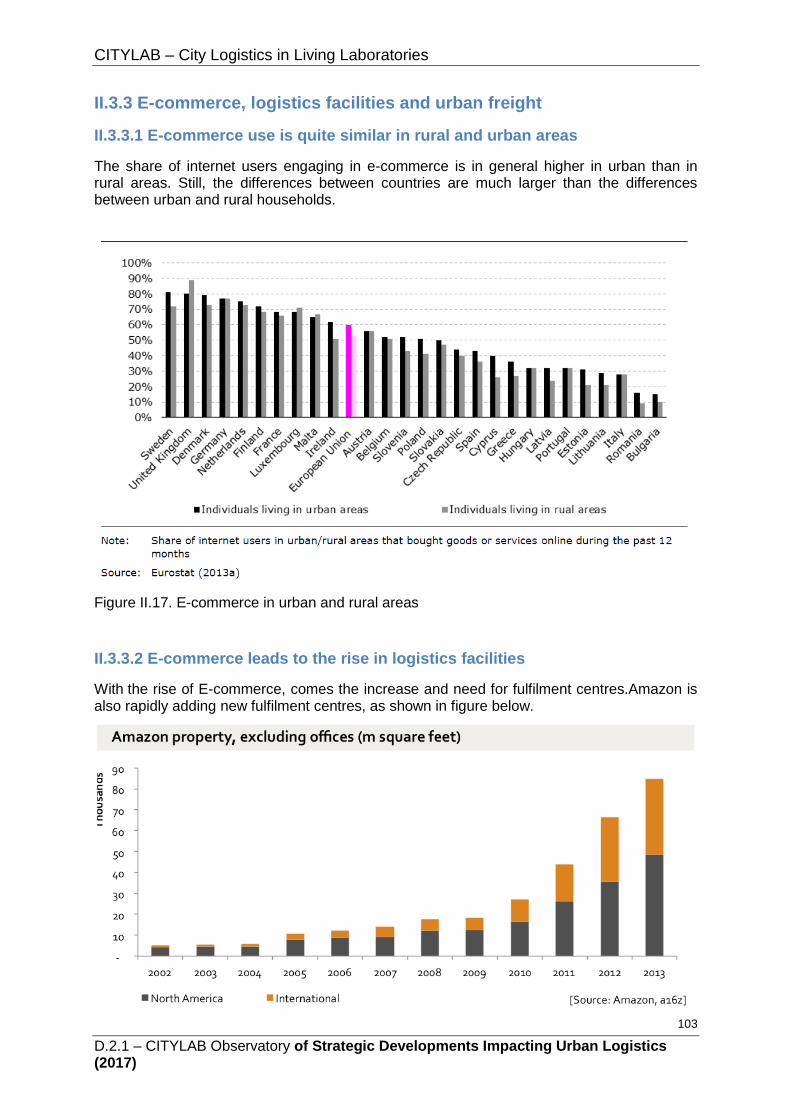
CITYLAB – City Logistics in Living Laboratories
D.2.1 – CITYLAB Observatory of Strategic Developments Impacting Urban Logistics (2017)
103
II.3.3 E-commerce, logistics facilities and urban freight
II.3.3.1 E-commerce use is quite similar in rural and urban areas
The share of internet users engaging in e-commerce is in general higher in urban than in rural areas. Still, the differences between countries are much larger than the differences between urban and rural households.
Figure II.17. E-commerce in urban and rural areas
II.3.3.2 E-commerce leads to the rise in logistics facilities
With the rise of E-commerce, comes the increase and need for fulfilment centres.Amazon is also rapidly adding new fulfilment centres, as shown in figure below.
CITYLAB – City Logistics in Living Laboratories
D.2.1 – CITYLAB Observatory of Strategic Developments Impacting Urban Logistics (2017)
104
Figure II.18. Increase in Amazon properties Source: Amazon
Figure II.19. Evolution of Amazon fulfilment network size Source: MWPVL
II.3.3.3 The location of these logistics facilities depends on their size and the maturity of market
E-fulfilment blends with urban logistics, as these facilities will be mainly based around the major population centres where online sales densities are highest.
According to the different phase of maturity of e-commerce development, the demand for warehousing facilities also varies. In the maturing market of Western Europe countries, there
is increasing demand for smaller units in urban areas (Prologis, 2016) (Figure II.20). The more the e-comerce market is mature and big, the more there are diversified warehousing demands in particularly those in urban area.
Local parcel delivery centres and urban logistics depots are set up at the edge of major cities and urban areas for home delivery or delivery to collection points.
Mega e-fulfilment centres are located near to parcel hubs but outside the traditional ‘centre of gravity’ and large labour supply as it requires high levels of staffing (source: JLL, 2013, E-commerce boom triggers transformation in retail logistics).

CITYLAB – City Logistics in Living Laboratories
D.2.1 – CITYLAB Observatory of Strategic Developments Impacting Urban Logistics (2017)
105
Figure II.20 Stages of Growth Across the Globe Source: Prologis, 2016
II.3.3.4 The rise in same-day and instant deliveries leads to the increase of sortation centres close to customers.
The needs to serve customers in one and two hours mean that Online retailers will pay a premium for relatively small, well-located and well-equipped sites that allow them to gain an advantage over their competitors’ fulfilment times, particularly in terms of sites located in or near urban conurbations from which they can make deliveries to consumers (Goddard, 2017).
This trend of creating ‘infill’ location sites within dense urban areas by converting vacant sites into logistics facilities will increase the need to assess the environmental impact generated by growing freight flows.
II.3.3.5 Land use patterns influence urban freight traffic for home deliveries
Higher population density and therefore higher delivery density means less urban traffic.
Higher population density means better logistics performance because it will increase delivery density measured by stop per mile. Boyer, Prud’Homme& Chung (2009) show that more deliveries per trip reduce number of vehicle-kms per delivery. Consolidation therefore makes home delivery more efficient. More home deliveries do not necessarily mean less efficient deliveries (Visser et al., 2014).

CITYLAB – City Logistics in Living Laboratories
D.2.1 – CITYLAB Observatory of Strategic Developments Impacting Urban Logistics (2017)
106
Figure II.21. The impact on customer density on the average distance per stop in miles per customer Source: based on Boyer, Prud’Homme& Chung, 2009
II.3.3.6 Environmental impacts of delivery services are different according to the land use patterns
Delivery services offer relatively more CO2 reduction benefit in rural areas when compared to CO2 urban areas, and in all cases delivery services offer significant VMT reductions. Delivery services in both urban and rural areas, however, increase NOx and PM10 emissions (Goodchild, 2013).
II.3.3.7 The use of environmental friendly vehicles is influenced by urban charging facilities
The planning of EFVs is significantly influenced by the number and location of fuelling stations (Erdogan and Miller-Hooks, 2012; Kim and Kuby, 2013; Ventura et al., 2015)48. As long as vehicle batteries are not yet sufficient for regular delivery tours (200 kms guaranteed is an estimate for a proper operation of an electric delivery vehicle without the need for charging during operations), the deployment of city charging stations will have an important impact on the deployment of EFVs fleets and their delivery routes.
48Erdogan S., Miller-Hooks E., 2012, A green vehicle routing problem. Transp. Res. E 48, 100–114.
Kim J.G., Kuby M., 2013. A network transformation heuristic approach for the deviation flow refueling location model.Comput.Oper. Res. 40, 1122–1131. Ventura J.A., Hwang S.W., Kweon S.J., 2015.A continuous network location problem for a single refueling station on a tree.Comput.Oper. Res. 62, 257–265.

CITYLAB – City Logistics in Living Laboratories
D.2.1 – CITYLAB Observatory of Strategic Developments Impacting Urban Logistics (2017)
107
II. 3.4 Delivery options in urban, suburban and rural areas
II.3.4.1 Potential choice of delivery options is the same in urban, suburban and rural areas
Home delivery and the PP model are used in urban, suburban and rural areas.
Rural e-consumers' accessibility to PP sites has reached a viable level. A case study in the Paris Region (Seine et Marne) shows that distances to the nearest PPs vary significantly between urban and rural areas. Nevertheless, access time to the nearest PP is the same (8 mins), by car in rural areas and by foot in urban areas (Morganti et al, 2014).
II.3.4.2 Trends for the development of delivery options depend on the land use
Home delivery services of e-grocery are more developed in urban areas with high population density than in suburban/rural area (Blanquart et al, 2015). This can be explained by the critical mass and higher purchasing power of urban customers who can afford the delivery fees.
PP location is also linked to the density of population. Urban areas have larger numbers of PPs than exurban/rural areas. Moreover, PP density in remote areas decreases faster than population density (Morganti et al, 2014). And in suburban and rural areas, PPs are more likely to be located in the centre and main commercial districts.
Figure II.22. Disparities between urban and rural areas (Seine et Marne, part of the Paris Region, case study) Source: Morganti et al., 2014
The location of PPs in higher density areascanbe explained by two factors: the capacity of each PP to handle a certain number of clients and the access time to PPs. To be profitable, each PP needs to have a sufficientnumber of clients but its capacity is limited. Thus, there are more PPs in urban areas than in rural areas. In exurban/rural areas, PPsaremostly located in main commercial districts with higher numbers of visitors and residents.
II.3.4.3 Preference for delivery options is different according to the land use
A case study in the Paris Region (Seine et Marne) shows that PPs are over-represented in urban areas in comparison with their share of the population. This results in a reduced accessibility to PPs for rural populations, and may contribute to explaining a marked higher preference for home deliveries in rural areas (Morganti et al, 2014).
CITYLAB – City Logistics in Living Laboratories
D.2.1 – CITYLAB Observatory of Strategic Developments Impacting Urban Logistics (2017)
108
II.3.4.4 Instant delivery will be more popular in mega cities
The competition of e-commerce in urban areas is moving to instant delivery with e-retailers proposing one-hour, two-hour, or same-day deliveries (e.g., as seen above, Amazon offering same-day delivery as well as the possibility to order more than 25,000 eligible items and get free delivery within one to two hours).
II.3.4.5 Click-and-collect grow faster than home delivery
The ‘click and collect’ model is expectedto become more significant in developed markets as online retail expands and consumers increasingly opt for the convenience of collection.
It has emerged as a solution for home delivery failure.
The number of click-and-collect locations in Europe was about half a million in 2015, according to Deloitte. This would be a twenty percent increase on the previous year.
Figure II.23. Click-and-collect expected increases in Europe Source: Deloitte
For example, the volume of UK non-food sales made via the internet for collection at store will increase by 33 million parcels this year, on a par with the increase in units for home delivery at 36 million, the Financial Times reported (A. Felsted, April 21, 2014). The growth in the volume of units ordered online but collected in store is forecast to overtake that for home delivery for the first time in 2015, rising by 53 million parcels year on year.
II.3.4.6 The type of delivery solutions depends on consumers’ habit
For example, collection points are particularly popular in France and Netherlands while in the UK, Germany and US home delivery is much more appreciated (Foresight, 2000, 2001; Browne, 2001; Nemoto et al., 2001; FernieandMcKinnon, 2003, 2004; McKinnonandTallam, 2003; McLeod et al., 2006; Blanquart et al, 2015).

CITYLAB – City Logistics in Living Laboratories
D.2.1 – CITYLAB Observatory of Strategic Developments Impacting Urban Logistics (2017)
109
In France, pickup points (PP) as alternatives to home delivery represent a fast-growing solution, accounting for about 20% of parcel deliveries to households (Morganti et al, 2014). The French system of point relais (reception-points) has atypical features, such as its early development, which began 30 years ago to manage mail-order deliveries, and the large number of players, with different shareholding structures (Morganti et al, 2014).
Figure II.24. Rise of click-and-collect per country Source: comScore
II.3.4.7 More home delivery means higher failed delivery
Home deliveries raise concerns aboutthe ‘not-at-home’ problem, which leads to high delivery failure and empty trip rates. As home delivery increases, so does the number of failed deliveries.
Many parcels do not fit through mail boxes or require consignee signature, which implies that customers need to be at home when the parcel is delivered.
However, often consumers are not at home when a package is delivered, which leads to increased delivery cost as the packages need to be redelivered or returned to the sender.
IMRG (2006) estimated that the direct costs of failed deliveries in 2006 in the UK were €682 million.
II.4 Conclusion on e-commerce
Consumption patterns as well as consumer behaviour play a decisive role in terms of urban freight transportation. E-commerce in the future will lead to even reinforced impacts for urban freight transportation. We can summarize the major trends, as follow, both in terms of freight traffic and land use.
The growth of e-commerce revenue results in higher parcels volume. But the growth rate of urban freight traffic is lower than the growth rate of e-commerce sales.
CITYLAB – City Logistics in Living Laboratories
D.2.1 – CITYLAB Observatory of Strategic Developments Impacting Urban Logistics (2017)
110
Intant delivery is developed in urban ereas, supported by new business models and innovative solutions. However, it is much limited to foods and grocery delivery.
We summarize below the factors that could influence, positively or negatively, urban traffic:
Elements that could increase urban traffic Elements that could decrease urban traffic
Instant delivery (except for grocery if previously made by car)
High population density
High return rate High substitution with shopping trips
Low substitution with shopping trips Rise of e-grocery (=substitution with shopping trips if previously made by car)
Many failed deliveries Instant deliveries for e-grocery (= substitution with shopping trips if previously made by car)
High density of pick-up points in urban centres
In terms of logistics land uses, the trends that most require observation are the following:
- Demand for pick up points in city centres - Demand for small sortation centres close to/in urban areas for instant deliveries - Logistic sprawl of large e-commerce fulfilment facilities - Emerging demand for urban infill centres and small space warehouse

CITYLAB – City Logistics in Living Laboratories
D.2.1 – CITYLAB Observatory of Strategic Developments Impacting Urban Logistics (2017)
111
III. Service trips
Jens Klauenberg
III.1 Introduction
The aim of this section is to develop a basis of reliable information on ‘service traffic’ (defined below). Service traffic is difficult to measure through normal transport surveys and statistics. Thus we have to build methodical bridges to understand service traffic properly. The interest in service traffic is explained by the role it plays in traffic at all. In Germany service traffic accounts for 40% of commercial transport and more than 10% of all traffic in terms of kilometres travelled.
To reach the aim of this section, we need to answer the following questions:
Which share does service traffic have in traffic at all as well as in commercial transport?
What is the volume of service traffic in terms of trips and kilometres travelled?
Where and by whom is service traffic generated?
What are the influencing factors for the pattern of service traffic (mode and spatial distribution)?
How can we set up a proper observatory to get detailed information on service traffic and its stakeholders?
To answer these questions the section is structured as followed: First of all we define service trips and discuss characteristics that help to identify service traffic. We then discuss relevant objects and classifications for the analysis of service traffic. Following this we give some notes on other related surveys and studies in Europe. Thereafter this we present the main data source we are using for the analysis of service traffic – the German study Motor vehicle traffic in Germany 2010 / Kraftfahrzeugverkehr in Deutschland 2010 (KiD 2010) (see Wermuth et al. 2012). KiD 2010 is a reliable basis for the analysis of service traffic. At the moment in Europe there is no other source of information that gives more insight than that. The main part of this section is an in-depth analysis of the KiD 2010. Following this we will discuss factors that are influencing service traffic. We will close this section by learnings concerning the analysis and observation of service traffic.
Our analysis will help to set up an observatory for freight distribution and service traffic. We will provide more detailed understanding on the rationale behind service traffic and the possibilities to reduce, combine, or manage these trips in other ways.
III.1.1 Definition of service traffic
In this subsection we will give an insight into the definition of service traffic. Furthermore we will show examples, possible trip patterns and decision factors of service traffic.
Transport can be differentiated according to the nature of the carried object and is connected to the purpose of the journey. As shown in Figure III.1 it is in general subdivided in immaterial and material traffic. The latter can be further subdivided into passenger transport and freight transport. Commercial transport includes parts of passenger transport as well as of freight transport. It subdivides into commercial freight transport, service trips and business trips. Commercial freight transport is commercially induced transport of goods on own account or for hire and reward. Business trips are trips undertaken for work or business purposes. They

CITYLAB – City Logistics in Living Laboratories
D.2.1 – CITYLAB Observatory of Strategic Developments Impacting Urban Logistics (2017)
112
do not include regular commuting between home and the workplace. Rather, these trips are private traffic. Causes for business trips are visiting customers or suppliers, meetings at other company locations, attending congresses as well as marketing and promoting trips. The given distinction helps to separate service trips from other trip purposes. To define service trips we have to distinguish them from freight transport and business trips on the one hand. On the other hand we have to define economic services which may induce trips (Steinmeyer 2004). Service trips are trips in commercial traffic induced by service-oriented activities. Usually travel expenses for service trips are payed by the employer. This is the case for commercial transport in general.
Figure III.1. Classification of traffic and transport (translated from FGSV 2016)
An economic service is a transaction in which no physical goods are exchanged between supplier and receiver. It is a type of economic activity that is intangible. It cannot be stored and does not result in ownership. Services are normally consumed at the point of sale (Menge 2011).
Service traffic includes all trips that are triggered by all activities related to economic services. Examples of business-to-business (B2B) services are support for and maintenance of photocopiers, computers, and elevators, security services, services for telephone, gas, electric and water, cleaning of buildings, and catering services with decoration and operation. These kinds of service companies typically drive to their customers to maintain appliances or to deliver services. The connected trips are service trips. In the area of business-to-customer relations (B2C), services are for example the maintenance of gardens, the cleaning of chimney systems and the repair of household appliances. These services can trigger service trips (see Hebes 2011, p.15).
The generation of service trips is very much dependent on the type of economic service activity carried out. Home care services for instance have very different trip patterns as well as areas of destination as consulting activities or activities of craftsmen. There is a high variability in such trips. Furthermore the requirements of such trips are very different.
Following central questions for decisions in traffic generation we can find specialities of service trips. As mentioned before, the generation of trips is very much dependent on the kind of service. The origin is connected to the location of the service company. The destination is connected to the location of the customer where the service is carried out. Even the configuration of trip distribution is very dependent on the type of service carried out. As we can see from surveys and studies the mode choice of service trips is very often related to road transport. This is strongly connected to the main decision-making factors. For service traffic, the main decision criterion is time. Costs play only a secondary role (Guilbault

CITYLAB – City Logistics in Living Laboratories
D.2.1 – CITYLAB Observatory of Strategic Developments Impacting Urban Logistics (2017)
113
et al. 2010). Last but not least the tour patterns of service traffic are very dependent on the type of economic service carried out (Schütte 1997). Tour patterns can be round tour, linear tour or star tours (see Figure III.2).
Figure III.2. Examples of trip patterns (Schneider 2011, p.43)
From the study Mobility in Germany 2008 we can see, that 86% of commercial induced trips are done by motorized individual transport on the road (Follmer et al. 2010, p.121). Knowing this we can use the German study Motor vehicle traffic in Germany 2010 / Kraftfahrzeugverkehr in Deutschland 2010 (KiD 2010) to analyse service trips in the further course.
III.1.2 Relevant objects to analyse service traffic and statistical classifications
To present knowledge on how to detect and observe service traffic we will discuss which objects and which specific economic sectors we should examine.
For analysing service traffic there is the question how to identify relevant economic activities. It is appropriate to rely on the stated trip purpose. For other purposes we need to think about the economic sectors that must to be taken into account. This could be relevant in economic analyses. Furthermore other economic sectors are drivers for the generation of service traffic.
As economic services are related to the seller and the buyer of the service there may be both the economic sector of the seller as well as the economic sector of the buyer of relevance. Furthermore the location of both companies may influence the generation of traffic.
A general question is which object we have to divide for the analysis. As object we can survey the driver, who states the economic sector of his activity. We can analysis the vehicle which is registered to a certain economic sector. Another option is to survey the car owner whose company belongs to a certain economic sector. Furthermore the economic sector of the costumer where a stop is done could be of relevance. Each of the mentioned actors is normally assigned to an economic sector. The analysis of the KiD 2010 gives information on the registration of the vehicle and the stated economic sector of the vehicle owner. There are some differences between these data (Wermuth et al. 2012, p.288). This could be explained be the registration process for the vehicle which is in terms of economic classification not very precise. We thus rely on the economic sector stated by the vehicle owner in the questionnaire.

CITYLAB – City Logistics in Living Laboratories
D.2.1 – CITYLAB Observatory of Strategic Developments Impacting Urban Logistics (2017)
114
In general the classification of economic sectors is in Europe listed in the NACE classification. The Nomenclature statistique des Activités économiques dans la Communauté Européenne, abbreviated as NACE, is the classification of economic activities in the European Union. Various NACE versions have been developed since 1970. NACE is a four-digit classification providing the framework for collecting and presenting a large range of statistical data according to economic activity in the fields of economic statistics (e.g. production, employment and national accounts) and in other statistical domains developed within the European Statistical System (ESS).
There is a broad variety in economic sectors which are relevant in the analysis of the service sector. These sectors may appear at very different levels of statistical classifications as NACE. As an example a list of economic sectors which is relevant for the analysis of industrial added-value processes is given by Schneider (2011). The authors present a table of service groups which were analysed in an empirical survey concerning service trips (see Table III.1). This list is only one example of the variety of services. A lot more services which are not part of the industrial added-value process may be added (Lenz et al. 2006). There is no relation to statistical classifications (e.g. NACE) given for this list of service groups.
Table III.1 List of service groups in industrial added-value processes
No Service groups
1 Research and development (Forschung und Entwicklung)
2 Projection (Projektierung)
3 Assembly (Montage)
4 Maintenance (Instandhaltung: Produktionsmittel/Maschinen)
5 Software development (Softwareentwicklung)
6 Market research (Marketing)
7 Advertisement (Werbung)
8 Procurement (Einkauf/Beschaffung)
9 Sales and distribution (Vertrieb)
10 Consignment (Kommissionierung)
11 Warehousing (Lagerhaltung)
12 Shipping (Versand)
13 Customer training (Kundenschulung)
14 Cleaning (Reinigung)
15 Security service (Sicherheitsdienst/Werkschutz)
16 Cafeteria (Kantine)
17 IT (Datenverarbeitung/IT)
18 Accounting (Rechnungswesen/Buchhaltung)
19 Legal advice (Rechtsberatung)
20 Assurance (Versicherungen)
21 Financial service (Finanzdienstleistung)
22 Consulting (Unternehmensberatung)
23 Financial auditing (Wirtschaftsprüfung/Steuer)
24 Human resource management (Personalwesen)
25 Further education (Weiterbildung/Mitarbeiterqualifizierung)
26 Facility management (Gebäudemanagement)
27 Waste disposal (Abfallentsorgung)
Source: Schneider 2011, p.87

CITYLAB – City Logistics in Living Laboratories
D.2.1 – CITYLAB Observatory of Strategic Developments Impacting Urban Logistics (2017)
115
For the development of an observatory of service traffic we can assume that there is need for discussion on the object which must be observed as well as the classification which may be used for the characterisation of the objects. For the classification of economic sectors the NACE classification is the common standard. For the categorisation of service sectors this classification may not be detailed enough at some point. Furthermore it must be taken into account that services may be provided internal in companies (Menge and Lenz 2008). Therefore a broader range of economic sectors must be considered for the analysis of service traffic. As there will also be the need of comparability with statistics and other studies the linkage to official classification systems may be useful.
III.1.3 Learnings from surveys and studies on service traffic in Europe
Despite intensive search we could identify very few studies and surveys in Europe related to service traffic. In this section we will give an overview on such studies and surveys in Europe. Our main source of information for this section on service traffic – the German survey KiD 2010 (Motor vehicle traffic in Germany 2010 / Kraftfahrzeugverkehr in Deutschland 2010) – will be discussed in the next subsection.
Analysing survey techniques in urban freight transport studies, Allen et al. (2012) identified only two service provider surveys worldwide. The authors show that, in general, studies and surveys on service traffic are quite rare. On the strength of these surveys the authors identified that these studies and surveys obtain data about service provider’s vehicle fleets and its activities, and that such surveys can be especially useful if studying fleet productivity and fuel efficiency. A weakness is that they do not provide the same level of detail about individual vehicle trips and activities as a driver or vehicle observation survey.
A study in Norway on service traffic analysed pathways to sustainable transport among Norwegian Craftsmen and service workers. Reports on this have been published in the year 2016 (Julsrud et al. 2016). The reports result from a study of Norwegian crafts -and service companies (C&S) that have adopted electric utility vehicles (EUVs) and/or mobile management applications (MMAs). The two technologies are believed to be of crucial importance for the development of more efficient and sustainable mobility among such enterprises in the future urban landscapes. MMAs largely affect the travel patterns in the enterprises, but the potential to reduce the amount of travel is currently uncertain.
The case studies of MMA users were conducted with users in a number of enterprises in order to get more insight on implementation and use of MMA tools. One aspect of the study was the question of the potential for reduced driving among craftsmen as a reason for implementation of MMA. Most companies believed MMA would reduce the amount of driving among craftsmen owing to new opportunities for direct re-assignment of work tasks. For example, the craftsmen didn’t always have to go into the office every morning to get their assignments or to report hours used in the field, and there was also the potential for sharing of information between crafts workers. Many craftsmen work alone on assignments, and before the introduction of MMA they had to visit the office to consult with their colleagues and managers.
Still, trying to measure reduced travel resulting from use of MMA was difficult. The one company that had done so during the course of the years before and after the introduction of MMA could not find any reduction in driving (measured by the number of kilometres). Most of the interviewees believed that there was potential for reducing the number of trips to the wholesaler for instance, but few companies reported having realized it. The positive gain of reduced driving in the companies is primarily time-saving.

CITYLAB – City Logistics in Living Laboratories
D.2.1 – CITYLAB Observatory of Strategic Developments Impacting Urban Logistics (2017)
116
Statistics on light duty vehicles sometimes give insight into service traffic but normally they do not focus specifically on service traffic. The Norwegian statistics on light goods vehicles for example has one user category, which is defined by service traffic. The statistics reports on vehicle kilometres, loads, etc. for vans and small trucks. It also distinguishes by type of user (deliveries, craftsmen, passenger transport, etc.) (see SSB 2016).
In the United Kingdom there are publications on one study in Winchester related to service traffic (see Maynard and Cherrett 2009, and Cherrett et al. 2009). The interesting thing about this study is that it reports on goods deliveries and service visits. For Winchester High Street there are about 600 goods deliveries and about 1,000 service visits reported for a typical week. On average each business receives 5.8 goods deliveries and 9.8 service visits per week. It has to be mentioned that the definition for service visits is different to that used in this section. The study on Winchester High Street includes post deliveries and waste collection as services. Post deliveries and waste collection are reported as the most common service visits accounting for 3.3 and 2.4 service visits per week for each business. Furthermore the study analysed dwell times, mode of transport, and vehicles used. The overall mean dwell time across all service categories (including postal deliveries) was estimated at 30 minutes (37 minutes excluding postal deliveries). Services with shorter dwell times are post deliveries, waste collection, laundry, and ancillary. Services with longer dwell times are cleaning, till maintenance, computer services, photocopier maintenance, and lift/escalator maintenance. In terms of mode of transport the study reports that 70% of all service visits are done by motorized transport. It is mentioned that for post deliveries the vast majority (90%) of the business managers said that the post person arrived on foot but that vans are often used to supply post to the area from where final deliveries are made on foot. Thus the share of motorized transport may be higher. Vehicles used are mainly vans followed by passenger cars as the second most used vehicle type.
The study for Winchester High Street is an establishment based survey. In comparison to KiD 2010 it thus gives information on service traffic from another point of view. There is no information given on kilometres travelled and time spent in traffic in the Winchester High Street study while KiD 2010 can give no information on number of service stops per premises.
Nevertheless establishment based analysis as well as vehicle based analysis can give detailed insight in traffic generation and traffic behaviour in service traffic. To combine both kinds of studies could link knowledge ideally. For better observing service traffic it may be helpful to include trips and stop points in tour context. This will enable synthetic tour planning and will lead to a better theory on modelling (Wigan 2002). Furthermore trip chain data could serve as an estimator for service-related traffic. They can give vehicle based as well as establishment based information. This will build up further knowledge on traffic behaviour (Schneider and Wolfermann 2013). A further discussion on this will be given in the summary.
III.1.4 The German survey KiD 2010
In this subsection we will give a short introduction to the German survey KiD 2010. We will explain how it could be used for the analysis of service traffic. Furthermore we will introduce the data set of KiD 2010.
The German survey KiD 2010 (Motor vehicle traffic in Germany 2010 / Kraftfahrzeugverkehr in Deutschland 2010) was prepared and implemented to compensate information gaps in motor traffic statistics (Wermuth et al. 2012). It is a nationwide motor traffic survey which focuses on business traffic and motor vehicles up to a payload of 3.5t. Since vehicles of both commercial and private owners are used for goods and business passenger traffic, the survey had to consider all types of vehicles (Müller 2009).

CITYLAB – City Logistics in Living Laboratories
D.2.1 – CITYLAB Observatory of Strategic Developments Impacting Urban Logistics (2017)
117
The underlying survey concept of KiD 2002 (preceding study to KiD 2010) was to consider the vehicle day as a survey item. The central vehicle register of the Federal Office for Motor Traffic was used as sampling source. The same methodological approach was applied for KiD 2010. Thus KiD 2010 is based on the resident concept. The survey is conceived as a written postal survey for a defined reference date. The questionnaire has the form of a diary.
Vehicles of commercial owners account for a major portion of business traffic, but vehicles of private owners are also used for official/commercial purposes. Thus a complete and extensive analysis of business traffic should consider all types of vehicles and all groups of owners. For reasons of research efficiency it was decided that KiD 2002 and KiD 2010 should concentrate on vehicle groups 1) frequently used for business traffic purposes and 2) for which little information is available compared to their contribution to the transport sector. Rather than concentrating on vehicle groups that are already represented in other surveys KiD 2002 and KiD 2010 had a clear focus on passenger cars and light duty vehicles (Wermuth et al. 2006).
The KiD 2010 is a study with a unique design in terms of recording commercial transport and service trips. Data from MiD 2008 tell us, that the majority of service traffic is done in road transport. Therefore KiD 2010 is a good tool to get information on service trips in Germany (Follmer et al. 2010).
The general set of questions in KiD 2010 asks for vehicle- and owner-specific data, which are not available from the central vehicle register, or, if so, not with the required detail. This concerns questions on:
• Location of the vehicle
• Use as a leased or rented vehicle
• Sector of industry of the owner or the main user
• Company size, number of staff, or persons of the household
• Vehicle fleet of owner, and
• Vehicles taken off the road.
Furthermore the participants had to fill in a travel diary, in which the vehicle movements were to be recorded for a defined reference date. For the travel diary, the users had to enter the following criteria for the first eleven trips (or parts of a trip):
• Address and kind of starting point • Time when started • Purpose of trip • Type of load carried • Gross weight of load • Type of goods • Number of people in the vehicle • Use of a trailer/semi-trailer • Address and kind of destination • End of trip, and • Distance travelled.
These basic data can be characterised by the following features:
• Type of vehicle • Type of owner • Type of district of owner address • Type of weekday, and
CITYLAB – City Logistics in Living Laboratories
D.2.1 – CITYLAB Observatory of Strategic Developments Impacting Urban Logistics (2017)
118
• Sector of industry according to details given in the questionnaire
KiD 2010 contains about 70,000 records on single vehicle days. The study includes factors for extrapolation which allows for estimating the vehicle usage of the whole vehicle stock in Germany. All together there are about 50.2m vehicles in the German vehicle stock.
As reported by KiD 2010 the vehicles in Germany conducted in the year 2010 more than 42bn trips. Each vehicle conducts on average 2.26 trips per day.
A basic evaluation of KiD 2010 remained limited to the characteristics that permit an explanatory description to be given for business traffic and thus serve as a basis for more detailed in-depth analysis.
The characteristics used in the basic evaluation are the following average figures that relate to one day:
• Number of vehicles forming part of the parent population • Number of mobile vehicles • Number of people transported • Number of tonnes transported • Number of trips • Number of chains of trips • Trip frequency per vehicle • Trip chain frequency per vehicle • Road performance per vehicle • Passenger transport performance per vehicle • Goods transport performance per vehicle • Duration of traffic involvement per vehicle
In the following subsection we will use the data of KiD 2010 to characterise service traffic in Germany.
III.2 In-depth analysis of the German survey KiD 2010 on service traffic
In this subsection we will give information on service traffic in Germany related to the share of service trips in traffic as well as on typical daily trip numbers. Both analyses will be done with separations on vehicle types, economic sectors, and spatial types. This allows us on the one hand to characterise service trips in Germany and on the other hand to gather more information on suitable study and survey designs to set up an observatory on service trips.
III.2.1 Share of service traffic in Germany
In this part of the analysis we will show to which extend service traffic is part of daily traffic on roads in Germany. First of all we will give an overview on the share of service traffic in general. Following this we will split up the analysis by vehicle types, economic sectors and spatial types. The analyses will be done in terms of trips made as well as in terms of kilometres travelled.
Extrapolating the reported trips in KiD 2010 on all vehicles registered in the German vehicle registered and on one whole year, a trip volume of about 42bn trips is reported in KiD 2010 for the year 2010. The share of commercial traffic on these trips is 36% (see Figure 3).

CITYLAB – City Logistics in Living Laboratories
D.2.1 – CITYLAB Observatory of Strategic Developments Impacting Urban Logistics (2017)
119
Figure 3: Share of trips in private traffic and commercial traffic in Germany
The share of service traffic in the reported commercial traffic is 42% (see Figure III.4). Accordingly the share of service traffic in all reported trips is 11.8%.
Figure III.4. Share of trip purposes in commercial traffic in Germany
In terms of kilometres travelled, commercial traffic has an overall share of 28% on the reported traffic in KiD 2010 (see Figure III.5).
Figure III.5. Share of kilometres travelled in private traffic and commercial traffic in Germany
The share of service traffic in commercial traffic is 43% (see Figure III.4). Accordingly the share of service traffic in terms of kilometres travelled is 19.9%.
Figure III.6. Share of kilometres travelled of trip purposes in commercial traffic in Germany

CITYLAB – City Logistics in Living Laboratories
D.2.1 – CITYLAB Observatory of Strategic Developments Impacting Urban Logistics (2017)
120
As the share of commercial traffic is higher in terms of trips than in terms of kilometres travelled it can be deduced that trips in commercial transport are in general shorter than on average in all traffic. The higher share of service traffic in terms of kilometres travelled than in terms of trips shows that usually the trip length in service traffic is on average higher than in traffic at all.
In the following analysis we will focus on passenger cars, light duty vehicles, heavy duty vehicles, and semi-trailers as they are the vehicles which are mainly used in commercial transport and in service traffic. Furthermore the dataset was adjusted for statistical outliers. The mentioned vehicle types account for 96% of all traffic in terms of trips and kilometres travelled.
Analysing the four mentioned vehicle types we can see that the majority of these vehicles are passenger cars (95%, see Figure 7). Small lorries have share of 4%, but conduct 10% of all trips and travel 6% of all kilometres.
Figure III.7. Share of trips by trip purpose and vehicle class
As can be seen from Figure III.8 the share of service traffic is nearly 20% for light duty vehicles. For passenger cars the share is about 7%. As there are a lot of trips with passenger cars done in private passenger traffic (75%), we did separate this from commercial traffic. As a result we can see that the share of service traffic with passenger cars is 60% when only commercial traffic is taken into account.
The share of service traffic for the four analysed vehicle types together is 8%.

CITYLAB – City Logistics in Living Laboratories
D.2.1 – CITYLAB Observatory of Strategic Developments Impacting Urban Logistics (2017)
121
Figure III.8. Share of trips by trip purpose and vehicle class
In terms of kilometres travelled the share of service traffic for light duty vehicles is nearly 40% (see Figure III.9). Passenger cars make 9% of kilometres travelled in service traffic. Again we did separate the trips done in commercial traffic and can see that the share of service traffic with passenger cars is 69% in terms of kilometres travelled when only commercial traffic is taken into account.
Figure III.9. Share of mileage by trip purpose and vehicle class
Analysing the vehicle types which are used for service traffic we can see that the vast majority of service traffic is done by passenger cars and light duty vehicles (see Figure III.10). Light duty vehicles account for 25% of all service trips and 17% of kilometres travelled in service traffic.

CITYLAB – City Logistics in Living Laboratories
D.2.1 – CITYLAB Observatory of Strategic Developments Impacting Urban Logistics (2017)
122
Figure III.10. Share in service traffic per vehicle type
The Construction sector (NACE F) has a share of 16% in all service trips (see Table III.2). Other economic sectors with high shares in total service trips are Human health and social work activities (NACE Q, 15.5%). In this economic sector every second trip is done as service trip. There are 10% out of all service trips done with vehicles registered for private persons.
Table III.2 Share in service traffic by sector on trips and kilometres travelled
NACE sector
Name of the NACE sector Share in service traffic in trips
Share in service traffic in mileage
A Agriculture, forestry and fishing 2.6% 1.3%
B Mining and quarrying 0.3% 0.4%
C Manufacturing 7.4% 15.1%
D Electricity, gas, steam and air conditioning supply
2.2% 1.3%
E Water supply; sewerage, waste management and remediation activities
2.0% 1.2%
F Construction 16.4% 18.1%
G Wholesale and retail trade; repair of motor vehicles and motorcycles
9.3% 12.6%
H Transportation and storage 3.7% 2.4%
I Accommodation and food service activities 1.5% 0.6%
J Information and communication 1.9% 2.5%
K Financial and insurance activities 2.1% 3.0%
L Real estate activities 1.1% 0.5%
M Professional, scientific and technical activities
5.8% 15.7%
N Administrative and support service activities 3.6% 5.1%
O Public administration and defence; compulsory social security
4.1% 1.7%
P Education 3.5% 0.9%
Q Human health and social work activities 15.5% 3.9%
R Arts, entertainment and recreation 0.1% 0.1%

CITYLAB – City Logistics in Living Laboratories
D.2.1 – CITYLAB Observatory of Strategic Developments Impacting Urban Logistics (2017)
123
S Other service activities 6.2% 5.1%
U Activities of extraterritorial organizations and bodies
0.0% 0.0%
V Privately registered vehicles 10.5% 8.3%
The Construction sector (NACE F) has the highest share of kilometres travelled in service traffic (18.1%). Other economic sectors with high shares in terms of kilometres travelled in total service traffic are Professional, scientific and technical activities (NACE M, 15.7%), the Manufacturing sector (NACE C, 15.1%), and the Wholesale and retail trade sector (NACE G, 12.6%). In terms of kilometres travelled 8.3% of all service traffic is done with vehicles registered for private persons.
Comparing different spatial types in Germany we can see that the share of service traffic is between 5.7% in Dense areas near agglomeration areas and 13.7% in Rural areas of lower density (see Table III.3).
High shares of service traffic are done in City centre areas in agglomeration areas (21.4%), in Dense areas near urbanized areas (19.0%), and in Highly dense areas in agglomeration areas (17.4%).
Table III.3 Share of trips by trip purpose and spatial type
Spatial type Passenger Transport [trips]
Freight Transport [trips]
Service Traffic [trips]
Other Traffic [trips]
City centre areas in agglomeration areas
66.8% 19.1% 10.7% 3.4%
Highly dense areas in agglomeration areas
81.8% 10.5% 7.1% 0.6%
Dense areas near agglomeration areas
66.0% 10.3% 5.7% 18.0%
Rural areas near agglomeration areas
76.5% 13.0% 8.0% 2.5%
City centre areas in urbanized areas
71.9% 15.6% 10.9% 1.6%
Dense areas near urbanized areas
79.3% 10.8% 8.0% 1.9%
Rural areas near urbanized areas
76.1% 16.3% 6.0% 1.6%
Rural areas of higher density
76.1% 12.8% 9.1% 2.0%
Rural areas of lower density
66.2% 16.8% 13.7% 3.3%
Other areas 98.4% 0.0% 0.4% 1.2%
Total number of trips 26,383m 4,737m 2,937m 1,176m
In terms of kilometres travelled the share of service trips is the highest in City centre areas in urbanized areas (15.1%) (see Table III.4). The lowest share of service traffic in terms of kilometres travelled is observed in Condensed areas near agglomeration areas (7.2%).
Similar to the analysis in terms of trips, we can see for the analysis in terms of kilometres travelled, that high shares of service traffic is done in City centre areas in agglomeration

CITYLAB – City Logistics in Living Laboratories
D.2.1 – CITYLAB Observatory of Strategic Developments Impacting Urban Logistics (2017)
124
areas (21.7%), Highly condensed areas in agglomeration areas (19.7%), and Condensed areas near urbanized areas (18.7%).
Table III.4 Share of mileage by trip purpose and spatial type
Spatial Type Passenger Transport [km]
Freight Transport [km]
Service Traffic [km]
Other Traffic [km]
Total mileage
City centre areas in agglomeration areas
78.8% 6.6% 13.1% 1.5% 111,139m
Highly condensed areas in agglomeration areas
80.7% 8.0% 10.7% 0.6% 123,415m
Condensed areas near agglomeration areas
76.4% 7.4% 7.2% 9.0% 54,318m
Rural areas near agglomeration areas
80.1% 7.9% 10.5% 1.6% 24,908m
City centre areas in urbanized areas
77.4% 6.2% 15.1% 1.3% 34,539m
Condensed areas near urbanized areas
81.1% 8.0% 9.1% 1.8% 137,957m
Rural areas near urbanized areas
84.1% 7.4% 7.6% 0.9% 73,561m
Rural areas of higher density
77.8% 10.0% 10.9% 1.3% 55,504m
Rural areas of lower density
76.4% 10.0% 11.3% 2.4% 29,758m
Other areas 98.8% 0.1% 0.2% 0.8% 1,563m
Total mileage 516,581m 50,287m 67,072m 12,722m 647,968m
The analysis of service traffic concerning used vehicles, commercial sectors and spatial types shows, that mainly light duty vehicles and passenger cars are used for service traffic. An observatory on service traffic must take into account these two vehicle types in general. Service traffic are done with high shares in Construction (NACE F), Human health and social work activities (NACE Q), Professional, scientific and technical activities (NACE M), Wholesale and retail trade (NACE G), and Manufacturing (NACE C). Studies and surveys on service traffic that should contribute to the observatory must concentrate on these economic sectors. There are no big differences in the share of service traffic for different spatial types. Thus a special focus on spatial types in the observatory is not necessarily needed.
III.2.2 Characteristics of service traffic in Germany
Additional to the analysis of the share of service traffic we will show how service traffic is characterised according to the German study KiD 2010. As done before we will conduct this analysis concerning different vehicle types, economic sectors, and spatial types.
Vehicles used for service traffic make on average 3.2 service trips per day (see Table III.5). On average vehicles travel 73.8 kilometres while doing service trips. The average number of trips for light duty vehicles and heavy duty vehicles is slightly higher. For semi-trailers this number is slightly lower. The average trips length for passenger cars, light duty vehicle, and heavy duty vehicle is about 20 kilometres; whereas kilometres travelled for service traffic done with semi-trailers are more than four times higher.

CITYLAB – City Logistics in Living Laboratories
D.2.1 – CITYLAB Observatory of Strategic Developments Impacting Urban Logistics (2017)
125
The reported average weight transported is in accordance with the size of the vehicles. On average goods and tools with a weight 8.0 kilograms are transported with passenger cars.
Table III.5 Characteristics of daily behaviour for service traffic by vehicle type
Vehicle type Avr. nr. of trips per day for service traffic
Avr. trip length for service traffic [km]
Avr. tour length per vehicle and day [km]
Avr. weight transported per vehicle and day [kg]
Passenger cars
3.0 25.1 75.6 8.0
Light duty vehicle
4.2 15.7 65.5 126.3
Heavy duty vehicle
3.9 18.8 72.9 1,332.5
Semi-Trailer 2.4 90.1 211.9 4,093.8
All vehicles 3.2 22.8 73.8 43.9
Analysing the number of trips in service traffic per economic sector we can see that there are different trip patterns. The Education sector with 13.3 trips per day has unusually high numbers of trips. As we have seen before, this sectors accounts for only 0.9% of all service trips. Economic sector with high shares in service trips (NACE C, F, G, M) make between 2.5 and 3.2 trips per day on average. The average trip length in these economic sectors varies between 25 kilometres and 62 kilometres. Accordingly daily tour length varies between 69 kilometres and 200 kilometres. The Human health and social work activities sector (NACE Q) has slightly higher trip rates (6.1 per day). In contrast the average trip length is very low (5.7 kilometres) and the average daily tour length is low at 35 kilometres.
Table III.6 Characteristics of daily behaviour for service traffic by business sector
Business sector (NACE) Avr. nr. of trips per day for service traffic
Avr. trip length for service traffic [km]
Avr. tour length per vehicle and day [km]
Avr. weight transported per vehicle and day [kg]
A Agriculture, forestry and fishing 2.7 11.7 31.1 23.5
B Mining and quarrying 5.4 27.0 145.8 738.2
C Manufacturing 2.5 46.6 115.9 26.1
D Electricity, gas, steam and air conditioning supply
4.9 13.4 65.8 66.9
E Water supply; sewerage, waste management and remediation activities
5.7 14.0 79.6 92.8
F Construction 2.7 25.1 68.6 95.9
G Wholesale and retail trade; repair of motor vehicles and motorcycles
3.6 30.9 112.1 36.0
H Transportation and storage 5.9 14.6 86.4 291.9

CITYLAB – City Logistics in Living Laboratories
D.2.1 – CITYLAB Observatory of Strategic Developments Impacting Urban Logistics (2017)
126
I Accommodation and food service activities
8.9 9.8 87.2 62.6
J Information and communication 3.4 29.7 102.1 34.0
K Financial and insurance activities 1.9 32.5 61.0 0.4
L Real estate activities 3.8 10.4 39.8 20.2
M Professional, scientific and technical activities
3.2 62.3 199.9 17.7
N Administrative and support service activities
3.3 32.1 106.3 77.5
O Public administration and defence; compulsory social security
6.4 9.5 60.8 89.2
P Education 13.3 6.0 79.7 6.3
Q Human health and social work activities
6.1 5.7 34.9 5.8
R Arts, entertainment and recreation 2.2 41.6 92.2 177.0
S Other service activities 5.2 18.8 97.0 40.3
U Activities of extraterritorial organisations and bodies
3.2 26.0 84.1 1.8
V Privately registered vehicles 1.5 18.0 26.4 2.1
Concerning the spatial type we can see that the highest average trip rate per day in service traffic is observed in highly condensed areas in agglomeration areas (5.2 trips per day). The lowest average trip rate per day is observed in rural areas near urbanized areas (1.6 trips per day). The average trip length varies between 16 kilometres and 26 kilometres per trip. The average tour length is lower in rural areas and higher in agglomeration areas.
Table III.7 Characteristics of daily behaviour for service traffic by spatial type
Spatial type Avr. nr. of trips per day for service traffic
Avr. trip length for service traffic [km]
Avr. tour lenght per vehicle and day [km]
Avr. weight transported per vehicle and day [kg]
City centre areas in agglomeration areas 3.6 23.2 84.6 48.6
Highly condensed areas in agglomeration areas
5.2 25.8 133.9 67.9
Condensed areas near agglomeration areas 4.2 22.5 94.0 46.1
Rural areas near agglomeration areas 4.4 24.8 109.0 55.0
City centre areas in urbanized areas 3.5 26.1 91.8 20.1
Condensed areas near urbanized areas 2.8 22.6 64.3 47.2
Rural areas near urbanized areas 1.6 24.8 40.2 19.2
Rural areas of higher density 3.4 18.5 63.0 66.0
Rural areas of lower density 2.5 16.0 39.9 26.1
Other areas 0.4 11.1 4.6 -

CITYLAB – City Logistics in Living Laboratories
D.2.1 – CITYLAB Observatory of Strategic Developments Impacting Urban Logistics (2017)
127
The analysis of the Germany study KiD 2010 has shown that service traffic accounts for 11.8% of all traffic in terms of trips and for 19.9% in terms of kilometres travelled. Vehicles used for service traffic conduct on average per day 3.2 service trips with an average trip length of 22.8 kilometres. Accordingly the daily tour length in service traffic is on average 73.8 kilometres. We can observe differences in terms of vehicle types, economic sectors and spatial types.
III.2.3 The role of companies in service traffic
The analysis of the German study KiD 2010 gives information on the share of service traffic as well as basic information on trip patterns. But it is still unclear what influences these patterns. To close this gap of knowledge the dissertation of Paul Hebes (2011) utilizes the data set of KiD 2002 (preceding study to KiD 2010) and the empirical study „Service-Related Traffic‟. The findings of Hebes allow enhanced commercial transport- and service-related traffic modelling and facilitate urban transport planning and direction. In this subsection we will summarize the findings of Paul Hebes and explain influencing factors on service traffic.
The empirical results of Hebes show that four typical travel patterns can be differentiated. Against the background of service-related traffic there are on the one hand vehicles which are characterized by only a few stops and little road performance per day. On the other hand many cars visit numerous customers and participate a lot in traffic. Statistical analyses also prove that travel patterns differ, depending on an exclusive business or a permitted private use of corporate vehicles.
The calculation of multivariate regression models by Hebes shows that four corporate factor groups, namely internal structures and internal processes as well as external structures and external processes, play a role in travel behaviour. This means that company-related factors, especially corporate structure, are decisive for corporate vehicles’ travel patterns.
In detail Hebes shows that the four corporate factor groups are connected to service traffic generation. Empirical results on the connection between external factors of the corporate factor groups and endogenous factors are shown in Table III.8.
Table III.8 Factor model for the explanation of traffic generation in service traffic
Corporate factor group External factor Endogenous factor
Economic sector Trip purpose, destination, mileage
Size of company mileage
Location of company number of trips
Number of business units number of trips, mileage
Internal processes Decision-making authority regarding modal choice
mileage
Decision-making criteria regarding modal choice
mileage, trip purpose, destination
Utilisation directives for company vehicles
Trip purpose
Use of corporate mobility number of trips

CITYLAB – City Logistics in Living Laboratories
D.2.1 – CITYLAB Observatory of Strategic Developments Impacting Urban Logistics (2017)
128
management
Internal route and trip planning (incl. ICT application)
mileage
External structures Number of clients Destination, number of trips
Client locations mileage
External processes Provision of services Destination, number of trips
Forms of communication and collaboration with Clients (incl. ICT application)
mileage, number of trips
Source: Hebes 2011, p.212
Seven factors are associated with at least two behavioural variables, the remaining six with one. This shows, on the one hand, that companies play a role in traffic behaviour in service traffic. On the other hand, it can be seen that different behavioural variables cannot be considered completely detached from each other. The summary of the results of the four factor groups reveals that the driving performance (mileage) most frequently (9 times) depends on exogenous factors. The exogenous factors play the second most important role in the number of trips (6 times), followed by the driving time (4 times) and the trip purpose (3 times).
We can summarize, that companies play an important role in service traffic behaviour in many ways. This is demonstrated by the relevance of the four factor groups and demonstrated by the empirically proven role of 13 exogenous factors. The entrepreneurial processes, however, seem to represent a size derived from corporate structures, which have a limited impact on traffic behaviour. The results of the work of Hebes suggest that the internal and external structural factors are decisive for the traffic behaviour in service traffic.
Knowing about the influence of companies in service traffic helps to understand relations between company characteristics and traffic generation. But the link to suitable policy measures for the sustainable development of urban transport is still missing. Further efforts are needed to identify proper ways for the possibility to influence service traffic generation.
In city logistics as in freight transport in general the strategy of avoid-shift-improve is seen as a possibility to reach the goal of achieving sustainable traffic generation: avoiding unnecessary trips by an improved and efficient transport system; shifting transport from the most energy consuming urban transport mode (i.e. road transport) towards more environmental friendly modes; improve vehicle and fuel efficiency as well as optimization of transport infrastructure (Nakamura and Hayashi, 2013). In the last mile distribution the strategy of avoid-shift-improve can be realized by the following measures: (i) trips can be reduced by a consolidation of deliveries (Browne et al, 2005); (ii) transport can be done by rail or inland waterway (Santos et al, 2010) or (iii) the location of logistics hubs could be improved (Hesse and Rodrigue, 2004).
As there are similarities in the economic background of traffic generation in commercial traffic in general and service traffic in particular the strategy of avoid-shift-improve could be applied to service traffic as well. But as in commercial traffic, the premise will be not to avoid traffic rather to improve traffic. As there is always an economic reason behind service traffic it will not be possible to avoid service trips at all. But there is room for improvements. The common strategies in commercial transport to use advanced vehicle technology, shift

CITYLAB – City Logistics in Living Laboratories
D.2.1 – CITYLAB Observatory of Strategic Developments Impacting Urban Logistics (2017)
129
traffic temporal as well as consolidate trips should be used to enhance service traffic. Understanding the generation of service traffic, we will be able to give better information on how to influence service traffic in a sustainable manner.
III.3 Summary: What to learn from the analysis of service trips and service traffic?
The aim of this section was to develop a basis of reliable information on service traffic. With the help of data of the German study Motor vehicle traffic in Germany 2010 / Kraftfahrzeugverkehr in Deutschland 2010 (KiD 2010) we could show that the share of service traffic in traffic at all in Germany is 11.8% in terms of trips and 19.9% in terms of kilometres travelled. The share of service traffic in commercial transport is 42% in terms of trips and 43% in terms of kilometres travelled.
Service trips are mostly done with passenger cars and light duty vehicles. Economic sectors with high shares in total service trips are Construction sector (NACE F) and Human health and social work activities (NACE Q). Out of all service trips 10% are done with vehicles registered for private persons. Economic sectors with high shares in terms of kilometres travelled in total service traffic are the Construction sector (NACE F), Professional, scientific and technical activities (NACE M), the Manufacturing sector (NACE C), and the Wholesale and retail trade sector (NACE G). In terms of kilometres travelled 8.3% of all service traffic is done with vehicles registered for private persons.
High shares of service traffic are done in city centre areas in agglomeration areas, in dense areas near urbanized areas, and in highly dense areas in agglomeration areas. In terms of kilometres travelled high shares of service traffic is done in city centre areas in agglomeration areas, highly condensed areas in agglomeration areas, and condensed areas near urbanized areas.
Vehicles used for service traffic make on average 3.2 service trips per day. On average vehicles travel 73.8 kilometres while doing service trips. Number of trips and kilometres travelled vary in terms of vehicles used, economic sector and spatial type. Economic sectors with high shares in service trips (NACE C, F, G, M) make between 2.5 and 3.2 trips per day on average. The average trip length in these economic sectors varies between 25 kilometres and 62 kilometres. Accordingly daily tour length varies between 69 kilometres and 200 kilometres. The highest average trip rate per day in service traffic is observed in highly condensed areas in agglomeration areas. The lowest average trip rate per day is observed in rural areas near urbanized areas. The average trip length varies between 16 kilometres and 26 kilometres per trip.
The analysis of the German study KiD 2010 gives no information on the factors influencing the trip patterns of companies in the service sector. Further studies as used by Hebes (2011) can give information on this. The empirical results of Hebes show that there are four typical travel patterns. Following the four identified clusters there are on the one hand vehicles which are characterized by only a few stops and little road performance per day. On the other hand many cars visit numerous customers and participate a lot in traffic. Hebes shows that four corporate factor groups, namely internal structures and internal processes as well as external structures and external processes, play a role in travel behaviour in service traffic.
Our research on other surveys and studies in Europe on service traffic revealed that there are only few of them. Furthermore they are different in terms of definition of service traffic, in terms of spatial coverage and in terms of observed objects. Nevertheless they add further knowledge on trip patterns in service traffic.
To set up a proper observatory on service traffic we need to take identified limitations and learning from our previous analysis into account. Crucial is the question of the observed

CITYLAB – City Logistics in Living Laboratories
D.2.1 – CITYLAB Observatory of Strategic Developments Impacting Urban Logistics (2017)
130
object of studies and surveys on service traffic. Both establishment based analysis as well as vehicle based analysis can give detailed insight into the research topic. Combined studies could link knowledge ideally but often exceeds restrictions set by resources. Ideas for better observing service traffic include the connection of trips and stop point in the tour context. This will enable synthetic tour planning and will lead to a better theory on modelling. Trip chain data could thus serve as estimator for service-related traffic. This will build up further knowledge on traffic behaviour. The vehicle based observation of KiD 2010 is a good basis for the observation of service traffic but background knowledge on the reasons behind the trip patterns are missing. Thus an observation of the behaviour of companies and their whole vehicle fleets is needed. Decision makers need to be asked on the rationales behind vehicle deployment, on determining factors for fleet composition as well as decision-making processes in fleet use. At the moment we are only observing the derived behaviour but do not know anything about the genesis and generation of service traffic. There is no information on choice behaviour. As we have seen from the analysis service traffic is partly done with vehicles registered for private persons. Thus they must be included in any kind of analysis. Furthermore the observation needs to take into account non-road-trips as not all service traffic is done in road transport.
Understanding the generation of service traffic, we will be able to give better information on how to influence service traffic in a sustainable manner. But as in commercial traffic, the premise will be not to avoid traffic rather to improve traffic. As there is always an economic reason behind service traffic it will not be possible to avoid service trips at all. But there is room for improvements. Common strategies in commercial transport are the use of advanced vehicle technology, the temporal shift of traffic as well as the consolidation of trips.
At the moment we cannot determine exactly the difference in service traffic between countries. There are no studies and surveys available which allow a comparison of countries. From the analysis in Germany we can at least see that there are no big differences between different spatial types. Our findings do show relatively homogeneous results on that. The set-up of studies and surveys on service traffic should therefore be coordinated on European level.
Starting point for a better observation of service traffic may be to conduct surveys as KiD 2010 in Germany in other countries on national basis as well. Furthermore this must be enhanced with local or regional establishment based surveys where whole companies and their fleets are included. Such surveys should take into account economic sectors which have been identified as main producers of service traffic. This will provide a solid foundation for the definition of policy measures for the sustainable development of urban transport including service traffic.

CITYLAB – City Logistics in Living Laboratories
D.2.1 – CITYLAB Observatory of Strategic Developments Impacting Urban Logistics (2017)
131
IV. General conclusion and table of impacts
IV.1 General conclusions applying to logistics sprawl and e-commerce
Several conclusions can be drawn from this second version of CITYLAB’s Observatory of strategic developments impacting urban logistics.
The first one relates to logistics facilities. These facilities (in their diversity: warehouses, e-commerce fulfilment centres, distribution centres, cross-dock terminals) are increasing in cities, especially cities of some logistics importance as large consumer markets and/or logistics hubs processing the flow of goods generated by the global economy.
These facilities are generally located in suburban areas, but a new niche market of urban warehouses is emerging.
Another conclusion that can be made following the analysis of logistics sprawl and e-commerce is that there is a potential risk in an increase in freight vehicles in urban areas, increasingly dominated by small-sized vehicles, while medium to large lorries will become relatively less important. These vehicles performing delivery operations are visible in neighbourhoods and at times of day when they were not identified before: residential neighbourhoods, residential building blocks, side streets, in the early evening and on week-ends. Emerging new types of vehicles (clean delivery vehicles, two and three wheelers) are now visible in urban centres. Courier bikes are emerging quickly in the centre of the largest cities.
Innovations in the urban supply chains also include diverse forms of pick-up points and click-and-collect solutions, while the recent but extremely rapid rise in technologies and algorithms supporting instant deliveries brings with it a flourish of new companies connecting customers, suppliers and independent messengers.
The overall impact of these new trends on energy and carbon emission related to urban freight is difficult to assess. Urban freight in general, for the Paris region, brings the following environmental impact: the share of traffic-related CO2, NOx and PM10 due to urban freight is 2.5 times larger than the share of vans and trucks in the regional traffic. The contribution of urban freight to air pollution is larger in the city of Paris. Social costs of air pollution caused by road traffic in general amount to 0.9% of the regional GDP in 2012. Some of the new trends bring more CO2 emissions, such as the relocation of logistics facilities far away in the suburbs, as de-consolidated shipments are delivered to urban consumers and businesses in smaller and more numerous vans. Some trends bring less CO2 emissions, with a rise in cleaner vehicles and innovative solutions such as drop-off/pickup points or bike-supported instant deliveries. Substitution patterns between personal mobility and professional freight mobility can be a good, or a bad, thing for CO2 emissions, depending on the initial circumstances and the way personal shopping was done before online orders.
What is certain is that these changes bring diversity in the urban traffic flow. Instant messengers are using all sorts of transport modes, including foot, bicycles, electrically-assisted cargocycles, motorbikes, and various types of vans and lorries. This can negatively impact traffic management, road safety and conflicts of road uses, congestion, air pollution. Also, the trends we have looked at bring new types of urban jobs, with many unresolved legal issues and poor working conditions in many instances. New types of logistics buildings bring architectural diversity and innovation in cities, but also complaints about noise, aesthetics, as well as congestion and pollution at entrance and exit points.
These environmental and social impacts have been so far poorly documented and researched. Consumers are the main drivers of the changes we have observed, but they are

CITYLAB – City Logistics in Living Laboratories
D.2.1 – CITYLAB Observatory of Strategic Developments Impacting Urban Logistics (2017)
132
also the residents or visitors of urban areas, and for that they carry an important share of the burdens, as well as the benefits, of the new landscape of urban logistics.
In order to better understand the different impacts that logistics sprawl and e-commerce can have on different stakeholders and activities in the future, we have drawn an Impact Table looking at various stakeholders, activities and places impacted by new trends and challenges. This Table is shown in the next sub-section.

CITYLAB – City Logistics in Living Laboratories
D.2.1 – CITYLAB Observatory of Strategic Developments Impacting Urban Logistics (2017)
133
IV.2 Impact Table: impacts of new trends on urban freight mobility and city life
Logistics Sprawl E-commerce
Impacts for stakeholders
City managers (urban planning)
Broader commitment required on logistics regional planning and land use control New thinking about urban warehouses
New thinking (architecture, zoning, economics) about urban e-commerce fulfilment terminals Promote the development of alternative ways to deliver goods (collective parcel boxes in apartment buildings, pick-up points, etc.) Consider the urban mobility of goods in urban planning Create database to analyse e-commerce movements
City managers (transport) Expect increased van traffic on city streets Promote urban warehouses to promote more consolidation and shorter last mile trips
Diversity of residential deliveries bringing increased diversity of last mile vehicles, modes, time windows – traffic heterogeneity Providing for infrastructure to accommodate new types of urban deliveries (bike lanes, charging stations for CNG/electric vans and trucks)
City managers (elected officials)
Logistics activities and warehouses becoming part of the political agenda because of links between smart cities, urban sustainability, urban food policies, circular economy.
Logistics activities becoming part of the political agenda because of links between smart cities, urban sustainability, new consumption trends, labour issues (digital deliveries)
Metro/regional managers Expect more trucks and vans on regional highways Regional planning for logistics facilities and freight infrastructure becoming an issue on the political and technical agenda Small suburban communities dealing with large developers for giant warehouses/logistics parks Regional multimodal infrastructure for freight may become a strategic item
Regional planning for e-commerce logistics facilities becoming an issue on the political and technical agenda Small suburban communities dealing with large developers for giant e-commerce fulfilment centres/logistics parks
Transport companies (small)
Increased distance travelled (and associated costs) between freight terminals where shipments are picked (or delivered), and urban areas where shipments are delivered (or picked)
New markets for urban deliveries - need to assess costs and benefits of residential deliveries, instant deliveries Increased competition from independent couriers connecting to instant delivery apps
Transport companies (large)
Increased distance travelled (and associated costs) between freight terminals where shipments are picked. This may deter large transport companies to operate urban deliveries, outsourcing to smaller transport operators.
New markets for urban deliveries - need to assess costs and benefits of residential deliveries Explore opportunities to promote unattended deliveries and consolidated deliveries at pickup points

CITYLAB – City Logistics in Living Laboratories
D.2.1 – CITYLAB Observatory of Strategic Developments Impacting Urban Logistics (2017)
134
Large transport companies may be interested in more urban warehouses if access to cities becomes more complicated.
Shippers (own account deliveries)
Suburban locations bring benefits in terms of size and national networks connectivity but urban deliveries generate more vehicle-kilometres and associated costs. Overall carbon footprint can worsen. May require eventually to outsource urban transport
The increase in home deliveries will make it important for e-retailers (acting as shippers in this case) eager to develop this market to their customers to out-source deliveries to an adequate urban logistics provider.
Shippers (third party deliveries)
Suburban locations bring benefits in terms of size and national networks connectivity
The increase in home deliveries will make it important for e-retailers (acting as shippers in this case) eager to develop this market to their customers to find adequate urban logistics providers able to develop innovative urban logistics services
Receivers (own account deliveries)
Store supplies will generate more vehicle-kilometres and associated costs To find a solution to increased costs, receivers may need to turn to out-sourced delivery providers, or increase their inventory in the store to reduce the frequency of deliveries.
The increase in home deliveries will make it important for urban store owners eager to home-deliver their customers to out-source deliveries to an adequate urban logistics provider.
Receivers (third party deliveries)
May bring less reliability on deliveries May bring higher costs (unlikely)
The increase in home deliveries will make it important for urban store owners eager to develop home deliveries towards their customers to out-source deliveries to an adequate urban logistics provider. They may look for providers able to develop innovative urban logistics services
Real estate developers Need to have a close overview of the evolution of land availability in the region May need to think about implementing freight villages and multi-story logistics facilities in suburban communities
Accommodation of large e-commerce fulfilment centres in metropolitan areas Need to have a close overview of the evolution of land availability in the region New urban warehouse markets?
Other stakeholders Public authorities and agencies (rail infrastructure managers, Department of Defence, airport authorities, utilities…), may be owners of large land parcels in urban areas that can be converted into urban logistics facilities. Industrial brownfields – new commercial brownfields – logistics brownfields
Alternative delivery solutions such as pickup points need to be further embraced by final consumers as a mean to alleviate impacts of residential deliveries on the urban environment and last mile transport efficiency. Consumers must be aware of impacts on working conditions, road safety, of on-demand transport and instant deliveries.
Impacts on the urban environment
CITYLAB – City Logistics in Living Laboratories
D.2.1 – CITYLAB Observatory of Strategic Developments Impacting Urban Logistics (2017)
135
Local air pollutants (PM and NOx)
Expected increase in PM and NOx emissions due to increased van and truck-kilometres
E-commerce deliveries have contradicting impacts on local air quality. They can bring an increase in/a decrease in PM and NOx emissions depending on start conditions, type of city, type and location of consumer. Increased biking can reduce local air pollutants from e-commerce.
CO2 emissions Expected increase in CO2 due to increased van and truck-kilometres
E-commerce deliveries have contradicting impacts on CO2 emissions. They can bring an increase in/a decrease in CO2 emissions depending on start conditions, type of city, type and location of consumer. Increased biking can reduce carbon footprint of e-commerce.
Traffic/congestion Expected increase in traffic due to increased van and truck-kilometres
Increased biking can increase heterogeneity of traffic in city streets: usually leads to more congestion, or could participate in the general trend towards deterring car use in city streets Demand for non-traditional delivery times (evenings, week-ends) increases Land use patterns influence the characteristics of urban freight traffic for home deliveries
Road safety/conflicts of street use
Expected increase in road safety problems due to increased van traffic
Increased biking for deliveries can increase the conflicts of street uses
Noise emissions Expected increase in noise emissions due to increased van and truck-kilometres
E-commerce deliveries have contradicting impacts on noise emissions. They can bring an increase in/a decrease in noise emissions depending on start conditions, type of city, type and location of consumer. Increased biking for e-deliveries can reduce noise.
Quality of life, local street life
Expected increase in van and truck-kilometres
Less local stores as competition from e-retailers increases (does not apply to e-grocery). However, e-commerce also leads to the introduction of new types of stores (Amazon bookstores/pick-up points)
Impacts on the regional environment
CO2 emissions Expected increase in CO2 emissions due to increased van and truck-kilometres on the regional network
E-commerce deliveries have contradicting impacts on CO2 emissions at a regional scale. They can bring an increase in/a decrease in CO2 emissions depending on start conditions, type of city, type and location of consumer. The decentralization of e-

CITYLAB – City Logistics in Living Laboratories
D.2.1 – CITYLAB Observatory of Strategic Developments Impacting Urban Logistics (2017)
136
commerce fulfilment centres in suburban areas brings additional truck-kilometres (therefore CO2 emissions) within the region.
Traffic/congestion Expected increase in van and truck-kilometres on the regional network
The decentralization of e-commerce fulfilment centres in suburban areas brings additional truck-kilometres (and associated potential congestion) within the region.
Multimodal infrastructure In the future, logistics sprawl can stimulate the use of multimodal freight hubs if logistics sprawl goes together with clustering of large logistics facilities around suburban logistics parks New urban logistics hotels can be promoted around rail or waterway access (e.g. Chapelle International logistics hotel)
Impacts on urban freight efficiency
Costs for last mile deliveries
Logistics sprawl increases last mile average distances, which can have contradicting effects on regional transport companies
Residential deliveries are complicated and costly Need for alternative solutions leading to consolidation of deliveries in order to decrease costs
Shipments consolidation Logistics sprawl in the future can stimulate the use of freight hubs facilitating shipment consolidation, if logistics sprawl goes together with clustering of large logistics facilities around suburban logistics parks New urban logistics hotels can be promoted around shipment consolidation closer to the city centre (e.g. Chapelle International logistics hotel)
Residential deliveries are poorly consolidated. Alternative solutions for e-deliveries (pickup points, click-and-collect) can promote shipments consolidation and reduce transportation costs and CO2 impacts.
Innovation in city logistics Promotion of innovative behaviours for urban warehouses, such as logistics hotels
E-commerce deliveries appear to be one of the main drivers for innovations in sustainable city logistics services. Many start-ups are emerging, while large players have developed special operations for urban areas (clean vehicles, alternative modes, urban warehouses, instant delivery apps).
Impacts on working conditions and legislation
Local transport companies, owner-drivers, independent couriers
Logistics sprawl increases last mile average distances and changes the way last mile operators (often sub-contractors) organise their activities.
Potentially dangerous driving behaviour as pay is often linked to number of trips (motor bikes, bicycles) On-demand transport services and instant delivery apps: unstable status of

CITYLAB – City Logistics in Living Laboratories
D.2.1 – CITYLAB Observatory of Strategic Developments Impacting Urban Logistics (2017)
137
worker/employee Labour laws will have to adapt to rising on-demand transport services.
Employees of transport companies
Logistics sprawl increases last mile average distances and changes the way last mile operations are organised
Work on Sunday and/or at night can be a problem in some countries
Transport and logistics companies
Logistics sprawl increases last mile average distances and changes the way last mile operations are organised
Potential unfair competition from on-demand transport services and instant delivery apps.
IV.3 General conclusions applying to service trips
The aim of this section was to develop a basis of reliable information on service traffic. With the help of data of the German study Motor vehicle traffic in Germany 2010 / Kraftfahrzeugverkehr in Deutschland 2010 (KiD 2010) we could show that the share of service traffic in traffic at all in Germany is 11.8% in terms of trips and 19.9% in terms of kilometres travelled. The share of service traffic in commercial transport is 42% in terms of trips and 43% in terms of kilometres travelled.
Service trips are mostly done with passenger cars and light duty vehicles. Economic sectors with high shares in total service trips are Construction sector (NACE F) and Human health and social work activities (NACE Q). Out of all service trips 10% are done with vehicles registered for private persons. Economic sectors with high shares in terms of kilometres travelled in total service traffic are the Construction sector (NACE F), Professional, scientific and technical activities (NACE M), the Manufacturing sector (NACE C), and the Wholesale and retail trade sector (NACE G). In terms of kilometres travelled 8.3% of all service traffic is done with vehicles registered for private persons.
High shares of service traffic are done in city centre areas in agglomeration areas, in dense areas near urbanized areas, and in highly dense areas in agglomeration areas. In terms of kilometres travelled high shares of service traffic is done in city centre areas in agglomeration areas, highly condensed areas in agglomeration areas, and condensed areas near urbanized areas.
Vehicles used for service traffic make on average 3.2 service trips per day. On average vehicles travel 73.8 kilometres while doing service trips. Number of trips and kilometres travelled vary in terms of vehicles used, economic sector and spatial type. Economic sectors with high shares in service trips (NACE C, F, G, M) make between 2.5 and 3.2 trips per day on average. The average trip length in these economic sectors varies between 25 kilometres and 62 kilometres. Accordingly daily tour length varies between 69 kilometres and 200 kilometres. The highest average trip rate per day in service traffic is observed in highly condensed areas in agglomeration areas. The lowest average trip rate per day is observed in rural areas near urbanized areas. The average trip length varies between 16 kilometres and 26 kilometres per trip.
The analysis of the German study KiD 2010 gives no information on the factors influencing the trip patterns of companies in the service sector. Further studies as used by Hebes (2011) can give information on this. The empirical results of Hebes show that there are four typical travel patterns. Following the four identified clusters there are on the one hand vehicles which are characterized by only a few stops and little road performance per day. On the other hand many cars visit numerous customers and participate a lot in traffic. Hebes shows that

CITYLAB – City Logistics in Living Laboratories
D.2.1 – CITYLAB Observatory of Strategic Developments Impacting Urban Logistics (2017)
138
four corporate factor groups, namely internal structures and internal processes as well as external structures and external processes, play a role in travel behaviour in service traffic.
Our research on other surveys and studies in Europe on service traffic revealed that there are only few of them. Furthermore they are different in terms of definition of service traffic, in terms of spatial coverage and in terms of observed objects. Nevertheless they add further knowledge on trip patterns in service traffic.
To set up a proper observatory on service traffic we need to take identified limitations and learning from our previous analysis into account. Crucial is the question of the observed object of studies and surveys on service traffic. Both establishment based analysis as well as vehicle based analysis can give detailed insight into the research topic. Combined studies could link knowledge ideally but often exceeds restrictions set by resources. Ideas for better observing service traffic include the connection of trips and stop point in the tour context. This will enable synthetic tour planning and will lead to a better theory on modelling. Trip chain data could thus serve as estimator for service-related traffic. This will build up further knowledge on traffic behaviour. The vehicle based observation of KiD 2010 is a good basis for the observation of service traffic but background knowledge on the reasons behind the trip patterns are missing. Thus an observation of the behaviour of companies and their whole vehicle fleets is needed. Decision makers need to be asked on the rationales behind vehicle deployment, on determining factors for fleet composition as well as decision-making processes in fleet use. At the moment we are only observing the derived behaviour but do not know anything about the genesis and generation of service traffic. There is no information on choice behaviour. As we have seen from the analysis service traffic is partly done with vehicles registered for private persons. Thus they must be included in any kind of analysis. Furthermore the observation needs to take into account non-road-trips as not all service traffic is done in road transport.
Understanding the generation of service traffic, we will be able to give better information on how to influence service traffic in a sustainable manner. But as in commercial traffic, the premise will be not to avoid traffic rather to improve traffic. As there is always an economic reason behind service traffic it will not be possible to avoid service trips at all. But there is room for improvements. Common strategies in commercial transport are the use of advanced vehicle technology, the temporal shift of traffic as well as the consolidation of trips.
At the moment we cannot determine exactly the difference in service traffic between countries. There are no studies and surveys available which allow a comparison of countries. From the analysis in Germany we can at least see that there are no big differences between different spatial types. Our findings do show relatively homogeneous results on that. The set-up of studies and surveys on service traffic should therefore be coordinated on European level. A starting point for a better observation of service traffic may be to conduct surveys as KiD 2010 in Germany in other countries on national basis as well. Furthermore this must be enhanced with local or regional establishment based surveys where whole companies and their fleets are included. Such surveys should take into account economic sectors, which have been identified as main producers of service traffic. This will provide a solid foundation for the definition of policy measures for the sustainable development of urban transport including service traffic.

CITYLAB – City Logistics in Living Laboratories
D.2.1 – CITYLAB Observatory of Strategic Developments Impacting Urban Logistics (2017)
139
V. References
References for logistics sprawl
Andreoli, D., Goodchild, A., and Vitasek, K. (2010). The rise of mega distribution centers and the impact on logistical uncertainty
Andriankaja, D. (2014) Le « desserrement logistique », quelle responsabilité dans l’augmentation des émissions de CO2 des activités de messagerie? (Logistics sprawl, what responsibility in CO2 emissions from the parcel and express transport sector?). PhD Thesis, IFSTTAR/University of Paris-East, June.
Bowen, J. (2008) Moving places: the geography of warehousing in the US. Journal of Transport Geography, 16(6): 379-387.
Browne, M., Sweet, M., Woodburn, A., Allen, J. (2005) Urban Freight Consolidation Centres, Final report for the Department for Transport. http://ukerc.rl.ac.uk/pdf/RR3_Urban_Freight_Consolidation_Centre_Report.pdf
Combes, F. and Tavasszy, L. (2016) Inventory theory, mode choice and network structure in freight transport, 16(1): 38-52.
Conwell, B. (2015) E-commerce recent developments. Keynote speech, I-NUF Conference, Long Beach, October.
Dablanc, L., and Ross, C. (2012). Atlanta: a mega logistics center in the Piedmont Atlantic Megaregion (PAM). Journal of transport geography, 24, 432-442.
Dablanc, L., Ogilvie, S., Goodchild, A. (2014) Logistics Sprawl: Differential Warehousing Development Patterns in Los Angeles and Seattle. Transportation Research Record: Journal of the Transportation Research Board,2410, Freight Systems 2014, Vol. 1: Planning Modeling, and Logistics.
Daganzo, F. F. (2005), Logistics Systems Analysis, fourth ed., Springer, Berlin.
Glaeser, E. and Kohlhase, J. (2004) Cities, regions and the decline of transport costs. Papers in Regional Science, 83: 197-228.
Hall, P. and Hesse, M. (Ed.) (2013) Cities, Regions and Flows, Routledge.
Heitz A., Dablanc L., Olsson J., Woxenius Y. (2016a) Logistics sprawl patterns in Gothenburg, Sweden, Proposed at World Conference on Transport Research, Shanghai, China
Heitz, A. and Dablanc, L. (2015) Logistics spatial patterns in Paris: the rise of the Paris basin as a logistics megaregion. Transportation Research Record: Journal of the Transportation Research Board, 2477, pp. 76-84.
Heitz, A., Dablanc, L., Tavasszy, L. (2016), Logistics sprawl in monocentric and polycentric metropolitan areas: the case of Paris, France and the Randstad, paper submitted to WCTRS Shanghai 2016.
Hesse, M. (2004) Land for logistics: locational dynamics, real estate markets and political regulation of regional distribution complexes, TijdschriftvoorEconomische en SocialeGeographie, 95(2): 162-173.
Hesse, M. and Rodrigue, J.P. (2004) The transport geography of logistics and freight distribution. Journal of Transport Geography, 12(3): 171-184.

CITYLAB – City Logistics in Living Laboratories
D.2.1 – CITYLAB Observatory of Strategic Developments Impacting Urban Logistics (2017)
140
Klauenberg, J., Elsner, L.-A., Knischewski, Chr. (2016) Dynamics in the spatial distribution of general cargo hubs – the case of Berlin. World Conference on TransportResearch - WCTR 2016 Shanghai, Paper submitted, under review.
Leonardi, J., Dablanc, L., van Egmond, P., Guerlain, C. Feasibility Study of a Network of Consolidation Centres in Luxembourg, International City Logistics Conference, June 17-19, Tenerife, Spain.
Movahedi B., Lavassani K. and Kumar V. (2009) Transition to B2B e-Marketplace Enabled Supply Chain: Readiness Assessment and Success Factors, The International Journal of Technology, Knowledge and Society, 5 (3), pp. 75-88.
Oliveira, L. K., Santos, O. R., Nóbrega, R. A. A. (2016) The geography of warehousing in Belo Horizonte (Brazil). Proposed at WCTR 2016, Shanghai (China).
Raimbault (2014) Gouverner le développementlogistique de la métropole: périurbanisation, planificationetcompétition métropolitaine, le cas du bassin parisien et éclairagesétrangers (Governing the logistics development of metropolitan areas: sprawl, planning and competition, the case of the Paris megaregion and other world case studies). PhD Thesis, IFSTTAR/University of Paris-East, December.
Rodrigue, J.P. (2004) Freight, gateways and mega-urban regions: The logistical integration of the BostWash corridor, Tijdschriftvooreconomische en socialegeografie, 95(2), pp. 147-161.
Ross, C. (Ed.) (2009) Megaregions, Planning for Global Competitiveness, Island Press, Washington, 307p.
Sakai, T., Kawamura, K., Hyodo, T. 2015. Logistics facility distribution in Tokyo Metropolitan Area: Experiences and policy lessons. In: 9th International Conference on City Logistics, Tenerife, Spain.
Woudsma, C., Jakubicek, P., Dablanc, L. (2015) Logistics sprawl in North America: methodological issues and a case study in Toronto. In: 9th International Conference on City Logistics, Tenerife (Spain).
References for e-commerce
Academic papers
Augereau V., Curien R., Dablanc L. (2009), Les relais-livraison dans la logistique du e-commerce, l’émergence de deux modèles, Les Cahiers Scientifiques du Transport, 55, 63-95.
Blanquart C., Muller S., Seidel S., Ehrler V. (2012), From a supplier to a retail controlled supply chain: what are the impacts on transport demand? From data analysis to model development, Procedia – Social and Behavioral Sciences, 54, 275-285.
Cagliano A.C., Gobbato L., Tadei R., Guido Perboli G. (2014), ITS for E-grocery Business: The Simulation and Optimization of Urban Logistics Project, Transportation Research Procedia, 3, 489-498
Crainic T. G. (2008), City Logistics, CIRRELT-2008-25.
Dablanc L., Morganti E., Arvidsson N., Woxenius J., Browne M., Saidi N., 2017, The Rise of Instant Delivery Services in European Cities. Submitted to Supply Chain Forum.

CITYLAB – City Logistics in Living Laboratories
D.2.1 – CITYLAB Observatory of Strategic Developments Impacting Urban Logistics (2017)
141
Ducret R. (2014), Parcel deliveries and urban logistics: Challenges in the courier express and parcel sector in Europe – The French case, Research in Transportation Business & Management, 11, 15-22.
Durand B., Gonzalez-Feliu J. (2012), Urban logistics and e-grocery: Have proximity delivery services a positive impact on shopping trips?, Procedia – Social and Behavioral Sciences, The7th International Conference on City Logistics, 39, 510-520.
Faccio M., Gamberi M., 2015. New City Logistics Paradigm: From the “Last Mile” to the “Last 50 Miles” Sustainable Distribution, Sustainability 7 14873-14894.
Gevaers R., Van de Voorde E., Vanelslander T. (2011), Characteristics and typology of last-mile logistics from an innovation perspective in an urban context, in Macharis C., Melo S. (eds), City Distribution and Urban Freight Transport, Edward Elgar, 56-73.
Goethals F., Leclercq-Vandelannoitte A., Tutuncu Y. (2012), French consumers’ perceptions of the unattended delivery model for e-grocery retailing, Journal of Retailing and Consumer Services, 19(1), 133-139.
Hausladen I., Dachsel B., Haas A. (2015), Trends and Potentials of City Logistics Concepts in the Age of E-Commerce from a Sustainability Perspective, HHL Working Paper, n°147, July 2015.
Heits A., Beziat A., 2016. The parcel industry in the spatial organization of logistics activities in the Paris Region : inherited spatial patterns and innovations in urban logistics systems, Transportation Research Procedia 12 812-824.
Heitz, M., Douard, J.P. & Cliquet, G. (2011). Grande distribution alimentaire et ‘drive’ : une solution à la mobilité des consommateurs ? Proceedings of the International Etienne Thil Conference on Retailing, Roubaix, September.
Hesse M. (2002), Shipping news: the implications of electronic commerce for logistics and freight transport, Resources, Conservation and Recycling, 36(2002), 211-240.
Hiselius L.W. (2012), E-shopping and changed transport behavior, Association for European Transport and Contributors.
Lapoule P. (2014), The French Grocery Retail Company Intermarché Develops the “Click and Drive” Model, South Asia Journal of Buiness and Management Cases, 3(1), 65-76.
Morganti, E., Dablanc, L., Fortin, F. (2014) Finaldeliveries for online shopping: the deployment of pickup point networks in urban and suburban areas. Research in Transportation Business & Management, vol 11, pp. 23-31.
Motte-Baumvol B., Belton-Chevallier L., Schoelzel M., Carrouet G. (2012), Les effets de la livraison à domicile sur l’accès aux produits alimentaires : le cas des grandes surfaces alimentaires et des cybermarchés de l’aire urbaine dijonnaise, Flux, 88(2012/2), 34-46.
Nemoto, T., Visser, J. and Yoshimoto, R. (2001), Impacts of Information and Communication Technology on Urban Logistics System, Paris: OECD/ECMT.
OECD (2011), Guide to Measuring the Information Society 2011, Paris, OECD Publishing.
Russo F., Comi A. (2012), City characteristics and urban goods movements: A way to environmental transportation system in a sustainable city, Procedia – Social and Behavioral Sciences, 39(2012), 61-73.
Saidi, N. (2017) Livrer Babel: la livraison “instantanée” dans le Grand Paris. Master’s course report, School of Architecture for Cities and Territories of Marne la Vallée, University of Paris-East. 137p.
Schenk T.A., Loffler, G., Rauh J. (2007), Agent-based simulation of consumer behaviour in grocery shopping on a regional level, Journal of Business Research, 60(8), 894–903.

CITYLAB – City Logistics in Living Laboratories
D.2.1 – CITYLAB Observatory of Strategic Developments Impacting Urban Logistics (2017)
142
Schliwa G., Armitage R., Aziz S., Evans J., Rhoades J. (2015), Sustainable city logistic – Making cargo cycles viable for urban freight transport, Research in Transportation Business & Management.
Sinha A., Weitzel P. (2015), eCommerce Supply Chain Insights in Groceries and Consumer Packaged Goods in the United States, White Paper, Technology and Operations Department, Ross School of Business, University of Michigan, February 2015.
Visser J., Nemoto T., Browne M. (2014), Home Delivery and the Impacts on Urban Freight Transport: A Review, Procedia – Social and Behavioral Sciences, 8th International Conference on City Logistics 17-19 June 2013, Bali, Indonesia, 125, 20 March 2014, 15-27.
Wygonik E., Goodchild A. (2012), Evaluating the Efficacy of Shared-use Vehicles for Reducing Greenhouse Gas Emissions: A U.S. Case Study of Grocery Delivery, Journal of the Transportation Research Forum, 51(2), 111-126.
Zapfel G., Wasner M. (2002), Planning and optimization of hub-and-spoke transportation networks of cooperative third-party logistics providers, International Journal of Production Economics, 78(2), 207-220.
Professional reports
Accenture, 2016, Achieving High Performance in the Postal Industry.
Carrelet P., Cruzet Th. (2014), LES ‘‘DRIVES’’ : Une nouvelle forme de commerce en forte croissance, Etudes économiques, Les 4 pages de la DGE.
CBRE, Retail logistics: who’s driving the change, the consumer or the industry, EMEA Retail and Industrial Logistics, Q1, 2016.
Ecommerce Europe, Infographics. http ://www.ecommerce-europe.eu/facts-figures/infographics
Ericsson (2015), ICT & the Future of Retail, Horizon Scan.
Ericsson (2014), ICT & the Future of Transport, Networked Social
Lab.http://www.ericsson.com/industry-transformation/ E-handelsrapporten 2015. Oslo. Posten Norge AS.
JLL (2013), E-commerce boom triggers transformation in retail logistics. Driving a global wave of demand for new logistics
facilities.https ://www.jll.com/Research/eCommerce_boom_triggers_transformation_in_retail_logistics_whitepaper_Nov2013.pdf
Lierow M., Janssen S., D’Inca J. (2014), Disruptive logistics. The new frontier for e-commerce, Oliver Wyman, March &McLenna
Companies.http ://www.oliverwyman.com/content/dam/oliver-wyman/global/en/2014/sep/MUN-MKT20101-011_screen12.pdf
Lowe R., Rigby M. (2014), The Last Mile. Exploring the online purchasing and delivery journey, Barclays.
https ://www.home.barclays/content/dam/barclayspublic/docs/BarclaysNews/2014/September/the-last-mile-report.pdf
Prologis (2014), Inside the global supply chain: E-commerce and a new demand model for logistics real estate, July 2014. http://www.prologis.com/docs/research/supply_chain/E-Commerce_Logistics_Real_Estate_Final_July2014.pdf

CITYLAB – City Logistics in Living Laboratories
D.2.1 – CITYLAB Observatory of Strategic Developments Impacting Urban Logistics (2017)
143
Prologis, The global e-commerce revolution. What does its impact on logistics real estate really look like?, September 2016. http://www.prologis.com/docs/research/supply_chain/Research_Whitepaper_Ecommerce_Impact_on_Logistics_Real_Estate.pdf
PwC (2015), Amazon creuse l’écart avec Cdiscount et s’impose comme le premier site d’e-commerce en France, Communiqué de presse, 26 mars 2015. http ://www.pwc.fr/amazon-creuse-lecart-avec-cdisount-et-simpose-comme-le-premier.html
UNCTAD, Information Economy Report 2015. Unlocking the Potential of E-commerce for Developing countries, UN, Geneva.
Online sources and press articles
Comeos, 2016 (http://www.comeos.be/menu.asp?id=13540&lng=nl)
Cortright Joe (2015), Growing e-commerce means less urban traffic, City Observatory, 25.8.2015, online source. http://cityobservatory.org/growing-e-commerce-means-less-urban-traffic/
Fabuconnier Flore (2012), Comment la grande distribution fait évoluer ses drives, Dossier, Journaldunet.com, 08/11/2012. http ://www.journaldunet.com/ebusiness/commerce/drive-distribution/
Fabuconnier Flore (2014), Google Shopping Express peut-il prendre de court Amazon et eBay ?,Journaldunet.com, 06/05/2014.http://www.journaldunet.com/ebusiness/commerce/ambitions-google-shopping-express.shtml
Goddard A., 2017, How soon is now? The disruption and evolution of logistics and industrial property. https://www.linkedin.com/pulse/how-soon-now-disruption-evolution-logistics-property-wade-potter?articleId=6202171512888270848
Hook Leslie (2015), Amazon’s instant gratification service aims to disrupt delivery, Financial Times, 11/12/2015. http://www.ft.com/cms/s/2/4e481d36-994a-11e5-95c7-d47aa298f769.html
Levinson D.M. (2014), Peak shopping and the decline of traditional retail, OUPblog, February 12th, 2014. http://blog.oup.com/2014/02/transportation-peak-shopping-traditional-retail-decline/
Phillips R., 2016, Tackling E-commerce's "Last Mile" Warehouse Networks, http://www.naiop.org/en/Magazine/2016/Winter-2016-2017/Business-Trends/Tackling-Ecommerces-Last-Mile-Warehouse-Networks.aspx
Spencer C., Caton C., Conwell B., Final Delivery: The Last Mile, ULI Fall Meeting: E-commerce Session, http://uli.org/wp-content/uploads/ULI-Documents/Caton_FinalDelivery.pdf
Stuart Tood, Paris issues tender to develop five urban logistics hubs, Lloyd’s Loading List, July 20, 2016. http://www.lloydsloadinglist.com/freight-directory/news/Paris-issues-tender-to-develop-five-urban-logistics-hubs/66995.htm#.WHz0zbmvjec

CITYLAB – City Logistics in Living Laboratories
D.2.1 – CITYLAB Observatory of Strategic Developments Impacting Urban Logistics (2017)
144
References for service traffic
Allen, J., Browne, M., & Cherrett, T. (2012). Survey techniques in urban freight transport studies. Transport reviews, 32(3), 287-311.
Browne, M., Sweet, M., Woodburn, A., Allen, J. (2005). Urban freight consolidation centres final report. Transport Studies Group, University of Westminster, 10.
Cherrett, T., McLeod, F., Maynard, S., Hickford, A., Allen, J., & Browne, M. (2009). Understanding retail supply chains to enable'greener'logistics.
FGSV (2016). Konzeption und Einsatz von Verkehrsnachfragemodellen zur Berechnung des Wirtschaftsverkehrs, Hinweispapier AK 1.8.4 (Conception and use of traffic demand models for the calculation of economic traffic, reference paper)
Follmer, R., Gruschwitz, D., Jesske, B., Quandt, S., Lenz, B., Nobis, C., Mehlin, M. (2010). Mobilität in Deutschland 2008 (Mobility in Germany 2008): Ergebnisbericht Struktur–Aufkommen–Emissionen–Trends. Institut für angewandte Sozialwissenschaft GmbH (Infas).
Guilbault, M., Gouvernal, E., Lebaudy, M., Lenz, B., Schneider, S., & Kohler, K. (2010). Links between production systems and transport: the example of German and French industries. In 12th World Conference on Transport Research (p. 32p).
Hebes, P. (2011). Die Rolle von Unternehmen beim Verkehrsverhalten im Personenwirtschaftsverkehr (The role of companies in traffic behaviour in the passenger transport sector, Doctoral dissertation, Humboldt-Universität zu Berlin, Mathematisch-Naturwissenschaftliche Fakultät II).
Hesse, M., Rodrigue, J. P. (2004). The transport geography of logistics and freight distribution. Journal of transport geography, 12(3), 171-184.
Julsrud, T., Figenbaum, E., Nordbakke, S., Denstadli, J.M., Tilset, H., Schiefloe, P.M. (2016). Pathways to Sustainable Transport among Norwegian Crafts and Service Workers, TØI Report 1503/2016
Lenz, B., Menge, J., & Varschen, C. (2006). The fragmentation of industrial value chains and its impact on freight transport and transport for commercial services. Networks for Mobility 2006.
Maynard, S., & Cherrett, T. (2009). Characteristics of retail waste logistics on Winchester High Street. Green Logistics WM10 Report. See http://www. greenlogistics. org/PageView. aspx.
Menge, J. (2011). Personenwirtschaftsverkehr im Prozess der Dienstleistungserstellung: Ursachen, Strukturen und raumliche Muster (Transport of persons in the process of providing services: causes, structures and spatial patterns, Doctoral dissertation, Berlin, Humboldt Universität zu Berlin, Diss., 2011).
Menge, J., & Lenz, B. (2008). Services and Service Traffic–A Reappraisal from the Perspective of Transportation Geography. Networks for Mobility 2008.
Müller, St. (2009). Methode zur Erfassung des Wirtschaftsverkehrs (Method for recording commercial traffic). Wirtschaftsverkehr 2009 Daten-Modelle-Anwedung. Verlag Praxiswissen. ISBN 978-3-86975-000-2.
Nakamura, K., Hayashi, Y. (2013). Strategies and instruments for low-carbon urban transport: An international review on trends and effects, Transport Policy, 29, 264-274.
Santos, G., Behrendt, H., Teytelboym, A. (2010). Part II: Policy instruments for sustainable road transport. Research in Transportation Economics, 28(1), 46-91.

CITYLAB – City Logistics in Living Laboratories
D.2.1 – CITYLAB Observatory of Strategic Developments Impacting Urban Logistics (2017)
145
Schneider, S. (2011). A methodology for the extrapolation of trip chain data (Doctoral dissertation, Deutsches Zentrum für Luft-und Raumfahrt, eV).
Schneider, S., & Wolfermann, A. (2013). Estimating Service-Related Traffic Demand from Trip Chain Data. Transportation Research Record: Journal of the Transportation Research Board, (2343), 25-33.
Schütte, F. P. (1997). Mobilitätsprofile im städtischen Personenwirtschaftsverkehr. (Mobility profiles in urban passenger transport) Schriftenreihe des IÖW, 110, 97.
SSB (2016). Transport med små godsbiler, 2014-2015, https://www.ssb.no/transport-og-reiseliv/statistikker/transpsg/hvert-5-aar/2016-03-11
Steinmeyer, I. (2004). Kenndaten der Verkehrsentstehung im Personenwirtschaftsverkehr. (Characteristics of the traffic generation in the passenger transport sector) Doctoral thesis, Technische Universität Hamburg-Harburg, Germany.
Wermuth, M., Neef, C., Steinmeyer, I. (2006). Goods and business traffic in Germany. In Peter Stopher and Cheryl C. Stecher, editors, Travel Survey Methods – Quality and Future Directions, pages 427-450. Elsevier.
Wermuth, M., Neef, C., Hautzinger, H., Lenz, B., & Heinzmann, H.-J. (2012). Kraftfahrzeugverkehr in Deutschland 2010 (Motor vehicle traffic in Germany 2010) (Research project commissioned by the Federal Ministry of Transport, Building and Urban Development – FE-Nr. 70.801/2006), Braunschweig.
Wigan, M. (2002). Understanding the growth in service trips and developing transport modelling approaches to commercial, service and light goods movements.

CITYLAB – City Logistics in Living Laboratories
D.2.1 – CITYLAB Observatory of Strategic Developments Impacting Urban Logistics (2017)
146
VI. Appendices
Appendix 1. Table of logistics sprawl indicators

D.2.1 – CITYLAB Observatory of Strategic Developments Impacting Urban Logistics (2017) 147
Name and size of studied metro area
Amsterdam 4,092 km2
Atlanta 21,700
km2
Belo Horizonte
14,980 km2
Berlin 3,778 km2
Bogota 1,636 km2
Brussels 2,300 km2
Calgary 5,107 km2
Cali 798 km2
Chicago 28,120
km2
Gothenburg (metro)
3,695 km2
Gothenburg (region)
22,752 km2
Halifax 5,490 km2
Los Angeles 87,940
km2
Montreal 4,258 km2
Paris (all WH)
12,058 km2
Paris (parcel/express)
12,058 km1
Rotterdam 3,418
Seattle 15,209
Shenzhen 1,952
The Randstad
14,668 km2
Tokyo 14,034
Toronto GTA 7,124
Toronto GGH
31,562 Vancouver
2,700 Winnipeg
5,303
Type of metropolitan area Mono Mono Mono Poly City Mono Mono City Mono Mono Mono mono Poly/Mega Mono Mono Mono Mono Mono City Poly/Mega
Mono/Mega Mono Mono Mono Mono
Population (million - most recent year) 2.7 5 5.8 4.3 8.1 2.5 1.3 2.12 7.3 0.97 1.6 0.39 18.5 5.08 11.8 11.8 3.6 3.5 10.4 8.6 34.5 6.05 8.7 2.59 0.66
Population density (inhabitants/km2) 660 230 387 1,138 4,927 1,087 257 2,657 260 263 70 71 210 1,194 979 979 1,053 230 5,328 586 2,458 849 276 959 124
Name of warehouse data source NACE 52.1
NAICS 493
CMC-BH and
JUCEMG
Own (focused study)
land use data from
Capital District
of Bogotá
Belgian Statistical Office
EPOI (NAICS
493 'cleaned')
Chamber of Commerce
NAICS 493 SBC SBC
EPOI (NAICS
493 'cleaned'
) NAICS
493
EPOI (NAICS
493 'cleaned') NACE 52.1
Own collection from yellow
pages NACE 52.1
NAICS 493
Shenzhen Building Census
NACE 52.1
TMFS WH
EPOI (NAICS
493 'cleaned')
EPOI (NAICS
493 'cleaned')
EPOI (NAICS
493 'cleaned')
EPOI (NAICS
493 'cleaned')
Number of warehouses (most recent year) 278 401 401
22 (focused study) 493 10,553 59
27 (focused study) 466 205 382 9 946 70 955
90 (focused study) 185 212 1,660 631 209 228 350 134 41
Number of warehouses per million people (most recent year) 103 80 69 5 61 1,299 45 13 64 211 239 23 51 14 81 8 51 61 160 73 6 38 40 52 62
% change per year in number of WH per million people 2% 9% 7%
not calculat
ed 20%
not calculate
d 3% not
calculated not
calculated not calculated not
calculated 0% 19% 22% -660% -233% not
calculated 5% not
calculated not
calculated 25% 10% not
calculated 4% 0%
Number of warehouses per 1000 km2 (most recent year) 68 18 27 6 301 1,412 12 34 17 55 17 2 11 16 79 7 54 14 850 43 15 32 11 50 8
Average size of warehouses (m2) na na 2,477 na 382 na na na na na na na na na na na na na na na na na na na Na
Time period studied for logistics sprawl analysis 2007-2013
1998-2008 1995-2015
1994-2004
2005-2011
1982-2012
2002-2012 2005-2008 1998-2013 2000-2014 2000-2014
2002-2012 1998-2009
2002-2012 2000-2012 1976-2010 2007-2013
1998-2009 2008-2012 2007-2013
1980-2003
2002-2012 2002-2012 2002-2012
2002-2012
Number of years of analyse 6 10 20 10 6 30 10 3 15 14 14 10 11 10 12 34 6 11 4 6 23 10 10 10 10
Average distance of warehouses to centre of gravity (most recent year) (km) 19.6 33 19 16 5.28 21.2 8.9 2.5 79.84 13 82 6.7 51 8.1 21 18.1
not calculated 19.3 16.12
not calculated 30.7 17.9 39.1 17 4.9
Change in average distance of WHs to centre of gravity (over the years) (km) -2 4.55 1.2 4 0.62 2.5 3.5 0.5 8.82 4.2 2.7 1.8 9.7 0.1 3.5 11.8
not calculated -1.3 1.23
Not calculated 4.2 1.2 9.5 4.1 0.7
Change in average distance of WHs to centre of gravity per year (km/year) -0.33 0.46 0.06 0.40 0.10 0.08 0.35 0.17 0.59 0.30 0.19 0.18 0.88 0.01 0.29 0.35
not calculated -0.12 0.31
not calculated 0.18 0.12 0.95 0.41 0.07
Cluster indicator na na na na Na na na na na na na na na na na na na na na na na na na na na
Type of land use control regional local local local Local local
not indicated local local metropolitan not indicated
not indicate
d local not
indicated local local not
indicated not
indicated not
indicated regional local regional regional not
indicated local

D.2.1 – CITYLAB Observatory of Strategic Developments Impacting Urban Logistics (2017) 148
Appendix 2. Logistics sprawl case studies
Amsterdam, The Netherlands
Name and size of studied metropolitan area
Amsterdam Metropolitan Area: Noord Holland province (4,092 km2)
53 municipalities
Type of metropolitan area
Monocentric or rather monocentric
Polycentric or rather polycentric
Megaregion
Population
2014: 2,71 million
2007: 2,61 million
2000: 2,42 million
Population density (2014)
591.5 /km2
Name of warehouse data source and brief description
NACE 52.1
The Statistical Classification of Economic Activities in the European Community, commonly referred to as NACE, is the industry standard classification system used in the European Union. The current version is revision 2 and was established by Regulation (EC) No 1893/2006. It is the European implementation of the UN classification ISIC, revision 4.NACE is similar in function to the SIC and NAICS systems.
This class includes: - operation of storage and warehouse facilities for all kinds of goods: - operation of grain silos, general merchandise warehouses, refrigerated warehouses, storage tanks etc.
This class also includes: - storage of goods in foreign trade zones - blast freezing
This class excludes: - parking facilities for motor vehicles, see 52.21 - operation of self-storage facilities, see 68.20 - rental of vacant space, see 68.20
Number of warehouses(specify year(s))

CITYLAB – City Logistics in Living Laboratories
D.2.1 – CITYLAB Observatory of Strategic Developments Impacting Urban Logistics
149
2007: 318
2013: 278
Number of warehouses per million people (specify year(s))
2007: 117.2
2013: 102.5
Less warehouses per/people reflect an increase of population.
Number of warehouses per 1000 km2 (specify year(s))
2007: 77.8
2013: 68
Average size of warehouses (specify year(s)); can be any indicator such as m2, m3 or number of employees
No information
Time period studied for logistics sprawl analysis
2007-2013
Average distance of warehouses to centre of gravity (most recent year)(NB this doesn’t apply to megaregional types of urban regions)
2007: 21.6 km
2013: 19.6 km
Change in average distance of warehouses to centre of gravity (over the years)
-2km
Cluster indicator
Warehouses are mainly concentrated in the municipality of Amsterdam with 31% of the total number of the warehouses. The second major concentration is in Zaanstad with 16.2% of the total number of warehouses).
Type of land use control
Strictly local
Some sort of metropolitan-wide land use control
Some sort of region-wide (or state-wide) land use control
Other comments/information
While the number of warehouses is decreasing between 2007 and 2013 in the Noord Holland, the warehouses are more concentrated, especially in municipality like Zaanstad, so there is no dispersion of the logistics activities. We can make the hypothesis that the logistics activities have been spatially reorganized and clustered just outside Amsterdam.
Scientific or technical references

CITYLAB – City Logistics in Living Laboratories
D.2.1 – CITYLAB Observatory of Strategic Developments Impacting Urban Logistics
150
Heitz A., Dablanc L., Tavasszy L. (2016a), Logistics sprawl in monocentric and polycentric metropolitan areas: the case of Paris, France and the Randstad. Submitted to the WCTRS Shanghai 2016.

CITYLAB – City Logistics in Living Laboratories
D.2.1 – CITYLAB Observatory of Strategic Developments Impacting Urban Logistics
151
Atlanta, USA
Name and size of studied metropolitan area
Atlanta Metropolitan Area (21,694 km2)
110 municipalities
Type of metropolitan area
Monocentric or rather monocentric
Polycentric or rather polycentric
Megaregion
Population
2012: 5 million
Population density
230/km2
Name of warehouse data source and brief description
US Census Bureau County Business Patterns Survey, category 493 (Warehouse & Storage) of NAICS (North American Industrial Classification System)
“Warehouse” defined as: “Industries in the Warehousing and Storage subsector are primarily engaged in operating warehousing and storage facilities for general merchandise, refrigerated goods, and other warehouse products. These establishments provide facilities to store goods. They do not sell the goods they handle. These establishments take responsibility for storing the goods and keeping them secure. They may also provide a range of services, often referred to as logistics services, related to the distribution of goods. Logistics services can include labelling, breaking bulk, inventory control and management, light assembly, order entry and fulfilment, packaging, pick and pack, price marking and ticketing, and transportation arrangement. However, establishments in this industry group always provide warehousing or storage services in addition to any logistic services. Furthermore, the warehousing or storage of goods must be more than incidental to the performance of services, such as price marking.” (NAICS)
US Census Bureau County Business Patterns Survey provides an analysis of the number of establishments in all the counties and zip codes in the United States based on a detailed breakdown of industrial sectors and according to nine employment-size classes.
Number of warehouses (specify year(s))
1998: 132
2008: 401
Number of warehouses per million people (specify year(s)))
2008:77.1
Number of warehouses per 1000 km2 (specify year(s))

CITYLAB – City Logistics in Living Laboratories
D.2.1 – CITYLAB Observatory of Strategic Developments Impacting Urban Logistics
152
2008: 14.75
Average size of warehouses (specify year(s)); can be any indicator such as m2, m3 or number of employees
Not calculated
Time period studied for logistics sprawl analysis
1998-2008
Average distance of warehouses to centre of gravity (most recent year) (NB this doesn’t apply to megaregional types of urban regions)
33.15 km
Change in average distance of warehouses to centre of gravity (over the years)
+4.55 km
Change in average distance of warehouses to centre of gravity per year
0.45 km/year
Cluster indicator
Not available.
Type of land use control
Strictly local
Some sort of metropolitan-wide land use control
Some sort of region-wide (or state-wide) land use control
Other comments/information
The average distance to the barycentre for all establishments increased by 2.1 km, from 25 km in 1998 to 27 km in 2008: ‘‘relative sprawl’’ in Atlanta Metropolitan Area.
Scientific or technical references
Dablanc, L., Ross, C., 2012. Atlanta: a mega logistics centre in the Piedmont Atlantic Megaregion (PAM). Journal of Transport Geography, 24, 432-442

CITYLAB – City Logistics in Living Laboratories
D.2.1 – CITYLAB Observatory of Strategic Developments Impacting Urban Logistics
153
Belo Horizonte, Brazil
Name and size of studied metropolitan area
Belo Horizonte 9,471.7km2
34 municipalities
Type of metropolitan area
Monocentric or rather monocentric
Polycentric or rather polycentric
Megaregion
Population
(2015) Belo Horizonte Metropolitan Area: 5.239 million
(2015) Belo Horizonte: 2.502 million
Population density
849.2/km2
Name of warehouse data source and brief description
Municipal Register of Taxpayers Dataset (CMC)
National Classification of Economic Activities (CNAE) and economic activities related to warehouse (5250-8/05 –Multimodal transport operator; 5211-7/01 –Warehouse and 5211-7/99 – Warehouse to Third Parties).
Number of warehouses (specify year(s))
1995: 95
2015: 401
Number of warehouses per million people (specify year(s))
1995: 16
2015: 69
Number of warehouses per 1000 km2 (specify year(s))
1995: 6
2015: 27
Average size of warehouses (specify year(s)); can be any indicator such as m2, m3 or number of employees
1995: 3,842 m2
2015: 2,477 m2
Time period studied for logistics sprawl analysis

CITYLAB – City Logistics in Living Laboratories
D.2.1 – CITYLAB Observatory of Strategic Developments Impacting Urban Logistics
154
1995-2015
Average distance of warehouses to centre of gravity (most recent year)(NB this doesn’t apply to megaregional types of urban regions)
19 km
Change in average distance of warehouses to centre of gravity (over the years)
+1.2 km
Cluster indicator
Not analysed
Type of land use control
Strictly local
Some sort of metropolitan-wide land use control
Some sort of region-wide (or state-wide) land use control
Other comments/information
Scientific or technical references
Santos, O. R., Oliveira, L. K., Nóbrega, R. A. A. (2016) The influence of the location of logistical facilities in the metropolitan region of Belo Horizonte. In: XXX ANPET, Rio de Janeiro (Brazil). (in Portuguese).

CITYLAB – City Logistics in Living Laboratories
D.2.1 – CITYLAB Observatory of Strategic Developments Impacting Urban Logistics
155
Berlin, Germany
Name and size of studied metropolitan area, number of municipalities
Berlin (891 km²) and surrounding municipalities of Brandenburg (in sum 3,778 km²)
Berlin has one municipality, 51 municipalities in the surrounding area of Brandenburg
Type of metropolitan area
- Monocentric or rather monocentric - Polycentric or rather polycentric - Megaregion
Population
2014: 4.3 million (incl. 3.4 for Berlin)
Population density
Berlin: 3,840/km2
Whole study area: 1,150 /km²
Name of warehouse data source and brief description
DLR (German Aerospace Centre) own data source of general cargo hubs in Germany, locations of 14 general cargo company networks in Germany
General cargo or break bulk cargo goods are goods that are loaded individually and not in one intermodal transport container. General cargo in road transport is also known as groupage, packaged goods, and piece goods. In road transport general cargo is typically shipped through networks of forwarding companies. In these networks for general cargo, the hubs are locations of forwarding companies. At these locations, goods are loaded and unloaded between lorries in the main run and lorries in pick-up and delivery-runs. There are currently (2015) 14 logistics networks for general cargo in Germany, each with locations in or close to Berlin. Altogether the general cargo networks in Germany serve 943 locations.
Number of warehouses (specify year(s))
Year 1994: 18 (general cargo networks only)
Year 2004: 19 (general cargo networks only)
Year 2014: 22 (general cargo networks only)
Number of warehouses per million people (specify year(s))
Year 2014: 5.0
Number of warehouses per 1000 km2 (specify year(s))
Year 2014: 5.8
Average size of warehouses (specify year(s)); can be any indicator such as m2, m3 or number of employees
Not calculated

CITYLAB – City Logistics in Living Laboratories
D.2.1 – CITYLAB Observatory of Strategic Developments Impacting Urban Logistics
156
Time period studied for logistics sprawl analysis
1994-2004-2014
Average distance of warehouses to centre of gravity (most recent year) (NB this doesn’t apply to megaregional types of urban regions)
15.7 km
Change in average distance of warehouses to centre of gravity (over the years)
+4.0 km (1994-2014)
Change in average distance of warehouses to centre of gravity per year
0.2 km/year
Cluster indicator
Not analysed
Type of land use control
- Strictly local - Some sort of metropolitan-wide land use control - Some sort of region-wide (or state-wide) land use control
Other comments/information
Further indicators analysed:
- shift of barycentre - logistics employment - population development
The change in location for the general cargo hubs has been traced individually. Thirteen expert interviews on the reason for relocation were conducted.
Scientific or technical references
Klauenberg, J., Elsner, L.A., Knischewski, Chr. (2016) Dynamics in the spatial distribution of general cargo hubs – the case of Berlin. Submitted to WCTR 2016, Shanghai.
CITYLAB – City Logistics in Living Laboratories
D.2.1 – CITYLAB Observatory of Strategic Developments Impacting Urban Logistics
157
Bogota, Colombia
Name and size of studied metropolitan area, number of municipalities
Bogota, 1,636 km2
1 municipality (This case considers the area of Bogota).
Type of metropolitan area
- Monocentric or rather monocentric - Polycentric or rather polycentric - Megaregion
Population
2005: 6.84 million
2016: 8.06 million
Population density
4,927 hab/km
Name of warehouse data source and brief description
For analyzing warehousing location and logistic facilities in Bogota, the land use data was consulted from the land use office of the Capital District of Bogotá. Records of 2005 and 2011 were obtained with an appropriate level of detail.
With regard to the industry evolution, artisanal industry grew 417% during these years occupying the first place in the manufacturing sector in the capital. The medium industry grew 49% and the big industry grew 43%. Official codes analyzed were 93 and 98.
Number of warehouses (specify year(s))
2005: 351
2011: 493
Number of warehouses per million people (specify year(s))
2011: 61
Number of warehouses per 1000 km2 (specify year(s))
2011: 301
Average size of warehouses (specify year(s)); can be any indicator such as m2, m3 or number of employees
2005: 410 m2
2011: 382 m2
Time period studied for logistics sprawl analysis
2005-2011
CITYLAB – City Logistics in Living Laboratories
D.2.1 – CITYLAB Observatory of Strategic Developments Impacting Urban Logistics
158
Average distance of warehouses to centre of gravity (most recent year) (NB this doesn’t apply to megaregional types of urban regions)
5.3 km
Change in average distance of warehouses to centre of gravity (over the years)
+0.6 km (2005-2011)
Change in average distance of warehouses to centre of gravity per year
0.10 km/year
Cluster indicator
Not analysed
Type of land use control
- Strictly local - Some sort of metropolitan-wide land use control - Some sort of region-wide (or state-wide) land use control
Other comments/information
An additional study will consider the whole metropolitan area.
Scientific or technical references
Daraviña, P. A. C., Suescún, J. P. B. (2016) Logistic sprawl and polarization in Colombian urban areas. Presented at WCTR 2016, Shanghai (China).
CITYLAB – City Logistics in Living Laboratories
D.2.1 – CITYLAB Observatory of Strategic Developments Impacting Urban Logistics
159
Brussels, Belgium
Name and size of studied metropolitan area, number of municipalities
Brussels metropolitan area (2,300 km2).
There is no official, political or statistical definition of the Brussels metropolitan area. Brussels metropolitan area is the maximum extension of the metropolitan transport network of Brussels. It is recognized as a good proxy of the metropolitan extension of Brussels49.
135 municipalities
Type of metropolitan area
Monocentric or rather monocentric
Polycentric or rather polycentric
Megaregion
Population
2011: 2.5 million
Population density
1,087/km2
Name of warehouse data source and brief description
Data on warehouses are based on the Belgian cadastral register50. Parcels of land occupied by warehouses are registered at the municipal level with an annual update. The number of parcels and the total area of them are given for each municipality.
For studying logistics activities geography at a more refined level, within the Brussels metropolitan area, we used data on job location from the Belgian Statistical Office and the cadastral data, both at the municipality level. Information on jobs is available at the European NACE 5 level, from 1995 to 2012.
Cadastral data are available from 1982 to 2014; information given is the surface of land occupied by warehouses.
Other data are road freight flows inside the Brussels metropolitan area, on highways and major roads, based on traffic counts. Evaluations of delivery volumes are based on the economic structure and on ratio calculated by Patier & Routhier (2009).
Number of warehouses (specify year-s)
1982: 8,827*
2012: 10,553*
* amount of cadastral parcels occupied by warehouses
Number of warehouses per million people (specify year-s)
49 http://www.bruxellesmobilite.irisnet.be/static/attachments/2012-06-22/fr/Cahiers-Observatoire-mobilite.pdf 50 http://statbel.fgov.be/fr/statistiques/chiffres/environnement/geo/occupation_sol_cadastre/

CITYLAB – City Logistics in Living Laboratories
D.2.1 – CITYLAB Observatory of Strategic Developments Impacting Urban Logistics
160
1982: 2,716*
2012: 3,247*
* based on the amount of cadastral parcels occupied by warehouses
Number of warehouses per 1000 km2 (specify year-s)
1982: 3,837*
2012: 4,588*
* based on the amount of cadastral parcels occupied by warehouses
Average size of warehouses (specify year-s); can be any indicator such as m2, m3 or number of employees
1982: 1,258 m²*
2012: 2,962 m²*
* based on the amount of cadastral parcels occupied by warehouses
Time period studied for logistics sprawl analysis
1982-2012
Average distance of warehouses to center of gravity (most recent year) (NB this doesn’t apply to megaregional types of urban regions)
21.2 km
Change in average distance of warehouses to center of gravity (over the years)
+2.5 km
Change in average distance of warehouses to center of gravity per year
0.08 km/year
Cluster indicator
None available
Type of land use control
Strictly local
Some sort of metropolitan wide land use control
Some sort of region wide (or State wide) land use control
Other comments/information
In Belgium, land use control is a municipal and regional matter. Brussels metropolitan area covers the three Belgian federal entities. Each of them has its own land use policy and there is no metropolitan coordination.
Scientific or technical references

CITYLAB – City Logistics in Living Laboratories
D.2.1 – CITYLAB Observatory of Strategic Developments Impacting Urban Logistics
161
Strale M., Lebeau P., Wayens B., Hubert M., Macharis C. (2015), « Le transport de marchandises et la logistique à Bruxelles : état des lieux et perspectives », Cahiers de l’observatoire de la Mobilité de la Région de Bruxelles-Capitale, n°4, 112p. http://www.mobielbrussel.irisnet.be/static/attachments/articles/na/730/BXLCAP1_1409%20Observatoire%20de%20la%20Mobilite%EF%BF%BD%EF%BF%BD_LOW.pdf
Strale M., Boveldt, G., Dobruszkes, F., Macharis, C. (2016) Logistics sprawl in the Brussels metropolitan area: territorial, socioeconomic and political aspects. Submitted to 14th World Conference on Transport Research, Shangai (China).

CITYLAB – City Logistics in Living Laboratories
D.2.1 – CITYLAB Observatory of Strategic Developments Impacting Urban Logistics
162
Calgary, Canada
Name and size of studied metropolitan area
Calgary Region (5,107 km2)
9 municipalities
Type of metropolitan area
Monocentric or rather monocentric
Polycentric or rather polycentric
Megaregion
Population
2002: 1.02 million
2012: 1.31 million
Population density
2012: 257/km2
Name of warehouse data source and brief description
Enhanced Points of Interest (EPOI) dataset by DMTI, a Canadian provider of geographic and marketing data.DMTI’s data included a 2002 dataset with businesses listed in SIC (Standard Industrial Classification) format and a 2012 dataset with businesses listed in NAICS(North American Industrial Classification System). Categories surveyed for the study: SIC 422(very similar to NAICS 493) and NAICS 493 businesses. The 2002 SIC 422 Public Warehousing and Storage list of businesses was converted to NAICS 493 businesses.
As mini-storage units have been found to be quite incorrectly classified as warehouses, the database was cleaned accordingly.
NAICS 493 represents the following types of warehouses: ““Warehouse” defined as: “Industries in the Warehousing and Storage subsector are primarily engaged in operating warehousing and storage facilities for general merchandise, refrigerated goods, and other warehouse products. These establishments provide facilities to store goods. They do not sell the goods they handle. These establishments take responsibility for storing the goods and keeping them secure. They may also provide a range of services, often referred to as logistics services, related to the distribution of goods. Logistics services can include labelling, breaking bulk, inventory control and management, light assembly, order entry and fulfilment, packaging, pick and pack, price marking and ticketing, and transportation arrangement. However, establishments in this industry group always provide warehousing or storage services in addition to any logistic services. Furthermore, the warehousing or storage of goods must be more than incidental to the performance of services, such as price marking.” (Source: NAICS).
Number of warehouses (specify year-s)
2002: 21
2012: 59

CITYLAB – City Logistics in Living Laboratories
D.2.1 – CITYLAB Observatory of Strategic Developments Impacting Urban Logistics
163
Number of warehouses per million people (specify year-s)
2002: 16
2012: 45
Number of warehouses per 1000 km2 (specify year-s)
2002: 4
2012: 12
Average size of warehouses (specify year-s); can be any indicator such as m2, m3 or number of employees
Not calculated
Time period studied for logistics sprawl analysis
2002-2012
Average distance of warehouses to center of gravity (most recent year) (NB this doesn’t apply to megaregional types of urban regions)
8.9 km
Change in average distance of warehouses to center of gravity (over the years)
+3.5 km
Cluster indicator
No available.
Type of land use control
Strictly local
Some sort of metropolitan wide land use control
Some sort of region wide (or State wide) land use control
Not indicated
Other comments/information
Calgary exhibits a larger increase in the number of warehouse businesses compared to other Canadian cities.
Sprawl in the Calgary area is driven by growth in warehousing businesses that are farther away from the Calgary urban area.
The three dissemination areas (a dissemination area is a spatial unit used by the Census of Canada – of sub-neighbourhood size) on the north side of the city grew from having zero warehousing establishments in 2002 to having 8 establishments in 2012, which are located around the Calgary Airport.
Scientific or technical references

CITYLAB – City Logistics in Living Laboratories
D.2.1 – CITYLAB Observatory of Strategic Developments Impacting Urban Logistics
164
Woudsma, C., Jakubicek, P. 2016. Logistics land use patterns in metropolitan Canada. Presented at 14th World Conference on Transport Research, Shangai (China).
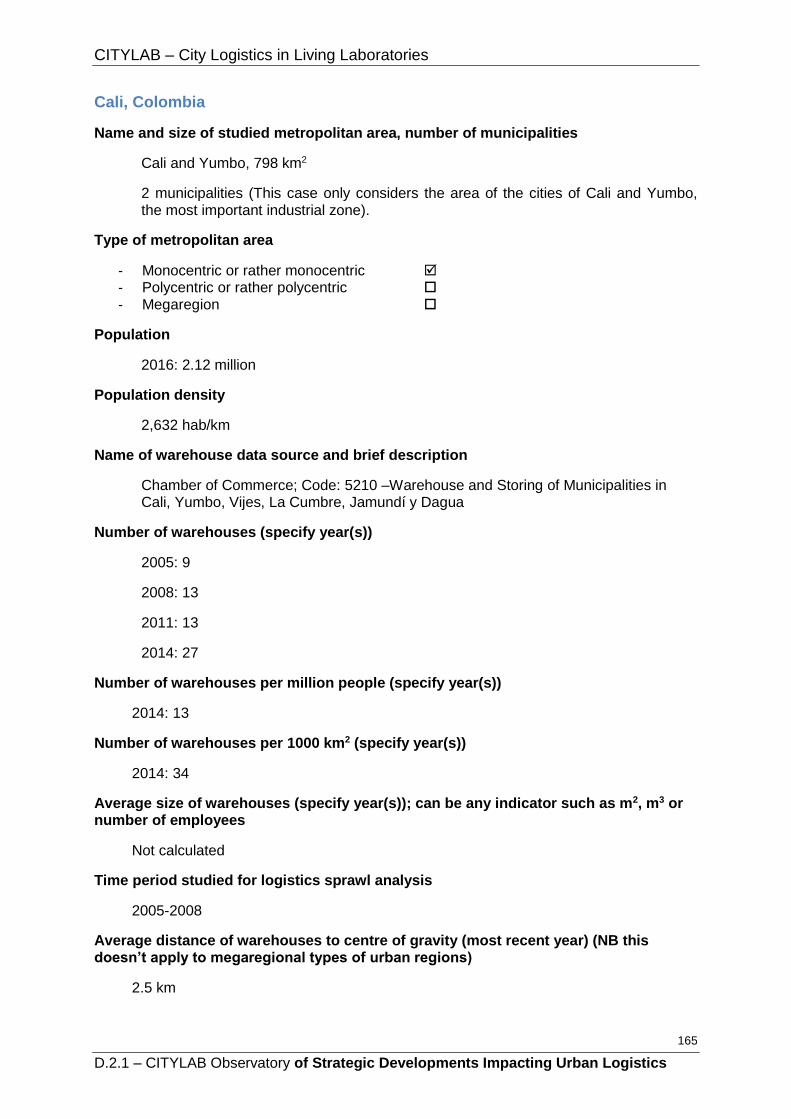
CITYLAB – City Logistics in Living Laboratories
D.2.1 – CITYLAB Observatory of Strategic Developments Impacting Urban Logistics
165
Cali, Colombia
Name and size of studied metropolitan area, number of municipalities
Cali and Yumbo, 798 km2
2 municipalities (This case only considers the area of the cities of Cali and Yumbo, the most important industrial zone).
Type of metropolitan area
- Monocentric or rather monocentric - Polycentric or rather polycentric - Megaregion
Population
2016: 2.12 million
Population density
2,632 hab/km
Name of warehouse data source and brief description
Chamber of Commerce; Code: 5210 –Warehouse and Storing of Municipalities in Cali, Yumbo, Vijes, La Cumbre, Jamundí y Dagua
Number of warehouses (specify year(s))
2005: 9
2008: 13
2011: 13
2014: 27
Number of warehouses per million people (specify year(s))
2014: 13
Number of warehouses per 1000 km2 (specify year(s))
2014: 34
Average size of warehouses (specify year(s)); can be any indicator such as m2, m3 or number of employees
Not calculated
Time period studied for logistics sprawl analysis
2005-2008
Average distance of warehouses to centre of gravity (most recent year) (NB this doesn’t apply to megaregional types of urban regions)
2.5 km

CITYLAB – City Logistics in Living Laboratories
D.2.1 – CITYLAB Observatory of Strategic Developments Impacting Urban Logistics
166
Change in average distance of warehouses to centre of gravity (over the years)
+0.5 km (2005-2008)
Change in average distance of warehouses to centre of gravity per year
0.17 km/year
Cluster indicator
Not analysed
Type of land use control
- Strictly local - Some sort of metropolitan-wide land use control - Some sort of region-wide (or state-wide) land use control
Other comments/information
An additional study will consider the whole metropolitan area.
Scientific or technical references
Daraviña, P. A. C., Suescún, J. P. B. (2016) Logistic sprawl and polarization in Colombian urban areas. Presented at WCTR 2016, Shanghai (China).

CITYLAB – City Logistics in Living Laboratories
D.2.1 – CITYLAB Observatory of Strategic Developments Impacting Urban Logistics
167
Chicago, USA
Name and size of studied metropolitan area
Chicago Metropolitan Area (28,120 km2)
8 municipalities
Type of metropolitan area
Monocentric or rather monocentric
Polycentric or rather polycentric
Megaregion
Population
2012: 7.3million
Population density
260/km2
Name of warehouse data source and brief description
US Census Bureau County Business Patterns Survey, category 493 (Warehouse & Storage) of NAICS (North American Industrial Classification System)
Number of warehouses (specify year-s)
1998: 217
2012: 466
Number of warehouses per million people (specify year-s)
1998: 30
2012: 64
Number of warehouses per 1000 km2 (specify year-s)
1998: 8
2012: 17
Average size of warehouses (specify year-s); can be any indicator such as m2, m3 or number of employees
Not calculated
Time period studied for logistics sprawl analysis
1998-2013
Average distance of warehouses to center of gravity (most recent year) (NB this doesn’t apply to megaregional types of urban regions)
79.84km

CITYLAB – City Logistics in Living Laboratories
D.2.1 – CITYLAB Observatory of Strategic Developments Impacting Urban Logistics
168
Change in average distance of warehouses to center of gravity (over the years)
+8.84km
Cluster indicator
No available.
Type of land use control
Strictly local
Some sort of metropolitan wide land use control
Some sort of region wide (or State wide) land use control
Not indicated
Other comments/information
The average distance from the Barycenter to all other establishments defined by
NAICS increased from 22,538.03 kilometers to 24,174.40 kilometers.
The distance for warehouse establishments increased by 11.5% compared to 7.3% of
all other establishments.
Spatially, the growth has expanded in all directions away from the Chicago.
Many of the new warehouse establishments did not converge around the intermodal
terminals.
Some Zip Codes experienced the largest growth in number of establishments.
Scientific or technical references
Dubie, M., Giron-Valderrama, G., Goodchild, A. 2016. Logistics Sprawl: An Evaluation of Chicago. Presented at 14th World Conference on Transport Research, Shangai (China).

CITYLAB – City Logistics in Living Laboratories
D.2.1 – CITYLAB Observatory of Strategic Developments Impacting Urban Logistics
169
Gothenburg metro, Sweden
Name and size of studied metropolitan area
Gothenburg Metropolitan Area (3694.86km2)
12 municipalities
Type of metropolitan area
Monocentric or rather monocentric
Polycentric or rather polycentric
Megaregion
Population (2014)
2014: 973,261
Population density (2014)
263.5 /km2
Name of warehouse data source and brief description
Using the NACE code 52.1 from the SCB database was not relevant for the Gothenburg case, because we count only 51 warehouses in 2013 in this database so we used another method. In order to measure the location of the warehouses, we used a database containing economic establishments of Sweden, with NACE codes, provided by SCB (Statistiskacentralbyrån), providing exact addresses. This allowed us to geocode the establishments precisely, using a GIS system.
We cleaned the database to retain only actual logistics activities (some establishments, which are noted as logistics establishments, have no logistics activities whatsoever, such as company headquarters, or passenger transportation establishments). A number of filters were implemented.
The most important work was to gather information through the observation of satellite images of the addresses noted in the SCB database. Sometimes, observation of street photographs was also useful. We have checked for the morphology of the building, the
The logistics sprawl indicator has been weighted by the number of employees.
Number of warehouses (specify year(s))
2000: 138
2014: 205
Number of warehouses per million people (specify year(s))
2000: 134.4
2014: 199.5
Number of warehouses per 1000 km2 (specify year(s))

CITYLAB – City Logistics in Living Laboratories
D.2.1 – CITYLAB Observatory of Strategic Developments Impacting Urban Logistics
170
2000: 51
2014: 75.8
Average size of warehouses (specify year(s)); can be any indicator such as m2, m3 or number of employees
Code Class Employees Number of warehouses in 2014
1 0 5
2 1-4 12
3 5-9 36
4 10-19 66
5 20-49 46
6 50-99 24
7 100-199 7
8 200-499 7
9 500-999 1
10 1000-1499 1
11 1500-1999 0
12 2000-2999 0
13 3000-3999 0
14 4000-4999 0
15 5000-9999 0
16 10000 0
Time period studied for logistics sprawl analysis
2000-2014
Average distance of warehouses to centre of gravity (most recent year) (NB this doesn’t apply to megaregional types of urban regions)
2000: 9.1 km
2014: 13.3 km
Change in average distance of warehouses to centre of gravity (over the years)
+4.2 km (+46.2%)
Change in average distance of warehouses to centre of gravity per year
0.3 km/year
Cluster indicator
There is a clustering, and increased concentration of warehousing activity in the Gothenburg region.
Type of land use control
Strictly local
Some sort of metropolitan-wide land use control
Some sort of region-wide (or state-wide) land use control

CITYLAB – City Logistics in Living Laboratories
D.2.1 – CITYLAB Observatory of Strategic Developments Impacting Urban Logistics
171
Other comments/information
Scientific or technical references
Heitz A., Dablanc L., Olsson J., Woxenius Y. (2016) Logistics sprawl patterns in Gothenburg, Sweden. Submitted to World Conference on Transport Research, Shanghai, China.

CITYLAB – City Logistics in Living Laboratories
D.2.1 – CITYLAB Observatory of Strategic Developments Impacting Urban Logistics
172
Gothenburg region, Sweden
Name and size of studied metropolitan area
Västra Götalands County (Gothenburg region) 22,752 km2
48 municipalities
Type of metropolitan area
Monocentric or rather monocentric
Polycentric or rather polycentric
Megaregion
Population (2014)
2014: 1.6 million
Population density (2014)
68.58 /km2
Name of warehouse data source and brief description
Using the NACE code 52.1 from the SCB database was not relevant for the Gothenburg case, because we count only 51 warehouses in 2013 in this database so we used another method.
In order to measure the location of the warehouses, we used a database containing economic establishments of Sweden, with NACE codes, provided by SCB (Statistiskacentralbyrån), providing exact addresses. This allowed us to geocode the establishments precisely, using a GIS system.
We cleaned the database to retain only actual logistics activities (some establishments, which are noted as logistics establishments, have no logistics activities whatsoever, such as company headquarters, or passenger transportation establishments). A number of filters were implemented.
The most important work was to gather information through the observation of satellite images of the addresses noted in the SCB database. Sometimes, observation of street photographs was also useful. We have checked for the morphology of the building.
Number of warehouses (specify year(s))
2000: 263
2014: 382
Number of warehouses per million people (specify year(s))
2000: 224
2014: 236.5
Number of warehouses per 1000 km2 (specify year(s))

CITYLAB – City Logistics in Living Laboratories
D.2.1 – CITYLAB Observatory of Strategic Developments Impacting Urban Logistics
173
2000: 11.4
2014: 16.6
Average size of warehouses (specify year(s)); can be any indicator such as m2, m3 or number of employees
Code Class Employees Number of warehouses
1 0 12
2 1-4 21
3 5-9 86
4 10-19 113
5 20-49 85
6 50-99 40
7 100-199 10
8 200-499 9
9 500-999 1
10 1000-1499 1
11 1500-1999 0
12 2000-2999 0
13 3000-3999 0
14 4000-4999 0
15 5000-9999 0
16 10000 0
Time period studied for logistics sprawl analysis
2000-2014
Average distance of warehouses to centre of gravity (most recent year) (NB this doesn’t apply to megaregional types of urban regions)
2000: 79.3 km
2014: 82 km
Change in average distance of warehouses to centre of gravity (over the years)
+2.7 km
Change in average distance of warehouses to centre of gravity per year
0.19 km/year
Cluster indicator
There is a clustering, and increased concentration of warehousing activity in the Gothenburg region.
Type of land use control
Strictly local
Some sort of metropolitan-wide land use control
Some sort of region-wide (or state-wide) land use control
CITYLAB – City Logistics in Living Laboratories
D.2.1 – CITYLAB Observatory of Strategic Developments Impacting Urban Logistics
174
Other comments/information
The presence of the port located in Gothenburg is an important factor in keeping a low sprawl indicator, as terminals over time have concentrated in the vicinity of the port.
Scientific or technical references
Heitz A., Dablanc L., Olsson J., Woxenius Y. (2016a) Logistics sprawl patterns in Gothenburg, Sweden. Proposed at World Conference on Transport Research, Shanghai, China.

CITYLAB – City Logistics in Living Laboratories
D.2.1 – CITYLAB Observatory of Strategic Developments Impacting Urban Logistics
175
Halifax, Canada
Name and size of studied metropolitan area
Halifax Regional Municipality (5,490 km2)
4 municipalities
Type of metropolitan area
Monocentric or rather monocentric
Polycentric or rather polycentric
Megaregion
Population
2002: 0.35 million
2012: 0.39 million
Population density
2012: 71/km2
Name of warehouse data source and brief description
Enhanced Points of Interest (EPOI) dataset by DMTI, a Canadian provider of geographic and marketing data.DMTI’s data included a 2002 dataset with businesses listed in SIC (Standard Industrial Classification) format and a 2012 dataset with businesses listed in NAICS(North American Industrial Classification System). Categories surveyed for the study: SIC 422(very similar to NAICS 493) and NAICS 493 businesses. The 2002 SIC 422 Public Warehousing and Storage list of businesses was converted to NAICS 493 businesses.
As mini-storage units have been found to be quite incorrectly classified as warehouses, the database was cleaned accordingly.
NAICS 493 represents the following types of warehouses: ““Warehouse” defined as: “Industries in the Warehousing and Storage subsector are primarily engaged in operating warehousing and storage facilities for general merchandise, refrigerated goods, and other warehouse products. These establishments provide facilities to store goods. They do not sell the goods they handle. These establishments take responsibility for storing the goods and keeping them secure. They may also provide a range of services, often referred to as logistics services, related to the distribution of goods. Logistics services can include labelling, breaking bulk, inventory control and management, light assembly, order entry and fulfilment, packaging, pick and pack, price marking and ticketing, and transportation arrangement. However, establishments in this industry group always provide warehousing or storage services in addition to any logistic services. Furthermore, the warehousing or storage of goods must be more than incidental to the performance of services, such as price marking.” (Source: NAICS).
Number of warehouses (specify year-s)
2002: 6

CITYLAB – City Logistics in Living Laboratories
D.2.1 – CITYLAB Observatory of Strategic Developments Impacting Urban Logistics
176
2012: 9
Number of warehouses per million people (specify year-s)
2002: 15
2012: 23
Number of warehouses per 1000 km2 (specify year-s)
2002: 1
2012: 2
Average size of warehouses (specify year-s); can be any indicator such as m2, m3 or number of employees
Not calculated
Time period studied for logistics sprawl analysis
2002-2012
Average distance of warehouses to center of gravity (most recent year) (NB this doesn’t apply to megaregional types of urban regions)
6.7 km
Change in average distance of warehouses to center of gravity (over the years)
+1.8 km
Cluster indicator
No available.
Type of land use control
Strictly local
Some sort of metropolitan wide land use control
Some sort of region wide (or State wide) land use control
Not indicated
Other comments/information
The total number of warehouse establishments in Halifax is relatively small - 6 in 2002 and 9 in 2012.
The lack of a large local population base (lacking consumer demands), challenging physiography (bridge crossings creating bottlenecks), and distances from major markets may contribute to this lack of development.
The issues with data and the reporting of facilities may be at play because logistics activity associated with the Port of Halifax drive the local economy and there are significant post-Panamax container terminals, cold chain facilities, the Halifax logistics park and intermodal rail services throughout the port area.

CITYLAB – City Logistics in Living Laboratories
D.2.1 – CITYLAB Observatory of Strategic Developments Impacting Urban Logistics
177
Scientific or technical references
Woudsma, C., Jakubicek, P. 2016. Logistics land use patterns in metropolitan Canada. Presented at 14th World Conference on Transport Research, Shangai (China).

CITYLAB – City Logistics in Living Laboratories
D.2.1 – CITYLAB Observatory of Strategic Developments Impacting Urban Logistics
178
Los Angeles, USA
Name and size of studied metropolitan area
Los Angeles Combined Statistical Area (87,940 km2)
185 municipalities
Type of metropolitan area
Monocentric or rather monocentric
Polycentric or rather polycentric
Megaregion
Population
2014: 18.5 million
Population density
210/km2
Name of warehouse data source and brief description
County Business Patterns, category 493 (Warehouse & Storage) of NAICS (North American Industrial Classification System)
“Warehouse” defined as: “Industries in the Warehousing and Storage subsector are primarily engaged in operating warehousing and storage facilities for general merchandise, refrigerated goods, and other warehouse products. These establishments provide facilities to store goods. They do not sell the goods they handle. These establishments take responsibility for storing the goods and keeping them secure. They may also provide a range of services, often referred to as logistics services, related to the distribution of goods. Logistics services can include labelling, breaking bulk, inventory control and management, light assembly, order entry and fulfilment, packaging, pick and pack, price marking and ticketing, and transportation arrangement. However, establishments in this industry group always provide warehousing or storage services in addition to any logistic services. Furthermore, the warehousing or storage of goods must be more than incidental to the performance of services, such as price marking.” (NAICS)
Number of warehouses (specify year(s))
1998: 220
2013: 946
Number of warehouses per million people (specify year(s))
1998: 13.4
2013: 51
Number of warehouses per 1000 km2 (specify year(s))
1998: 2.5
2013: 10.7

CITYLAB – City Logistics in Living Laboratories
D.2.1 – CITYLAB Observatory of Strategic Developments Impacting Urban Logistics
179
Average size of warehouses (specify year(s)); can be any indicator such as m2, m3 or number of employees
Not calculated
Time period studied for logistics sprawl analysis
1998-2009
Average distance of warehouses to centre of gravity (most recent year) (NB this doesn’t apply to megaregional types of urban regions)
51.4 km
Change in average distance of warehouses to centre of gravity (over the years)
+9.7 km
Change in average distance of warehouses to centre of gravity per year
0.88 km/year
Cluster indicator
None available
Type of land use control
Strictly local
Some sort of metropolitan-wide land use control
Some sort of region-wide (or state-wide) land use control
Other comments/information
Logistics sprawl has been compared with sprawl of economic activities in general. Average distance of all establishments from their barycentre remained stable, changing from 41.748 to 41.714 miles. Showing a huge discrepancy: LS indicator much higher, while the indicator for economic activities is very stable overtime.
Scientific or technical references
Dablanc, L., Ogilvie, S., Goodchild, A. (2014) Logistics Sprawl: Differential Warehousing Development Patterns in Los Angeles and Seattle. Transportation Research Record: Journal of the Transportation Research Board, 2410, 105-112.

CITYLAB – City Logistics in Living Laboratories
D.2.1 – CITYLAB Observatory of Strategic Developments Impacting Urban Logistics
180
Montreal, Canada
Name and size of studied metropolitan area
Greater Montreal (4,258 km2)
82 municipalities
Type of metropolitan area
Monocentric or rather monocentric
Polycentric or rather polycentric
Megaregion
Population
2002: 2.85 million
2012: 5.08 million
Population density
2012: 1,194/km2
Name of warehouse data source and brief description
Enhanced Points of Interest (EPOI) dataset by DMTI, a Canadian provider of geographic and marketing data.DMTI’s data included a 2002 dataset with businesses listed in SIC (Standard Industrial Classification) format and a 2012 dataset with businesses listed in NAICS(North American Industrial Classification System). Categories surveyed for the study: SIC 422(very similar to NAICS 493) and NAICS 493 businesses. The 2002 SIC 422 Public Warehousing and Storage list of businesses was converted to NAICS 493 businesses.
As mini-storage units have been found to be quite incorrectly classified as warehouses, the database was cleaned accordingly.
NAICS 493 represents the following types of warehouses: ““Warehouse” defined as: “Industries in the Warehousing and Storage subsector are primarily engaged in operating warehousing and storage facilities for general merchandise, refrigerated goods, and other warehouse products. These establishments provide facilities to store goods. They do not sell the goods they handle. These establishments take responsibility for storing the goods and keeping them secure. They may also provide a range of services, often referred to as logistics services, related to the distribution of goods. Logistics services can include labelling, breaking bulk, inventory control and management, light assembly, order entry and fulfilment, packaging, pick and pack, price marking and ticketing, and transportation arrangement. However, establishments in this industry group always provide warehousing or storage services in addition to any logistic services. Furthermore, the warehousing or storage of goods must be more than incidental to the performance of services, such as price marking.” (Source: NAICS).
Number of warehouses (specify year-s)
2002: 79
2012: 70

CITYLAB – City Logistics in Living Laboratories
D.2.1 – CITYLAB Observatory of Strategic Developments Impacting Urban Logistics
181
Number of warehouses per million people (specify year-s)
2002: 16
2012: 14
Number of warehouses per 1000 km2 (specify year-s)
2002: 19
2012: 16
Average size of warehouses (specify year-s); can be any indicator such as m2, m3 or number of employees
Not calculated
Time period studied for logistics sprawl analysis
2002-2012
Average distance of warehouses to center of gravity (most recent year) (NB this doesn’t apply to megaregional types of urban regions)
8.1 km
Change in average distance of warehouses to center of gravity (over the years)
+0.1 km
Cluster indicator
No available.
Type of land use control
Strictly local
Some sort of metropolitan wide land use control
Some sort of region wide (or State wide) land use control
Not indicated
Other comments/information
The number of warehouses in the city stayed about the same, which was unexpected for a city of its national stature (2nd largest metropolitan area and among the oldest established cities in North America), and one with an important port complex and easy access to large US markets. This issue will need to be further looked at.
The decrease in the concentration of warehouses on the island of Montreal near the Trudeau International airport is contrasted with the slight increase in establishments near the Mirabel airport north of the study area.
There appears to be smaller increases in establishments on the eastern end of the Island of Montreal.
There appears to be a shift in location to outlying areas with greater land availability.

CITYLAB – City Logistics in Living Laboratories
D.2.1 – CITYLAB Observatory of Strategic Developments Impacting Urban Logistics
182
Scientific or technical references
Woudsma, C., Jakubicek, P. 2016. Logistics land use patterns in metropolitan Canada. Presented at 14th World Conference on Transport Research, Shangai (China).

CITYLAB – City Logistics in Living Laboratories
D.2.1 – CITYLAB Observatory of Strategic Developments Impacting Urban Logistics
183
Paris, France - all warehouses
Name and size of studied metropolitan area
Paris Region (Ile-de-France)
12 058 km2
1300 municipalities
Type of metropolitan area
Monocentric or rather monocentric
Polycentric or rather polycentric
Megaregion
Population (2014)
2014: 11,79 million
Population density (2014)
977.5/km2
Name of warehouse data source and brief description
NACE 52.1 Warehouse and Storage
The Statistical Classification of Economic Activities in the European Community, commonly referred to as NACE, is the industry standard classification system used in the European Union. The current version is revision 2 and was established by Regulation (EC) No 1893/2006. It is the European implementation of the UN classification ISIC, revision 4.NACE is similar in function to the SIC and NAICS systems.
This class includes: - operation of storage and warehouse facilities for all kinds of goods: - operation of grain silos, general merchandise warehouses, refrigerated warehouses, storage tanks etc.
This class also includes: - storage of goods in foreign trade zones - blast freezing
This class excludes: - parking facilities for motor vehicles, see 52.21 - operation of self-storage facilities, see 68.20 - rental of vacant space, see 68.20
Number of warehouses (specify year(s))
2000: 714
2012: 955
Number of warehouses per million people (specify year(s))

CITYLAB – City Logistics in Living Laboratories
D.2.1 – CITYLAB Observatory of Strategic Developments Impacting Urban Logistics
184
2000: 65
2012: 81
Number of warehouses per 1000 km2 (specify year(s))
2000: 59
2012: 79
Average size of warehouses (specify year(s)); can be any indicator such as m2, m3 or number of employees
Forthcoming information
According to DRIEA (2009), about 20% of the warehouses in the Paris region are less than 500m².
Time period studied for logistics sprawl analysis
2000-2012
Average distance of warehouses to centre of gravity (most recent year)(NB this doesn’t apply to megaregional types of urban regions)
2000: 17.5 km
2012: 21 km
Change in average distance of warehouses to centre of gravity (over the years)
+3.5 km
Change in average distance of warehouses to centre of gravity per year (km/year)
0.29 km/year
Cluster indicator
In general, the Paris region consists of a constellation of medium-sized specialized logistics clusters. The development of medium-sized concentrated clusters in the west increases in proportion. In the east, we can observe the movement of successive fronts of medium-sized clusters which push metropolitan boundaries ever further outwards. In 2000 and 2012 we can observe two moving clusters to the north and to the south of Paris, in the inner suburban ring where warehousing activities seem to be particularly prone to locate. These concentrations covered fairly large areas in 2000, which corresponded to the former industrial areas (as Pantin or La Courneuve, in the north). The growth of logistics activities is based on a diffuse polarization in the inner suburbs, reinforcing logistics sprawl and lengthening distances from the historical Paris centre. Warehouse clusters also appear at the fringe of the first ring of suburbs. These clusters are located around specific multimodal transport infrastructure such as ports and airports. The cluster formed by Roissy CDG airport also seems to have grown in 2012. The three main clusters in the inner suburban ring (Gennevilliers to the north, Roissy to the north-east, and Orly-Rungis to the south) are also major national and regional freight gateways. These clusters have excellent transportation infrastructure: port terminals, container terminals, airports and good highway connections.
Type of land use control

CITYLAB – City Logistics in Living Laboratories
D.2.1 – CITYLAB Observatory of Strategic Developments Impacting Urban Logistics
185
Strictly local Some sort of metropolitan-wide land use control Some sort of region-wide (or state-wide) land use control
Other comments/information
Ile-de-France is the largest consumption area in France, which demands an efficient logistics organization. The region contains approximately 20% of France’s total warehousing space. The transportation and logistics sectors account for almost 10% of employment in the region (about 400,000 jobs). Between 2000 and 2012, the Paris region experienced a 33% increase in the number of its warehousing facilities.
At the megaregional scale of the "Paris Basin", which contains the Paris region, the number of warehousing facilities has increased by 30% in twelve years. Between 2000 and 2012, the mean distance from the centre of gravity fell from 155 km to 110 km: there is clearly an inward movement around the Paris region. The Paris region is "encircled" by logistics clusters, located at its edges. The clusters located in the east and the South have become considerably larger. The regions to the north and east seem to have become specialized in this type of logistics between 2000 and 2012 which has been confirmed in the specialized press as well as from the interviews we have conducted.
Scientific or technical references
Heitz A., Dablanc L. (2015) Logistics Spatial Patterns In Paris: The Rise of The Paris Basin as a Logistics Megaregion. Transportation Research Record: Journal of the Transportation Research Board, 2477, pp. 76-84.

CITYLAB – City Logistics in Living Laboratories
D.2.1 – CITYLAB Observatory of Strategic Developments Impacting Urban Logistics
186
Paris, France – parcel and express transport terminals
Name and size of studied metropolitan area
Paris Region (Ile-de-France)
12 058 km2
1300 municipalities
Type of metropolitan area
Monocentric or rather monocentric
Polycentric or rather polycentric
Megaregion
Population (2014)
2014: 11,79 million
Population density (2014)
977.5/km2
Name of warehouse data source and brief description
Parcel and express transport operators' terminals.Comprehensive collection of terminals by use of the Yellow Pages. Data then grouped by municipality.
Number of warehouses (specify year(s))
1974: 31
2010: 90
Number of warehouses per million people (specify year(s))
2010: 7.5
Number of warehouses per 1000 km2 (specify year(s))
2010: 7.5
Average size of warehouses (specify year(s)); can be any indicator such as m2, m3 or number of employees
Not calculated
Time period studied for logistics sprawl analysis
1974-2010
Average distance of warehouses to centre of gravity (most recent year)(NB this doesn’t apply to megaregional types of urban regions)
1974: 6.3 km
2010: 18.1 km

CITYLAB – City Logistics in Living Laboratories
D.2.1 – CITYLAB Observatory of Strategic Developments Impacting Urban Logistics
187
Change in average distance of warehouses to centre of gravity (over the years)
+11.8 km
Change in average distance of warehouses to centre of gravity per year (km/year)
0.33 km/year
Cluster indicator
Not calculated
Type of land use control
Strictly local
Some sort of metropolitan-wide land use control
Some sort of region-wide (or state-wide) land use control
Other comments/information
An analysis of sprawl for jobs was also conducted. From 1975 to 2006, the average distance of jobs to their barycentre has increased by two kilometres. This is a sign of a much faster growth pattern for logistics activities than for all economic activities in general.
Scientific or technical references
Andriankaja, D. (2014) Le « desserrement logistique », quelle responsabilité dans l’augmentation des émissions de CO2 des activités de messagerie? (Logistics sprawl, what responsibility in CO2 emissions from the parcel and express transport sector?). PhD Thesis, IFSTTAR/University of Paris-East, June.

CITYLAB – City Logistics in Living Laboratories
D.2.1 – CITYLAB Observatory of Strategic Developments Impacting Urban Logistics
188
Randstad, The Netherlands
Name and size of studied metropolitan area
The Randstad Region (14,668 km2)
170 municipalities
Type of metropolitan area
Monocentric or rather monocentric
Polycentric or rather polycentric
Megaregion
Population (2014)
2014: 8,59 million
Population density (2014)
586.1/km2
Name of warehouse data source and brief description
NACE 52.1
The Statistical Classification of Economic Activities in the European Community, commonly referred to as NACE, is the industry standard classification system used in the European Union. The current version is revision 2 and was established by Regulation (EC) No 1893/2006. It is the European implementation of the UN classification ISIC, revision 4. NACE is similar in function to the SIC and NAICS systems.
This class includes: - operation of storage and warehouse facilities for all kinds of goods: - operation of grain silos, general merchandise warehouses, refrigerated warehouses, storage tanks etc.
This class also includes: - storage of goods in foreign trade zones - blast freezing
This class excludes: - parking facilities for motor vehicles, see 52.21 - operation of self-storage facilities, see 68.20 - rental of vacant space, see 68.20
Number of warehouses (specify year(s))
2007: 628
2013: 631
Number of warehouses per million people (specify year(s))
2007: 81.1

CITYLAB – City Logistics in Living Laboratories
D.2.1 – CITYLAB Observatory of Strategic Developments Impacting Urban Logistics
189
2013: 73.4
Number of warehouses per 1000 km2 (specify year(s))
2007: 42.9
2013: 43.2
Average size of warehouses (specify year(s)): can be any indicator such as m2, m3 or number of employees
Forthcoming information
Time period studied for logistics sprawl analysis
2007-2013
Average distance of warehouses to centre of gravity (most recent year)(NB this doesn’t apply to megaregional types of urban regions)
Agglomeration 2007 2013
Flevoland (incl. The Hague) 17.7 km 21 km Noord Holland (incl. Amsterdam) 21.6 km 19.6 km Zuid Holland (incl. Rotterdam) 16.3 km 15.3 km Utrecht 12.3 km 12.8 km
Change in average distance of warehouses to centre of gravity (over the years)
Agglomeration Change
Flevoland (incl. The Hague) +18.6 % Noord Holland (incl. Amsterdam) -9.5% Zuid Holland (incl. Rotterdam) -6.2% Utrecht +4%
Cluster indicator
Forthcoming calculations
Warehouses establishments are clustered around the four main metropolitan areas of the Randstad.
Type of land use control
Strictly local
Some sort of metropolitan-wide land use control
Some sort of region-wide (or state-wide) land use control
Other comments/information
The Randstad region experienced a dispersion of logistics activities in the 1970s when they moved from clusters to peripheral regions within the Netherlands (Davydenko et al., 2013). Nevertheless, our analysis measures these patterns in more detail and also seems to suggest a coordinated move of centres of gravity towards the “Groene Hart”, i.e. sprawl into the heart of the ring-shaped Randstad area, along the direction of the main highways connecting the cities. This is indicated by a convergence of the centres of gravity. The observed geographic patterns of change may be a result of both centripetal forces and centrifugal ones at the

CITYLAB – City Logistics in Living Laboratories
D.2.1 – CITYLAB Observatory of Strategic Developments Impacting Urban Logistics
190
Randstad level, which are superposed on the forces at city level. The net effect for cities may be concentration or deconcentration. However, if we observe the evolution of the location of warehouses in the last fifteen years, we can see that the deconcentration of warehouses is a permanent dynamic in the provinces of Utrecht and Flevoland. The province of Utrecht is small and biased by the city of Utrecht. Flevoland Province is slightly different from the others: it does not include major cities such as Amsterdam and Rotterdam, and in historical terms is a fairly recent creation. It cannot therefore be considered to be an urban centre in the same way as the others, but it is the subject of many proactive development policies, particularly for its new town of Almere. The deconcentration of warehouses is taking place in the provinces of Flevoland and Utrecht, although the intensity of the process is not the same, being relatively low in the province of Utrecht compared to Flevoland. We can hypothesize that the significant deconcentration taking place in the Flevoland province is linked to the recent nature of its development.
Scientific or technical references
Heitz A., Dablanc L., Tavasszy L. (2016), Logistics sprawl in monocentric and polycentric metropolitan areas: the case of Paris, France and the Randstad. Presented at the WCTRS Shanghai 2016.

CITYLAB – City Logistics in Living Laboratories
D.2.1 – CITYLAB Observatory of Strategic Developments Impacting Urban Logistics
191
Rotterdam, The Netherlands
Name and size of studied metropolitan area
Rotterdam Metropolitan Area: Zuid Holland province (3,418 km2)
68 municipalities
Type of metropolitan area
Monocentric or rather monocentric
Polycentric or rather polycentric
Megaregion
Population (2014)
2014: 3,56 million
2007: 3,46 million
2000: 3,39 million
Population density (2014)
1043/km2
Name of warehouse data source and brief description
NACE 52.1
The Statistical Classification of Economic Activities in the European Community, commonly referred to as NACE, is the industry standard classification system used in the European Union. The current version is revision 2 and was established by Regulation (EC) No 1893/2006. It is the European implementation of the UN classification ISIC, revision 4. NACE is similar in function to the SIC and NAICS systems.
This class includes: - operation of storage and warehouse facilities for all kinds of goods: - operation of grain silos, general merchandise warehouses, refrigerated warehouses, storage tanks etc.
This class also includes: - storage of goods in foreign trade zones - blast freezing
This class excludes: - parking facilities for motor vehicles, see 52.21 - operation of self-storage facilities, see 68.20 - rental of vacant space, see 68.20
Number of warehouses (specify year(s))
2007: 168

CITYLAB – City Logistics in Living Laboratories
D.2.1 – CITYLAB Observatory of Strategic Developments Impacting Urban Logistics
192
2013: 185
Number of warehouses per million people (specify year(s))
2007: 48.8
2013: 52
Number of warehouses per 1000 km2 (specify year(s))
2007: 81.1
2013: 73.4
Average size of warehouses (specify year(s)); can be any indicator such as m2, m3 or number of employees
No information
Time period studied for logistics sprawl analysis
2007-2013
Average distance of warehouses to centre of gravity (most recent year)(NB this doesn’t apply to megaregional types of urban regions)
2007: 16.3 km
2013: 15.3 km
Change in average distance of warehouses to centre of gravity (over the years)
-6.2%
Cluster indicator
Warehouses are mainly concentrated in the municipality of Rotterdam with 35.7% of the total number of the warehouses. The second major concentration is in 'S-Gravenzande with 7.1% of the total number of warehouses.
Type of land use control
Strictly local
Some sort of metropolitan-wide land use control
Some sort of region-wide (or state-wide) land use control
Other comments/information
The Port of Rotterdam and its entire region are integrated in a port regionalization dynamics, which means that logistics activities spread out into the region (Strale, 2013). Many activities are functionally linked to the port, and spread over a region that stretches from Dordrecht to Venlo through Tilburg (Priemus, Visser, 1995) crossing the boundaries of municipalities and provinces (Van der Burg, Vink, 2008). However, it seems that this dynamic has been reversed at local scale in the provinces of Zuid Holland in the last years. This observation allows us to appreciate how quickly the location of warehouses can change.

CITYLAB – City Logistics in Living Laboratories
D.2.1 – CITYLAB Observatory of Strategic Developments Impacting Urban Logistics
193
The port of Rotterdam is one of the most important logistics clusters in the Randstad (OECD, 2007) and therefore naturally has a high concentration of warehouses and other logistics activities. In Zuid Holland in recent decades the port of Rotterdam has sought to limit its spatial expansion. The port of Rotterdam has decided to focus on land use in the vicinity of port infrastructure for the development of logistics activities rather than to spread outside the port area. The Havenplan 2010 Port Development Plan emphasized the importance of limiting the space taken up by port development with the construction of the Second Maasvlakte, a polder in the North Sea near Rotterdam, and the relocation of activities (Priemus, Visser, 1995). The decision to build this landfill was taken in 2004 and the facility was opened in 2013. It should make it possible to concentrate activities in a limited area, thereby halting the expansion of the port towards the city and allowing re-urbanization of industrial areas. In anticipation of increased activity in the port, logistics activities have been redistributed around the port in recent years. The intensification of logistics we have observed reflects the existence of a new clustering of logistics activities.
Scientific or technical references
Heitz A., Dablanc L., Tavasszy L. (2016), Logistics sprawl in monocentric and polycentric metropolitan areas: the case of Paris, France and the Randstad. Presented at WCTRS Shanghai 2016.

CITYLAB – City Logistics in Living Laboratories
D.2.1 – CITYLAB Observatory of Strategic Developments Impacting Urban Logistics
194
Seattle, USA
Name and size of studied metropolitan area
Seattle Metropolitan Area (15,209.3 km2)
77 municipalities
Type of metropolitan area
Monocentric or rather monocentric
Polycentric or rather polycentric
Megaregion
Population
2014: 3.5 million
Population density
230.12/km2
Name of warehouse data source and brief description
County Business Patterns, category 493 (Warehouse & Storage) of NAICS (North American Industrial Classification System)
“Warehouse” defined as: “Industries in the Warehousing and Storage subsector are primarily engaged in operating warehousing and storage facilities for general merchandise, refrigerated goods, and other warehouse products. These establishments provide facilities to store goods. They do not sell the goods they handle. These establishments take responsibility for storing the goods and keeping them secure. They may also provide a range of services, often referred to as logistics services, related to the distribution of goods. Logistics services can include labelling, breaking bulk, inventory control and management, light assembly, order entry and fulfilment, packaging, pick and pack, price marking and ticketing, and transportation arrangement. However, establishments in this industry group always provide warehousing or storage services in addition to any logistic services. Furthermore, the warehousing or storage of goods must be more than incidental to the performance of services, such as price marking.” (NAICS)
Number of warehouses (specify year(s))
1998: 85
2009: 212
Number of warehouses per million people (specify year(s))
1998: 28.0
2009: 60.6
Number of warehouses per 1000 km2 (specify year(s))
1998: 5.59
2009: 13.94

CITYLAB – City Logistics in Living Laboratories
D.2.1 – CITYLAB Observatory of Strategic Developments Impacting Urban Logistics
195
Average size of warehouses (specify year(s)); can be any indicator such as m2, m3 or number of employees
Not calculated
Time period studied for logistics sprawl analysis
1998-2009
Average distance of warehouses to centre of gravity (most recent year) (NB this doesn’t apply to megaregional types of urban regions)
19.3 km
Change in average distance of warehouses to centre of gravity (over the years)
-1.3 km
Change in average distance of warehouses to centre of gravity per year
-0.12 km/year
Cluster indicator
There is a clustering, and increased concentration of warehousing activity in the Puget Sound region.
Type of land use control
Strictly local
Some sort of metropolitan-wide land use control
Some sort of region-wide (or state-wide) land use control
Other comments/information
There was a high concentration of warehouses near the barycentre in 1998, and additional warehouses were constructed in those zip codes (central area) by 2009.
Distance of all establishments from the barycentre was 16.3 miles in 1998, compared to 16.5 in 2009.
Scientific or technical references
Dablanc, L., Ogilvie, S., Goodchild, A. (2014) Logistics Sprawl: Differential Warehousing Development Patterns in Los Angeles and Seattle. Transportation Research Record: Journal of the Transportation Research Board, 2410, Freight Systems 2014, Vol. 1: Planning Modelling, and Logistics.

CITYLAB – City Logistics in Living Laboratories
D.2.1 – CITYLAB Observatory of Strategic Developments Impacting Urban Logistics
196
Shenzhen, China
Name and size of studied metropolitan area
Shenzhen (1,952 km2)
This case study is not metropolitan.
Type of metropolitan area
Monocentric or rather monocentric
Polycentric or rather polycentric
Megaregion
Population
2010: 10.4 million
Population density
5,328/km2
Name of warehouse data source and brief description
Shenzhen Building Census 2008 and 2012.
The warehouses buildings with less 300 meters square floor area were excluded from analysis.
Number of warehouses (specify year(s))
2008: 1,430
2012: 1,660
Number of warehouses per million people (specify year(s))
2008: 138
2012: 160
Number of warehouses per 1000 km2 (specify year(s))
2008: 733
2012: 850
Average size of warehouses (specify year(s)); can be any indicator such as m2, m3 or number of employees
Not available
Time period studied for logistics sprawl analysis
2008-2002
Average distance of warehouses to centre of gravity (most recent year) (NB this doesn’t apply to megaregional types of urban regions)

CITYLAB – City Logistics in Living Laboratories
D.2.1 – CITYLAB Observatory of Strategic Developments Impacting Urban Logistics
197
16.12 km (2012)
Change in average distance of warehouses to centre of gravity (over the years)
1.23 km
Change in average distance of warehouses to centre of gravity per year
0.31 km
Cluster indicator
None available
Type of land use control
Strictly local
Some sort of metropolitan-wide land use control
Some sort of region-wide (or state-wide) land use control
Other comments/information
The calculated mean centre of all warehouses location (without the coastal sample) moved to 1.36 km to the East and 1.72 km to North.
The deviation ellipses for 2012 slightly moved toward the north-eastern direction.
Figure I.6.13.1. Location of warehouses in 2008 and 2012.

CITYLAB – City Logistics in Living Laboratories
D.2.1 – CITYLAB Observatory of Strategic Developments Impacting Urban Logistics
198
Figure I.6.13.2. Weighted mean centre of warehouse locations in 2008 and 2012.
Scientific or technical references
Xiao, Z. (2017) Remarking urban logistics space: e-tailing and supply chain revolution in the case of Shenzhen, China. PhD Thesis. The University of Hong Kong. Defended on February 2.

CITYLAB – City Logistics in Living Laboratories
D.2.1 – CITYLAB Observatory of Strategic Developments Impacting Urban Logistics
199
Tokyo, Japan
Name and size of studied metropolitan area
Tokyo Metropolitan Area (14,034 km2)
Tokyo Metropolis is a metropolitan prefecture comprising administrative entities of special wards and municipalities. There are 23 wards, 26 cities, 5 towns and 8 villages.51
Type of metropolitan area
Monocentric or rather monocentric
Polycentric or rather polycentric
Megaregion
Population
2003: 34.5 million
Population density
1,971/km2
Name of warehouse data source and brief description
2003 Tokyo Metropolitan Freight Survey (TMFS). TMFS was conducted in 2003 and targeted (1) all factories and logistics facilities with storage and (2) a random sample of shops, restaurants and business offices. Logistics facilities consist of establishments that include distribution centres, truck terminals, warehouses, intermodal facilities and oil terminals. Only the data from the logistics facilities (a total of 4,109 responses) were used since the focus of the investigation is on the logistics facilities. The authors used a subset of the data that includes 2,803 logistics facilities that have floor area of at least 400 square meters. While such facilities represent 63% of the respondents, they cover approximately 90% of the shipments in terms of both shipment weights and vehicle trips associated with logistics facilities. In this analysis, the authors exclude inland facilities that are located less than 1.5 km from the coastal line (30% of logistics facilities with over 400 m2 of floor area).
Number of warehouses (specify year(s))
1980: 420
2003: 209
Number of warehouses per million people (specify year(s))
1980: 14.6
2003: 6.1
Number of warehouses per 1000 km2 (specify year(s))
1980: 29.93
51 http://www.metro.tokyo.jp/ENGLISH/ABOUT/HISTORY/history02.htm

CITYLAB – City Logistics in Living Laboratories
D.2.1 – CITYLAB Observatory of Strategic Developments Impacting Urban Logistics
200
2003: 14.89
Average size of warehouses (specify year(s)); can be any indicator such as m2, m3 or number of employees
Not available
Time period studied for logistics sprawl analysis
1980-2003
Average distance of warehouses to centre of gravity (most recent year) (NB this doesn’t apply to megaregional types of urban regions)
30.7 km
Change in average distance of warehouses to centre of gravity (over the years)
+4.2 km
Change in average distance of warehouses to centre of gravity per year
0.18 km/year
Cluster indicator
None available
Type of land use control
Strictly local
Some sort of metropolitan-wide land use control
Some sort of region-wide (or state-wide) land use control
Other comments/information
The authors find that the average distance of the inland logistics facilities from the urban centre (as a different point of comparison from the barycentre) also increased by roughly 4 km between 1980 and 2003.
Scientific or technical references
Sakai, T., Kawamura, K., Hyodo, T. (2015) Logistics facility distribution in Tokyo Metropolitan Area: Experiences and policy lessons. In: 9th International Conference on City Logistics, Tenerife.

CITYLAB – City Logistics in Living Laboratories
D.2.1 – CITYLAB Observatory of Strategic Developments Impacting Urban Logistics
201
Toronto, Canada- Greater Toronto Area
Name and size of studied metropolitan area
Greater Toronto Area (7,124 km2)
25 municipalities
An analysis was also made for a larger area (GGH, pop 8.7 million in 2011 – see below)
Type of metropolitan area
Monocentric or rather monocentric
Polycentric or rather polycentric
Megaregion
Population
2012: 6.1 million
Population density
849.2/km2
Name of warehouse data source and brief description
Enhanced Points of Interest (EPOI) dataset by DMTI, a Canadian provider of geographic and marketing data.DMTI’s data included a 2002 dataset with businesses listed in SIC (Standard Industrial Classification) format and a 2012 dataset with businesses listed in NAICS(North American Industrial Classification System). Categories surveyed for the study: SIC 422(very similar to NAICS 493) and NAICS 493 businesses. The 2002 SIC 422 Public Warehousing and Storage list of businesses was converted to NAICS 493 businesses.
As mini-storage units have been found to be quite incorrectly classified as warehouses, the database was cleaned accordingly.
NAICS 493 represents the following types of warehouses: ““Warehouse” defined as: “Industries in the Warehousing and Storage subsector are primarily engaged in operating warehousing and storage facilities for general merchandise, refrigerated goods, and other warehouse products. These establishments provide facilities to store goods. They do not sell the goods they handle. These establishments take responsibility for storing the goods and keeping them secure. They may also provide a range of services, often referred to as logistics services, related to the distribution of goods. Logistics services can include labelling, breaking bulk, inventory control and management, light assembly, order entry and fulfilment, packaging, pick and pack, price marking and ticketing, and transportation arrangement. However, establishments in this industry group always provide warehousing or storage services in addition to any logistic services. Furthermore, the warehousing or storage of goods must be more than incidental to the performance of services, such as price marking.” (Source: NAICS).
Number of warehouses (specify year(s))
2002: 165

CITYLAB – City Logistics in Living Laboratories
D.2.1 – CITYLAB Observatory of Strategic Developments Impacting Urban Logistics
202
2012: 228
Number of warehouses per million people (specify year(s))
2002: 28.1
2012: 37.7
Number of warehouses per 1000 km2 (specify year(s))
2002: 23.16
2012: 32.0
Average size of warehouses (specify year(s)); can be any indicator such as m2, m3 or number of employees
Not calculated
Time period studied for logistics sprawl analysis
2002-2012
Average distance of warehouses to centre of gravity (most recent year) (NB this doesn’t apply to megaregional types of urban regions)
17.9 km
Change in average distance of warehouses to centre of gravity (over the years)
+1.2km
Change in average distance of warehouses to centre of gravity per year
0.12 km/year
Cluster indicator
Not available.
Type of land use control
Strictly local
Some sort of metropolitan-wide land use control
Some sort of region-wide (or state-wide) land use control
Other comments/information
In GTA, the distance of all establishments from the barycentre was 17.7 km in 2002, and 18.7 km in 2012 (+ 1km).
Another analysis was made for a larger area than GTA: the Greater Golden Horseshoe (GGH) region that contains the GTA, the Greenbelt, and other satellite communities that lie outside of the greenbelt. There were 217 warehouses in 2002, and 350 in 2012 (increase of 61%). The distance of all warehouses from the barycentre was 29.6 km in 2002 and 39.1 km in 2012 (change +9.5 km, or 0.95 km/year). For all establishments, it was 34.6 km in 2002, and 38 in 2012 (change +3.4km).

CITYLAB – City Logistics in Living Laboratories
D.2.1 – CITYLAB Observatory of Strategic Developments Impacting Urban Logistics
203
Scientific or technical references
Woudsma, C., Jakubicek, P., Dablanc, L. (2016) Logistics sprawl in North America: methodological issues and a case study in Toronto. Transportation Research Procedia, 12, 474-488. http://dx.doi.org/10.1016/j.trpro.2016.02.081

CITYLAB – City Logistics in Living Laboratories
D.2.1 – CITYLAB Observatory of Strategic Developments Impacting Urban Logistics
204
Toronto, Canada- Greater Golden Horseshoe
Name and size of studied metropolitan area
Greater Golden Horseshoe (GGH) region contains the Greater Toronto Area (GTA), the Greenbelt, and other satellite communities that lie outside of the greenbelt
31,562km2
An analysis was also made for GTA (see above)
Type of metropolitan area
Monocentric or rather monocentric
Polycentric or rather polycentric
Megaregion
Population
2011: 8.7 million
Population density
276/km2
Name of warehouse data source and brief description
Enhanced Points of Interest (EPOI) dataset by DMTI, a Canadian provider of geographic and marketing data.DMTI’s data included a 2002 dataset with businesses listed in SIC (Standard Industrial Classification) format and a 2012 dataset with businesses listed in NAICS(North American Industrial Classification System). Categories surveyed for the study: SIC 422(very similar to NAICS 493) and NAICS 493 businesses. The 2002 SIC 422 Public Warehousing and Storage list of businesses was converted to NAICS 493 businesses.
As mini-storage units have been found to be quite incorrectly classified as warehouses, the database was cleaned accordingly.
NAICS 493 represents the following types of warehouses: ““Warehouse” defined as: “Industries in the Warehousing and Storage subsector are primarily engaged in operating warehousing and storage facilities for general merchandise, refrigerated goods, and other warehouse products. These establishments provide facilities to store goods. They do not sell the goods they handle. These establishments take responsibility for storing the goods and keeping them secure. They may also provide a range of services, often referred to as logistics services, related to the distribution of goods. Logistics services can include labelling, breaking bulk, inventory control and management, light assembly, order entry and fulfilment, packaging, pick and pack, price marking and ticketing, and transportation arrangement. However, establishments in this industry group always provide warehousing or storage services in addition to any logistic services. Furthermore, the warehousing or storage of goods must be more than incidental to the performance of services, such as price marking.” (Source: NAICS).
Number of warehouses (specify year(s))
2002: 217

CITYLAB – City Logistics in Living Laboratories
D.2.1 – CITYLAB Observatory of Strategic Developments Impacting Urban Logistics
205
2012: 350
Number of warehouses per million people (specify year(s))
2002:
2012: 40.2
Number of warehouses per 1000 km2 (specify year(s))
2002:
2012:
Average size of warehouses (specify year(s)); can be any indicator such as m2, m3 or number of employees
Not calculated
Time period studied for logistics sprawl analysis
2002-2012
Average distance of warehouses to centre of gravity (most recent year) (NB this doesn’t apply to megaregional types of urban regions)
39.1 km
Change in average distance of warehouses to centre of gravity (over the years)
+9.5km
Change in average distance of warehouses to centre of gravity per year
0.95 km/year
Cluster indicator
Not available.
Type of land use control
Strictly local
Some sort of metropolitan-wide land use control
Some sort of region-wide (or state-wide) land use control
Other comments/information
The distance of all establishments from the barycentre was 34.6km in 2002, and 38 km in 2012 (+ 3.4km).
Scientific or technical references
Woudma, C., Jakubicek, P., Dablanc, L. (2016) Logistics sprawl in North America: methodological issues and a case study in Toronto. Transportation Research Procedia, 12, 474-488. http://dx.doi.org/10.1016/j.trpro.2016.02.081

CITYLAB – City Logistics in Living Laboratories
D.2.1 – CITYLAB Observatory of Strategic Developments Impacting Urban Logistics
206
Vancouver, Canada
Name and size of studied metropolitan area
Greater Vancouver (2,700 km2)
21 municipalities
Type of metropolitan area
Monocentric or rather monocentric
Polycentric or rather polycentric
Megaregion
Population
2002: 2.24 million
2012: 2.59 million
Population density
2012: 959/km2
Name of warehouse data source and brief description
Enhanced Points of Interest (EPOI) dataset by DMTI, a Canadian provider of geographic and marketing data.DMTI’s data included a 2002 dataset with businesses listed in SIC (Standard Industrial Classification) format and a 2012 dataset with businesses listed in NAICS(North American Industrial Classification System). Categories surveyed for the study: SIC 422(very similar to NAICS 493) and NAICS 493 businesses. The 2002 SIC 422 Public Warehousing and Storage list of businesses was converted to NAICS 493 businesses.
As mini-storage units have been found to be quite incorrectly classified as warehouses, the database was cleaned accordingly.
NAICS 493 represents the following types of warehouses: ““Warehouse” defined as: “Industries in the Warehousing and Storage subsector are primarily engaged in operating warehousing and storage facilities for general merchandise, refrigerated goods, and other warehouse products. These establishments provide facilities to store goods. They do not sell the goods they handle. These establishments take responsibility for storing the goods and keeping them secure. They may also provide a range of services, often referred to as logistics services, related to the distribution of goods. Logistics services can include labelling, breaking bulk, inventory control and management, light assembly, order entry and fulfilment, packaging, pick and pack, price marking and ticketing, and transportation arrangement. However, establishments in this industry group always provide warehousing or storage services in addition to any logistic services. Furthermore, the warehousing or storage of goods must be more than incidental to the performance of services, such as price marking.” (Source: NAICS).
Number of warehouses (specify year-s)
2002: 135
2012: 134

CITYLAB – City Logistics in Living Laboratories
D.2.1 – CITYLAB Observatory of Strategic Developments Impacting Urban Logistics
207
Number of warehouses per million people (specify year-s)
2002: 52
2012: 52
Number of warehouses per 1000 km2 (specify year-s)
2002: 50
2012: 50
Average size of warehouses (specify year-s); can be any indicator such as m2, m3 or number of employees
Not calculated
Time period studied for logistics sprawl analysis
2002-2012
Average distance of warehouses to center of gravity (most recent year) (NB this doesn’t apply to megaregional types of urban regions)
17 km
Change in average distance of warehouses to center of gravity (over the years)
+4.1 km
Cluster indicator
No available.
Type of land use control
Strictly local
Some sort of metropolitan wide land use control
Some sort of region wide (or State wide) land use control
Not indicated
Other comments/information
The number of businesses has not changed for NAICS 493 warehousing in the Vancouver Area.
The distribution of warehouses does seem to be sprawling, and in the direction that locals would expect, towards Abbotsford, where there is a less congested border crossing compared to the crossing closer to the city of Vancouver and more land availabe.
Scientific or technical references
Woudsma, C., Jakubicek, P. 2016. Logistics land use patterns in metropolitan Canada. Submitted to 14th World Conference on Transport Research, Shangai (China).

CITYLAB – City Logistics in Living Laboratories
D.2.1 – CITYLAB Observatory of Strategic Developments Impacting Urban Logistics
208
Winnipeg, Canada
Name and size of studied metropolitan area
Winnipeg Capital Region (5,303 km2)
16 municipalities
Type of metropolitan area
Monocentric or rather monocentric
Polycentric or rather polycentric
Megaregion
Population
2002: 2.24 million
2012: 2.59 million
Population density
2012: 959/km2
Name of warehouse data source and brief description
Enhanced Points of Interest (EPOI) dataset by DMTI, a Canadian provider of geographic and marketing data.DMTI’s data included a 2002 dataset with businesses listed in SIC (Standard Industrial Classification) format and a 2012 dataset with businesses listed in NAICS(North American Industrial Classification System). Categories surveyed for the study: SIC 422(very similar to NAICS 493) and NAICS 493 businesses. The 2002 SIC 422 Public Warehousing and Storage list of businesses was converted to NAICS 493 businesses.
As mini-storage units have been found to be quite incorrectly classified as warehouses, the database was cleaned accordingly.
NAICS 493 represents the following types of warehouses: ““Warehouse” defined as: “Industries in the Warehousing and Storage subsector are primarily engaged in operating warehousing and storage facilities for general merchandise, refrigerated goods, and other warehouse products. These establishments provide facilities to store goods. They do not sell the goods they handle. These establishments take responsibility for storing the goods and keeping them secure. They may also provide a range of services, often referred to as logistics services, related to the distribution of goods. Logistics services can include labelling, breaking bulk, inventory control and management, light assembly, order entry and fulfilment, packaging, pick and pack, price marking and ticketing, and transportation arrangement. However, establishments in this industry group always provide warehousing or storage services in addition to any logistic services. Furthermore, the warehousing or storage of goods must be more than incidental to the performance of services, such as price marking.” (Source: NAICS).
Number of warehouses (specify year-s)
2002: 26
2012: 41

CITYLAB – City Logistics in Living Laboratories
D.2.1 – CITYLAB Observatory of Strategic Developments Impacting Urban Logistics
209
Number of warehouses per million people (specify year-s)
2002: 39
2012: 62
Number of warehouses per 1000 km2 (specify year-s)
2002: 5
2012: 8
Average size of warehouses (specify year-s); can be any indicator such as m2, m3 or number of employees
Not calculated
Time period studied for logistics sprawl analysis
2002-2012
Average distance of warehouses to center of gravity (most recent year) (NB this doesn’t apply to megaregional types of urban regions)
4.9 km
Change in average distance of warehouses to center of gravity (over the years)
0.7 km
Cluster indicator
No available.
Type of land use control
Strictly local
Some sort of metropolitan wide land use control
Some sort of region wide (or State wide) land use control
Not indicated
Other comments/information
In Winnipeg, the number of warehouses increased by nearly 60% yet there is relative consistency in terms of the mean distance to centre and the actual centre location.
The growth in warehousing in the North West corner of the study area is associated with the CentrePort Canada and near the airport.
Scientific or technical references
Woudsma, C., Jakubicek, P. 2016. Logistics land use patterns in metropolitan Canada. Submitted to 14th World Conference on Transport Research, Shangai (China).
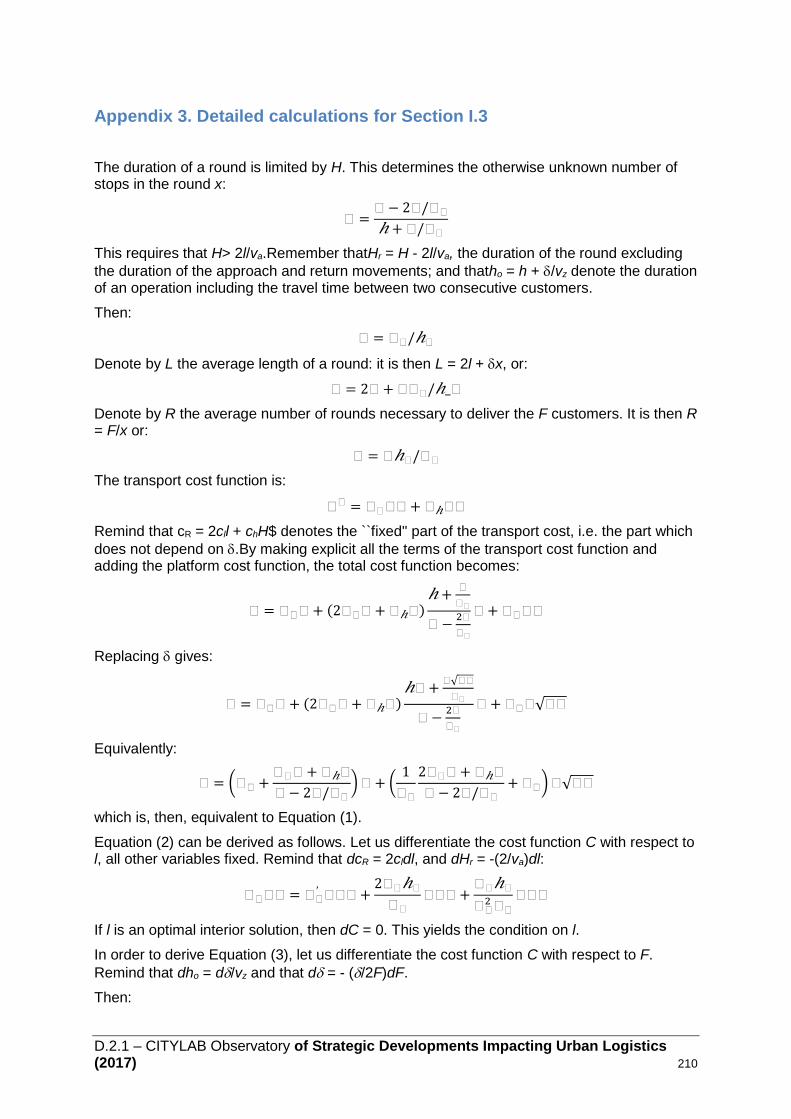
D.2.1 – CITYLAB Observatory of Strategic Developments Impacting Urban Logistics (2017) 210
Appendix 3. Detailed calculations for Section I.3
The duration of a round is limited by H. This determines the otherwise unknown number of stops in the round x:
𝐶 =𝐶 − 2𝐶/𝐶𝐶
ℎ+ 𝐶/𝐶𝐶
This requires that H> 2l/va.Remember thatHr = H - 2l/va, the duration of the round excluding
the duration of the approach and return movements; and thatho = h + /vz denote the duration of an operation including the travel time between two consecutive customers.
Then:
𝐶 = 𝐶𝐶/ℎ𝐶
Denote by L the average length of a round: it is then L = 2l + x, or:
𝐶 = 2𝐶 + 𝐶𝐶𝐶/ℎ_𝐶
Denote by R the average number of rounds necessary to deliver the F customers. It is then R = F/x or:
𝐶 = 𝐶ℎ𝐶/𝐶𝐶
The transport cost function is:
𝐶𝐶 = 𝐶𝐶𝐶𝐶 + 𝐶ℎ𝐶𝐶
Remind that cR = 2cll + chH$ denotes the ``fixed'' part of the transport cost, i.e. the part which
does not depend on .By making explicit all the terms of the transport cost function and adding the platform cost function, the total cost function becomes:
𝐶 = 𝐶𝐶𝐶 + (2𝐶𝐶𝐶 + 𝐶ℎ𝐶)ℎ+
𝐶
𝐶𝐶
𝐶 −2𝐶
𝐶𝐶
𝐶 + 𝐶𝐶𝐶𝐶
Replacing gives:
𝐶 = 𝐶𝐶𝐶 + (2𝐶𝐶𝐶 + 𝐶ℎ𝐶)ℎ𝐶 +
𝐶√𝐶𝐶
𝐶𝐶
𝐶 −2𝐶
𝐶𝐶
𝐶 + 𝐶𝐶𝐶√𝐶𝐶
Equivalently:
𝐶 = (𝐶𝐶 +𝐶𝐶𝐶 + 𝐶ℎ𝐶
𝐶 − 2𝐶/𝐶𝐶
) 𝐶 + (1
𝐶𝐶
2𝐶𝐶𝐶 + 𝐶ℎ𝐶
𝐶 − 2𝐶/𝐶𝐶
+ 𝐶𝐶) 𝐶√𝐶𝐶
which is, then, equivalent to Equation (1).
Equation (2) can be derived as follows. Let us differentiate the cost function C with respect to l, all other variables fixed. Remind that dcR = 2cldl, and dHr = -(2/va)dl:
𝐶𝐶𝐶𝐶 = 𝐶𝐶′ 𝐶𝐶𝐶 +
2𝐶𝐶ℎ𝐶
𝐶𝐶
𝐶𝐶𝐶 +𝐶𝐶ℎ𝐶
𝐶𝐶2 𝐶𝐶
𝐶𝐶𝐶
If l is an optimal interior solution, then dC = 0. This yields the condition on l.
In order to derive Equation (3), let us differentiate the cost function C with respect to F.
Remind that dho = d/vz and that d = - (/2F)dF.
Then:

CITYLAB – City Logistics in Living Laboratories
D.2.1 – CITYLAB Observatory of Strategic Developments Impacting Urban Logistics
211
𝐶𝐶 = 𝐶𝐶𝐶𝐶 +𝐶𝐶ℎ𝐶
𝐶𝐶
𝐶 +𝐶𝐶ℎ𝐶
𝐶𝐶
𝐶𝐶 + 𝐶𝐶𝐶𝐶 + 𝐶𝐶𝐶𝐶𝐶
or:
𝐶𝐶 = 𝐶𝐶𝐶𝐶 −(
𝐶𝐶
𝐶𝐶𝐶𝐶+ 𝐶𝐶) 𝐶𝐶
2𝐶𝐶𝐶 + (
𝐶𝐶ℎ𝐶
𝐶𝐶
+ 𝐶𝐶𝐶 + 𝐶𝐶) 𝐶𝐶
Finally:
𝐶𝐶 = 𝐶𝐶𝐶𝐶 +1
2𝐶𝐶𝐶𝐶𝐶 +
𝐶𝐶
𝐶𝐶
(ℎ𝐶 −𝐶
2𝐶𝐶
) 𝐶𝐶
Note that ho = h + /vz so thatho - /2vz = h + /2vz.
Now, in order to analyse how the optimal location, solution of Equation (2), varies with the
parameters, denote by its LHS divided by F. The full differential of is:
𝐶Γ
= 𝐶𝐶′′ (𝐶) +
2ℎ𝐶
𝐶𝐶
𝐶𝐶𝐶 +2𝐶𝐶𝐶ℎ𝐶
𝐶𝐶
−2𝐶𝐶ℎ𝐶
2
𝐶𝐶2 𝐶𝐶𝐶
+2ℎ𝐶
𝐶𝐶2 𝐶𝐶
𝐶𝐶𝐶 +2𝐶𝐶
𝐶𝐶2 𝐶𝐶
−4𝐶𝐶ℎ𝐶
𝐶𝐶3 𝐶𝐶
−2𝐶𝐶ℎ𝐶
𝐶𝐶2 𝐶𝐶
𝐶𝐶𝐶
and the total differential of ho is:
𝐶ℎ𝐶 = 𝐶ℎ+1
𝐶𝐶
𝐶𝐶 −𝐶
𝐶𝐶2 𝐶𝐶𝐶
the total differential of HR is:
𝐶𝐶𝐶 = 𝐶𝐶 −2
𝐶𝐶
𝐶𝐶 +2𝐶
𝐶𝐶2 𝐶𝐶𝐶
and the total differential of cR is:
𝐶𝐶𝐶 = 2𝐶𝐶𝐶𝐶 + 2𝐶𝐶𝐶𝐶 + 𝐶𝐶𝐶ℎ + 𝐶ℎ𝐶𝐶
It is now possible to analyse the behaviour of the optimal location of the warehouse.Analyzing the second derivatives of C is analogous to analyzing the first
derivatives of .
Γ𝐶 = 𝐶𝐶′′ +
8𝐶𝐶ℎ𝐶
𝐶𝐶2 𝐶𝐶
+2𝐶𝐶ℎ𝐶
𝐶𝐶2 𝐶𝐶
If the rent is a convex function of the distance to the centre, then cw'' is positive.Besides, in
the vicinity of an equilibrium point, cw''should be positive. As a consequence: l> 0.The other differentials are as follows:
Γ𝐶𝐶=
2ℎ𝐶
𝐶𝐶
+4𝐶ℎ𝐶
𝐶𝐶2 𝐶𝐶
> 0
and:
Γℎ =2𝐶𝐶
𝐶𝐶
+2𝐶𝐶
𝐶𝐶2 𝐶𝐶
> 0
Γ𝐶 =2𝐶𝐶
𝐶𝐶𝐶𝐶
+2𝐶𝐶
𝐶𝐶2 𝐶𝐶𝐶𝐶
> 0
Γ𝐶𝐶= −
2𝐶𝐶𝐶
𝐶𝐶𝐶𝐶2 −
2𝐶𝐶𝐶
𝐶𝐶2 𝐶𝐶𝐶𝐶
2 < 0

CITYLAB – City Logistics in Living Laboratories
D.2.1 – CITYLAB Observatory of Strategic Developments Impacting Urban Logistics
212
Γ𝐶 = −2𝐶𝐶ℎ𝐶
𝐶𝐶2 +
2𝐶ℎℎ𝐶
𝐶𝐶2 𝐶𝐶
−4𝐶𝐶ℎ𝐶
𝐶𝐶3 𝐶𝐶
Note that:
2𝐶ℎℎ𝐶
𝐶𝐶2 𝐶𝐶
−4𝐶𝐶ℎ𝐶
𝐶𝐶3 𝐶𝐶
=1
𝐶𝐶2 𝐶𝐶
(2𝐶𝐶𝐶𝐶ℎ𝐶 − 4𝐶𝐶ℎ𝐶)
and, given the fact that cR = 2cll + chH and Hr = H-2l/va, that:
2𝐶𝐶𝐶𝐶ℎ𝐶 − 4𝐶𝐶ℎ𝐶 = 2𝐶𝐶𝐶ℎℎ𝐶 − 8𝐶𝐶𝐶ℎ𝐶 − 4𝐶ℎ𝐶ℎ𝐶
= 2(𝐶𝐶 − 𝐶)𝐶ℎℎ𝐶 − 8𝐶𝐶𝐶ℎ𝐶 − 2𝐶ℎ𝐶ℎ𝐶 < 0
so that H< 0. Finally:
Γ𝐶𝐶= −
4𝐶𝐶ℎ𝐶𝐶
𝐶𝐶2 𝐶𝐶
2 −8𝐶𝐶ℎ𝐶𝐶
𝐶𝐶3 𝐶𝐶
3 −2𝐶𝐶ℎ𝐶
𝐶𝐶2 𝐶𝐶
< 0
and:
Γ𝐶ℎ=
2ℎ𝐶𝐶
𝐶𝐶2 𝐶𝐶
> 0
From the implicit equation theorem, the sign of the variation of the optimal location l with respect to the other model parameters is the sign of the ratio of the corresponding partial
derivatives of , hence the conclusions.

CITYLAB – City Logistics in Living Laboratories
D.2.1 – CITYLAB Observatory of Strategic Developments Impacting Urban Logistics
213
CITYLAB – City Logistics in Living Laboratories
D.2.1 – CITYLAB Observatory of Strategic Developments Impacting Urban Logistics
214
Appendix 4. Table of e-commerce indicators

D.2.1 – CITYLAB Observatory of Strategic Developments Impacting Urban Logistics (2017) 215
E-COMMERCE GENERAL FIGURES (European countries)
Source
ecommerce-europe.eu- 2014 Key E-commerce
ecommerce-europe.eu- 2014 Key E-commerce
ecommerce-europe.eu- 2014 Key E-commerce
ecommerce-europe.eu- 2014 Key E-commerce
ecommerce-europe.eu- 2014 Key E-commerce
ecommerce-europe.eu- 2014 Key E-commerce
e-commerce manager.com
e-commerce manager.com
Total B2C e-commerce (goods and services)
turnover-€billion
Total B2C e-commerce (goods & services)
increase (% increase
compared to year before)
E-commerce % on total
GDP
Share of goods
purchased on line (% in total retail of
goods)
Share of services
purchased on line(% in total retail
of services)
Average spending per
e-shopper (€)
Total grocery e-commerce turnover (€ billion)
Share of grocery e-commerce in total grocery commerce (%)
Austria 11.7 8% 3.56% 7.20% 3 034
Belgium 6.1 13.7% 1.53% 6.40% 1 234
CzechRepublic 3.1 15.5% 2.02% 7.10% 845
Denmark 9.9 18.1% 3.84% 20% 2 721
Estonia 0.15 15.4% 0.77% 283
Finland 6.6 14.2% 3.23% 9.80% 2 145
France 56.8 11.2% 2.67% 4.60% 1 600 6.51 (2014) 3.1 (2014)
Germany 63.4 26.8% 2.3% 9% 1 585
Greece 3.9 20.4% 2.15% 2.90% 1 624
Hungary 0.9 24% 0.9% 3.70% 346
Iceland 0.25 8.7% 1.95% 1 445
Ireland 5.3 15.2% 2.86% 2 967
Italy 13.3 17.5% 0.82% 1.90% 810
Latvia 0.2 11.1% 0.83% 352
Lithuania 0.41 12.2% 1.13% 630
Luxembourg 0.5 13% 1.12% 1 574
Netherlands 14 8.4% 2.13% 7.60% 1 100
Norway 8.3 15.3% 2.20% 9.70% 2 608

CITYLAB – City Logistics in Living Laboratories
D.2.1 – CITYLAB Observatory of Strategic Developments Impacting Urban Logistics
216
Poland 6.5 21.7% 1.59% 5.40% 618
Portugal 2.9 13.3% 1.70% 1 330
Romania 1.2 15.4% 0.8% 2.50% 317
Russia 19.9 15.7% 1.42% 2.20% 767
Spain 16.9 16.6% 1.60% 4.10% 1 174
Sweden 8.9 7.20% 2.07% 3.50% 1 504
Switzerland 12.7 16.10% 2.38% 5.50% 2 858
Turkey 9.8 9.7% 1.63% 1.60% 1 245
Ukraine 2.3 21.6% 2.27% 1.60% 662
United Kingdom
127.0 14.7% 5.74% 13% 3 073
Europe 423.0 13.6% 2.5% 6.40% 1 544
Global 1938 24% 5.90% 1702

CITYLAB – City Logistics in Living Laboratories
D.2.1 – CITYLAB Observatory of Strategic Developments Impacting Urban Logistics
217
DELIVERY LOGISTICS FACILITIES
Source
Copenhagen Economic-2012 CopenhagenEconomic-2012
http://ecommercenews.eu/an-overview-of-pick-up-points-in-europe/-2015 Reuters
Total shipments (express and non express)(B2B; B2C, C2C)-(in million units)
Share of B2C and C2C in total shipment parcels
Share of shipments delivered as express delivery by national postal operators (%)
National Postal Operator market share relative to B2C parcels and packets shipments (%)
If city case studies are available: share of e-commerce deliveries in total deliveries (%) Number of pick up points
Number of pick-up-point per capita
Market share of pick-up points in total number of e-commerce deliveries (%)
Number of automated pick-up points
Number of “drives” (grocery e-commerce pick-up-points)
Austria
Belgium 4150
CzechRepublic
Denmark
Estonia
Finland
France 780 (DGCCRF)-
2011
19600 7 per 100 000 inhabitants
(Morganti et al, 2014)
66% (FEVAD, juin 2015)
33 (Morganti et al, 2014)
2841 (mars 2014)
Germany 67800
Greece
Hungary
Iceland
Ireland
Italy 13100

CITYLAB – City Logistics in Living Laboratories
D.2.1 – CITYLAB Observatory of Strategic Developments Impacting Urban Logistics
218
Latvia
Lithuania
Luxembourg
Netherlands 5885
Norway
Poland
Portugal
Romania
Russia
Spain 3308
Sweden
Switzerland
Turkey
Ukraine
United Kingdom
6700 (Great Britain)
Europe 6406 14% 35%
Global

CITYLAB – City Logistics in Living Laboratories
D.2.1 – CITYLAB Observatory of Strategic Developments Impacting Urban Logistics
219
MARKET STRUCTURE
E-SHOPPERS
Source
ecommerce-europe.eu- 2014 Key E-commerce
ecommerce-europe.eu- 2014 Key E-commerce
ecommerce-europe.eu- 2014 Key E-commerce
National Postal Operator share of revenue due to e-commerce (%)
Main alternative operators active in B2C deliveries
total residents (million)
internet users
(million)
share of internet
users (%) Total urbanresidents(million)
urban internet users
(million)
share of urban
internet users(%)
Austria 8.5 5.9 81%
Belgium 11.2 7.9 85%
CzechRepublic 10.5 7.1 80%
Denmark 2.6 4.5 96%
Estonia 1.3 0.931 84%
Finland 5.5 4.2 92%
France 32.1% (DGCCRF)-
2011
65.8 44.8 84% 47.9 (INSEE-RGP 2010)
Germany 82 70.5 86%
Greece 10.9 5.9 63%
Hungary 9.9 6.4 76%
Iceland 0.326 0.254 98%
Ireland 4.61 2.88 80%
Italy 60.8 32.5 62%

CITYLAB – City Logistics in Living Laboratories
D.2.1 – CITYLAB Observatory of Strategic Developments Impacting Urban Logistics
220
Latvia 2 1.53 77%
Lithuania 2.94 1.81 72%
Luxembourg 0.6 0.4 95%
Netherlands 16.8 13.6 98%
Norway 5.1 4 96%
Poland 38 21.6 67%
Portugal 10.4 5.7 65%
Romania 19.9 9.2 54%
Russia 143.7 84.4 71%
Spain 46.5 30 76%
Sweden 9.6 7.4 93%
Switzerland 8.1 6 87%
Turkey 76.7 29.2 51%
Ukraine 45.2 16.7 43%
United Kingdom
64.3 48.7 92%
Europe 817 491 72%

D.2.1 – CITYLAB Observatory of Strategic Developments Impacting Urban Logistics (2017) 221