Embed Size (px)
Citation preview

Observational Study Designs and
Studies of “Tests”
Warren Browner August 2011
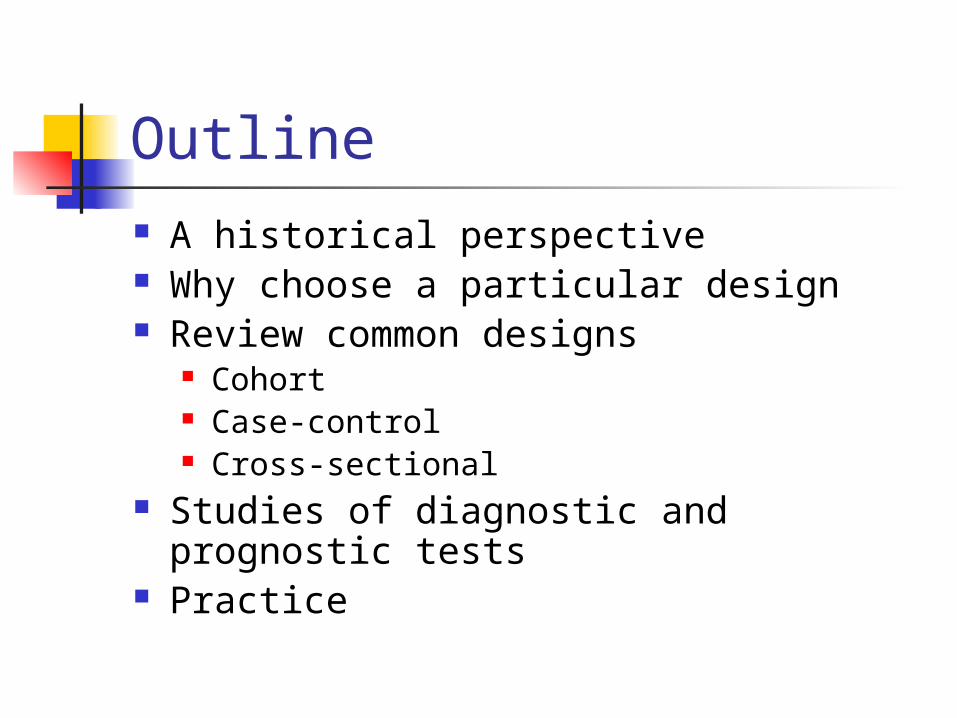
Outline A historical perspective Why choose a particular design Review common designs
Cohort Case-control Cross-sectional
Studies of diagnostic and prognostic tests
Practice
A bit of historical perspective
Clinical epidemiology Uses epidemiologic approaches,
concepts, and terms in clinical research
Bias Sampling Rates (hazards), risks, odds (and their
ratios) Incidence vs. prevalence
A thought experiment Half of all trainees at academic medical
centers enter a cognitive specialty (IM, FP, Peds, etc.) and half enter a procedural specialty (everyone else)
The average duration of cognitive specialty training is 3 years, and of procedural training is 6 years
Over time, what percentage of all residents are in procedural specialties?

There are many kinds of studies
And as many ways to classify them But (IMHO) physiology matters
more than anatomy
Today we are just going to talk about observational studies (and studies of medical tests)
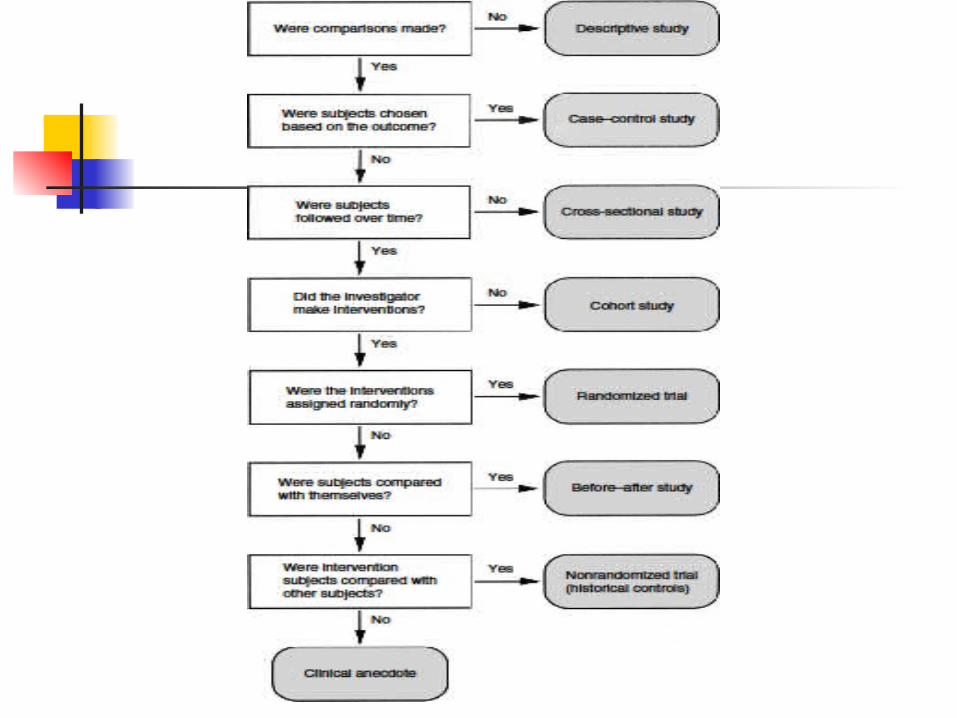

Key elements of study design
Will there be comparisons? Will you sample on the outcome? Will there be any follow-up?
We will come back to these points

Why do an observational study?
To describe something Attributes (predictors) Outcomes
To look for associations Between predictors and outcomes
After adjusting for (confounders) Among predictors
To “suggest” causality
What if there aren’t any comparisons?
Descriptive study Not much more to say about the design Sometimes description is all that’s
needed
But most studies make comparisons Analytic studies
Observational analytic studies
Causality (predictor causes outcome) usually matters
Observing may be the only option for studying risk factors for disease Sex, race, genetics, SES, habits

Why choose a particular design?
Resources (time and money)
Frequency of the outcome (disease)
Quality and comprehensiveness of available data

Resources
Time Your RQ: is childhood reading level is
associated with late-life dementia? Your RQ: is duration of invasive
cardiology procedure associated with stent patency at 5 years?

Resources
Money Your RQ: are estrogen levels
associated with the recurrence of breast cancer over a 2-year period in women with early-stage breast cancer?

Frequency of the outcome
Rare disease Your RQ: is intrauterine exposure to
radiation while flying associated with childhood leukemia?
Your RQ: is consuming “energy drinks” associated with subarachnoid hemorrhage?
Quality of the available data
Not measured Your RQ: is bone density associated
with stroke independent of systolic blood pressure?
New (or better) measurement Your RQ: is balance associated with
hip fracture?

The main analytic designs
Cohort Case-control Cross-sectional

The main analytic designs
Cohort Case-control Cross-sectional
Will you sample on the outcome? Will there be any follow-up?

The main analytic designs
Cohort Assemble a group, make measurements,
and follow-them Case-control
Assemble two groups based on outcome (cases and controls), make measurements
Cross-sectional Assemble a group, make measurements
The cohort design
Assemble a group, make measurements, and follow-them
Find a group in which measurements were made, and then follow them
Find a group in which measurements were made, and who were already followed
The case-control design
Assemble two groups (cases and controls), make measurements, usually of attributes from the past
Assemble two groups (cases and controls) in whom measurements were made in the past Usually in a cohort in which the cases
occurred during follow-up (vs. non-cases)
The cross-sectional design Assemble a group, make measurements Find a pre-assembled group, make
measurements Find a pre-assembled and pre-measured
group
All measurements made at “same time”

Review of the main designs
Cohort Case-control Cross-sectional
Will you sample on the outcome? Will there be any follow-up?

What is follow-up? Time that passes…
Between when the predictors were measured and the outcomes occurred?
Between when the predictors occurred and the outcomes occurred?
Between when the predictors were measured in the study and the outcomes occurred?
Longitudinal study
Two more terms
Prospective Retrospective
Which one is better?
Prospective cohort studies
Measure (most of) what you want Then follow the subjects
Must wait for outcomes to occur Can take a long time Usually expensive
Enrollment, measurement, ascertainment May not be enough outcomes

Retrospective cohort and case-control studies
Look for situations in which the predictors and outcomes have already occurred
Cannot necessarily measure what you want
May not need to enroll anyone
Digression: a little epidemiology
Incidence New cases of an outcome that occur Can measure in a cohort study
Prevalence Cases that exist at a given time Can measure in a cross-sectional study
Neither can be measured in a case-control study
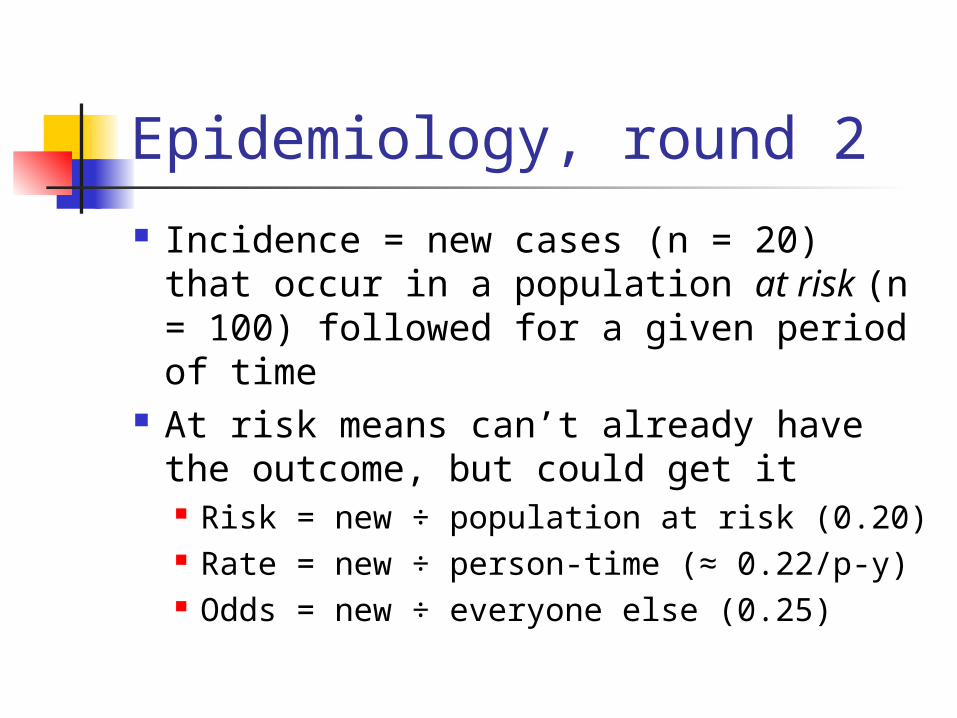
Epidemiology, round 2
Incidence = new cases (n = 20) that occur in a population at risk (n = 100) followed for a given period of time
At risk means can’t already have the outcome, but could get it Risk = new ÷ population at risk (0.20) Rate = new ÷ person-time (≈ 0.22/p-y) Odds = new ÷ everyone else (0.25)

Epidemiology, round 2a
Incidence = new cases (n = 3) that occur in a population at risk (n = 100) followed for a given period of time
At risk means can’t already have the outcome, but could get it Risk = new ÷ population at risk (0.03) Rate = new ÷ person-time (≈ 0.03/p-y) Odds = new ÷ everyone else (≈ 0.03)

Epidemiology, teaching point
For a rare outcome Odds ≈ Rate ≈ Risk Therefore:
Odds ratio ≈ Rate ratio ≈ Risk ratio
This is the secret behind why case-control studies can estimate relative risks (risk ratios)

A thought experiment Half of all trainees at academic medical
centers enter a cognitive specialty (IM, FP, Peds, etc.) and half enter a procedural specialty (everyone else)
The average duration of cognitive specialty training is 3 years, and of procedural training is 6 years
Over time, what percentage of all residents are in procedural specialties?
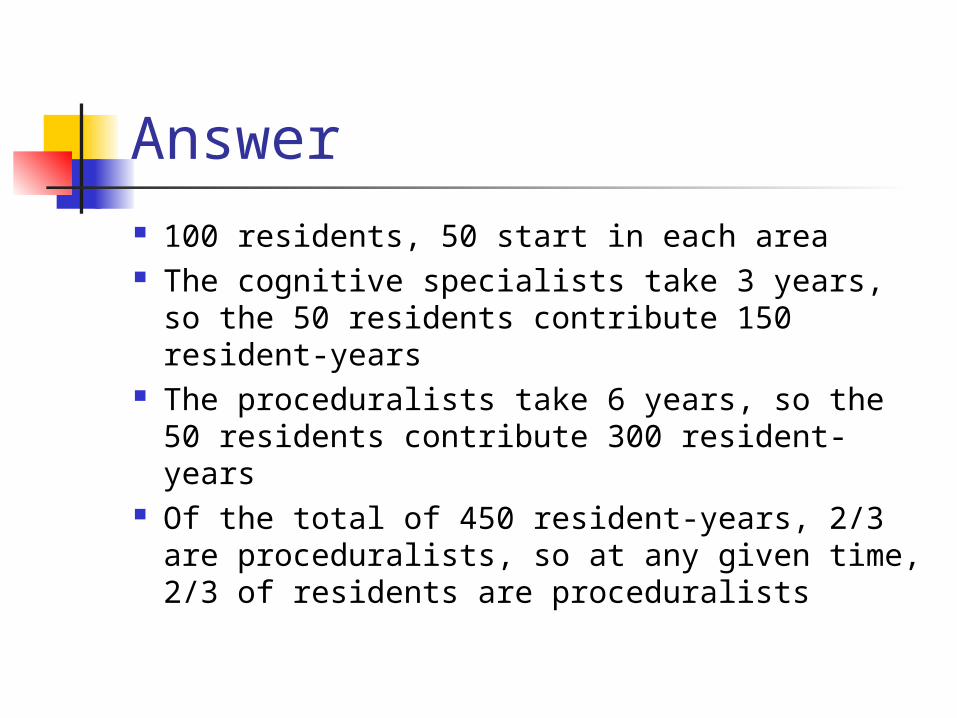
Answer 100 residents, 50 start in each area The cognitive specialists take 3 years, so
the 50 residents contribute 150 resident-years
The proceduralists take 6 years, so the 50 residents contribute 300 resident-years
Of the total of 450 resident-years, 2/3 are proceduralists, so at any given time, 2/3 of residents are proceduralists
Who cares?
A cross-sectional study that looked at all trainees might conclude that 2/3 choose proceduralist programs
How might you address this problem?
Bonus: What is this an example of?

Studies of medical tests Outcome can be disease (yes/no)
or prognosis (did well, did poorly)
Causality irrelevant No one thinks an abnormal test
causes the disease
Studies of medical tests Not enough to show that test
result is associated with outcome
Need to show that it’s useful at separating those with outcome from those without

Showing usefulness
Study subjects resemble patients in whom the test might be used Test for pancreatic cancer should not
compare patients with weight loss and belly pain to healthy medical students
Test for bipolar disease should not compare patients with mood swings to SF Giants fans

Showing usefulness Attributes of the test itself
Reproducible, accurate, inexpensive, safe
Will it affect decisions and improve outcomes (is it better than current tests)?
Blinded evaluation of test results

Defining usefulness
Test operating characteristics Sensitivity, specificity, predictive
value positive, predictive value negative, likelihood ratios
All of these terms are confusing Worth learning likelihood ratios

How I remember them
Sensitivity = PID Positivity in disease A decent value is 70% or more
Specificity = NIH Negativity in health A decent value is 70% or more

How I remember them
Likelihood ratio = ratio of likelihoods WOWO: the likelihood of a particular
test result in patients with disease over (÷) the likelihood of that same test result in patients without disease
A decent LR(+) is ≥ 2 A decent LR(-) is ≤ 0.5

Epidemiology, final round
Odds Ratio = LR(+) ÷ LR(-)
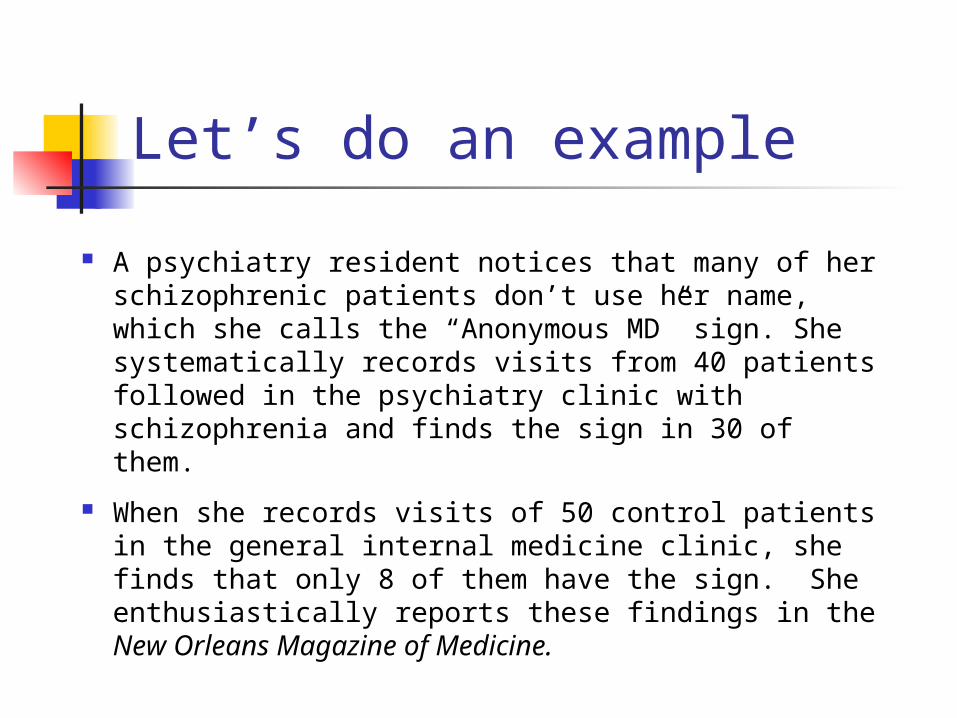
Let’s do an example
A psychiatry resident notices that many of her schizophrenic patients don’t use her name, which she calls the “Anonymous MD” sign. She systematically records visits from 40 patients followed in the psychiatry clinic with schizophrenia and finds the sign in 30 of them.
When she records visits of 50 control patients in the general internal medicine clinic, she finds that only 8 of them have the sign. She enthusiastically reports these findings in the New Orleans Magazine of Medicine.

What did she report as the sensitivity and specificity of the “Anonymous MD” sign for the diagnosis of schizophrenia?
What about the LR(+) and LR(-)?
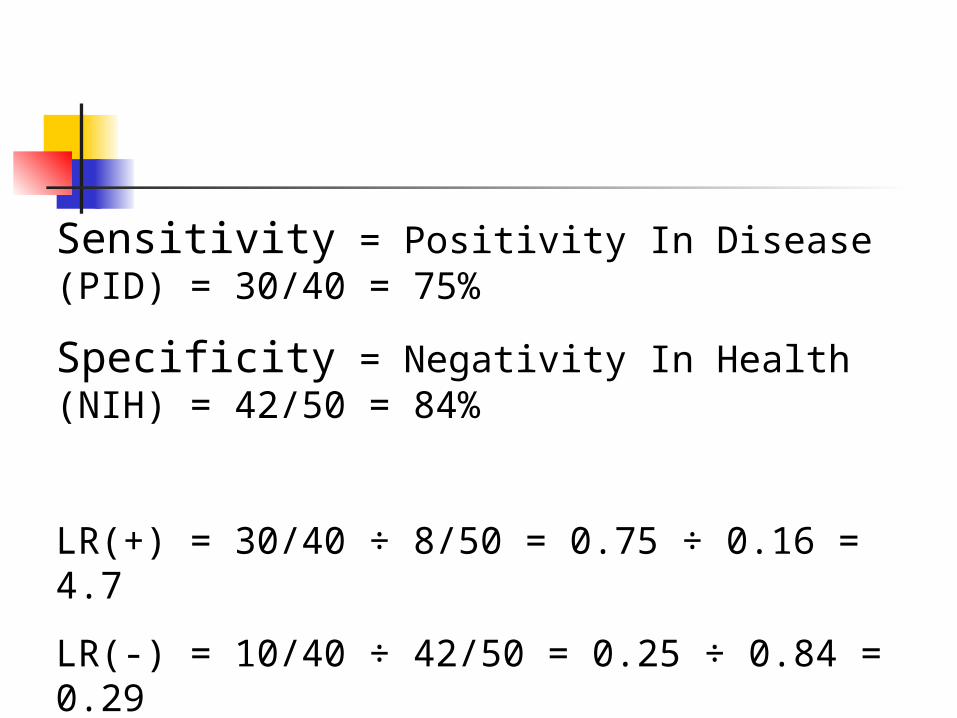
Sensitivity = Positivity In Disease (PID) = 30/40 = 75%
Specificity = Negativity In Health (NIH) = 42/50 = 84%
LR(+) = 30/40 ÷ 8/50 = 0.75 ÷ 0.16 = 4.7
LR(-) = 10/40 ÷ 42/50 = 0.25 ÷ 0.84 = 0.29

Incensed, you write a letter to the editor of the Magazine, pointing out the major problems with the design of the study. What do you write about?

Points you might make• “Anonymous MD” sign could be seen in any type of
psychiatric disease. It could even be a sign of better prognosis or clinic attendance in schizophrenics.
• Subjects not representative of patients in whom sign might be clinically useful.
• Lack of blinding.
• Low prevalence of schizophrenia would mean a high false-positive rate in most populations.
• Medicine patients might “over-use” their MD’s name.
• Age/sex differences in patients and controls?

The last paragraph of your letter proposes a better design to evaluate the usefulness of the “Anonymous MD” sign. What did you suggest?

Assess sign prospectively and blindly in all patients who present for evaluation of a psychiatric condition in which schizophrenia is a diagnostic possibility.
Determine disease status without knowing about presence or absence of “Anonymous MD” sign.
What’s the Problem?An investigator is studying whether there is an association between drinking coffee and cancer of the pancreas. He assembles a group of patients with pancreas cancer and a group of patients with other gastrointestinal diseases, and asks them about their coffee-drinking habits during the previous ten years. All of the patients have undergone a GI evaluation, so the investigator is reasonably certain who has and who does not have pancreas cancer.
He finds that coffee drinking was substantially more common in the patients with pancreas cancer.

What’s the Problem? (cont’d)
• What kind of study is this?
• What’s wrong with this study? How could it be fixed?
• Bonus: Where was it published? Where was it performed?

Time for questions????