Embed Size (px)
Citation preview

Instrumentation - Richard F. Browner School of Chemistry Georgia institute of Technology Atlanta. Ga. 30332
Andrew W. Boorn Sciex 55 Glen Cameron Road, X202 Thornhill, Ontario L3T 1P2. Canada
Sample lntmduction Tihniques fior
Selection of the best sample intro- duction procedure for an analysis re- quires consideration of a number of points. These include:
the type of sample (e.g., solid, liq- uid, gas), the levels, and also the range of lev- els for the elements to be deter- mined, the accuracy required, . the precision required, the amount of material available, the number of determinations re-
special requirements, such as quired per hour, and
whether speciation information is needed. The measurement techniques avail-
able, whether flame atomic absorption spectracopy (FAAS), inductively cou- pled plasma (ICP) atomic emission spectroscopy, or dc plasma (DCP) atomic emission spectroscopy, will also have a major effect on the choice of the procedure selected.
Although this paper will concen- trate specifically on sample introduc- tion techniques, in any real analysis sample introduction is an extension of sample preparation. As a consequence, the selection of a suitable sample in- troduction technique can depend heavily on available and effective sam- ple preparation procedures. Generally, though, sample preparation will not be discussed here, except where sample introduction and sample preparation are intimately linked.
0003-2700/84/035 1-875A$01.50/0 0 I984 American Chemical Society
To understand the limitations of practical sample introduction systems it is necessary to reverse the normal train of thought, which tends to flow in the direction of sample solution- nebulizer-spray chamber-atomizer. and consider the sequence from the opposite direction. Looking a t sample introduction from the viewpoint of the atomizer, the choice of procedure will hinge on what the atomizer can useful- ly accept. Bearing in mind that every atomizer has certain reasonably well defined, but different, properties of temperature, chemical composition etc., an introduction procedure must he selected that will result in rapid breakdown of species in the atomizer, irrespective of the sample matrix.
To ensure efficient free atom pro- duction, the following parameters must be known for each analyte-ma- trix-atomizer combination:
maximum acceptable drop size, optimum solvent loading, both aero- sol and vapor, - maximum acceptable analyte mass loading, appropriate gas flow patterns for ef- fective plasma penetration (for the ICP), and suitable observation height. This last parameter should be se-
lected in conjunction with the gas flow pattern of sample introduction such
. . . . .
that adequate residence time is pro- vided for the introduced material to desolvate, vaporize, and atomize. In certain cases, for instance, when or- ganic solvents are introduced to an ICP. it also may be necessary to adjust the atomizer operating characteristics to account for the change in plasma properties induced by the solvent. Here, an increase in forward power to the plasma (e&, from 1.25 to 1.75 kW) is necessary to aid the decomposition of organic species.
Overall, then, it is the properties of the atomizer that dictate the design and operation of the sample introduc- tion system. This is particularly true for liquid sample introduction with pneumatic nebulization.
Present Underbtanding of Sample introduction Processes
There is a great deal of intuitive, but relatively little experimentally based, knowledge in this field. Clearly, there is some upper limit to the size of drop that can be vaporized in the typi- cally 1-2 ms available in the atomizer. Yet there are no tables available that specify the upper limit of drop size suitable for each matrix and atomizer. Such tables would be of great help to
ANALYTICAL CEMISTRY, VOL. 56, NO. 7, JUNE 1984 875 A

876A ANALYTICAL CHEMISTRY, VOL. 56, NO. 7, JUNE 1984
practicing analytical chemists. Of course, the production of these tables is not a trivial matter, and would re- quire rather involved experimental procedures a t the state of the art in particle generation and characteriza- tion. Nevertheless, when these data do become available, which undoubtedly they will in due time, this should allow researchers to steer around the major- ity of interference problems other than those of spectral overlaps, for which tabular data are already avail- able (I , 2) .
ICP Systems. The data available on solvent-loading limitations for or- ganic solvents with the ICP have been characterized recently (3 ) . Some typi- cal limiting aspiration rates are shown in Table I, together with evaporation factors, E, of the solvents. These data are useful as a guide for organic sol- vent introduction to the ICP. The evaporation factor is a measure of the rate of mass loss from an evaporating drop, and is given by:
E = 48 D , u P , M ~ ( ~ R T ) - ~ (1)
where D , is the diffusion coefficient of the solvent vapor, u is the surface ten- sion, P, is the saturated vapor pres- sure, M is the molecular weight of the solvent, 6 is the density, R is the gas constant, and T i s the absolute tem- perature. In general, the ICP has de- creasing tolerance to solvents as their evaporation factors increase, and there is an inverse correlation between evaporation factor and limiting aspi- ration rate. However, the alcohols have a much greater quenching effect on the plasma than their evaporation factors would indicate, and they may readily extinguish the plasma under normal operating conditions.
I t is always possible to remove at least part of the solvent vapor by con- densation. Two groups of workers have attempted this and shown that the tolerance of the ICP to organic sol- vents is greatly improved when a large fraction of the solvent vapor is re- moved from the gas stream passing to the plasma ( 3 , 4 ) . This is an indication of how the sample introduction pro- cess can be modified to produce ana- lyte closer to the optimum for the at- omizer. No published data are avail- able on limitations of aqueous sample introduction to the ICP, although clearly water loading in the plasma has a direct influence on plasma prop- erties. In fact, it has been shown for certain ionic lines that doubling the water loading entering the plasma can cause a 100-fold reduction in analyti- cal signal (5).
From a practical standpoint, three important conclusions can be reached. First, it is necessary to introduce sam- ple to the atomizer with drops no larg- er than a certain maximum size

Advertising removed from this page

(dmx). Second, the solvent introduc- tion rate must fall within a certain permissible hand of values. Third, to maintain good system reproducibility, it is essential that all these parameters be controlled carefully over the long term. Any significant change in drop size or solvent loading reaching the at- omizer could have an adverse effect, both on system accuracy and system reproducibility. From this standpoint, the need to maintain a constant tem- perature in the plasma box in an ICP system becomes clear, as a means to reduce the baseline drift caused by variable solvent vapor loading (5).
Atomic Absorption Systems. Flames are generally far less suscepti- ble to variations in solvent loading than ICPs are, although the introduc- tion of organic solvents to an air-acet- ylene flame can lead to a significant temperature drop. This in turn could cause the onset of interferences due to sample matrix problems. For flame AAS systems, the design of nebulizers and spray chambers appears to have been empirically optimized to provide the best aerosol drop size in the flame for interference-free analyte vaporiza- tion. Solvent loading appears to be a secondary factor.
In the past 20 years AA nebulizers and spray chambers have undergone a steady progression. They have changed from devices producing very coarse aerosols, with a corresponding high incidence of vaporization inter- ferences, to devices producing much finer aerosols, which are largely free from this type of interference. In fact, recent data indicate that it is possible to virtually eliminate all matrix-in- duced vaporization interferences in AAS (e.g., calcium-phosphate, silicon- aluminum, silicon-manganese, etc.) (67). This is accomplished by shift-
Table 1. Limiting Organlc Aspiration Rates for ICP a
Methanol 0.1 47.2 Ethanol 2.5 45.6 Xylenes 1.0 18.5 Acetone 0.1 264 MlBK 3.0 77.3 Diethyl ether <0.1 771 Chlomfwm 3.0 321 * Ar ICP operated at 1.75XW rl power.
Defined as maxlmum whnt uptake POB- slble fa stable opemtlon lw 1 h.
Figure 1. Drop size distribution for AA nebulize1
ing the aerosol distribution reaching the flame to smaller values, through modification of the spray chamber de- sign.
In many respects it is surprising that this process has taken so long, as early work, particularly that of Stupar and Dawson, gave a clear indication of the importance of aerosol drop size in minimizing interference (8). Since publication of this paper, there ap- pears to have been very little work carried out on the systematic study of aerosol properties and interference ef- fects. Fortunately, it appears now that such improvements can he accom. plished relatively simply.
As a counterbalance to any compla- cence that this statement might imply, it should also be noted that nebulizers that produce improved detection lim- its for many volatile elements have been marketed recently. These devices operate by letting a higher proportion of large-diameter droplets reach the flame. While this can, in certain in.
878A * ANALYTICAL CHEMISTRY, VOL. 56, NO. 7, JUNE 1984

Advertising removed from this page

I Capillary Adjustment - - Solution Uptake
Gas'lnlet
. ...... . . .
I . . _ . . , . . . , . . ' . .. ..
i Solution Uptake
Figure 2. AA nebulizer Figure 3. Crossflow nebulizer
stances, result in improved detection limits, it can also cause a devastating worsening of matrix-induced interfer- ences (7). This is one instance where, unless due care is exercised, we may recycle to one of the most troublesome aspects of early AAS.
Nebulizers: Pneumatic, Ullraronlc, and Other
Liquid sample introduction, with pneumatic nebulization, is the ap- proach used in the vast majority of atomic spectroscopy determinations. This situation appears unlikely to change in the foreseeable future. The precise microscopic processes by which pneumatic nebulizers operate are not well understood, though some general principles are known. In sim- ple terms, a liquid jet is shattered by interaction with a high-velocity gas jet. The best description of this pro- cess is probably some type of surface- stripping mechanism, such that suc- cessive thin surface films of liquid are removed by the gas flow, and then spontaneously collapse under surface tension forces to produce the aerosol droplets. Whatever the precise mecha-
Figure 4. MAK nebulizer
nisms, the result is an aerosol that generally has a very wide drop size distribution (see Figure 1 for a typical AA pneumatic nebulizer distribution).
The construction of pneumatic neb- ulizers for atomic spectroscopy is a de- manding engineering challenge, as tol- erances must be very precisely held on annular spaces. These may he as small as 10-20 pm for ICP nebulizers, com- pared to 150-250 pm for AA nebuliz- ers. The adjustable concentric nebu- lizer allows Substantial control over the gas-liquid interaction by varying the position of the liquid uptake tube in a conically or parabolically converg- ing gas tube (Figure 2). Crossflow neh- ulizers avoid this need, but require very precise and rigid positioning of the gas and liquid tubes (Figure 3) (9).
The main practical requirements for pneumatic nebulizers are the fol- lowing: A high-velocity (sonic to su- personic) gas stream, a reasonable pressure drop at the liquid injection capillary for venturi-effect natural as- piration (optional), maximum interac- tion between the gas and liquid streams for fine aerosol production, and freedom from blockage resulting from either particles suspended in the solution or from salt buildup at the nebulizer tip. Matrix salt tolerance will be determined by both the con- centration of the salt and its solubility characteristics (e.g., 1046 NaCl may cause no blockage problem, whereas 1046 Na2SO. may rapidly block the nebulizer). A more serious problem with the ICP may he whether the plas- ma torch quartz injection tube can withstand the high salt level without clogging, and ultimately devitrifying.
duction generally have a substantial advantage over ICP systems in their tolerance to both suspended particles and dissolved solids. Unfortunately, the excitation characteristics of dc plasmas can also he significantly changed by high concentrations of
Systems for dc plasma sample intro-
easily ionized elements (e.g., Na, Ca, etc.).
Atomic absorption nehulizers and spray chambers are without doubt the most robust sample introduction de- vices available for atomic spectrosco- py. They are mechanically stable, cor- rosion resistant (with PtiIr nebulizer capillaries and inert polymer cham- bers), difficult to block, and easy to clean. At the other end of the spec- trum are the rather delicate, all-glass concentric nebulizers often used with the ICP. Particle blockage with these devices can be an irreversible process. Crossflow nebulizers, which are much less fragile than concentric nebulizers, can be constructed for the ICP. They can also be fabricated from acid-resis- tant materials such as PTFE or Ryton. In recent years several propri- etary pneumatic nebulizer designs have been introduced that are claimed to overcome some of the noise and sta- bility problems common to ICP pneu- matic nebulizers. For instance, the MAK nebulizer (Figure 4), named after Meddings, Anderson, and Kai- ser, is a crossflow device that operates a t a very high back pressure (200 psi) and is made of glass (10).
The fundamental limitation of all pneumatic nebulizers of conventional design is that they produce aerosols with a wide drop size range. This means that high transport efficiency can be achieved only at the expense of allowing large drops to reach the at- omizer. One device that produces a much finer aerosol is the fritted disk nebulizer (11 ). This device has been claimed to generate aerosols with a mean primary drop size of <1 pm, and to result in a transport efficiency (c) of 9046 (12). In our laboratories we have been able to obtain en values of 3046. To obtain this performance, very low sample flow rates of 0.1 mL1 min are necessary, which means that the net analyte mass transport rate ( WtOt) is not as high as the value
88OA ANALYTICAL CHEMISTRY. VOL. 56, NO. 7, JUNE 1984

Advertising removed from this page

Advertising removed from this page

Flgure 5. Ultrasonic nebulizer
might initially indicate. Nevertheless, the increase in WtOt compared to con- ventional pneumatic nebulizers could he important in chromatographic and flow injection interfacing. Some nega- tive aspects of the fritted disk nebuliz- er are its tendency to froth and block when concentrated solutions (e.& >loo0 pglmL) are nebulized for more than a minute or so, its similar froth- ing problem with some organic sol- vents, and its extremely long wash-out time of several minutes. An external wash cycle can reduce the clean-out time to 4540 s (12).
The ultrasonic nebulizer has been suggested as a replacement for the pneumatic nebulizer since 1964. With this device, the principle of aerosol production is significantly different from pneumatic nebulization. In the ultrasonic nebulizer, instead of drops being stripped from a liquid cylinder hy a high velocity gas jet, surface in- stability is generated in a pool of liq- uid by a focused or unfocused ultra- sonic beam. The beam is generated by a piezoelectric transducer. These de- vices produce aerosols with mean drop diameters that appear to be a function of exciting frequency.
At low frequencies (i.e., 50 kHz or leas), cavitation is the main mode. At the high frequencies commonly used in modem ultrasonic nebulizers, typi- cally 1 MHz or greater, the mechanism of aerosol production changes from cavitation to geyser formation. With the geyser formation mechanism, power density in the liquid surface, rather than the operating frequency, becomes of major importance.
an ultrasonic transducer of the type described in Olson et al. (Figure 5) (13) have shown power-dependent particle size distributions. However, ultrasonic nebulizers generally give much more efficient fine aerosol pro-
Experiments in our laboratory with
duction than pneumatic nebulizers. Up to 30% efficient production of droplets in the size range from 1.5 to 2.5 pm has been found a t a 0.3-mL/ min solution flow rate.
Desolvation is essential for ultra- sonic nebulization if worthwhile signal gains are to he made (14). With sur- face water (15) and seawater (26) sam- ples, improvements in analytical working range hy factors of 1.1-12 have been claimed, the improvement varying with element. Cross-contami- nation problems often encountered with desolvation systems have been much reduced by using a concentric gas sheath to prevent deposits on tube walls (I 7). Nevertheless, many unan-
swered questions remain about the general reliability and freedom from interference of ultrasonic nebulizers (18); these must be addressed before they will achieve widespread use.
Nebulizers and spray chambers op- erate interactively, and must be opti- mized as a unit rather than individual- ly. There are, however, certain re- quirements relating specifically to the spray chamber:
the effective removal of aerosol droplets larger than the cutoff di- ameter (d,) found to be necessary for interference-free measurement, rapid wash-out characteristics, both to increase the possible rate of anal- ysis and to avoid cross-contamina- tion problems, and
from the chamber, to avoid pressure pulses in the atomizer. Slow wash-out is a particular proh-
lem of ICP spray chambers, caused because both gas and liquid flows are substantially lower (typically 1 L/min and 1 mL/min, respectively) than for AA systems (typically 18 L/min and 6 8 mL/min). The wash-out times necessary for a drop to 1% and 0.1% of peak for a typical ICP spray chamber are 25 s and 40 s, compared to AA val- ues of 1 sand 3 s. Paradoxically, wash- out problems with the ICP are aggra- vated by its exceptionally good linear working range of up to five orders of magnitude. The possiblity always ex- ists, with unknown samples of widely varying composition, that a loo0 pg/mL solution will be followed by one of 0.1 pg/mL. The consequences of
smooth drainage of waste aerosol
Figure 6. Wash-oui and carry-over with ICP spray chamber
ANALYTICAL CHEMISTRY, VOL. 56, NO. 7, JUNE 1984 883A

Advertising removed from this page

(a) SolutbnDelive8
.. . i t was nebulized. Devices based on this concept (Figure 7a), and suitable for atomic spectroscopy, have been de- Scribed (19). However, a simpler design (Figure 7b), in which a liquid stream is passed down a V-groove, with a small hole drilled in its center for the gas stream, has also proved popular, and is available commercially (20). Bab- inpton-type nebulizers can be made ei- ther entirely of glass, metal, or Teflon, or by embedding a sapphire orifice in a Teflon block.
All Babington-type nebulizers are inherently blockage-free because of their method of operation. As such, they are ideal when solutions with sus- pended particles must be analyzed, and when prior acid or other dissolu- tion to dissolve the particles is not convenient. The trap to be avoided when using these nebulizers is to as- sume that simply because the sample is capable of nebulization the analyti-
Figure 7. (a) Babington nebulizer (b) V-groove nebulizer
such a sequence are shown in Figure 6. One way to reduce wash-out time sig- nificantly is to use flow injection tech- niques, which lie discussed in more detail later in the article.
High Solids Nebulizers: Babing- ton and V-Groove. The problems of nebulizer blockage inherent in con- ventional pneumatic nebulizers are ef-
fectively overcome with Bahington. type nebulizers. The original Babing- ton concept, developed for paint spraying, involved a spherical surface with an array of holes around a cir- cumference. The gas supply came from within the sphere, and as the liq- uid flowed over the outside of the sphere and passed over the gas stream,
YVatermnt U Figure 8. Electrothermal vaporizer for ICP
cal results are therefore necessarily meaningful. The limitations regarding particle vaporization, discussed ear- lier, are especially critical in this situa- tion. Simply transporting the analyte to the flame or plasma does not guar- antee that a proportional supply of atoms or ions will result. In certain sit- uations, such as the direct analysis of animal tissue after preparation of a slurry of the finely divided sample, the accuracy of the procedure has been well documented (21). In other cir- cumstances, caution should he ob- served until good agreement with standard reference materials can be obtained.
Electrothermal Vaporization In many respects electrothermal va- porization (ETV) is better for sample introduction in ICP emission spectros- copy than it is for atomization in AAS. Specifically, the limitations in normal furnace AAS, including condensation problems within the furnace, light scattering due to particulates and mo- lecular species, and lack of adequate linear working range, disappear when these devices are used for sample in- troduction rather than for atomiza- tion. I t is possible to maintain the mi- crosampling capabilities of electro- thermal furnaces while producing de&- tion limits generally comparable to, or only a little poorer than those obtain- able with furnace AAS. In addition, the wide linear working range (up to five orders of magnitude), freedom from interference, and multielement capabilities of the ICP are maintained.
It is possible to interface many com- mercially available electrothermal va- porizers to an ICP with relatively little system modification. However, the most suitable type of vaporizer is probably the open graphite rod device (22,23). A typical system is shown in
ANALYTICAL CHEMISTRY. VOL. 56. NO. 7, JUNE I S 6 4 88SA

Advertising removed from this page
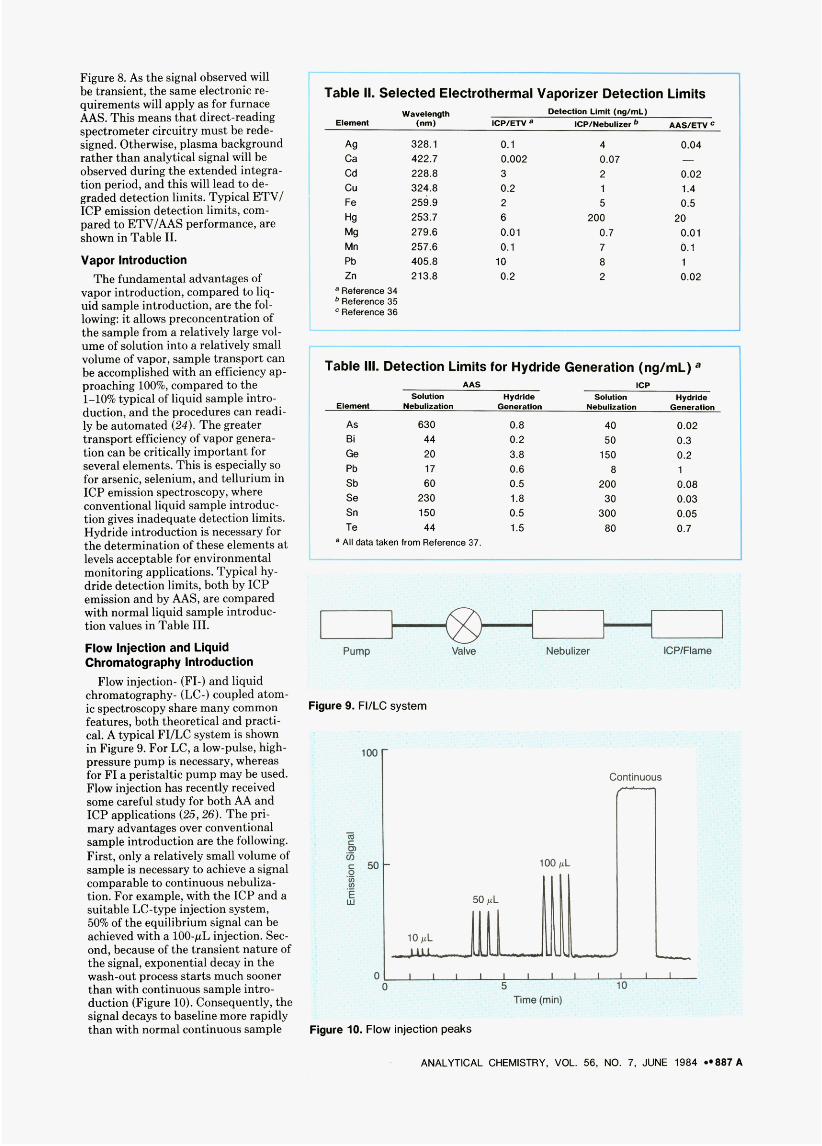
Figure 8. As the signal observed will he transient, the same electronic re- quirements will apply as for furnace AAS. This means that direct-reading spectrometer circuitry must be rede- signed. Otherwise, plasma background rather than analytical signal will be observed during the extended integra- tion period, and this will lead to de- graded detection limits. Typical ETV/ ICP emission detection limits, com- pared to ETV/AAS performance, are shown in Table 11.
Vapor Introduction The fundamental advantages of
vapor introduction, compared to liq- uid sample introduction, are the fol- lowing: i t allows preconcentration of the sample from a relatively large vol- ume of solution into a relatively small volume of vapor, sample transport can he accomplished with an efficiency ap- proaching 1W%, compared to the 1-1W typical of liquid sample intro- duction, and the procedures can readi- ly be automated (24). The greater transport efficiency of vapor genera- tion can be critically important for several elements. This is especially so for arsenic, selenium, and tellurium in ICP emission spectroscopy, where conventional liquid sample introduc- tion gives inadequate detection limits. Hydride introduction is necessary for the determination of these elements at levels acceptable for environmental monitoring applications. Typical hy- dride detection limits, both by ICP emission and by AAS, are compared with normal liquid sample introduc- tion values in Table 111.
Flow Injection and Liquid Chromatography Introduction
Flow injection- (FI-) and liquid chromatography- (LC-) coupled atom- ic spectroscopy share many common features, both theoretical and practi- cal. A typical F I L C system is shown in Figure 9. For LC, a low-pulse, high- pressure pump is necessary, whereas for FI a peristaltic pump may be used. Flow injection has recently received some careful study for both AA and ICP applications (25,26). The pri- mary advantages over conventional sample introduction are the following. First, only a relatively small volume of sample is necessary to achieve a signal comparable to continuous nebuliza- tion. For example, with the ICP and a suitable LC-type injection system, 50% of the equilibrium signal can be achieved with a 1W-pL injection. Sec- ond, because of the transient nature of the signal, exponential decay in the wash-out process starts much sooner than with continuous sample intro- duction (Figure 10). Consequently, the signal decays to baseline more rapidly than with normal continuous sample
Table II. Selected Electrothermal Vaporizer Detection Limits
Ag 328.1 0.1 4 0.04 Ca 422.7 0.002 0.07 - Cd 228.8 3 2 0.02 cu 324.8 0.2 1 1.4 Fe 259.9 2 5 0.5 Hg 253.7 6 200 20 Mg 279.6 0.01 0.7 0.01 Mn 257.6 0.1 7 0.1 Pb 405.8 10 8 1 Zn 213.8 0.2 2 0.02
a Reference 34 Relwmce 35 Reference 36
Table 111. Detection Limits for Hydride Generation (ng/mL) AAS ICP
SGi"liO8l w a r m 8olutlrn Hyddrlde E l rnm Nohlhsuon Gennsllon Nehllzalim G s ru r a I1 o n
A s 630 0.8 40 0 02 BI 44 0 2 50 0.3 Ge 20 3 8 1.50 0.2 Pb 17 0.6 8 1 Sb 60 0 5 200 0.08 Se 230 1.8 30 0 03 Sn 150 0.5 300 0 05 Te 44 1.5 80 0.7
All data taken born Reference 37. I
Figure 9. FllLC system
Figure 10. Flow injection peaks
ANALYTICAL CHEMISTRY. VOL. 56. NO. 7. JUNE 1984 887A

introduction. It is therefore possible, with the ICP, to inject samples at the rate of approximately 4/min, as op- posed to 1.5/min with conventional sample introduction. Additionally, in AAS, where the addition of ionization buffers, lanthanum releasing agents, etc., may be desirable, it is possible to add the analyte as a spike into a flow- ing stream of the desired buffer, mak- ing for a relatively simple experimen- tal system (26).
Other Techniques for Sample Introduction
The techniques considered so far have achieved substantial practical use; there are others which have more specialized applications. Laser abla- tion, in which the power from a fo- cused ruby laser is used to vaporize a spot of material directly from a solid surface, has considerable promise (27, 28). Another approach of great inter- est in metallurgy is the use of spark or arc vaporization (29,30). Some inter- esting studies have been made in which sample is introduced into the ICP with a carbon rod and placed into the torch in the region of the plasma coils but below the plasma itself (31, 32). Direct inductive heating of the carbon occurs, and the sample vapo- rizes directly into the plasma. With this system, very efficient transport of
sample to the plasma is readily accom- plished. However, vaporization is not always very rapid, and the broad emis- sion peaks that result can sometimes lead to poor detection limits.
ficient sample transfer of solid and liquid samples to the ICP have been described recently, including a system where the rf plasma is led into a cham- ber below the torch for sample vapor- ization (33).
Many of the devices presently pro- posed as alternatives to liquid sample introduction offer great promise for specific applications; however, to achieve widespread use, they will have to demonstrate the reliability, free- dom from interference, and the ease of use that liquid sample introduction currently enjoys. Finally, there is al- ways the possibility that some truly new sample introduction technique, with general applicability, will be de- veloped. The need is certainly there.
Acknowledgment
Other devices aimed at obtaining ef-
This material is based on work sup- ported by the National Science Foun- dation under Grant No. CHESO- 19947.
References (1) Parsons, M. L.; Forster, A.; Anderson,
D. “An Atlas of Spectral Interferences in
ICP Spectroscopy”; Plenum: New York, 1980.
(2) Boumans, P.W.J.M. “Line Coincidence Tables for Inductively Coupled Plasma Emission Spectrometry”; Pergamon: New York, 1981; Vols. I and 11.
(3) Boorn, A. W.; Browner, R. F. Anal. Chem. 1982,54,1402.
(4) Hausler, D. W.; Taylor, L. T. Anal. Chem. 1981,53,1223.
(5) Kull, R., Jr.; Browner, R. F. Spectro- chim. Acta B 1983,38,51.
(6) Smith, D. D. PhD Thesis, Georgia In- stitute of Technology, Atlanta, Ga., 1983.
(7) Smith, D. D.; Browner, R. F., submit- ted for publication in Anal. Chem.
(8) Stupar, J.; Dawson, J. B. Appl. Opt. 1968, 7,1351.
(9) Novak, J. W.; Lillie, D. E.; Boorn, A. W.; Browner, R. F. Anal. Chem. 1980, 52,579.
(10) Anderson, H.; Kaiser, H.; Meddings, B. In “Developments in Atomic Plasma Spectrochemical Analysis”; Barnes, R. M., Ed.; Heyden and Son: London, U.K., 1981, p. 251.
(11) Apel, C. T.; Duchane, D. V. Abstracts of Papers, Pittsburgh Conference on An- alytical Chemistry and Applied Spec- troscopy, Cleveland, Ohio, 1979.
(12) Layman, L. R.; Lichte, F. E. Anal. Chem. 1982,54,638.
(13) Olson, K. W.; Haas, W. J., Jr.; Fassel, V. A. Anal. Chem. 1977,49,632.
(14) Boumans, P.W.J.M.; de Boer, F. J. Spectrochim. Acta B 1975,30,309.
(15) Taylor, C. E.; Floyd, T. L. Appl. Spectrosc. 1981,35,408.
(16) Berman, S. S.; McLaren, J. W.; Willie, S. N. Anal. Chem. 1980.52.488.
(17) Mermet, J. M.; Trassy, C. In “Devel- o ments in Atomic Plasma Spectro- cEemica1 Analysis”; Barnes, R. M., Ed.: Heyden and Son: London, U.K., 1981, p. 245.
(18) Boumans, P.W.J.M.; de Boer, F. J. Spectrochim. Acta B 1976,31,355.
(19) Garbarino, J. R.; Taylor, H. E. Appl. Spectrosc. 1980,34,584.
(20) Suddendorf, R. F.; Boyer, K. W. Anal. Chem. 1978.50.1769.
(21) Mohamed, N.; Brown, R. M., Jr.; Fry, R. C. Appl. Spectrosc. 1981,35,153.
(22) Kirkbright, G. F.; Gunn, A. M.; Mil- lard, D. L. Analyst (London) 1978,203, 1066.
(23) Barnes, R. M.; Fodor, P. Spectrochim. Acta B 1983,38,1191.
(24) Godden, R. G.; Thomerson, D. R. An- alyst (London) 1980,105,1137.
(25) Greenfield, S. Spectrochim. Acta B 1983,38,93.
(26) Tyson, J.; Idris, A. B. Analyst (Lon- don) 1981,106,1125.
(27) Carr, J. W.; Horlick, G. Spectrochim. Acta B 1982,37,1.
(28) Thompson, M.; Goulter, J. E.; Sieper, F. Analyst (London) 1981,106,32.
(29) Human. H.G.C.: Scott. R. H.: Oakes. ~ A. R.; West, C. D. Analyst (London)
’
1976,101,265. (30) Marks, J. Y.; Fornwalt, D. E.; Yungk,
R. E. Spectrochim. Acta B 1983,38,107. (31) Salin, E. D.: Horlick, G. Anal. Chem.
1979,51,2284.
lyst (London) 1982,207,241.
Anal. Chem. 1984,55,1414.
R. F., submitted for publication in Spec-
(32) Kirkbright, G. F.; Walton, S. J. Ana-
(33) Farnsworth, P. B.; Hieftje, G. M.
(34) Long, S. E.; Snook, R. D.; Browner,
trochim. Acta B. (35) Fassel, V. A,; Kniseley, R. N. Anal.
Chem. 1974,45,1110 A..
A. P. Prog. Anal. At. Spectrosc. 1981,4, 81.
trosc. 1983,6,163.
(36) Knoller, B. N.; Bloom, H.; Arnold,
(37) Nakahara, T. Prog. Anal. At. Spec-
8 8 8 A ANALYTICAL CHEMISTRY, VOL. 56, NO. 7, JUNE 1984