Embed Size (px)
Citation preview


Obour Land For Food Industries
Investor Presentation
August 2019
2
Table of Contents
I. Overview of the Market
II. Obour Land’s Strategy
III. 1H2019 Financial Performance
3
Disclaimer
This presentation and any materials distributed in connection with this presentation are not directed or intended for distribution to or use by, any person or entity that is a citizen or resident located
in any locality, state, country or other jurisdiction where such distribution, publication, availability or use would be contrary to the law or regulation of that jurisdiction or which would require any
registration or licensing within such jurisdiction. Persons who come into possession of any document or other information referred to herein should inform themselves about and observe any such
restrictions. Any failure to comply with these restrictions may constitute a violation of the securities laws of such jurisdictions.
This presentation includes forward-looking statements that reflect management’s current views with respect to future events and financial and operational performance. These statements contain
the words “anticipate”, “believe”, “intend”, “estimate”, “expect”, “may”, “plan”, “should”, “could”, “aim”, “target”, “might” and words of similar meaning. All statements other than statements of historical
facts included in this presentation, including, without limitation, those regarding the Company’s financial position, business strategy, plans and objectives of management for future operations are
forward-looking statements. Such forward-looking statements involve known and unknown risks, uncertainties and other important factors that could cause the actual results, performance or
achievements of the Company to be materially different from future results, performance or achievements expressed or implied by such forward-looking statements. The forward-looking statements
are based on numerous assumptions regarding the Company’s present and future business strategies and the environment in which the Company will operate in the future. They speak only as at
the date of this presentation, and actual results or performance may differ materially from those expressed or implied from the forward-looking statements. In addition, the forward looking
statements are not intended to give any assurances as to future results and statements regarding past trends should not be taken as a representation that they will continue in the future. The
Company, the Banks and their respective advisers each expressly disclaim any obligation or undertaking to disseminate any updates or revisions to any forward looking statements contained
herein to reflect any change in the Company’s expectations or any change in the events, conditions or circumstances on which any such statement is based, unless otherwise required by law. The
Company does not undertake to review, confirm or release publicly or otherwise to investors or any other person any revisions to any forward-looking statements to reflect events occurring or
circumstances arising after the date of this presentation.
This presentation contains non-EAS measures (such as EBITDA). These measures have limitations as analytical tools and should not be consideration in isolation or as substitutes for analysis of
the Company’s results as reported under EAS.
This presentation, and any matter or dispute (whether contractual or non-contractual) arising out of it, shall be governed and construed in accordance with Egyptian law and the Courts of Cairo shall
have exclusive jurisdiction in relation to any such matter or dispute.
By attending this presentation and/or receiving this presentation document, you are agreeing to the terms and conditions set forth above.

I. Overview of the Market
5
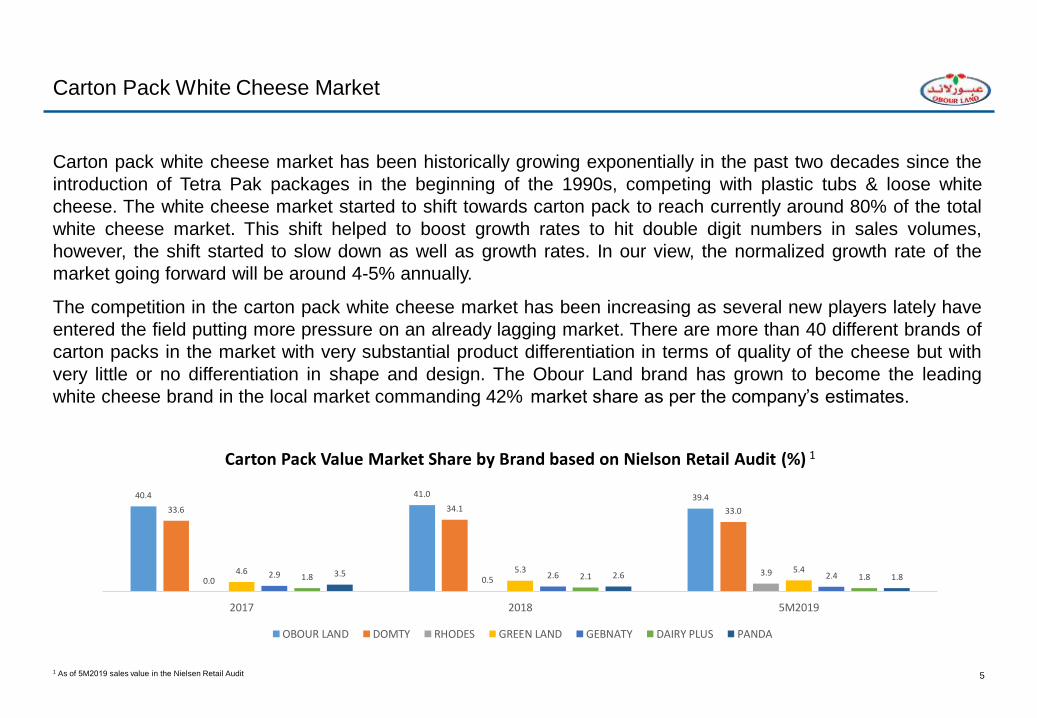
Carton Pack White Cheese Market
1 As of 5M2019 sales value in the Nielsen Retail Audit
Carton pack white cheese market has been historically growing exponentially in the past two decades since the
introduction of Tetra Pak packages in the beginning of the 1990s, competing with plastic tubs & loose white
cheese. The white cheese market started to shift towards carton pack to reach currently around 80% of the total
white cheese market. This shift helped to boost growth rates to hit double digit numbers in sales volumes,
however, the shift started to slow down as well as growth rates. In our view, the normalized growth rate of the
market going forward will be around 4-5% annually.
The competition in the carton pack white cheese market has been increasing as several new players lately have
entered the field putting more pressure on an already lagging market. There are more than 40 different brands of
carton packs in the market with very substantial product differentiation in terms of quality of the cheese but with
very little or no differentiation in shape and design. The Obour Land brand has grown to become the leading
white cheese brand in the local market commanding 42% market share as per the company’s estimates.
40.4 41.0 39.4
33.6 34.1 33.0
0.0 0.53.94.6 5.3 5.4
2.9 2.6 2.41.8 2.1 1.83.5 2.6 1.8
2017 2018 5M2019
Carton Pack Value Market Share by Brand based on Nielson Retail Audit (%) 1
OBOUR LAND DOMTY RHODES GREEN LAND GEBNATY DAIRY PLUS PANDA
6
Milk & Juice Markets
1 As of 5M2019 sales value in the Nielsen Retail Audit
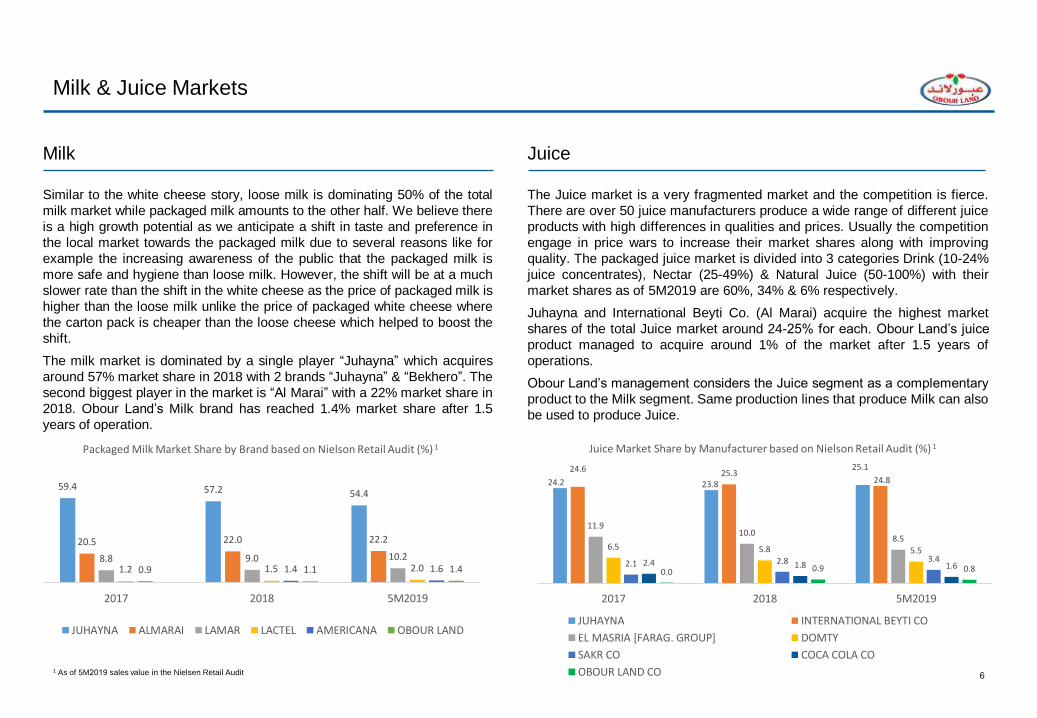
Milk
Similar to the white cheese story, loose milk is dominating 50% of the total
milk market while packaged milk amounts to the other half. We believe there
is a high growth potential as we anticipate a shift in taste and preference in
the local market towards the packaged milk due to several reasons like for
example the increasing awareness of the public that the packaged milk is
more safe and hygiene than loose milk. However, the shift will be at a much
slower rate than the shift in the white cheese as the price of packaged milk is
higher than the loose milk unlike the price of packaged white cheese where
the carton pack is cheaper than the loose cheese which helped to boost the
shift.
The milk market is dominated by a single player “Juhayna” which acquires
around 57% market share in 2018 with 2 brands “Juhayna” & “Bekhero”. The
second biggest player in the market is “Al Marai” with a 22% market share in
2018. Obour Land’s Milk brand has reached 1.4% market share after 1.5
years of operation.
Juice
The Juice market is a very fragmented market and the competition is fierce.
There are over 50 juice manufacturers produce a wide range of different juice
products with high differences in qualities and prices. Usually the competition
engage in price wars to increase their market shares along with improving
quality. The packaged juice market is divided into 3 categories Drink (10-24%
juice concentrates), Nectar (25-49%) & Natural Juice (50-100%) with their
market shares as of 5M2019 are 60%, 34% & 6% respectively.
Juhayna and International Beyti Co. (Al Marai) acquire the highest market
shares of the total Juice market around 24-25% for each. Obour Land’s juice
product managed to acquire around 1% of the market after 1.5 years of
operations.
Obour Land’s management considers the Juice segment as a complementary
product to the Milk segment. Same production lines that produce Milk can also
be used to produce Juice.
59.4 57.2 54.4
20.5 22.0 22.2
8.8 9.0 10.21.2 1.5 2.00.9 1.4 1.61.1 1.4
2017 2018 5M2019
Packaged Milk Market Share by Brand based on Nielson Retail Audit (%) 1
JUHAYNA ALMARAI LAMAR LACTEL AMERICANA OBOUR LAND
24.2 23.8
25.124.6 25.324.8
11.910.0
8.56.5 5.8 5.5
2.1 2.8 3.42.4 1.8 1.60.0 0.9 0.8
2017 2018 5M2019
Juice Market Share by Manufacturer based on Nielson Retail Audit (%) 1
JUHAYNA INTERNATIONAL BEYTI CO
EL MASRIA [FARAG. GROUP] DOMTY
SAKR CO COCA COLA CO
OBOUR LAND CO

II. Obour Land Strategy

8
White Cheese Strategy
Obour Land’s management is focusing on preserving the company’s leading place as the largest white cheese
producer in Egypt and to keep the gap between Obour Land and other competitors.
The company plans to keep developing its cheese products furthermore by investing in innovation and updating
its production lines to produce a more attractive product while improving the company’s cost efficiency. The
company is planning to replace old production lines with the latest advanced technologies in the white cheese
manufacturing industry to increase efficiency and productivity at lower costs as it will reduce the use of energy by
40%.
The new production lines’ output will have a new shape and design which will differentiate Obour Land’s brand
from all other brands in the market. The new production lines will be more environment-friendly as it will save
energy and produce more packs per hour while using less labor. The systematic improvement in reducing the
environmental impacts is a part of Obour Land’s efforts to improve its society and contributing towards a
sustainable development.
9
Milk & Juice Strategy
The company’s strategy in penetrating a new market is to achieve the utmost customer satisfaction by providing
a product with the highest quality levels consistently. Since commencing the production of Milk & juice, Obour
Land’s main focus is to achieve a premium quality product that can compete with top quality brands in the
market. The company launched its new products in December 2017 and starting testing the feedback of the
market in the first 3 months of operation to ensure that it will satisfy customers’ needs. The feedback was very
positive especially for the Milk product and the results were very promising.
Obour Land aims to acquire a decent market share based on customer preferences rather than discounted prices
therefore the company does not engage in price wars or offers big discounts as a way to penetrate a new market.
The management believes that this strategy will lead to having a more stable and long-term market share that
will be loyal to the brand similar to the company’s White Cheese success story and by using the same applied
sales policies.
The company’s cash payment policies for retails and wholesalers as well as other policies implemented in the
white cheese segment are factors that can slow the growth of Obour Land’s market share in Milk & Juice.
Wholesalers will not be tempted to purchase the new products in the beginning with the same policies applied in
the white cheese, where Obour Land is the market leader. However, the management believes that by reaching
out to small & large grocery shops directly by the company’s retail distribution vehicles and based on the
product’s premium quality, demand will be created in the market and wholesalers will eventually purchase the
new products while adhering to the company’s policies.

10
Processed Cheese
The company started the production of Processed Cheese in March 2018 and had
plans also to introduce a Mozzarella Cheese product. However, after monitoring and
testing both markets the management decided to cancel the Mozzarella product and
sell the production line to have more room in the factory to develop the Processed
Cheese products and to explore new ideas and innovations to expand the market
furthermore by introducing an innovative new product.

III. Financial Results 1H 2019
12
Financial Performance
Key Investment Highlights
High Quality Product Mix
Supply Chain and Sales Network
Revenues & COGS Build-Up
Financial Statements
1
2
3
4
5

13
High Quality Product Mix
Product Portfolio Synopsis
Brand
Product Family
Launch Date
SKUs
Production Capacity
(TPA)
1H2019 Utilization Rate
1H2019 Contribution to
Sales
1
Product Portfolio
Plastic
Tub2
Carton Pack180gm
Carton
Pack
2015
1
4,320
27%
1.2%
125gm
Carton
Pack
2011
4
23,625
61%
15.6%
250gm
Carton
Pack
2007
4
72,000
75%
54.5%
500gm
Carton
Pack
2007
7
54,000
45%
24.5%
Plastic
Tub
1999
24
4,130
55%
2.7%
80g Feta 125g Feta 125g Olive 125g
Istanbully
250g Olive250g Feta 250g
Istanbully
500g Olive 500g
Istanbully500g Feta
1kg Khazeen 1kg
Istanbully
1kg Feta
1kg
Double
Cream
1kg
Barameely1kg Istanbully
Vegetable
Fat
Natural
Fat
1kg
Talaga
Source: Company1Other Carton Pack SKUs include 1 Kg Istanbully, 1 Kg Olive, 1 Kg Chili, 500gm Feta slim, 500gm Olive slim, 500gm Chili slim, 500gm Istanbully slim, 250gm Chili slim, 125gmChili slim2 Other plastic tubs SKUs include 400gm Istanbully, 400gm Feta, 400gm Khazeen, 400gm Talaga, 400gm Istanbully Full Cream, 400gm Double Cream, 400gm Barameely, 1.5kg Feta Pepper, 11kg Feta and 12kg Low Salt3 Other Milk & Juice SKUs include 250ml Juice (Mango, Guava, Apple, Pineapple, Orange) 1litre Juice(Cocktail, Guava, Apple, Pineapple, Orange) and 500ml Milk
1 Kg
Carton
Pack
2017
4
36,000
4%
1.5%
1 Kg Feta
Milk & Juice3
Processed Cheese
1 Liter
Milk
&Juice
2018
3
42,000
18%
3.4%
250ml
Juice
2018
12
36,000
9%
1.3%

14
Sales Breakdown by Channel
Obour Land’s
distribution network is
helping the company to
control its products
prices while applying its
sales policies and
reducing SG&A
expenses.
The company is
planning to increase its
exports by focusing
more on exporting
Juice.
The Company grew its
fleet 22% CAGR in
2014-2018, however,
the number of fleet
decreased in 1H2019 to
reach 418 vehicles as
the company sold some
of the old vehicles to
replace with new
vehicles to reduce
running costs.
Source: Company
Supply Chain and Sales Network2
SharkiaMenoufia
Kafr El SheikhBeheira
Dakahlia
Qalyubia
Robust Distribution Platform
Indirect Distribution Wholesalers
North Sinai
Suez
Distribution Centers and Distribution Wholesalers
# Fleet
▲22%
Maximum Handling
Capacity (Tons/Day)
▲22%
60%66%
72%67% 70% 69%
37%29%
26%31% 27% 28%
3% 5% 2% 2% 3% 2%
0.14% 0.45% 0.18% 0.35%
2014 2015 2016 2017 2018 1H2019
Wholesalers Retailers Key Accounts Exports
191 201 201
345
423 418
90
14 0
19 0
24 0
29 0
34 0
39 0
44 0
2014 2015 2016 2017 2018 1H 2019
2014-2018 CAGR%
555 605
804
1018
1248 1233
25 0
45 0
65 0
85 0
10 50
12 50
14 50
2014 2015 2016 2017 2018 1H2019
15
Financial Performance
Net Revenues1 (EGP mn)
3
Gross Profit2, Margin (EGP mn, %) EBITDA, Margin (EGP mn, %)
Net Income, Margin (EGP mn, %) Net Cash3 (Net Debt) Cash Conversion Cycle (Days)
1 Net revenues are net of discounts2 Gross profit excludes depreciation expense included in the cost of sales3 Debt obligations include credit facilities, liabilities for the purchase of machinery and dividends payable
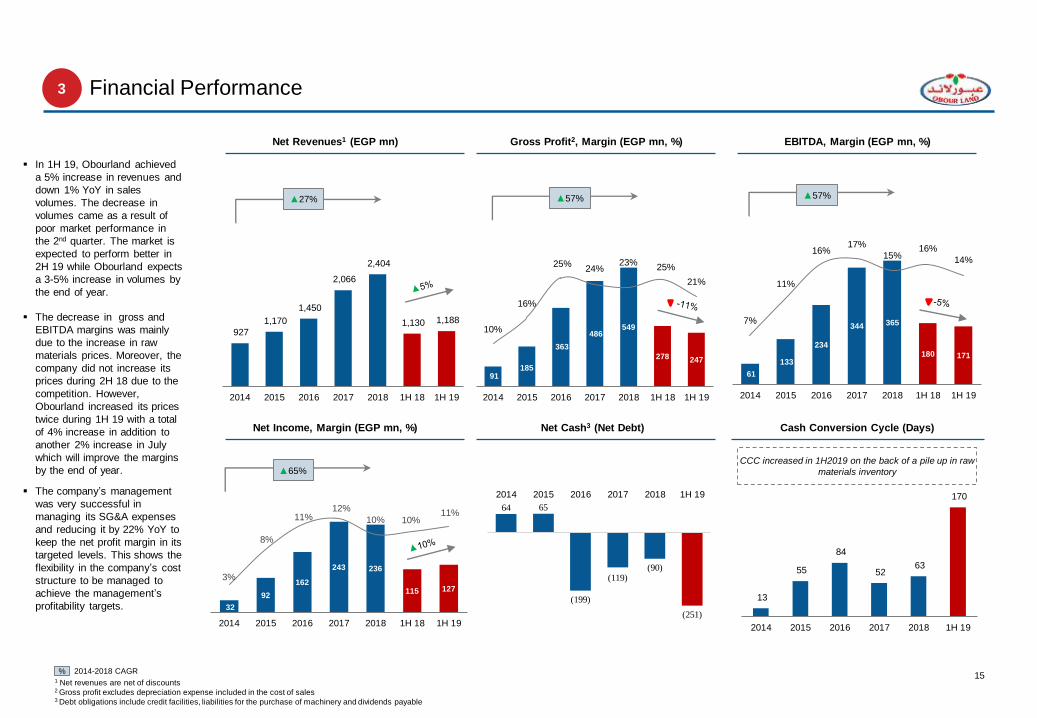
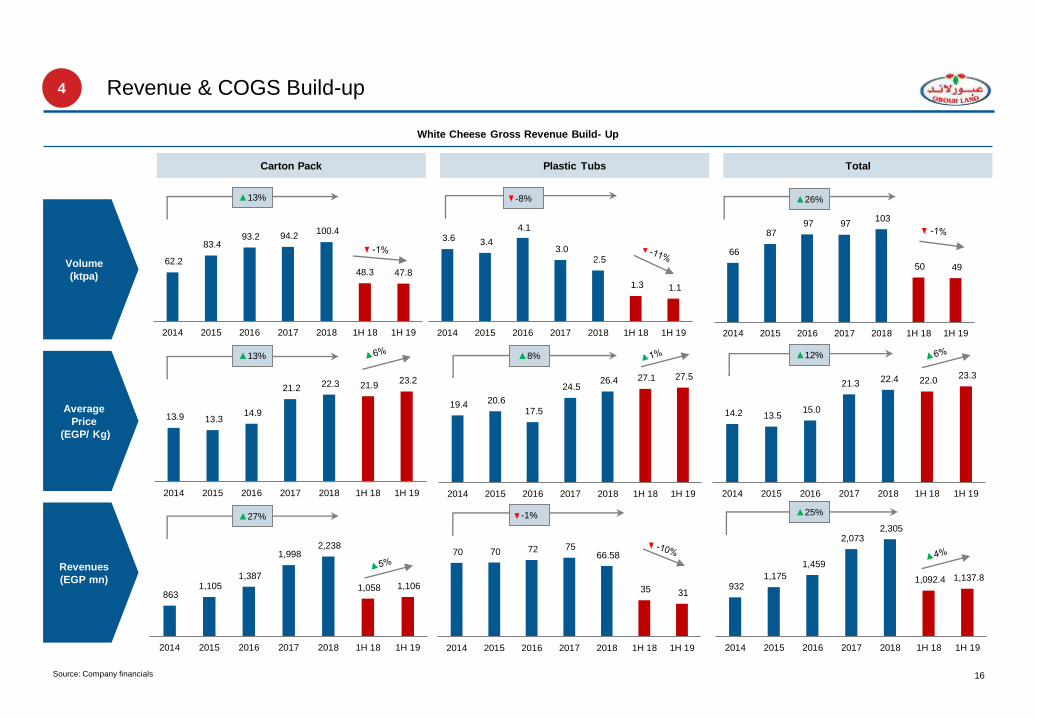
In 1H 19, Obourland achieved
a 5% increase in revenues and
down 1% YoY in sales
volumes. The decrease in
volumes came as a result of
poor market performance in
the 2nd quarter. The market is
expected to perform better in
2H 19 while Obourland expects
a 3-5% increase in volumes by
the end of year.
The decrease in gross and
EBITDA margins was mainly
due to the increase in raw
materials prices. Moreover, the
company did not increase its
prices during 2H 18 due to the
competition. However,
Obourland increased its prices
twice during 1H 19 with a total
of 4% increase in addition to
another 2% increase in July
which will improve the margins
by the end of year.
The company’s management
was very successful in
managing its SG&A expenses
and reducing it by 22% YoY to
keep the net profit margin in its
targeted levels. This shows the
flexibility in the company’s cost
structure to be managed to
achieve the management’s
profitability targets.
2014-2018 CAGR%
CCC increased in 1H2019 on the back of a pile up in raw
materials inventory
▲27% ▲57% ▲57%
▲65%
927
1,170
1,450
2,066
2,404
1,130 1,188
-
50 0
1, 000
1, 500
2, 000
2, 500
3, 000
2014 2015 2016 2017 2018 1H 18 1H 19
91 185
363
486 549
278 247
10%
16%
25%24%
23%25%
21%
0%
5%
10 %
15 %
20 %
25 %
30 %
-
10 0
20 0
30 0
40 0
50 0
60 0
2014 2015 2016 2017 2018 1H 18 1H 19
61
133
234
344 365
180 171
7%
11%
16%17%
15%16%
14%
0%
2%
4%
6%
8%
10 %
12 %
14 %
16 %
18 %
-
50
10 0
15 0
20 0
25 0
30 0
35 0
40 0
2014 2015 2016 2017 2018 1H 18 1H 19
32
92
162
243 236
115 127
3%
8%
11%12%
10% 10%11%
0%
2%
4%
6%
8%
10 %
12 %
14 %
0
50
10 0
15 0
20 0
25 0
30 0
2014 2015 2016 2017 2018 1H 18 1H 19
64 65
(199)
(119)(90)
(251)
2014 2015 2016 2017 2018 1H 19
13
55
84
52 63
170
-
20
40
60
80
10 0
12 0
14 0
16 0
18 0
2014 2015 2016 2017 2018 1H 19
16
Revenue & COGS Build-up
White Cheese Gross Revenue Build- Up
Source: Company financials
Carton Pack Plastic Tubs Total
Volume
(ktpa)
Average
Price
(EGP/ Kg)
Revenues
(EGP mn)
▲13% -8% ▲26%
▲13% ▲8% ▲12%
▲27% -1% ▲25%
4
62.2
83.4 93.2 94.2
100.4
48.3 47.8
-
20 .0
40 .0
60 .0
80 .0
10 0.0
12 0.0
2014 2015 2016 2017 2018 1H 18 1H 19
3.6 3.4
4.1
3.0 2.5
1.3 1.1
2014 2015 2016 2017 2018 1H 18 1H 19
66
87 97 97
103
50 49
-
20
40
60
80
10 0
12 0
2014 2015 2016 2017 2018 1H 18 1H 19
13.9 13.3 14.9
21.2 22.3 21.9 23.2
-
5. 0
10 .0
15 .0
20 .0
25 .0
2014 2015 2016 2017 2018 1H 18 1H 19
19.4 20.6 17.5
24.5 26.4 27.1 27.5
-
5. 0
10 .0
15 .0
20 .0
25 .0
30 .0
2014 2015 2016 2017 2018 1H 18 1H 19
14.2 13.5 15.0
21.3 22.4 22.0
23.3
-
5. 0
10 .0
15 .0
20 .0
25 .0
2014 2015 2016 2017 2018 1H 18 1H 19
863 1,105
1,387
1,998 2,238
1,058 1,106
-
50 0
1, 000
1, 500
2, 000
2, 500
2014 2015 2016 2017 2018 1H 18 1H 19
70 70 72 75 66.58
35 31
-
10
20
30
40
50
60
70
80
2014 2015 2016 2017 2018 1H 18 1H 19
932 1,175
1,459
2,073 2,305
1,092.4 1,137.8
-
50 0
1, 000
1, 500
2, 000
2, 500
2014 2015 2016 2017 2018 1H 18 1H 19

17
Raw materials costs represent
the biggest portion of COGS,
contributing ~60% to sales in
1H 19 compared to 56% in 1H
18 due to the increase of raw
materials prices.
Others raw materials increased
significantly starting from 2018
due to the introduction of the
company’s new products Milk &
Juice. Others include raw milk,
juice concentrates, sugar &
other raw materials.
COGS Build-up
COGS Breakdown (EGP mn)
Gross Profit2, Margin (EGP mn, %)
Raw Materials Breakdown (EGP mn)Cost of Sales Breakdown (EGP mn)1
Source: Company financials1 Cost of sales excludes depreciation expense2 Gross profit excludes depreciation expense included in the cost of sales
91 185
363 486 549
278 247
10%
16%
25% 24%23%
25%21%
0%
5%
10 %
15 %
20 %
25 %
30 %
-
10 0
20 0
30 0
40 0
50 0
60 0
2014 2015 2016 2017 2018 1H 18 1H 19
716813 852
1211
1,400
636711
106
150168
295
352
162170
19
23 68
95
106
46
58
(5) (1) (0)(21)
(3)
8
2
2014 2015 2016 2017 2018 1H 18 1H 19
Raw Materials Packaging Industrial Expenses Change in Inventory
397 417 418 573568 266 298
80110 149
133
147 49 70
101 173 175336
329 132
151
30 29 36 50
72 32
38
107 85 74 119 283 158 154
2014 2015 2016 2017 2018 1H 18 1H 19
SMP & Milk Protein Concentrate Butter Oils GDL Others

18
Financial Statements – Income Statement
Source: Company Financial Statements1 Excludes depreciation expense2 The provisions for expected claims are related to the Company’s expected tax claims
5
EGP 2014 2015 2016 2017 2018 1H2018 1H2019
Revenues 926,979,665 1,169,837,613 1,450,122,574 2,065,516,703 2,403,541,039 1,129,578,266 1,187,567,544
Export Rebates - - - 558273
Cost of sales1 -835,651,737 -985,062,271 -1,087,501,189 -1,579,642,506 -1,854,824,403 -851,651,807 -940,371,584
Gross Profit 91,327,928 184,775,342 362,621,385 486,432,470 548,716,636 277,926,459 247,195,960
Gross Profit Margin 10% 16% 25% 24% 23% 24.6% 20.8%
Selling and marketing expense1 -26,702,550 -46,645,944 -117,932,531 -122,045,740 -156,462,756 -88,655,473 -62,853,571
General and administrative expense1 -3,945,846 -4,674,091 -10,847,153 -20,079,451 -27,607,376 -9,250,924 -13,089,457
EBITDA 60,679,532 133,455,307 233,841,701 344,307,279 364,646,504 180,020,062 171,252,932
EBITDA Margin 7% 11% 16% 17% 15% 15.9% 14.4%
Depreciation -8,042,793 -10,044,891 -13,301,946 -18,445,255 -37,802,074 -17,777,317 -21,599,818
EBIT 52,636,739 123,410,416 220,539,755 325,862,024 326,844,430 162,242,745 149,653,114
EBIT Margin 6% 11% 15% 16% 14% 14.4% 12.6%
Other income (loss) 201,794 2,522,059 2,109,459 579,535 3,830,747 2,018,664 1,077,841
Provision for expected claims2 -6,028,106 -5,730,770 -2,356,796
(Loss) gain from disposal of fixed assets 198,825 -51,050 287,206 5,101 1,549,569
Foreign exchange difference -178,319 913,605 -4,922,292 5,110,467 -830,775 -268,659 17,437,727
Net Interest Expense -733,459 -1,004,538 -5,973,933 -17,715,849 -24,374,339 -15,393,307 -4,778,207
EBT 46,097,474 120,059,722 209,683,399 313,836,177 305,470,063 148,604,544 164,940,044
Income tax -14,014,480 -28,208,203 -47,695,427 -70,639,403 -69,248,899 -33,422,558 -37,670,393
Net Profit 32,082,994 91,851,519 161,987,972 243,196,774 236,221,164 115,181,986 127,269,651
Net Profit Margin 3% 8% 11% 12% 10% 10.20% 10.72%
19
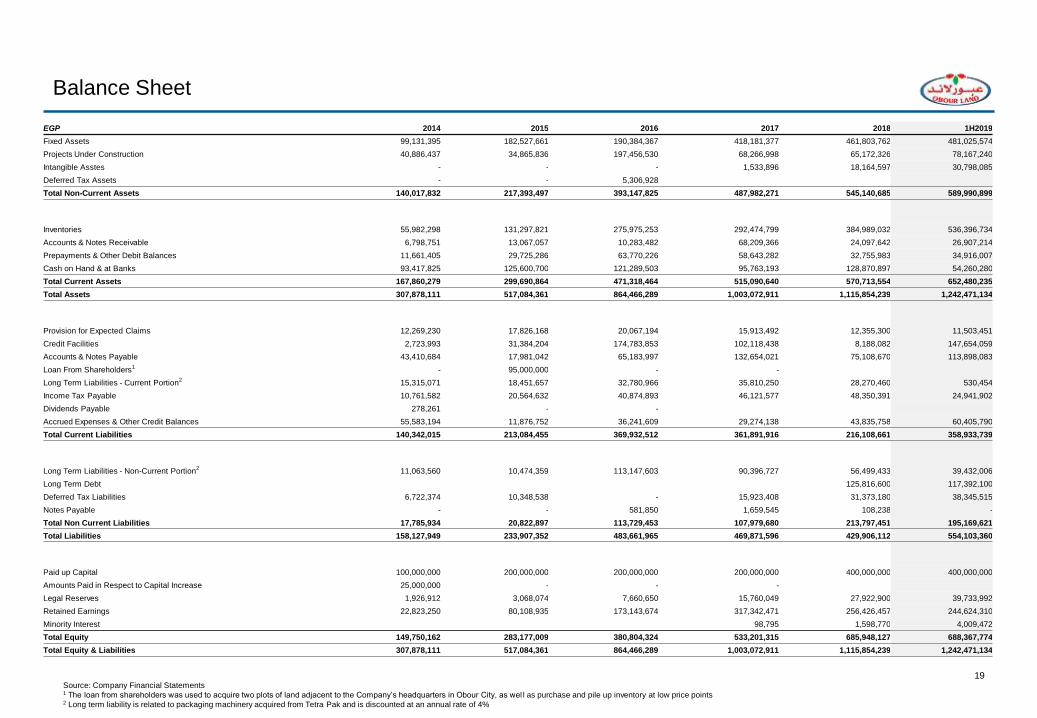
Balance Sheet
Source: Company Financial Statements1 The loan from shareholders was used to acquire two plots of land adjacent to the Company’s headquarters in Obour City, as wel l as purchase and pile up inventory at low price points2 Long term liability is related to packaging machinery acquired from Tetra Pak and is discounted at an annual rate of 4%
EGP 2014 2015 2016 2017 2018 1H2019
Fixed Assets 99,131,395 182,527,661 190,384,367 418,181,377 461,803,762 481,025,574
Projects Under Construction 40,886,437 34,865,836 197,456,530 68,266,998 65,172,326 78,167,240
Intangible Asstes - - - 1,533,896 18,164,597 30,798,085
Deferred Tax Assets - - 5,306,928
Total Non-Current Assets 140,017,832 217,393,497 393,147,825 487,982,271 545,140,685 589,990,899
Inventories 55,982,298 131,297,821 275,975,253 292,474,799 384,989,032 536,396,734
Accounts & Notes Receivable 6,798,751 13,067,057 10,283,482 68,209,366 24,097,642 26,907,214
Prepayments & Other Debit Balances 11,661,405 29,725,286 63,770,226 58,643,282 32,755,983 34,916,007
Cash on Hand & at Banks 93,417,825 125,600,700 121,289,503 95,763,193 128,870,897 54,260,280
Total Current Assets 167,860,279 299,690,864 471,318,464 515,090,640 570,713,554 652,480,235
Total Assets 307,878,111 517,084,361 864,466,289 1,003,072,911 1,115,854,239 1,242,471,134
Provision for Expected Claims 12,269,230 17,826,168 20,067,194 15,913,492 12,355,300 11,503,451
Credit Facilities 2,723,993 31,384,204 174,783,853 102,118,438 8,188,082 147,654,059
Accounts & Notes Payable 43,410,684 17,981,042 65,183,997 132,654,021 75,108,670 113,898,083
Loan From Shareholders1
- 95,000,000 - -
Long Term Liabilities - Current Portion2
15,315,071 18,451,657 32,780,966 35,810,250 28,270,460 530,454
Income Tax Payable 10,761,582 20,564,632 40,874,893 46,121,577 48,350,391 24,941,902
Dividends Payable 278,261 - -
Accrued Expenses & Other Credit Balances 55,583,194 11,876,752 36,241,609 29,274,138 43,835,758 60,405,790
Total Current Liabilities 140,342,015 213,084,455 369,932,512 361,891,916 216,108,661 358,933,739
Long Term Liabilities - Non-Current Portion2
11,063,560 10,474,359 113,147,603 90,396,727 56,499,433 39,432,006
Long Term Debt 125,816,600 117,392,100
Deferred Tax Liabilities 6,722,374 10,348,538 - 15,923,408 31,373,180 38,345,515
Notes Payable - - 581,850 1,659,545 108,238 -
Total Non Current Liabilities 17,785,934 20,822,897 113,729,453 107,979,680 213,797,451 195,169,621
Total Liabilities 158,127,949 233,907,352 483,661,965 469,871,596 429,906,112 554,103,360
Paid up Capital 100,000,000 200,000,000 200,000,000 200,000,000 400,000,000 400,000,000
Amounts Paid in Respect to Capital Increase 25,000,000 - - -
Legal Reserves 1,926,912 3,068,074 7,660,650 15,760,049 27,922,900 39,733,992
Retained Earnings 22,823,250 80,108,935 173,143,674 317,342,471 256,426,457 244,624,310
Minority Interest 98,795 1,598,770 4,009,472
Total Equity 149,750,162 283,177,009 380,804,324 533,201,315 685,948,127 688,367,774
Total Equity & Liabilities 307,878,111 517,084,361 864,466,289 1,003,072,911 1,115,854,239 1,242,471,134