Embed Size (px)
Citation preview
5/3/19
1
Dynamic Model Outcomes for Policy and Market Scenarios
Chuck NicholsonCornell University
(The one in Tanzania)
National Workshop for Dairy Economists and Policy Analysts
April 30, 2019Grand Rapids, MI
Objectives of the Presentation
Describe Dynamic Global Dairy Supply Chain Model Assess Current Issues with the Model:• Impacts of Dairy Margin Coverage• Impacts of Proposed Supply Management
Programs• Impacts of Exports on Milk Prices
5/3/19
2
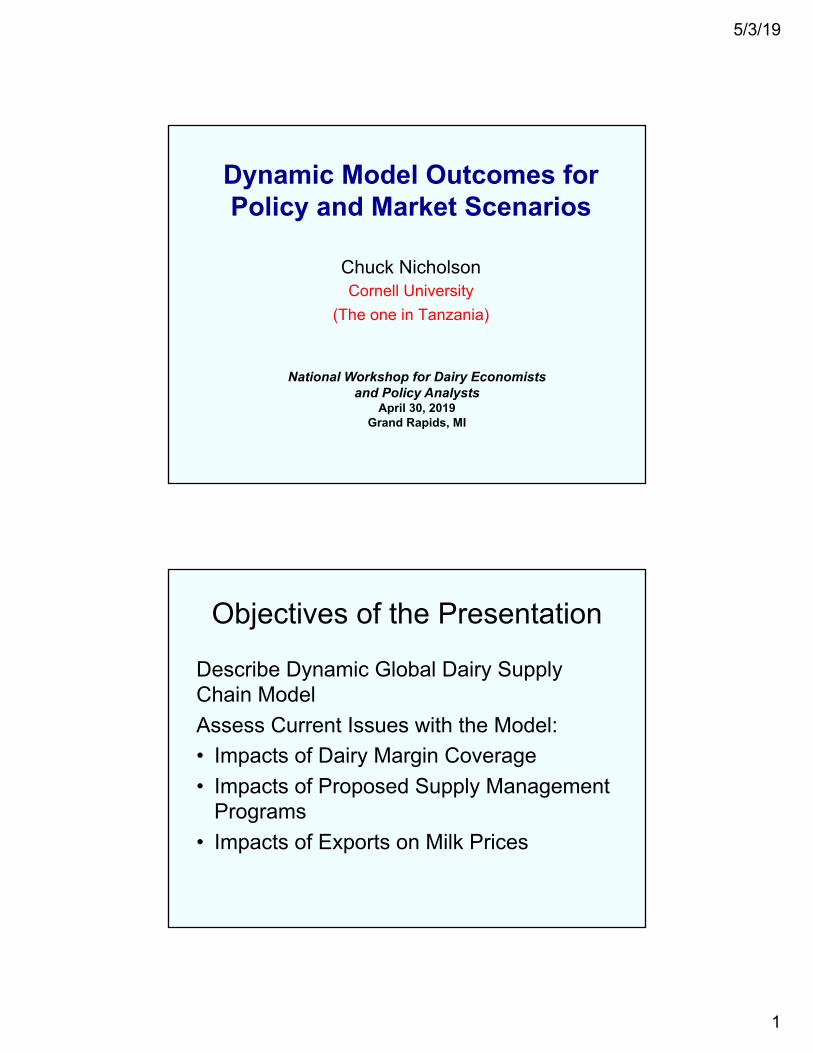
What Can Models Tell Us?
• Explain past developments• Predict ranges of future outcomes
The Model
Current Modeling Approaches*
• GTAP– General equilibrium model– Limited commodity coverage
• FAPRI-MU International Dairy Model– Partial equilibrium dynamic model
• Virginia Tech – Center for Agricultural Trade – Partial equilibrium, MCP formulation
* Academic models. Other commercial and proprietary models exist.
The Model
5/3/19
3
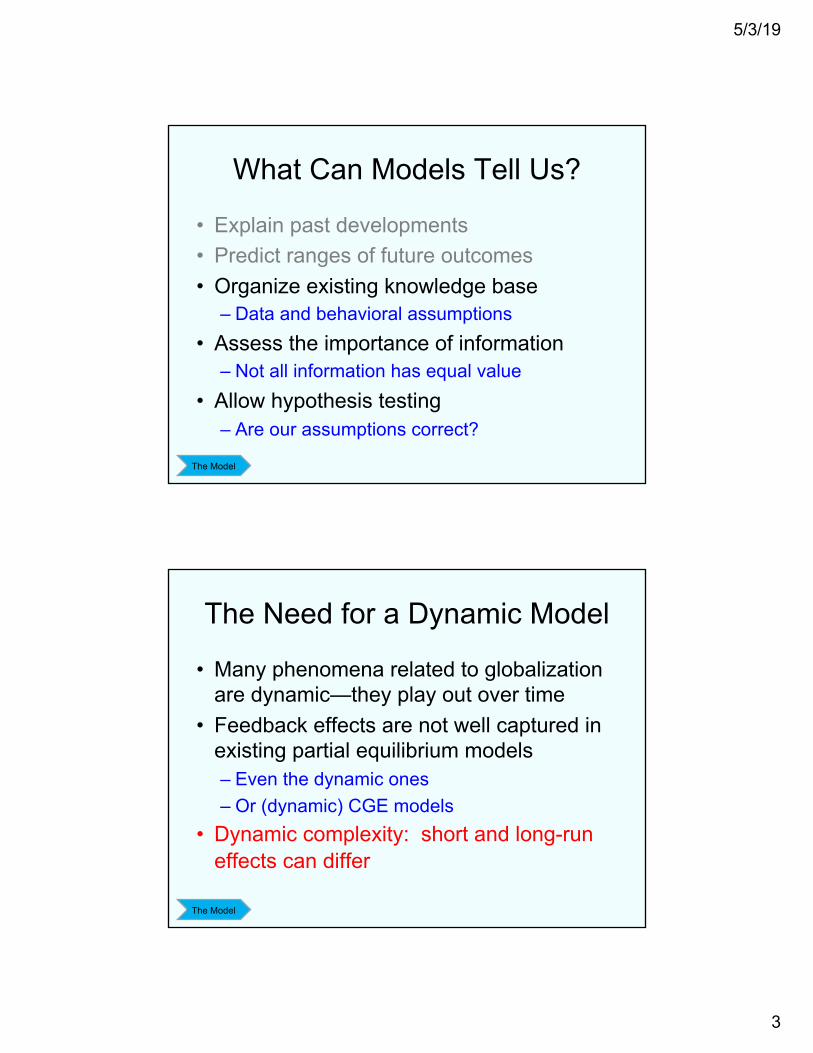
What Can Models Tell Us?
• Explain past developments• Predict ranges of future outcomes• Organize existing knowledge base
– Data and behavioral assumptions• Assess the importance of information
– Not all information has equal value• Allow hypothesis testing
– Are our assumptions correct?
The Model
The Need for a Dynamic Model
• Many phenomena related to globalization are dynamic—they play out over time
• Feedback effects are not well captured in existing partial equilibrium models– Even the dynamic ones– Or (dynamic) CGE models
• Dynamic complexity: short and long-run effects can differ
The Model
5/3/19
4
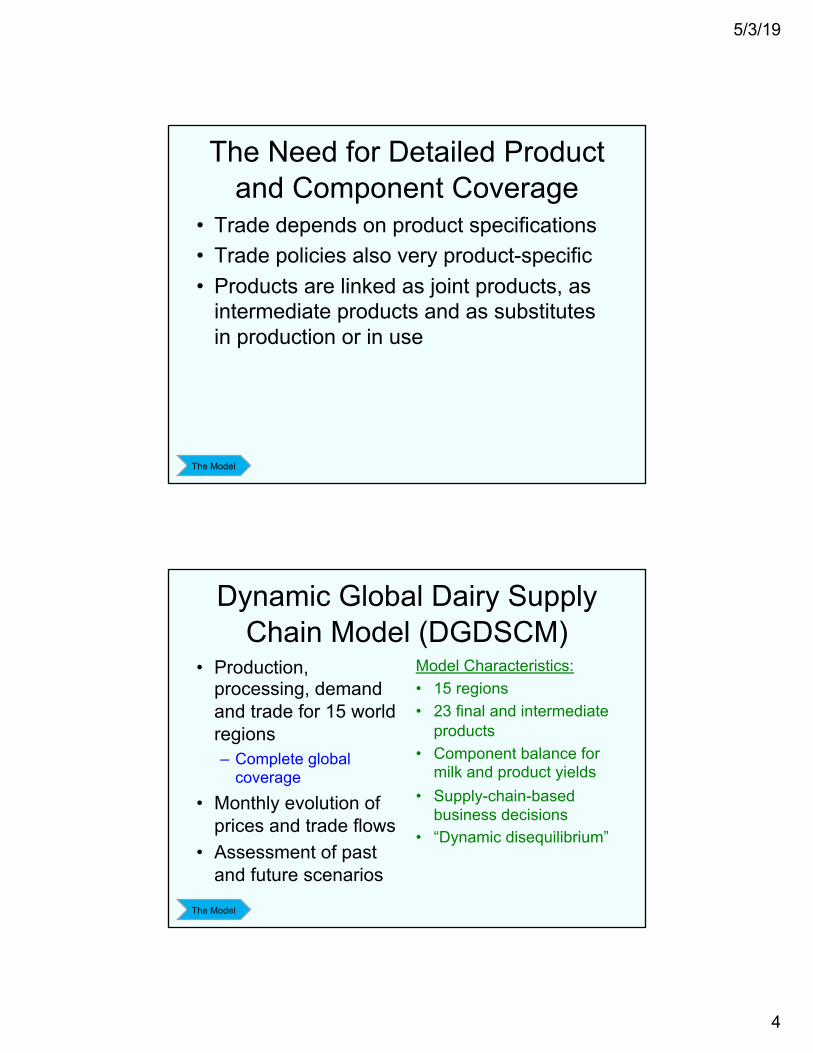
The Need for Detailed Product and Component Coverage
• Trade depends on product specifications• Trade policies also very product-specific• Products are linked as joint products, as
intermediate products and as substitutes in production or in use
The Model
Dynamic Global Dairy Supply Chain Model (DGDSCM)
• Production, processing, demand and trade for 15 world regions– Complete global
coverage• Monthly evolution of
prices and trade flows• Assessment of past
and future scenarios
Model Characteristics:• 15 regions• 23 final and intermediate
products• Component balance for
milk and product yields• Supply-chain-based
business decisions• “Dynamic disequilibrium”
The Model
5/3/19
5
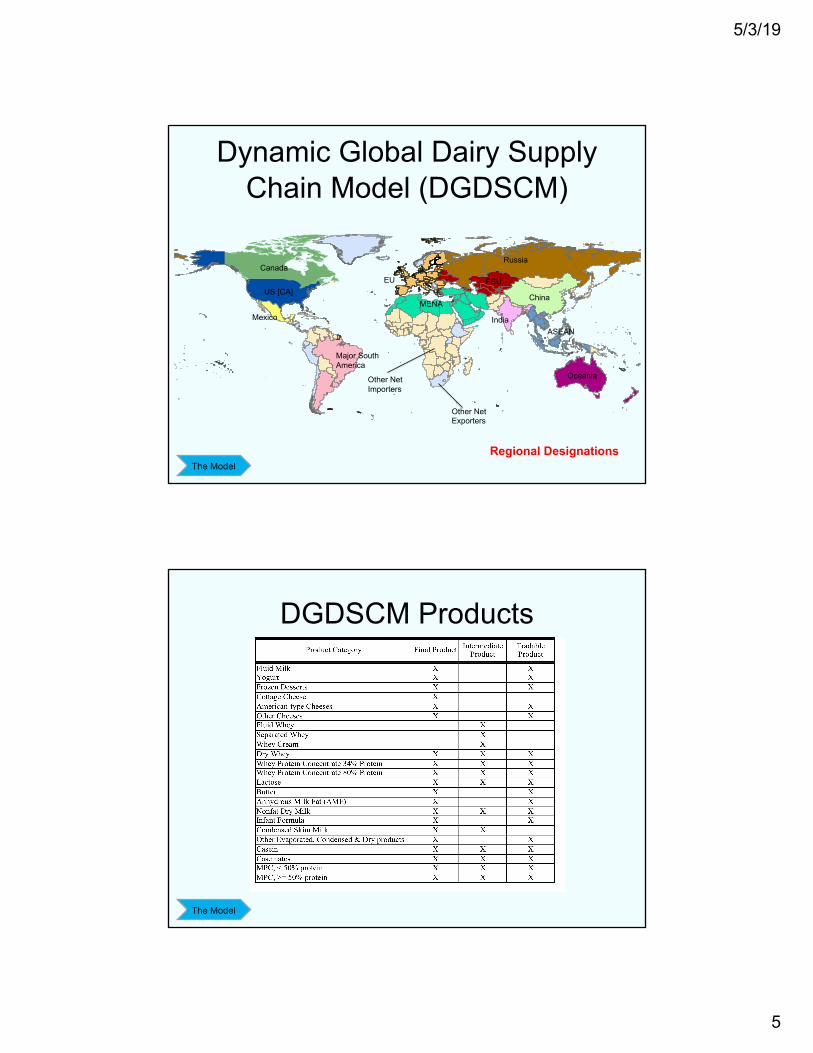
Dynamic Global Dairy Supply Chain Model (DGDSCM)
Regional Designations
US [CA]
Mexico
Canada
MENA
EU
Russia
FSU
China
Oceania
Major SouthAmerica
IndiaASEAN
Other Net Exporters
Other Net Importers
The Model
DGDSCM Products
The Model

5/3/19
6
DGDSCM DynamicsFarm Level:• Profitability and
expectations drive cow numbers and milk per cow
• Asymmetric response to profitability changes– Less responsive to
downturns• Milk price derived from
product prices
Processing Sector:• Production volumes
driven by profitability and demand– NDM and butter are
residual products• Price-setting based on
inventory coverage– Product stocks
The Model
DGDSCM DynamicsProduct Demand:• Base levels of final use
“commercial disappearance”
• Final demand based on assumed annual growth rates and prices
• Intermediate product demand endogenously determined– Costs of selected feasible
combinations
Trade Flows:• Based on previously
observed levels• Changes driven by
changes in relative landed prices– Including transportation
costs and exchange rate factors
• Base levels updated over time by recent experience– “Anchoring and adjustment”
The Model
5/3/19
7
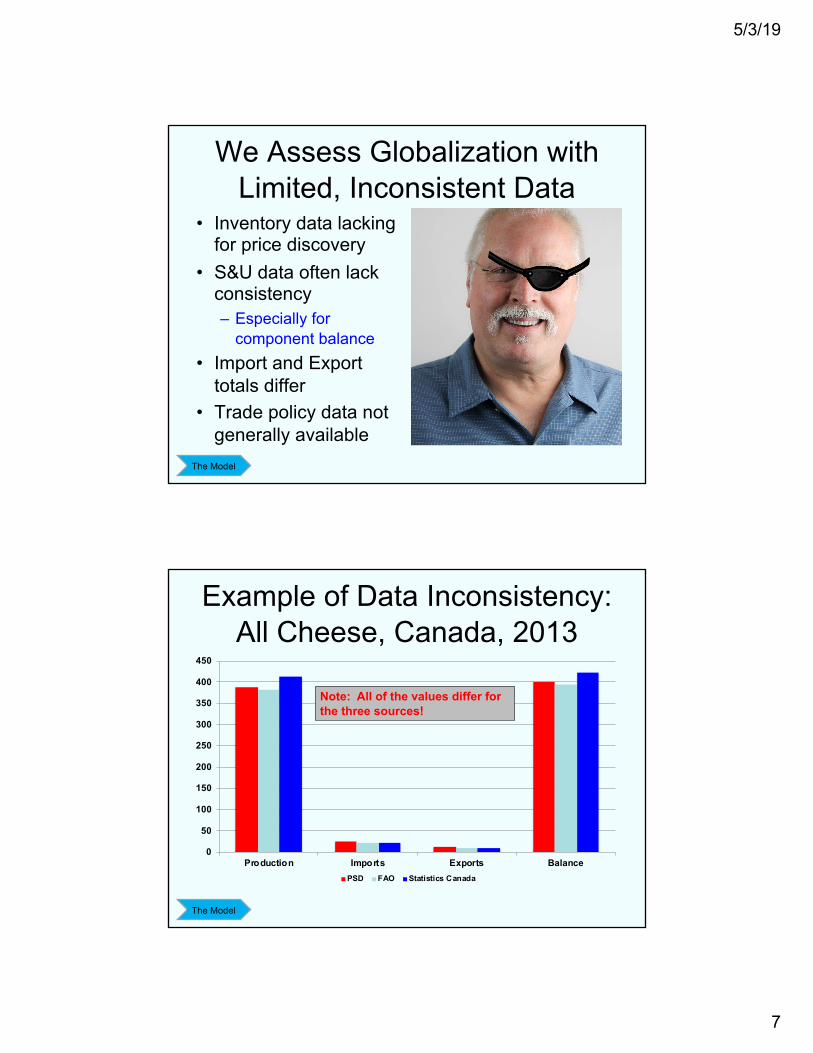
We Assess Globalization with Limited, Inconsistent Data
• Inventory data lacking for price discovery
• S&U data often lack consistency– Especially for
component balance• Import and Export
totals differ• Trade policy data not
generally availableThe Model
Example of Data Inconsistency: All Cheese, Canada, 2013
0
50
100
150
200
250
300
350
400
450
Production Imports Exports BalancePSD FAO Statistics Canada
Note: All of the values differ for the three sources!
The Model
5/3/19
8
Major Effort for Data for Dynamic Model
• Multiple inconsistent sources
• Incomplete sources• Aggregation
– Trade policies differ within regions
• Model calibration and evaluation
GRRR….
“Blood, toil, tears and sweat…”-- Churchill (and Stephenson)
The Model
Other (Omitted) Factors
Factors other than (landed) price determine dairy trade flows--now and later• Working relationships, trust, reputation,
joint ventures• Product characteristics not captured in
trade data• Flows of information and funds
(investment) will alter the trade landscape
The Model

5/3/19
9
Model Performance: Milk Price
The Model
DRAFT 4 February 2019 Preliminary Results for Discussion Not for Distribution or Citation
28
discussion of their implementation in the U.S. dairy supply chain model. An additional comment regarding sensitivity analysis is appropriate here. A common feature of feedback-rich models such as SD models is that relatively few feedback loops determine system behavior. That is, a small number of feedback loops demonstrate “feedback loop dominance”, which can be evaluated using methods such as those in Olivia (2014). This characteristic suggests that only parametric values contained within dominant feedback loops have the potential to effect large-magnitude changes in the numerical or behavioral results of the model. Thus, it is not surprising that our model is not sensitive to many of the parameter values other than those related to the dominant feedback processes (which appear to be those for milk supply). This result also suggests that not all information (or assumptions) have equal weight in determining system outcomes, so model behavior often is not strongly influenced by most of the parameters assumed in a dynamic model. We find that to be the case for our model of the U.S. dairy supply chain. The behavioral pattern and values of the US All-milk price was reasonably well captured by the model (Figure 3), particularly from 2015 to 2018. The average percentage difference between the model all-milk values and the actual values during 2013 to 2018 was 8.2%, which compares favorably to forecasting performance for many supply chains (which often experience values of 30% or more). For 2015 to 2018, the average percentage difference was better—4.9%--and the average difference between the actual and model-predicted price was $0.83/cwt. In addition, the model captures the basic pattern (but not the duration) of high prices in 2014, and lower but oscillating prices after that year. Given that the model base year is 2013, this is quite good forecasting of monthly prices over a six-year time horizon.
Figure A1. Comparison of Model-Simulated and Actual Farm Milk Prices, 2013 to 2018
All Milk Actual Model30
25
20
15
102013-02 2013-07 2013-12 2014-05 2014-10 2015-03 2015-08 2016-01 2016-06 2016-11 2017-04 2017-09 2018-02 2018-07 2018-12 2019-05 2019-10 2020-03 2020-08 2021-01
Date
$/cw
t
US All Milk Price : Baseline "Actual All-Milk Price" : Baseline
Assessing DMC
Objectives:Assess the impact of the new DMC compared to continuation of MPP-Dairy• All-milk price• Net farm operating income• Government costs• Exports
The Model DMC
5/3/19
10
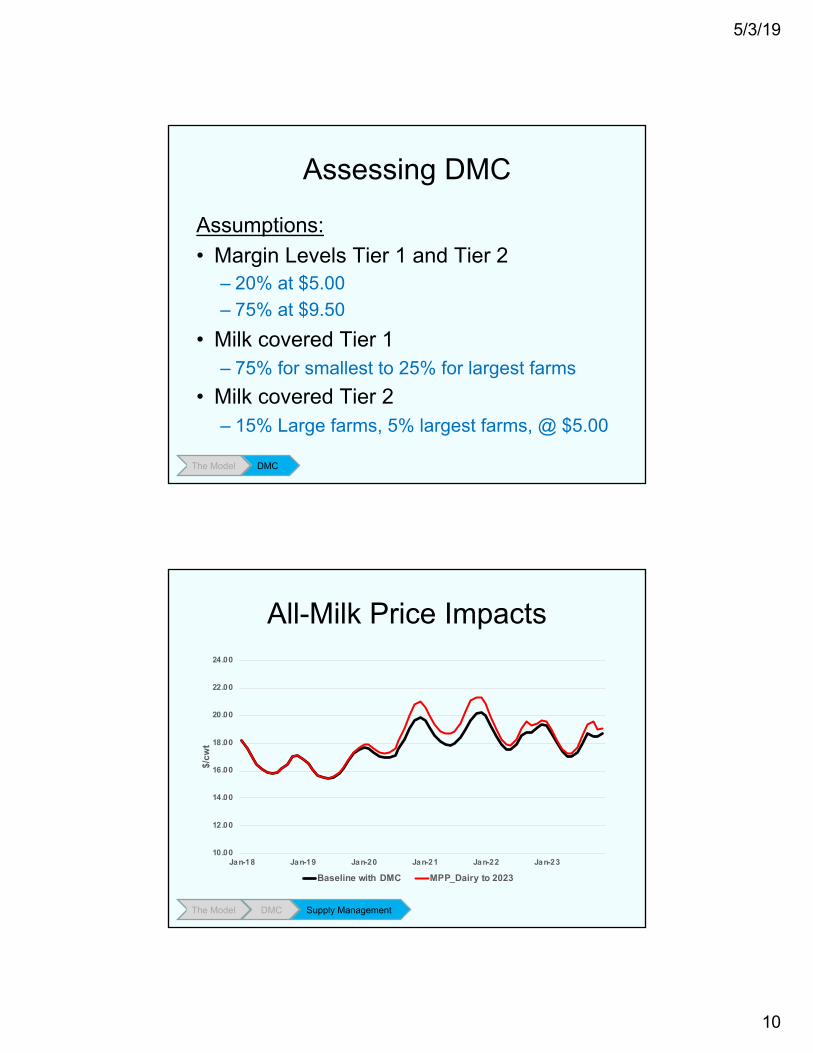
Assessing DMC
Assumptions:• Margin Levels Tier 1 and Tier 2
– 20% at $5.00– 75% at $9.50
• Milk covered Tier 1– 75% for smallest to 25% for largest farms
• Milk covered Tier 2– 15% Large farms, 5% largest farms, @ $5.00
The Model DMC
All-Milk Price Impacts
10.00
12.00
14.00
16.00
18.00
20.00
22.00
24.00
Jan-18 Jan-19 Jan-20 Jan-21 Jan-22 Jan-23
$/cw
t
Baseline with DMC MPP_Dairy to 2023
The Model DMC Supply Management
5/3/19
11
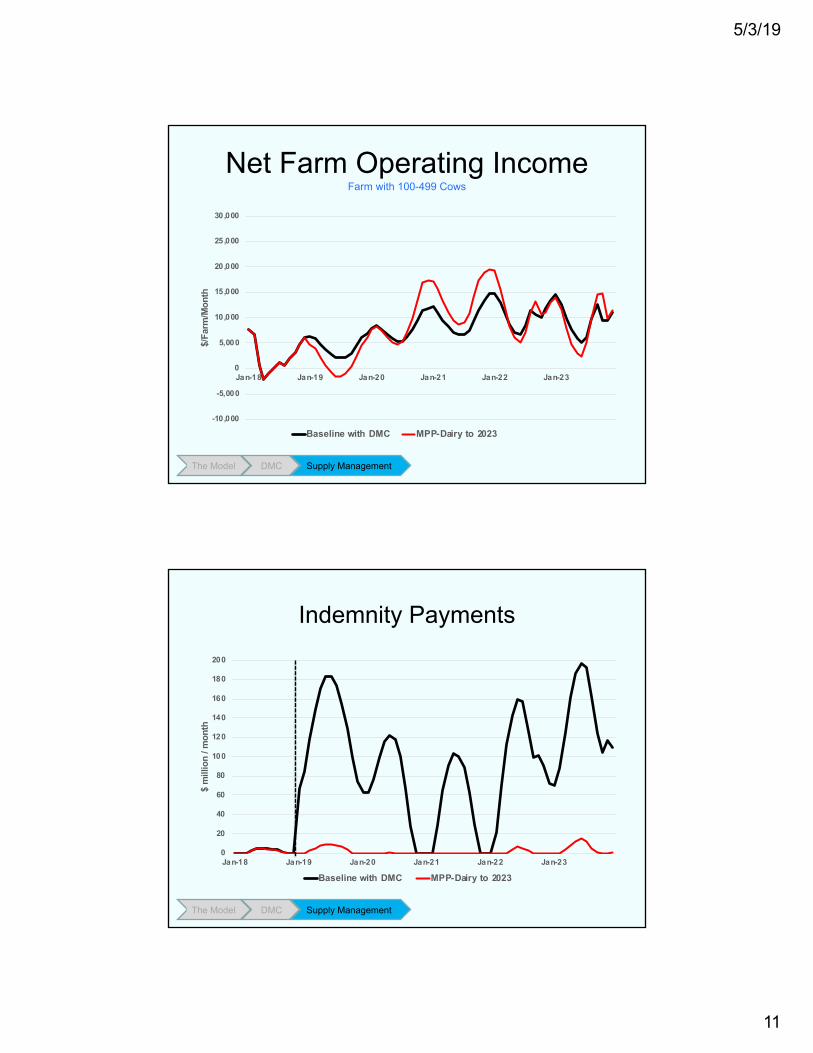
Net Farm Operating IncomeFarm with 100-499 Cows
-10,000
-5,000
0
5,000
10,000
15,000
20,000
25,000
30,000
Jan-18 Jan-19 Jan-20 Jan-21 Jan-22 Jan-23
$/Fa
rm/M
onth
Baseline with DMC MPP-Dairy to 2023
The Model DMC Supply Management
Indemnity Payments
0
20
40
60
80
100
120
140
160
180
200
Jan-18 Jan-19 Jan-20 Jan-21 Jan-22 Jan-23
$ m
illio
n / m
onth
Baseline with DMC MPP-Dairy to 2023
The Model DMC Supply Management

5/3/19
12
Total Export Value
0
200
400
600
800
1,000
1,200
1,400
Jan-18 Jan-19 Jan-20 Jan-21 Jan-22 Jan-23
$ m
illio
n / m
onth
Baseline with DMC MPP-Dairy to 2023
The Model DMC Supply Management
Summary of DMC
Outcome Baseline with DMC
MPP-Dairy to 2023
Difference compared
to MPPAll milk price, $/cwt 17.95 18.45 -0.50
Net Farm Operating Income, $/farm/year
1-99 cows 53,757 43,035 +10,721
100-499 cows 101,026 107,171 -6,145
500-1999 cows 399,050 451,156 -52,106
2000+ cows 1,413,799 1,595,264 -181,464
Total Government Expenditures, $mil 4,012 -404 +4,416
Annual Average Value of Exports, $bil/year 10.6 10.3 +0.4
The Model DMC Supply Management
$2.4 billion overall reduction in NFOI 2019 through 2023

5/3/19
13
Assessing Supply Management
Objective:Evaluate the impact of supply management programs with allowable annual growth and a “market access fee”• Continuous operation (constant values)• Determined by Milk:Feed price ratio
The Model DMC Supply Management
All-Milk Price and MarginsSince 2000
0.00
5.00
10.00
15.00
20.00
25.00
30.00
Jan-00 Jan-02 Jan-04 Jan-06 Jan-08 Jan-10 Jan-12 Jan-14 Jan-16 Jan-18
All-Milk Margin Over Feed
Variation in Milk and Feed Prices has been large since 2000
The Model DMC Supply Management
5/3/19
14
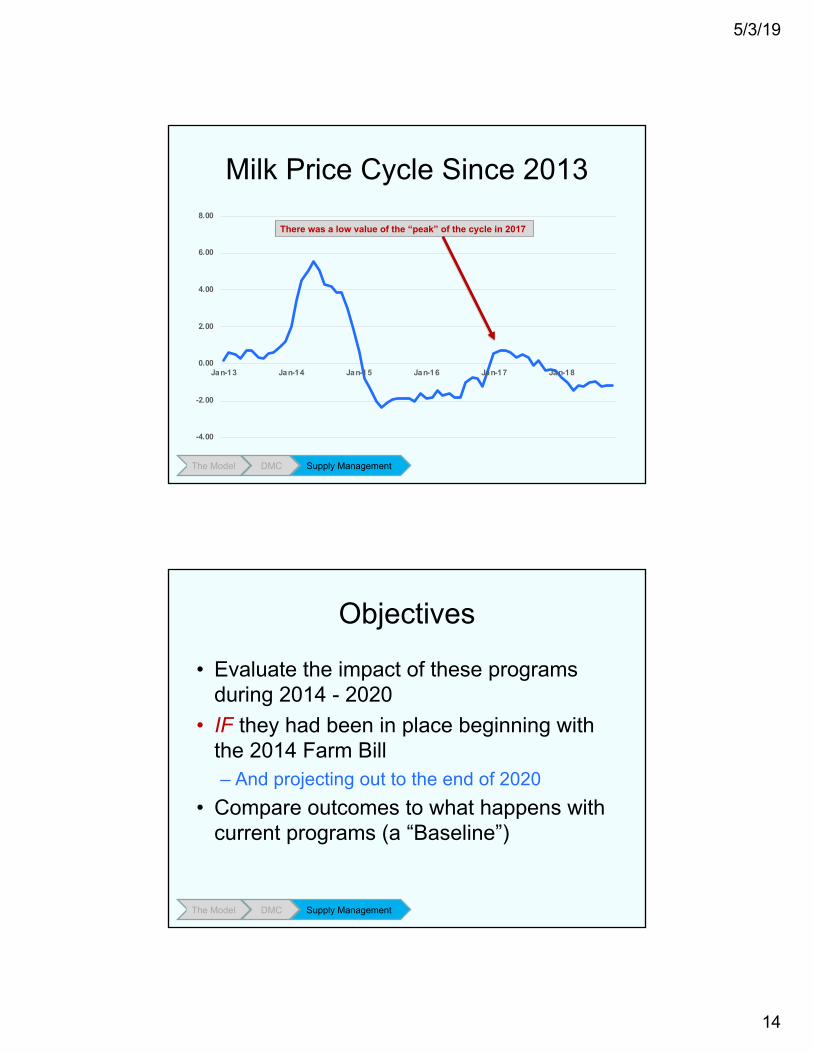
Milk Price Cycle Since 2013
-4.00
-2.00
0.00
2.00
4.00
6.00
8.00
Jan-13 Jan-14 Jan-15 Jan-16 Jan-17 Jan-18
There was a low value of the “peak” of the cycle in 2017
The Model DMC Supply Management
Objectives
• Evaluate the impact of these programs during 2014 - 2020
• IF they had been in place beginning with the 2014 Farm Bill– And projecting out to the end of 2020
• Compare outcomes to what happens with current programs (a “Baseline”)
The Model DMC Supply Management

5/3/19
15
Program Implementation Choices
For the program with market access fees:• Continuous or triggered by milk:feed price
ratio?• Constant or values that vary with milk:feed
price ratio?• Access fees and allowable growth• Differences by farm size?
The Model DMC Supply Management
DRAFT 24 February 2019
5
growth of 1% per year but would charge larger market access fees for farms exceeding that growth with more than 500 cows (Table 1).
Table 1. Assumed Allowable Annual Growth in Milk Production and Market Access Fees by Farm Size for Two Programs with Continuous Operation
Assumption Continuous MAF 1
Continuous MAF 2
Allowable growth, %/year 1% 1%
Market Access Fee, $/cwt
1-99 cows 0.25 0.25
100-499 cows 0.50 0.50
500-1999 cows 0.75 2.00
2000+ cows 1.00 3.00
The legislation proposed by Costa and Sanders in 2009 linked the allowable annual growth and the market access fee to value of the milk-feed price ratio with specific schedules (rather than fixed values in the Holstein Association proposal). The intention of this linkage was to make the program more responsive to changing market conditions, that is, allowing more growth and lowering market access fees when the milk-feed price ratio was high (above 2 in their original proposal), and being more restrictive when the milk-feed price ratio was low. We evaluated the initial schedule (Figure 1) proposed by Costa and Sanders and determined that a program using it would have very limited impacts in the market environment that characterized the period since 2014. This is because the milk feed price ratio was often above the threshold value of 2, which thus would have allowed 3% annual growth and low market access fees during the period 2014 to 2018. As a result, for two scenarios implementing this program we modified the schedules linking the milk-feed price ratio to the allowable growth and market access fees to be more consistent with market conditions observed in the past five years (Table 2). The schedules used a milk-feed price ratio of 2.5 rather than 2 as a “neutral” (no growth) threshold and specified market access that differed by farm size.
DRAFT 24 February 2019
6
Table 2. Assumed Allowable Annual Growth in Milk Production and Market Access Fees by Farm Size for Two Programs Conditioned on the Milk:Feed Price Ratio
Assumption Non-Continuous MAF 1
Non-Continuous MAF 2
Allowable growth, %/year
Milk:Feed Price Ratio < 1.75 -3% -3%
Milk:Feed Price Ratio > 1.75 & < 2.5 0% 0%
Milk:Feed Price Ratio > 2.5 +3% +3%
Market Access Fee, $/cwt
Milk:Feed Price Ratio < 2.5
1-99 cows 0.25 0.25
100-499 cows 0.50 0.50
500-1999 cows 0.75 2.00
2000+ cows 1.00 3.00
Milk:Feed Price Ratio > 2.5 & < 3.0
1-99 cows 0.065 0.065
100-499 cows 0.13 0.13
500-1999 cows 0.195 0.52
2000+ cows 0.26 0.78
Milk:Feed Price Ratio > 3.0
1-99 cows 0.015 0.015
100-499 cows 0.03 0.03
500-1999 cows 0.045 0.12
2000+ cows 0.06 0.18
The Model DMC Supply Management
Conditioned on Milk:FeedContinuous Program
5/3/19
16
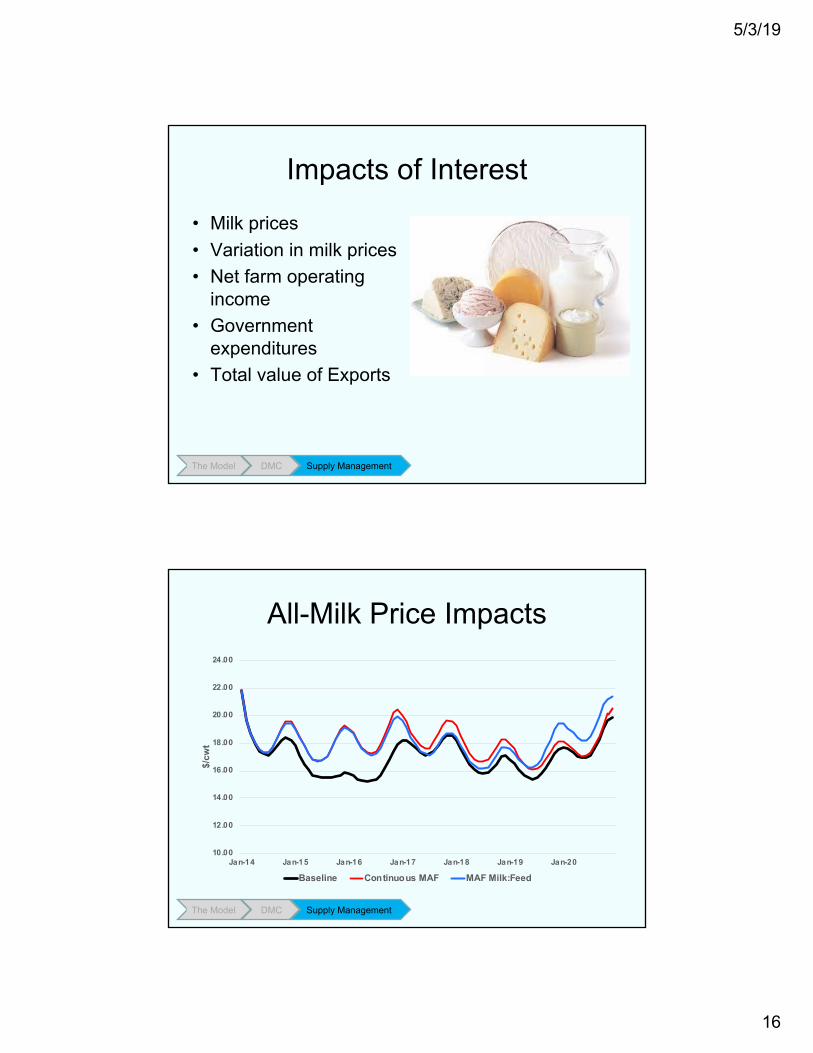
Impacts of Interest
• Milk prices• Variation in milk prices• Net farm operating
income• Government
expenditures• Total value of Exports
The Model DMC Supply Management
All-Milk Price Impacts
10.00
12.00
14.00
16.00
18.00
20.00
22.00
24.00
Jan-14 Jan-15 Jan-16 Jan-17 Jan-18 Jan-19 Jan-20
$/cw
t
Baseline Continuous MAF MAF Milk:Feed
The Model DMC Supply Management

5/3/19
17
Price Deviation Impacts
0.00
0.10
0.20
0.30
0.40
0.50
0.60
0.70
0.80
0.90
1.00
2014-
01
2014-
07
2015-
01
2015-
07
2016-
01
2016-
07
2017-
01
2017-
07
2018-
01
2018-
07
2019-
01
2019-
07
2020-
01
2020-
07
2021-
01
$/cw
t
Baseline Continuous MAF MAF Milk:Feed
The Model DMC Supply Management
Net Farm Operating IncomeFarm with 100-499 Cows
-10,000
-5,000
0
5,000
10,000
15,000
20,000
25,000
30,000
Jan-14 Jan-15 Jan-16 Jan-17 Jan-18 Jan-19 Jan-20
$/Fa
rm/M
onth
Baseline Continuous MAF MAF Milk:Feed
The Model DMC Supply Management
5/3/19
18
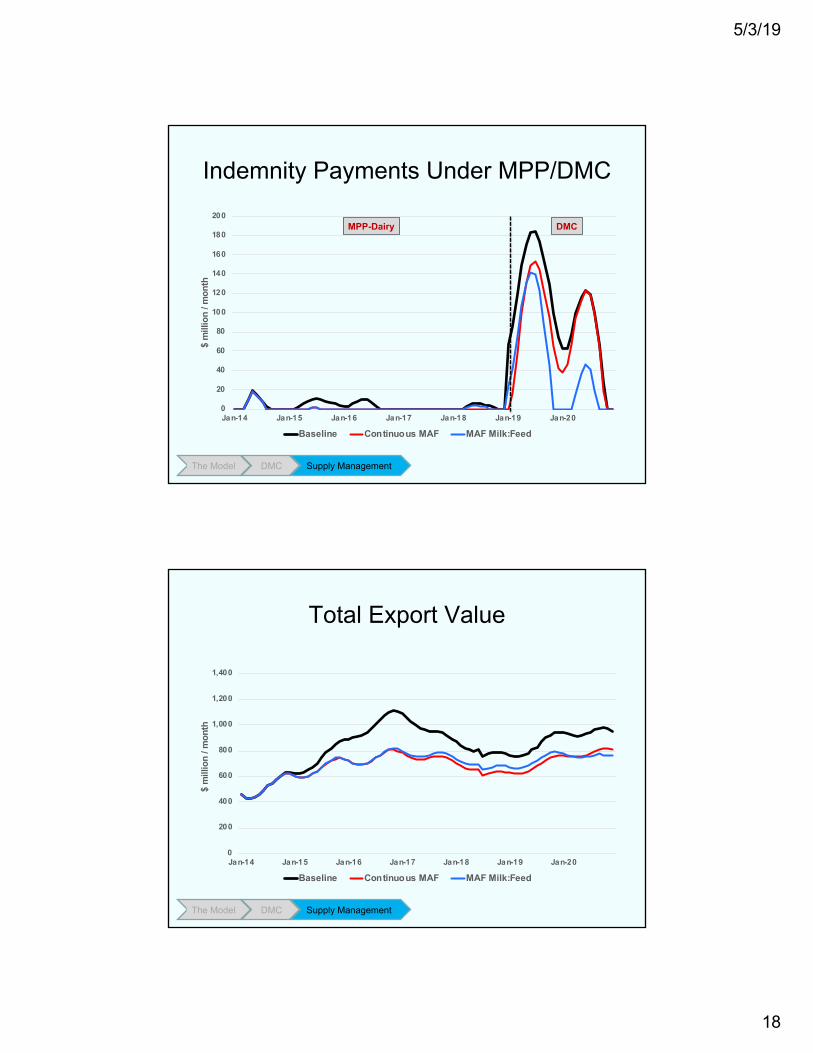
Indemnity Payments Under MPP/DMC
0
20
40
60
80
100
120
140
160
180
200
Jan-14 Jan-15 Jan-16 Jan-17 Jan-18 Jan-19 Jan-20
$ m
illio
n / m
onth
Baseline Continuous MAF MAF Milk:Feed
MPP-Dairy DMC
The Model DMC Supply Management
Total Export Value
0
200
400
600
800
1,000
1,200
1,400
Jan-14 Jan-15 Jan-16 Jan-17 Jan-18 Jan-19 Jan-20
$ m
illio
n / m
onth
Baseline Continuous MAF MAF Milk:Feed
The Model DMC Supply Management
5/3/19
19
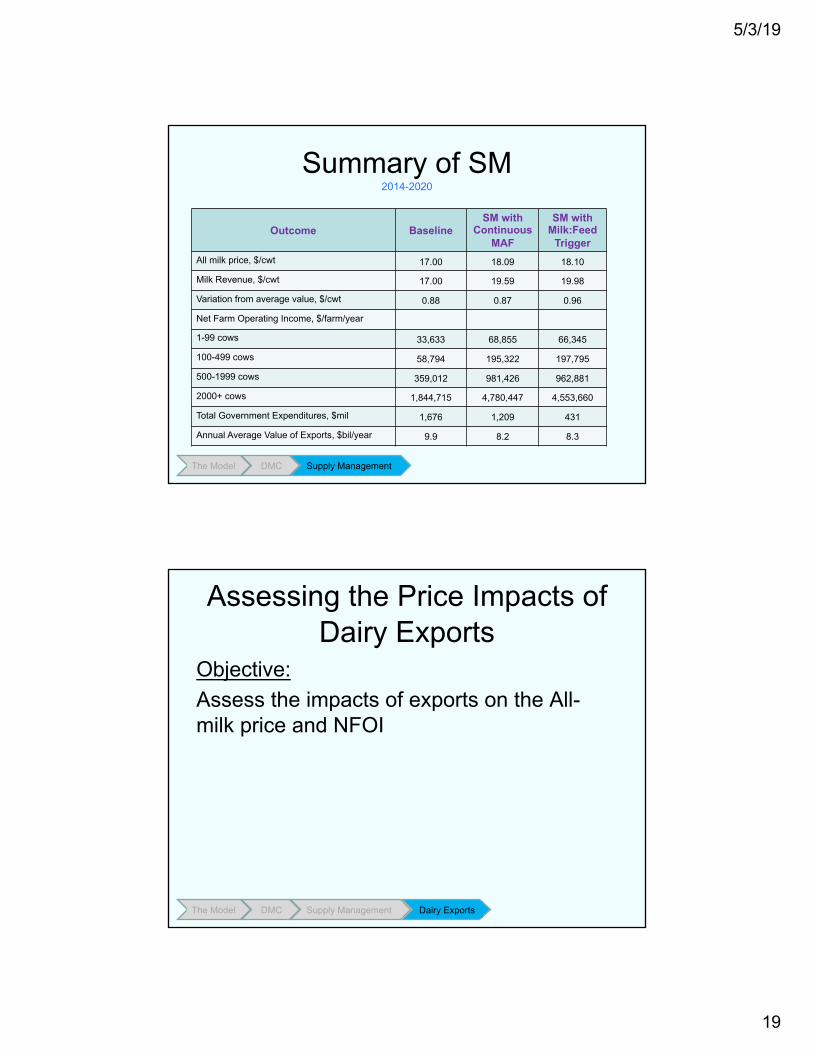
Summary of SM2014-2020
Outcome BaselineSM with
Continuous MAF
SM withMilk:Feed
Trigger All milk price, $/cwt 17.00 18.09 18.10
Milk Revenue, $/cwt 17.00 19.59 19.98
Variation from average value, $/cwt 0.88 0.87 0.96
Net Farm Operating Income, $/farm/year
1-99 cows 33,633 68,855 66,345
100-499 cows 58,794 195,322 197,795
500-1999 cows 359,012 981,426 962,881
2000+ cows 1,844,715 4,780,447 4,553,660
Total Government Expenditures, $mil 1,676 1,209 431
Annual Average Value of Exports, $bil/year 9.9 8.2 8.3
The Model DMC Supply Management
Assessing the Price Impacts of Dairy Exports
Objective:Assess the impacts of exports on the All-milk price and NFOI
The Model DMC Supply Management Dairy Exports
5/3/19
20
The Model DMC Supply Management Dairy Exports
1
Information Letter Series
The Impact of US Dairy Component Exports on the All-Milk Price
Information Letter 19-01 March 2019
Charles Nicholson Dyson School of Applied Economics and Management, Cornell University
The impact of the dairy components exported on the All-milk price is positive, but likely only about $0.10/cwt for each additional 1% of components produced that are exported. The likely reason for this relatively small price impact is that as component exports have grown, milk supply growth has maintained an approximate supply-demand balance.
Introduction
It seems to have become an article of faith that US dairy product exports have a large impact on farm milk prices. This is reflected in the attention paid to export data, ongoing trade negotiations or disputes (for example with China, Mexico, Japan), and the reaction of the futures markets when the trade dispute with China arose in 2018. The value of exports is often discussed in terms of the proportion of solids exported—sometimes differentiated between the fat and non-fat solids—but also in terms of the total value of dairy product exports. The pattern of US dairy exports from 2000 to 2018 is similar whether expressed in the total volume of components or the proportion of components in US farm milk that is exported (Figure 1). Both have grown substantially, especially since 2005, and the percentage exported of combined fat and nonfat components has exceeded 15% in recent years. A goal of 20% of total US milk components exported has been promoted by some organizations.
Despite the growth in the importance of exports for the US dairy industry, there has been limited empirical analysis to date of the price impacts of exports. The patterns of behavior over time for the All-milk price and US dairy component exports might suggest that
The Model DMC Supply Management Dairy Exports
7
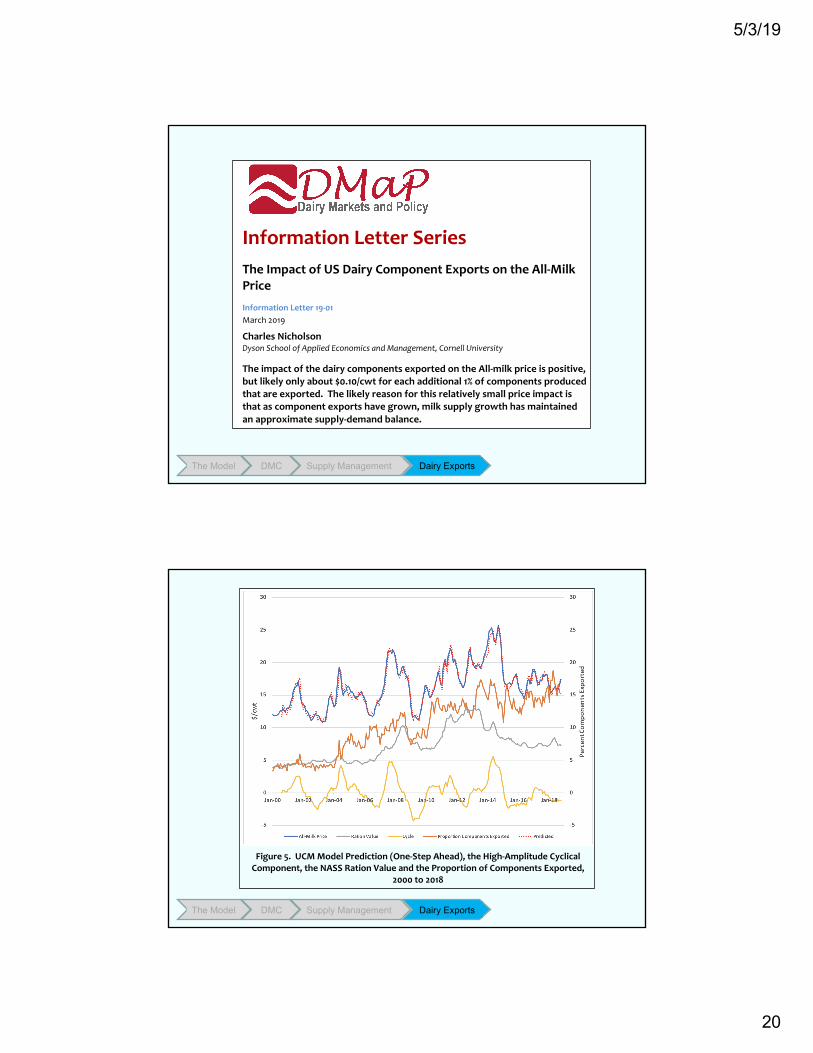
Figure 5. UCM Model Prediction (One-Step Ahead), the High-Amplitude Cyclical
Component, the NASS Ration Value and the Proportion of Components Exported, 2000 to 2018
Why might the price impact of exports be small when estimated with this approach? One explanation is that this analysis focuses on the longer-term, when the impact of steady growth in component exports can be accommodated with growth in milk production. This may maintain an approximate balance between milk supply and demand, mitigating to a large extent impact of the increase in the demand for components for export. Thus, this type of analysis may not be representative of the impacts of sudden large changes in components exported (e.g., rapid decreases in exports to China or Mexico). Large abrupt changes may result in larger impacts because they are more disruptive of the current supply-demand balance for milk. This analysis is thus more useful for the assessment of strategic initiatives to grow dairy exports. Moreover, price may not be the best metric for evaluating the impacts of growing trade. Our analysis of dairy markets with a global dairy supply chain model (Nicholson and Stephenson, 2019) suggests that the price impacts of steadily growing trade will be minimal (and is thus consistent with this econometric analysis) but that aggregated industry revenues and earnings are enhanced as more components are exported.
5/3/19
21
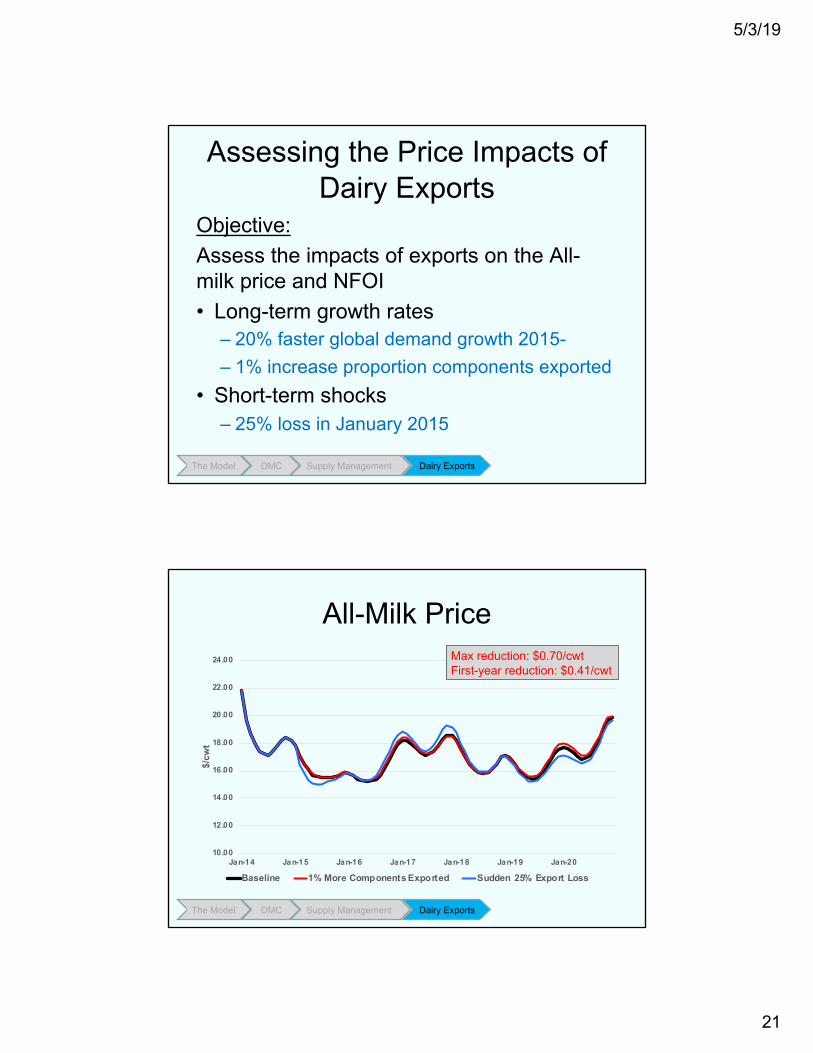
Assessing the Price Impacts of Dairy Exports
Objective:Assess the impacts of exports on the All-milk price and NFOI• Long-term growth rates
– 20% faster global demand growth 2015-– 1% increase proportion components exported
• Short-term shocks– 25% loss in January 2015
The Model DMC Supply Management Dairy Exports
All-Milk Price
10.00
12.00
14.00
16.00
18.00
20.00
22.00
24.00
Jan-14 Jan-15 Jan-16 Jan-17 Jan-18 Jan-19 Jan-20
$/cw
t
Baseline 1% More Components Exported Sudden 25% Export Loss
The Model DMC Supply Management Dairy Exports
Max reduction: $0.70/cwtFirst-year reduction: $0.41/cwt
5/3/19
22
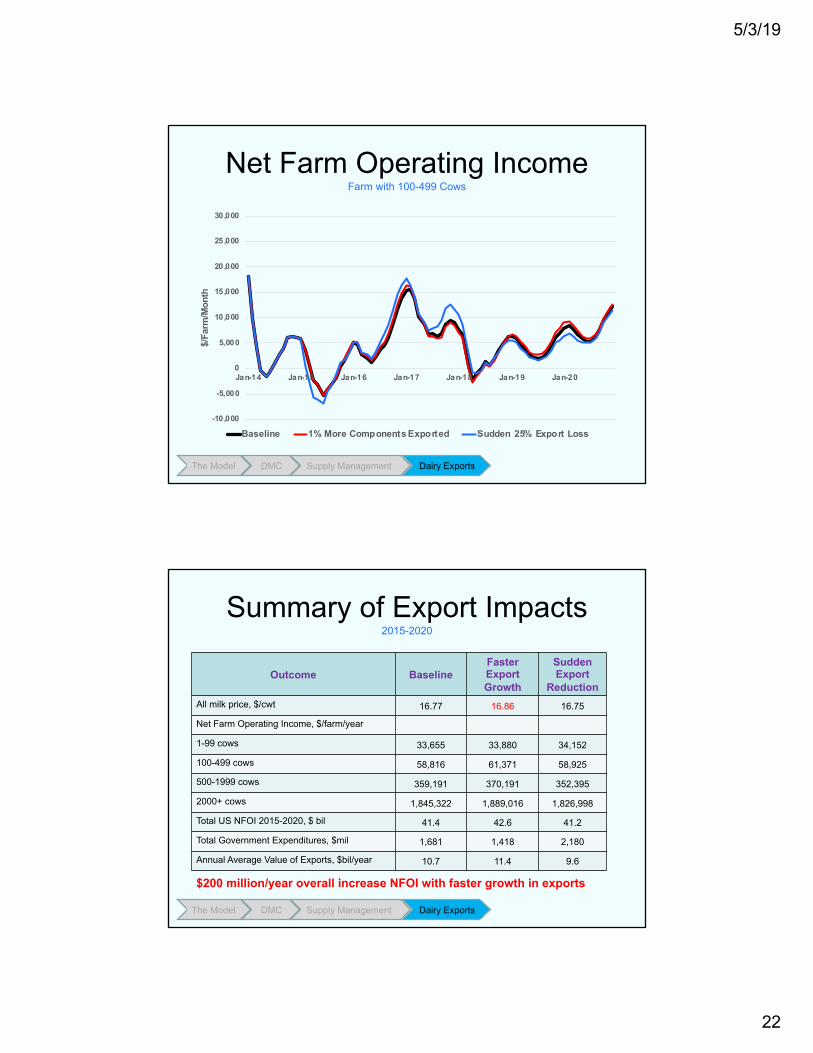
Net Farm Operating IncomeFarm with 100-499 Cows
-10,000
-5,000
0
5,000
10,000
15,000
20,000
25,000
30,000
Jan-14 Jan-15 Jan-16 Jan-17 Jan-18 Jan-19 Jan-20
$/Fa
rm/M
onth
Baseline 1% More Components Exported Sudden 25% Export Loss
The Model DMC Supply Management Dairy Exports
Summary of Export Impacts2015-2020
Outcome BaselineFaster Export Growth
Sudden Export
ReductionAll milk price, $/cwt 16.77 16.86 16.75
Net Farm Operating Income, $/farm/year
1-99 cows 33,655 33,880 34,152
100-499 cows 58,816 61,371 58,925
500-1999 cows 359,191 370,191 352,395
2000+ cows 1,845,322 1,889,016 1,826,998
Total US NFOI 2015-2020, $ bil 41.4 42.6 41.2
Total Government Expenditures, $mil 1,681 1,418 2,180
Annual Average Value of Exports, $bil/year 10.7 11.4 9.6
The Model DMC Supply Management Dairy Exports
$200 million/year overall increase NFOI with faster growth in exports
5/3/19
23
Concluding Comments
Unexpected Outcomes?• DMC lowers NFOI compared to MPP• SM increases prices and NFOI• Exports do not increase prices (much)• Models can complement our thinking,
indicate possible unintended consequences
The Model DMC Supply Management Dairy Exports Conclusions