Embed Size (px)
Citation preview
1
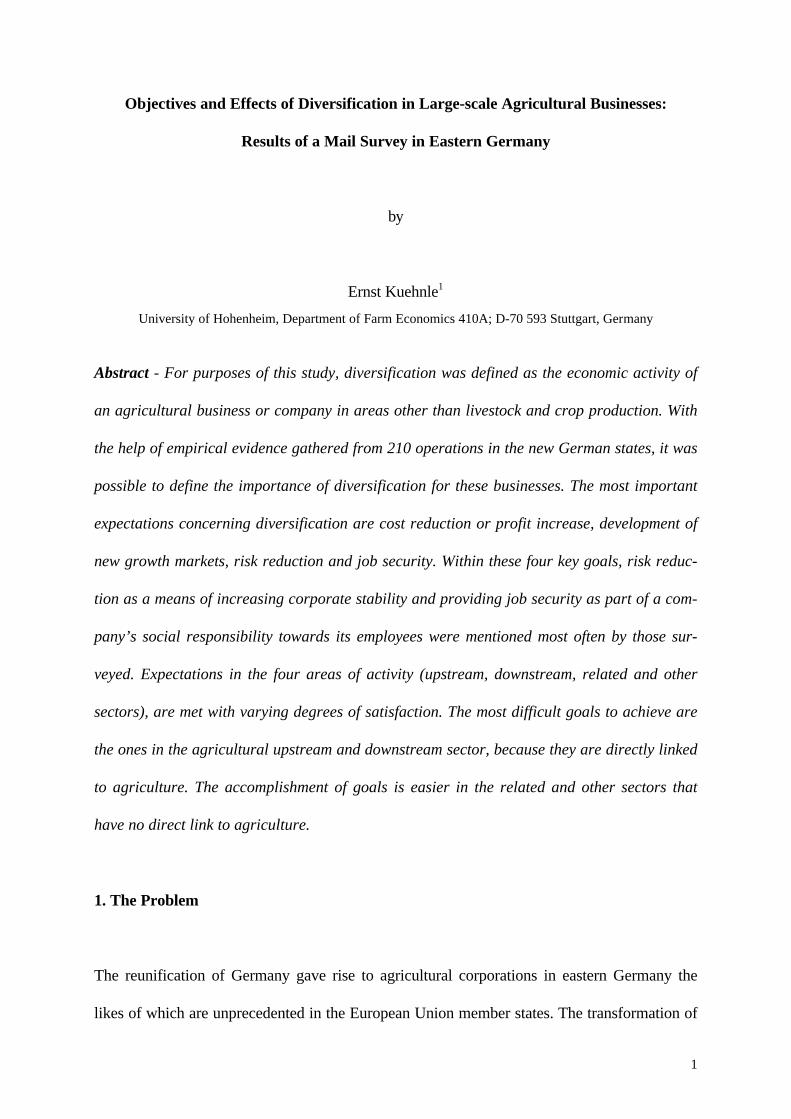
Objectives and Effects of Diversification in Large-scale Agricultural Businesses:
Results of a Mail Survey in Eastern Germany
by
Ernst Kuehnle1
University of Hohenheim, Department of Farm Economics 410A; D-70 593 Stuttgart, Germany
Abstract - For purposes of this study, diversification was defined as the economic activity of
an agricultural business or company in areas other than livestock and crop production. With
the help of empirical evidence gathered from 210 operations in the new German states, it was
possible to define the importance of diversification for these businesses. The most important
expectations concerning diversification are cost reduction or profit increase, development of
new growth markets, risk reduction and job security. Within these four key goals, risk reduc-
tion as a means of increasing corporate stability and providing job security as part of a com-
pany’s social responsibility towards its employees were mentioned most often by those sur-
veyed. Expectations in the four areas of activity (upstream, downstream, related and other
sectors), are met with varying degrees of satisfaction. The most difficult goals to achieve are
the ones in the agricultural upstream and downstream sector, because they are directly linked
to agriculture. The accomplishment of goals is easier in the related and other sectors that
have no direct link to agriculture.
1. The Problem
The reunification of Germany gave rise to agricultural corporations in eastern Germany the
likes of which are unprecedented in the European Union member states. The transformation of
2
agricultural production co-operatives and collective operations into free-market businesses has
brought a new type of corporation into European agriculture. Through their size and legal en-
tity (BML 1997) they strongly differ from their largely family-owned, EU counterparts. An
until now seldomly highlighted fact of the transformation process undergone by agricultural
businesses in the former East German states is that many of these corporations possessed non-
agricultural subsidiary companies when they started their transformation. These subsidiary
companies consisted mostly of trade operations, processing of agricultural commodities, sup-
ply utilities for the local population and communal service operations (Gosskopf and Kappel-
mann, 1991). Therefore, in addition to the restructuring of their agricultural production, busi-
nesses also had to consider the future of their subsidiary companies.
In the following pages, possible goals of the restructuring of subsidiary companies, or to be
more exact, of corporate diversification will be discussed. The analysis of empirical data will
show not only which goals are important in the diversification of agricultural businesses in the
new German states, but also to what level they are achieved.
2. Definition of Terms
There are at times vastly different interpretations of the meaning of the word diversification in
theory and in practice, so it is therefore necessary to clearly define this term.
The most common definition is one formed by Ansoff (1957), who sees diversification as being
one of four possible growth strategies of a business. These four strategies are differentiated
using the product-market strategies for business growth alternatives (see Figure 1).
3
Figure 1: Product-market strategies for business growth alternatives
Market
Product line Old New
Old Market penetration Market development
New Product development Diversification
Source: Ansoff; (1957), p. 114
Growth strategies:
1. “Market penetration is an effort to increase company seal without departing from an origi-
nal product-market strategy. The company seeks to improve business performance either by
increasing the volume of sales to its present customers or by finding new customers for present
products.
2. Market development is a strategy in which the company attempts to adapt its present prod-
uct line (generally with some modification in product characteristics) to new markets. A pas-
senger airline that decides to branch into cargo transportation is an example of this strategy.
3. A product development strategy, on the other hand, retains the present markets and devel-
ops products that have new and different characteristics such as will improve the performance
of the market.
4. Diversification is the final alternative. It calls for a simultaneous departure from a present
product line and the present market structure (Ansoff 1957).“
Ansoff’s definition immediately presents the question of what is a new market or rather, what
is a new product? For example, a cash crop farmer decides to add lin seed to its crop rotation.
For that particular business, this represents a new product that will have to be sold to a previ-
4
ously untargeted market. But the product of this operation has basically not changed: it is still
selling cash crops.
A differentiation specific to agriculture was developed by Ilbery (1988), who identified five
different areas of diversification for agriculture:
1. Farm-based tourism (Bed &Breakfast, Camping, etc.)
2. Farm-based recreation (Farmhouse teas, Golf course, etc.)
3. Adding value to conventional enterprises (Processing cheese, Direct marketing, etc.)
4. Unconventional enterprises (Sheep milk, Triticale, etc.)
5. Ancillary buildings/ resources (Farm woodland, Redundant buildings, etc.)
(Ilbery, 1988).
These categories are very well suited to systematise the non-agricultural sector, which is often
seen in family-farms. However, the differences between agricultural and non-agricultural ac-
tivities are still not quite clear. Especially the term “unconventional enterprises“ can lead to
various differentiations, should the businesses be located in different climatic regions. A further
problem of this differentiation is that areas such as trades and certain parts of the service sector
are not separately listed, but are all lumped together in a sixth category entitled “Others“.
As a result of the varying interpretations of the word diversification, the team working on di-
versification for the Schmalenbach Society (Luettringhaus 1973) defined diversification as:
• “the existence of a product that is so new for the business in question that a new market
must be found for it or
• the development of a market that is so new for the business in question that it leads to the
creation of a new product,
5
• behind which is the intention of a permanent continuation of present markets and product
lines, as well as the addition of new ones (Luettringhaus, 1973).“
However, within the scope of a large scale survey, the definition put together by the team from
the Schmalenbach Society lacks practicality and efficiency, as it necessitates repeated inquiries
of the companies in question. Therefore, the methods of official statistics are generally relied
upon. Diversification is mentioned in this context when there are differences between the first
two, three or four digits of the statistical codes as they are used by the U. S. Census Bureau
(Gorth, 1962; Buehner, 1983; Jaquemin and Berry 1979).
For the purposes of this study, it was decided that diversification in agriculture occurs only
when a business or company in the agricultural sector was economically active in areas other
than livestock or crop production. The systematics of the industry branches (Statistisches Bun-
desamt, 1979) are used to distinguish agriculture from other product/market areas. A two digit
statistical code is used. This code differentiates 33 profit-earning subdepartments, whereby
agriculture and forestry represent one of these 33 departments. The definition of the subde-
partment agriculture and forestry is nearly the same as at the two digit NAICA (North Ameri-
can Industry Classification System; U. S. Census Bureau,1998) statistic code.
3. Basis for Data
Statistical data in reference to the impact of diversification in agriculture are not yet available
for the new German states. The studies that currently exist about the diversification of agri-
cultural businesses refer only to the old West German states (Boeckmann and Mose, 1994;
Kuhnert and Wirthgen, 1996). Therefore, it was necessary to conduct a widespread mail sur-
vey in the new German states in order to collect such needed data. To gather this information,
6
1313 copies of a questionnaire were mailed out in the spring of 1996. It is important to note
that it was impossible to conduct a fully representative survey, as it was not technically feasible
to collect data from all existing operations. 425 questionnaires were returned, of which 215 did
not meet the selection criteria and were therefore eliminated. Amongst those that were
deemed unuseful, 100 were submitted by operations who were either in the process of liquida-
tion, were under 250 hectares in size and with fewer than five employees. The other 115 were
missing substantial portions of information. The business and production structure profile of
the agricultural region within which the businesses received the survey was not significantly
changed by the exclusion of the 115 questionnaires that did not supply adequate information
(average size of farm and workers per farm; t-Test, q<0.05 ). The results of this survey were
therefore based on the information received from 210 questionnaires.
In this survey, it is also important to note that the differentiation of a business here is not the
same one as used in German statistics. German statistics differentiate according to legal enti-
ties. According to German taxation laws and guidelines for grants of businesses, agricultural
corporations that become substantially active in areas outside of plant and animal production
are forced to form their non-agricultural activities into independent legal entities. This study
neglects these legal definitions and treats subsidiaries and mother company as a single business.
For example, a dairy co-operative that, for grant and taxation reasons, founds both a suckler
cow operation and a butchershop as subsidiaries, is treated as a business active in the areas of
agriculture and meat processing.

7
4. Meaning of Diversification in Large-scale Agricultural Businesses
In order to better analyse the gathered data, a comparison was made between some structural
data and data from the 1997 Farm Report (see Table 1). The gathered data was compared to
those of corporate entities, as only 2% of the returned surveys came from natural entities.
Table 1: Structural Data Comparison of Survey Data with the 1997 Farm Report
BML-Test-
operations
legal entities
(n=298)
all surveyed
businesses
(n=210)
diversified
(n=108)
non-
diversified
(n=102)
Type of agricultural operation
fodder crops % 47.0 42.9 38.9 47.1
cash crops % 40.9 41.0 41.7 40.2
mixed % 10.7 13.3 16.7 9.8
other % 1.4 2.8 2.7 2.9
Average size of farm1) ha / farm 1451 1692 1907 1465
Soil quality index index 39.12) 39.6 38.9 40.3
Livestock units / arable land units/100 ha 69.4 65.6 70.0 60.9
Labour efficiency3) AWU/100 ha 1.67 1.67 1.69 1.65
*Index for the natural productivity of arable land (min. ca. 10 = sand soil, max. 100 = chernozem or loess with600 mm of annual precipitation and a yearly annual temperature of 8 C°)1) arable land2) Calculations based on a comparison figure3) Only workers in agricultural production; 1 unit be equivalent to 1 full-time workerSource: BML 1997 and own research 1996
It is clear that non-diversified businesses are nearly fully comparable to the operations in the
Farm Report. On the other hand, diversified businesses, meaning ones that are economically
active outside of agriculture, are only comparable to those in the Farm Report in terms of the
number of agricultural employees per square unit of land and livestock units per square unit of
land. In terms of the type of agricultural operation and total workable acreage however, diver-
8
sified businesses showed significant differences (χ2-adjustment test q<0.05; t-Test q<0.05)
when compared to the other two groups. Overall, they are larger in size and their agricultural
production structure is less highly specialized.
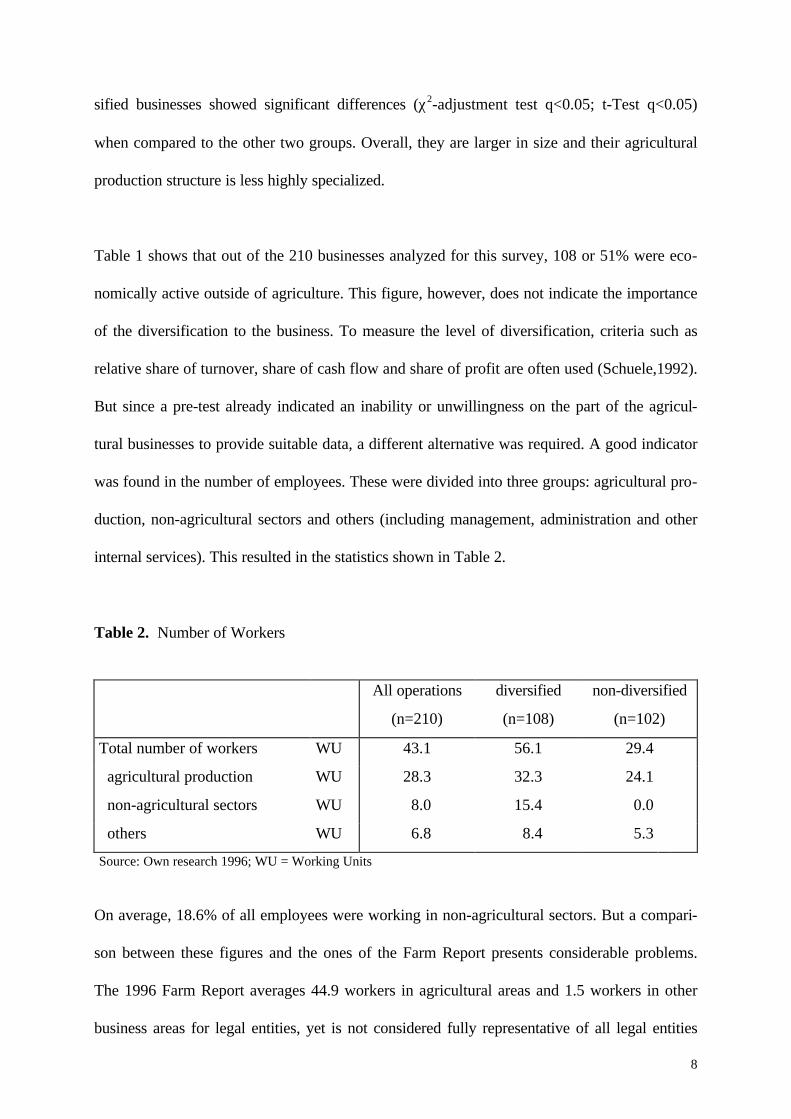
Table 1 shows that out of the 210 businesses analyzed for this survey, 108 or 51% were eco-
nomically active outside of agriculture. This figure, however, does not indicate the importance
of the diversification to the business. To measure the level of diversification, criteria such as
relative share of turnover, share of cash flow and share of profit are often used (Schuele,1992).
But since a pre-test already indicated an inability or unwillingness on the part of the agricul-
tural businesses to provide suitable data, a different alternative was required. A good indicator
was found in the number of employees. These were divided into three groups: agricultural pro-
duction, non-agricultural sectors and others (including management, administration and other
internal services). This resulted in the statistics shown in Table 2.
Table 2. Number of Workers
All operations
(n=210)
diversified
(n=108)
non-diversified
(n=102)
Total number of workers WU 43.1 56.1 29.4
agricultural production WU 28.3 32.3 24.1
non-agricultural sectors WU 8.0 15.4 0.0
others WU 6.8 8.4 5.3
Source: Own research 1996; WU = Working Units
On average, 18.6% of all employees were working in non-agricultural sectors. But a compari-
son between these figures and the ones of the Farm Report presents considerable problems.
The 1996 Farm Report averages 44.9 workers in agricultural areas and 1.5 workers in other
business areas for legal entities, yet is not considered fully representative of all legal entities
9
(BML, 1996). The 1997 Farm Report is not directly comparable to the 1996 version because
of changes in method that were made, but the 1997 survey is considered representative (BML,
1997). The methodical changes made between 1996 and 1997 also include a difference in the
classifications of employees of legal entities. In the 1997 report, distinctions are made between
Management and Administration, Plant and Animal production, and other workers. This pat-
tern is not identical to the one used in this survey. Here, the differentiation was made between
management, administration, other internal services as one group and remaining workers as the
other group. If the same numbers of management and administration workers were used in
this survey as were shown in the Farm Report of 1997, the results would show 9.6 other
workers in the operations surveyed. Should the number of other workers then be set against
the total number of employees, the percentage of other workers in this survey is 22.3% as op-
posed to the 18.6% in the 1997 Farm Report. Therefore, it can be assumed that the importance
of non-agricultural business branches is well reflected in the data that was collected throughout
the course of this research.
The proportion of employees in non-agricultural sectors in relation to the total number of em-
ployees clearly indicates that these sectors are an integral part of agricultural businesses.
10
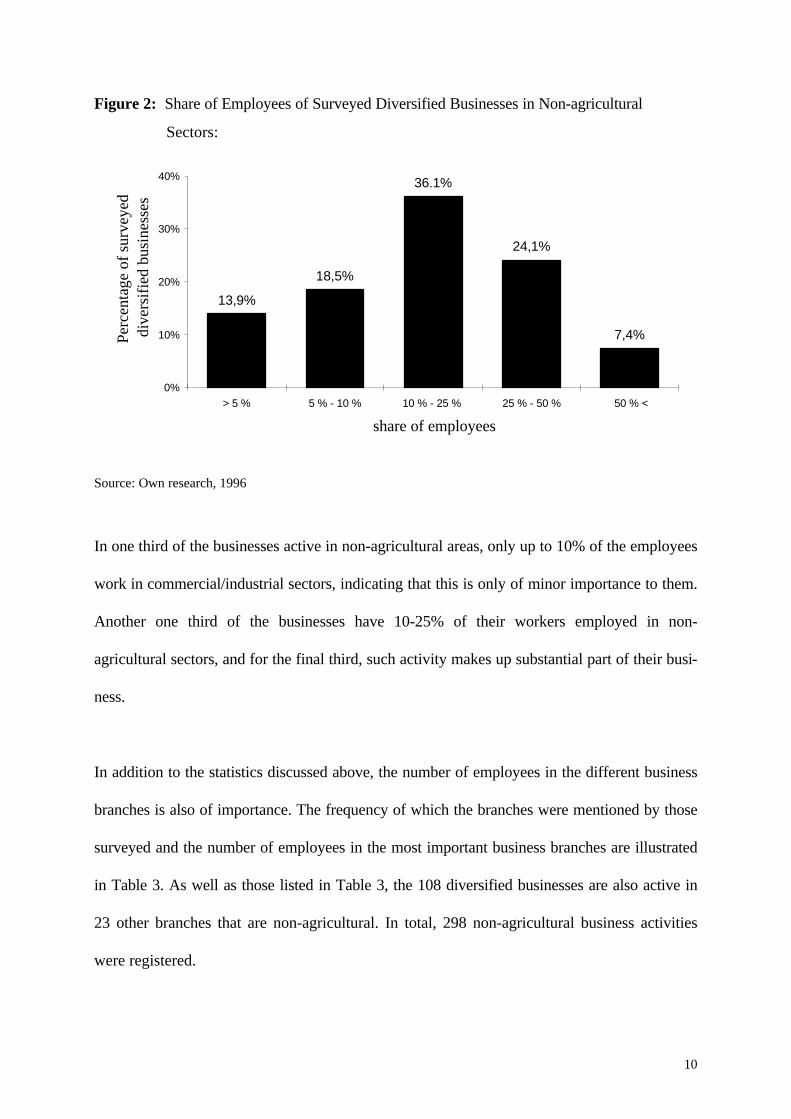
Figure 2: Share of Employees of Surveyed Diversified Businesses in Non-agricultural
Sectors:
7,4%
24,1%
13,9%
18,5%
36.1%
0%
10%
20%
30%
40%
> 5 % 5 % - 10 % 10 % - 25 % 25 % - 50 % 50 % <
share of employees
Perc
enta
ge o
f su
rvey
ed d
iver
sifi
ed b
usin
esse
s
Source: Own research, 1996
In one third of the businesses active in non-agricultural areas, only up to 10% of the employees
work in commercial/industrial sectors, indicating that this is only of minor importance to them.
Another one third of the businesses have 10-25% of their workers employed in non-
agricultural sectors, and for the final third, such activity makes up substantial part of their busi-
ness.
In addition to the statistics discussed above, the number of employees in the different business
branches is also of importance. The frequency of which the branches were mentioned by those
surveyed and the number of employees in the most important business branches are illustrated
in Table 3. As well as those listed in Table 3, the 108 diversified businesses are also active in
23 other branches that are non-agricultural. In total, 298 non-agricultural business activities
were registered.
11
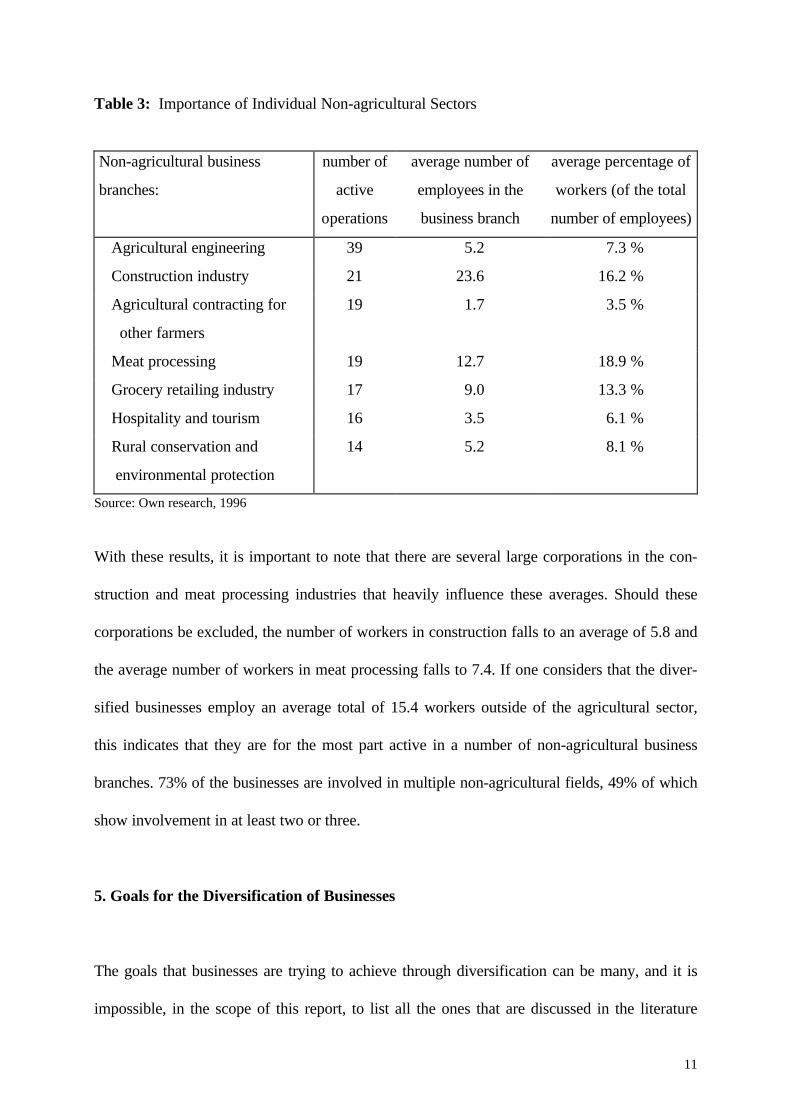
Table 3: Importance of Individual Non-agricultural Sectors
Non-agricultural business
branches:
number of
active
operations
average number of
employees in the
business branch
average percentage of
workers (of the total
number of employees)
Agricultural engineering 39 5.2 7.3 %
Construction industry 21 23.6 16.2 %
Agricultural contracting for
other farmers
19 1.7 3.5 %
Meat processing 19 12.7 18.9 %
Grocery retailing industry 17 9.0 13.3 %
Hospitality and tourism 16 3.5 6.1 %
Rural conservation and
environmental protection
14 5.2 8.1 %
Source: Own research, 1996
With these results, it is important to note that there are several large corporations in the con-
struction and meat processing industries that heavily influence these averages. Should these
corporations be excluded, the number of workers in construction falls to an average of 5.8 and
the average number of workers in meat processing falls to 7.4. If one considers that the diver-
sified businesses employ an average total of 15.4 workers outside of the agricultural sector,
this indicates that they are for the most part active in a number of non-agricultural business
branches. 73% of the businesses are involved in multiple non-agricultural fields, 49% of which
show involvement in at least two or three.
5. Goals for the Diversification of Businesses
The goals that businesses are trying to achieve through diversification can be many, and it is
impossible, in the scope of this report, to list all the ones that are discussed in the literature
12
pertinent to this subject (Schuele, 1992; Reed and Lufmann, 1986; Mohren, 1996; Jacobs,
1992). The goals and conduct of family-run agricultural businesses ( Bowler et al., 1996;
Schmitt, 1989; Sohn, 1989; Tschajanow, 1987) will not be discussed within this context, as
they were not included in this study. For the purposes of clarity, the most important theoretical
goals are divided into four specific groups:
1. Efficiency-oriented goals
2. Risk-oriented goals
3. Growth-oriented goals
4. Management-oriented goals
A business that chooses to differentiate using efficiency-oriented goals is one that tries to make
better use of inefficient or excess tangible and intangible resources. Generally, this is related to
the use of synergy potentials between the existing main sector of the business and the new sub-
sidiary branches, which eventually will lead to an increase in profits or a lowering of costs for
the company (Ansoff, 1987; Baumol et al., 1988; Seth, 1990b). Concrete goals of agricultural
corporations in this regard are, for example, increased capacity utilisation of machinery, the
smoothing out of labour peak, and improved usage of the multi-faceted knowledge of employ-
ees.
Risk reduction is another important goal of diversification. The entry into new markets should
make the corporation more resistant to disruptive effects within its business environment. This
is especially important for highly specialised companies, as their success is strongly dependant
on a very narrow field of buying and selling markets (Amit and Livant, 1988). Because of a
strong dependence on political decisions and at times suddenly volatile consumer behaviour
13
(i.e. BSE-Crisis), risk reduction as a goal of diversification is growing in importance for agri-
cultural businesses.
Growth as a goal can be equated with a long-term strategy of security of livelihood. Through
the entry into sectors with good prospects for the future, companies whose current areas of
business are in the stagnant or degeneration phase of the product, branch or technology life
cycles are trying to guarantee the future success and survival of their corporations (Ansoff,
1957). Agricultural commodity production is without a doubt in the stagnant, if not the degen-
eration phase. An enterprise active in this sector only has potential for long-term growth if it
tries to be a price leader or if it branches out its activities into other areas.
The goals of management can often be derived from the „Theory of the Firm“ (Jensen and
Meckling, 1976). The group of management goals that could be relevant in this context con-
tains two approaches. The first one is that managers strive to maximise their personal benefits
(power and income). This is an irrelevant goal from the point of view of the profit maximising
business. The second approach implies that a manager‘s behaviour is influenced by social re-
sponsibility for the company, the workers and society, not by his personal desires. The creation
or preservation of jobs is especially desirable in the new German states.
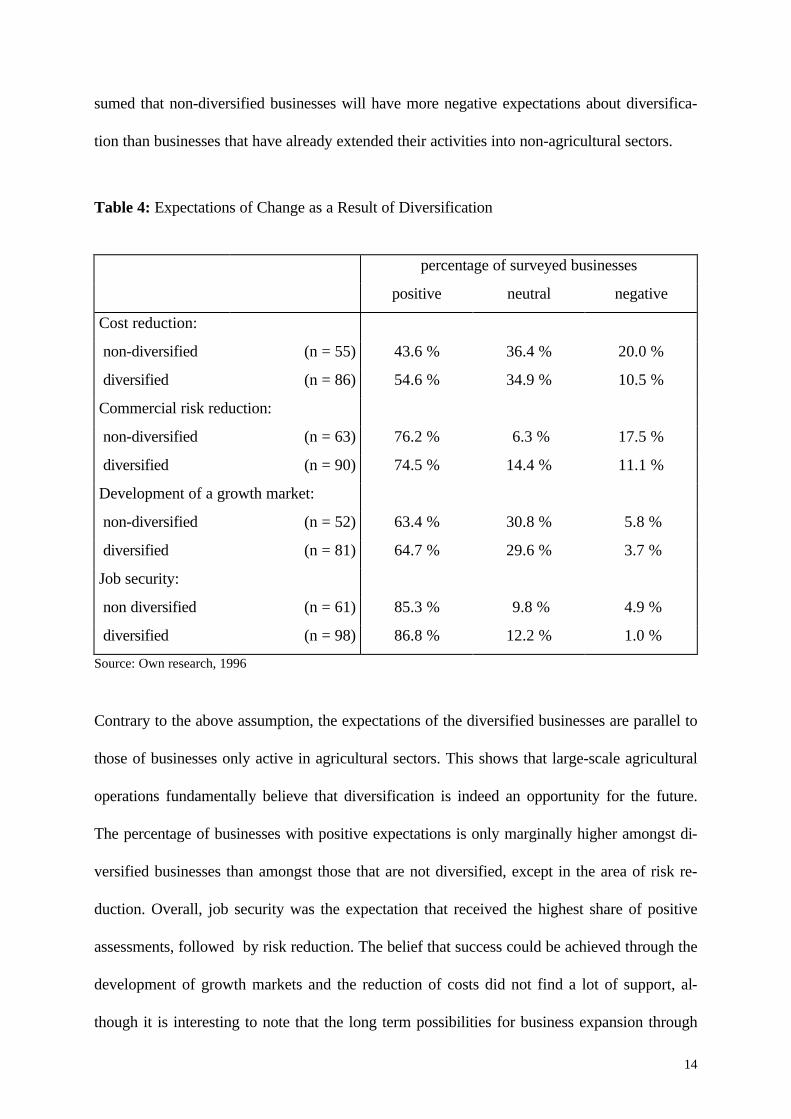
To determine the relevance of these four groups in terms of business diversification, the oper-
ating managers were asked about their expectations in terms of the changes branching out into
non-agricultural sectors would bring. Table 4 shows the expectations of the four goal-groups:
efficiency (cost reduction), risk reduction, development of growth markets and job security.
They are sub-divided along the lines of diversified and non-diversified businesses, as it is as-
14
sumed that non-diversified businesses will have more negative expectations about diversifica-
tion than businesses that have already extended their activities into non-agricultural sectors.
Table 4: Expectations of Change as a Result of Diversification
percentage of surveyed businesses
positive neutral negative
Cost reduction:
non-diversified (n = 55) 43.6 % 36.4 % 20.0 %
diversified (n = 86) 54.6 % 34.9 % 10.5 %
Commercial risk reduction:
non-diversified (n = 63) 76.2 % 6.3 % 17.5 %
diversified (n = 90) 74.5 % 14.4 % 11.1 %
Development of a growth market:
non-diversified (n = 52) 63.4 % 30.8 % 5.8 %
diversified (n = 81) 64.7 % 29.6 % 3.7 %
Job security:
non diversified (n = 61) 85.3 % 9.8 % 4.9 %
diversified (n = 98) 86.8 % 12.2 % 1.0 %
Source: Own research, 1996
Contrary to the above assumption, the expectations of the diversified businesses are parallel to
those of businesses only active in agricultural sectors. This shows that large-scale agricultural
operations fundamentally believe that diversification is indeed an opportunity for the future.
The percentage of businesses with positive expectations is only marginally higher amongst di-
versified businesses than amongst those that are not diversified, except in the area of risk re-
duction. Overall, job security was the expectation that received the highest share of positive
assessments, followed by risk reduction. The belief that success could be achieved through the
development of growth markets and the reduction of costs did not find a lot of support, al-
though it is interesting to note that the long term possibilities for business expansion through

15
the development of such markets were more positively rated than the short term increase of
earnings that cost reductions would bring. Of even greater significance is the restriction of the
risk of insolvency, which is at least partly caused by strongly fluctuating profits on the com-
modity markets. But the expectation that was mentioned the most by those surveyed is one
with a very human aspect: through diversification, operations expect to be able to provide job
security for their workers. Social responsibility towards their employees is one of the basic
motivations for businesses to move towards diversification.
6. Goal achievement
Of course, the degree to which the goals are achieved is substantially more important than the
actual determining of those goals. A quantitative measurement of the degree of goal accom-
plishment would be desirable, but is currently not possible as it demands uniform cost calcula-
tions and long term statistics. Due to these reasons, the economic analysis must rely on the
qualitative data gathered through the survey. To increase the level of detail in the responses,
the four sectors of diversification were divided into upstream sector, downstream sector, re-
lated sectors and others2 . The respondents rated the effects of these diversification sectors on
agricultural businesses as either positive (decrease), neutral or negative (increase)3 . The results
for production costs are shown in Table 5.
16
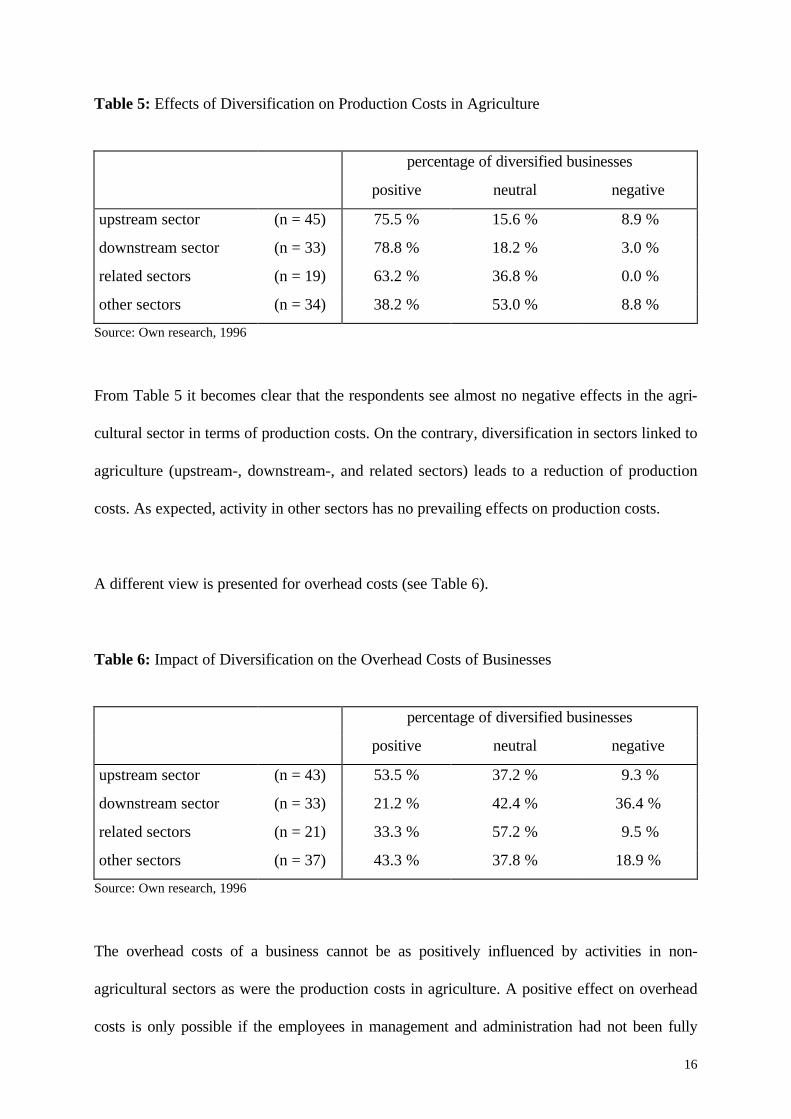
Table 5: Effects of Diversification on Production Costs in Agriculture
percentage of diversified businesses
positive neutral negative
upstream sector (n = 45) 75.5 % 15.6 % 8.9 %
downstream sector (n = 33) 78.8 % 18.2 % 3.0 %
related sectors (n = 19) 63.2 % 36.8 % 0.0 %
other sectors (n = 34) 38.2 % 53.0 % 8.8 %
Source: Own research, 1996
From Table 5 it becomes clear that the respondents see almost no negative effects in the agri-
cultural sector in terms of production costs. On the contrary, diversification in sectors linked to
agriculture (upstream-, downstream-, and related sectors) leads to a reduction of production
costs. As expected, activity in other sectors has no prevailing effects on production costs.
A different view is presented for overhead costs (see Table 6).
Table 6: Impact of Diversification on the Overhead Costs of Businesses
percentage of diversified businesses
positive neutral negative
upstream sector (n = 43) 53.5 % 37.2 % 9.3 %
downstream sector (n = 33) 21.2 % 42.4 % 36.4 %
related sectors (n = 21) 33.3 % 57.2 % 9.5 %
other sectors (n = 37) 43.3 % 37.8 % 18.9 %
Source: Own research, 1996
The overhead costs of a business cannot be as positively influenced by activities in non-
agricultural sectors as were the production costs in agriculture. A positive effect on overhead
costs is only possible if the employees in management and administration had not been fully
17
utilised before diversification or if there is under-proportional growth in operating costs. The
exact opposite happened in 36.4% of cases in the downstream sector and in 18.9% of cases in
other sectors, showing negative effects in terms of overhead costs.
The diversified branches also show distinctive differences on the subject of risk reduction (see
Table 7).
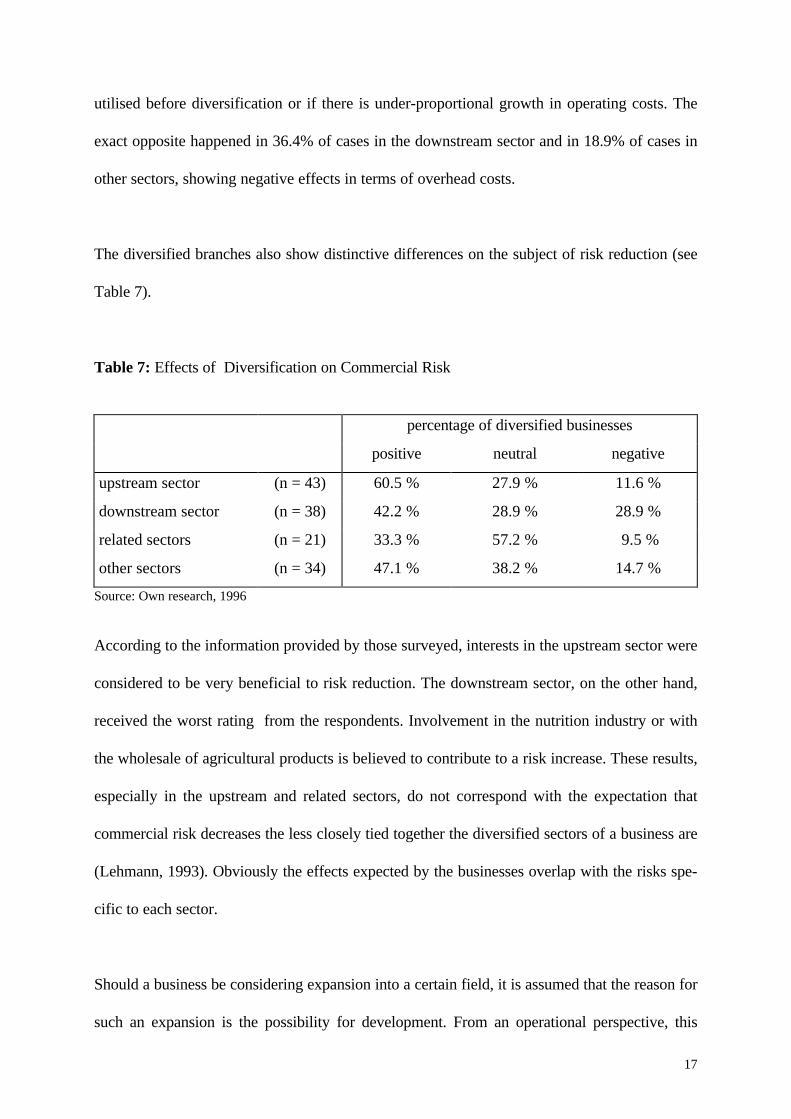
Table 7: Effects of Diversification on Commercial Risk
percentage of diversified businesses
positive neutral negative
upstream sector (n = 43) 60.5 % 27.9 % 11.6 %
downstream sector (n = 38) 42.2 % 28.9 % 28.9 %
related sectors (n = 21) 33.3 % 57.2 % 9.5 %
other sectors (n = 34) 47.1 % 38.2 % 14.7 %
Source: Own research, 1996
According to the information provided by those surveyed, interests in the upstream sector were
considered to be very beneficial to risk reduction. The downstream sector, on the other hand,
received the worst rating from the respondents. Involvement in the nutrition industry or with
the wholesale of agricultural products is believed to contribute to a risk increase. These results,
especially in the upstream and related sectors, do not correspond with the expectation that
commercial risk decreases the less closely tied together the diversified sectors of a business are
(Lehmann, 1993). Obviously the effects expected by the businesses overlap with the risks spe-
cific to each sector.
Should a business be considering expansion into a certain field, it is assumed that the reason for
such an expansion is the possibility for development. From an operational perspective, this
18
indicates the presence of a growth market. As well, expansion leads to being able to provide
employee job security, which is one of the basic motivations for moving towards diversifica-
tion. Two goals, the development of new growth markets and job security, can be measured by
looking at the expansion intentions of a business. These intentions of businesses in each of the
four sectors are illustrated in Table 8.
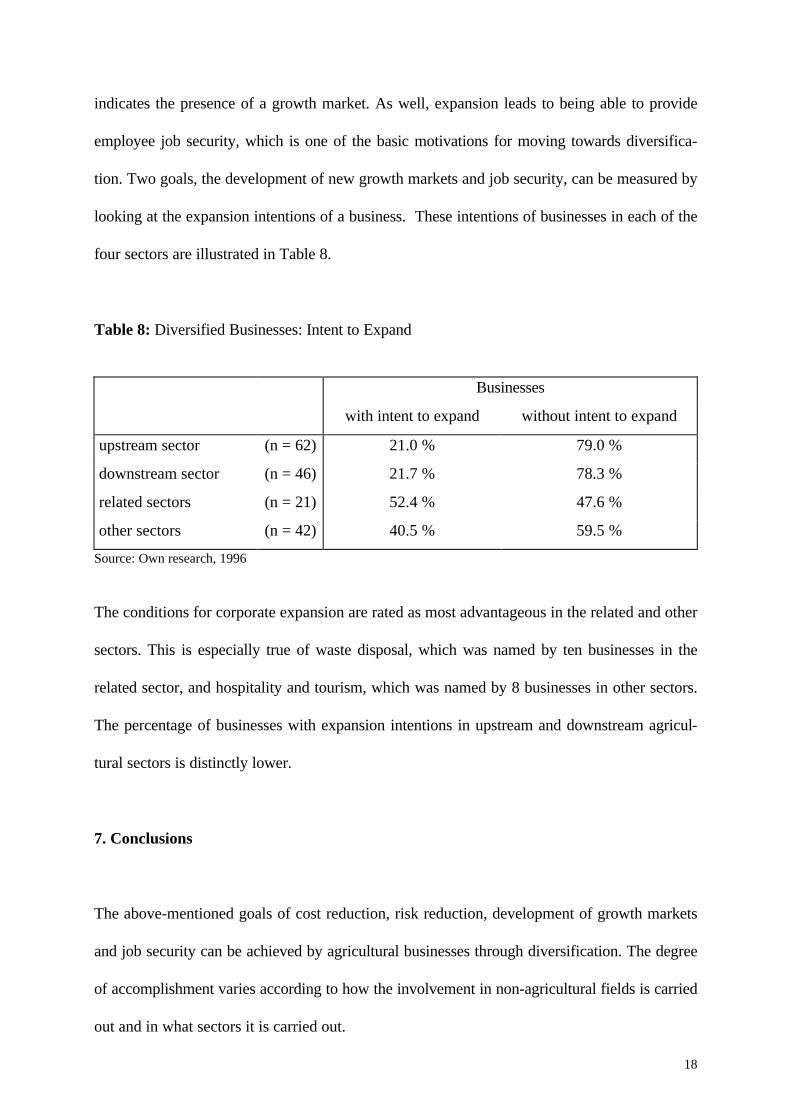
Table 8: Diversified Businesses: Intent to Expand
Businesses
with intent to expand without intent to expand
upstream sector (n = 62) 21.0 % 79.0 %
downstream sector (n = 46) 21.7 % 78.3 %
related sectors (n = 21) 52.4 % 47.6 %
other sectors (n = 42) 40.5 % 59.5 %
Source: Own research, 1996
The conditions for corporate expansion are rated as most advantageous in the related and other
sectors. This is especially true of waste disposal, which was named by ten businesses in the
related sector, and hospitality and tourism, which was named by 8 businesses in other sectors.
The percentage of businesses with expansion intentions in upstream and downstream agricul-
tural sectors is distinctly lower.
7. Conclusions
The above-mentioned goals of cost reduction, risk reduction, development of growth markets
and job security can be achieved by agricultural businesses through diversification. The degree
of accomplishment varies according to how the involvement in non-agricultural fields is carried
out and in what sectors it is carried out.
19
The downstream sector is the one in which most businesses (78.9%) show a positive effect in
terms of production costs in agriculture. Here, production can be aimed more effectively at
sales volume. On the other hand, it is this same sector that has the worst results in overhead
costs and the highest percentage of businesses who think it leads to an increase in commercial
risk. Only one in every five of these businesses intend to expand further. The downstream sec-
tor, therefore, shows the greatest weaknesses in the most important goal-areas, those being
risk and long term growth. This is not surprising, since agricultural businesses have expanded
their scope of service only one level closer towards the end consumer, why they feel marketing
risks and limitations more directly. As a result, the downstream sector as a suitable diversifica-
tion field for agricultural businesses is contingent upon each business’ individual situation.
According to the results of those surveyed, diversifying into sectors such as agricultural cus-
tom operation and agricultural engineering result in both production and overhead cost reduc-
tion in the corporation’s main area of activity. Synergistic potential is evident here as machines
and know-how are used more effectively. In 60.5% of all cases, the surveyed businesses indi-
cated a decrease of commercial risk. In this context, the decrease in down time, better repair
and overhaul possibilities, and more machinery have a positive effect on the risk level. The high
percentage (63%) of active businesses and the small number (21%) who intend to expand in-
dicates that the existing potentials will continue to be used. In summary, the upstream sector is
very interesting in terms of its profitability, but does not offer any long term development pos-
sibilities.
The other sectors, which aren’t directly connected to agriculture, do not have any influence on
agricultural production costs in the minds of the majority of the respondents. The effects on
20
overhead costs are assessed in varying ways. 43.3% of the operations can obviously make
better use of available management and administration resources here, but 18.9% of businesses
indicate the exact opposite result, showing an increase in overhead costs. The risk factor and
the expansion intentions are represented in a very positive light. Long-term potentials in these
other sectors are substantially better than in the upstream and downstream sectors.
According to the assessments of those surveyed, jobs in areas such as rural conservation, hor-
ticulture, environmental protection and waste disposal do not have any negative effects on
production costs, and at times, have only minimal negative effects on overhead costs. Activities
in these areas make a higher maximisation of agricultural equipment and equal division of la-
bour possible. The commercial risk criterion has no influence in most cases. The fact that
52.4% of businesses in this sector want to expand is very key. The related sector is very suit-
able for strong and sustained corporate development. It is important to note, however, that this
is the sector within which there are the fewest number of active businesses. Market saturation
can therefore happen very quickly.
21
Bibliography
Ansoff, H. I. (1957) Strategies for diversification. Harvard Business Review 35, 113-124
Ansoff, H. I. (1987) Corporate strategy, Harmondsworth
Amit, R. and Livant, J. (1988) Diversification strategies, business cycles and economic per-
formance. Strategic Management Journal 9, 99-110
Baumol, W. J., Panzer, J. C. and Willig, R. D. (1988) Contestable markets and the theory of
industry structure. San Diego
BML; (1996) Agrarbericht der Bundesregierung 1996. Bonn
BML; (1997) Agrarbericht der Bundesregierung 1997. Bonn
Boeckmann, M. and Mose, I. (1994) Diversifizierung in der Landwirtschaft Niedersachsens -
Weg in die Zukunft oder Weg ins Aus? Vechta
Bowler, I., Clark, G., Crockett, A., Ilbery, B. and Shaw, A. (1996) The development of alter-
native farm enterprises: a study of family labour farms in the Northern Pennines of Eng-
land. Journal of Rural Studies 12, 285-295
Buehner, R.; (1983) Portfolio-Risikoanalyse der Unternehmensdiversifikation von Industrieak-
tiengesellschaften. Zeitschrift für Betriebswirtschaft 53, No. 11, 1023-1041
Gort, M. (1962): Diversification and Integration in American Industry, Princeton
Grosskopf, w. and Kappelmann, K. H. (1991) Die bisherigen nicht-landwirtschaftlichen Be-
triebszweige der „LPGen“- Bestandsaufnahme und Kosten-Nutzen-Untersuchungen zur
Bewrtung von agrarpolitischen Maßnahmen zur Integration in eine Marktwirtschaftliche
Ordnung, Gutachten für das BML. Hohenheim
Ilbery, B. W. (1988) Farm diversification and the restructuring of agricultur. Outlook on agri-
culture 17, 35-39
Jacobs, S. (1992) Strategische Erfolgsfaktoren der Diversifikation. Wiesbaden
22
Jaquemin, A. P. and Berry, C. H. (1979) Entropy measure of diversification and corpeorate
growth. The Journal of Industrial Economics 27, 359-369
Jensen, M. C. and Meckling, W. H. (1976) Theory of the Firm: managerial behavior, agencc
costs and ownership structure. Journal of Financial Economics 3, 305-360
Kuhnert, H.and Wirthgen, B. (1996) Einzelbetriebliche Diversifikation durch hofeigene Le-
bensmittelverarbeitung und Direktvermarktung. Schriften der GeWiSoLa 32, 443-452
Lehmannn, R. (1992) Kann Diversifikation Werte schaffen? Bern
Luettringhaus, G. (1973) Diversifikationsprojekte - Betriebswirtschaftliche Probleme ihrer Pla-
nung, Organisation und Kontrolle, Arbeitskreis Diversifikation der Schmalenbach-
Gesellschaft. Zeitschrift für betriebswirtschaftliche Forschung 25, No. 2, 293-335
Reed, R. And Luffman, G. A. (1986) Diversification: the Growing. Strategic management
Journal 7, 29-35
Schmitt, G. (1989) Farms, farm households, and productivity of resource use in agriculture.
European review of agricultural economics 16, 257-284
Schüle, F. M. (1992) Diversifikation und Unternehmenserfolg. Wiesbaden
Seth, A. (1990a) Value creation in auquisitations: a reexamination of performance issues.
Strategic management Journal 11, 99-115
Seth, A. (1990b) Sources of value creation in auquisitations: an empirical investigating. Strate-
gic management Journal 11, 431-446
Sohn, H. (1989) Erwerbskombinationen in Haushalten mit Landbewirtschaftungen in der Bun-
desrepublik Deutschland. Schriftenreihe der Forschungsgesellschaft für Agrarpolitik
und Agrarsoziologie e. V., Bonn
StatSoft of Europe: Statistica/w 5.1.
Statistisches Bundesamt (1982) Systematik der Wirtschaftszweige mit Betriebs- und ähnlichen
Benennungen, Ausgabe 1979, Stuttgart and Mainz
23
Trautwein, F. (1990) Merger motives and merger prescriptions. Strategic management Jour-
nal 11, 283-295
Tschajanow, A. (1987) Die Lehre von der bäuerlichen Wirtschaft, Frankfurt / Main
U.S. Census Bureau (1998) 1997 NAICS and 1987 SIC Correspondence Tables.
http//www.census.gov/epcd/www/naicstab.htm
1 An earlier version of this paper has been presented at the annual meeting of the “Gesellschaft für Wirtschafts- und Sozialwissenschaften des Landbaus e. V.“ 1997.2 Upstream sectors: agricultural engineering, animal feed industry, agricultural contracting for other farmers,etc. Downstream sectors: nutrition, wholesale of agricultural products, grocery retail business etc. Related sectors: horticulture and landscaping, rural conservation and protection of the environment, waste disposal etc. Other sectors: construction, hospitality and tourism etc.3 The number of cases fluctuate since not all of the active corporations supplied information about their commercial risk, or about their production and overhead costs.