Embed Size (px)
Citation preview
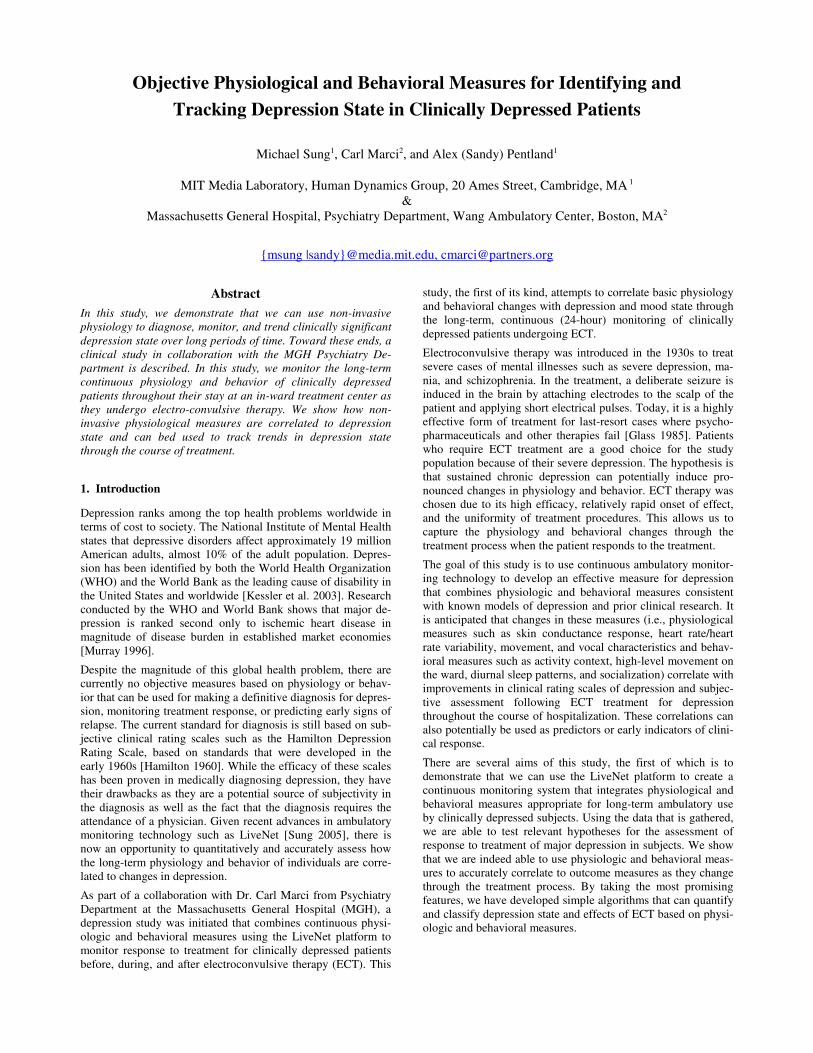
Objective Physiological and Behavioral Measures for Identifying and Tracking Depression State in Clinically Depressed Patients
Michael Sung1, Carl Marci2, and Alex (Sandy) Pentland1
MIT Media Laboratory, Human Dynamics Group, 20 Ames Street, Cambridge, MA 1 &
Massachusetts General Hospital, Psychiatry Department, Wang Ambulatory Center, Boston, MA2
{msung |sandy}@media.mit.edu, [email protected]
Abstract
In this study, we demonstrate that we can use non-invasive physiology to diagnose, monitor, and trend clinically significant depression state over long periods of time. Toward these ends, a clinical study in collaboration with the MGH Psychiatry De-partment is described. In this study, we monitor the long-term continuous physiology and behavior of clinically depressed patients throughout their stay at an in-ward treatment center as they undergo electro-convulsive therapy. We show how non-invasive physiological measures are correlated to depression state and can bed used to track trends in depression state through the course of treatment.
1. Introduction
Depression ranks among the top health problems worldwide in terms of cost to society. The National Institute of Mental Health states that depressive disorders affect approximately 19 million American adults, almost 10% of the adult population. Depres-sion has been identified by both the World Health Organization (WHO) and the World Bank as the leading cause of disability in the United States and worldwide [Kessler et al. 2003]. Research conducted by the WHO and World Bank shows that major de-pression is ranked second only to ischemic heart disease in magnitude of disease burden in established market economies [Murray 1996].
Despite the magnitude of this global health problem, there are currently no objective measures based on physiology or behav-ior that can be used for making a definitive diagnosis for depres-sion, monitoring treatment response, or predicting early signs of relapse. The current standard for diagnosis is still based on sub-jective clinical rating scales such as the Hamilton Depression Rating Scale, based on standards that were developed in the early 1960s [Hamilton 1960]. While the efficacy of these scales has been proven in medically diagnosing depression, they have their drawbacks as they are a potential source of subjectivity in the diagnosis as well as the fact that the diagnosis requires the attendance of a physician. Given recent advances in ambulatory monitoring technology such as LiveNet [Sung 2005], there is now an opportunity to quantitatively and accurately assess how the long-term physiology and behavior of individuals are corre-lated to changes in depression.
As part of a collaboration with Dr. Carl Marci from Psychiatry Department at the Massachusetts General Hospital (MGH), a depression study was initiated that combines continuous physi-ologic and behavioral measures using the LiveNet platform to monitor response to treatment for clinically depressed patients before, during, and after electroconvulsive therapy (ECT). This
study, the first of its kind, attempts to correlate basic physiology and behavioral changes with depression and mood state through the long-term, continuous (24-hour) monitoring of clinically depressed patients undergoing ECT.
Electroconvulsive therapy was introduced in the 1930s to treat severe cases of mental illnesses such as severe depression, ma-nia, and schizophrenia. In the treatment, a deliberate seizure is induced in the brain by attaching electrodes to the scalp of the patient and applying short electrical pulses. Today, it is a highly effective form of treatment for last-resort cases where psycho-pharmaceuticals and other therapies fail [Glass 1985]. Patients who require ECT treatment are a good choice for the study population because of their severe depression. The hypothesis is that sustained chronic depression can potentially induce pro-nounced changes in physiology and behavior. ECT therapy was chosen due to its high efficacy, relatively rapid onset of effect, and the uniformity of treatment procedures. This allows us to capture the physiology and behavioral changes through the treatment process when the patient responds to the treatment.
The goal of this study is to use continuous ambulatory monitor-ing technology to develop an effective measure for depression that combines physiologic and behavioral measures consistent with known models of depression and prior clinical research. It is anticipated that changes in these measures (i.e., physiological measures such as skin conductance response, heart rate/heart rate variability, movement, and vocal characteristics and behav-ioral measures such as activity context, high-level movement on the ward, diurnal sleep patterns, and socialization) correlate with improvements in clinical rating scales of depression and subjec-tive assessment following ECT treatment for depression throughout the course of hospitalization. These correlations can also potentially be used as predictors or early indicators of clini-cal response.
There are several aims of this study, the first of which is to demonstrate that we can use the LiveNet platform to create a continuous monitoring system that integrates physiological and behavioral measures appropriate for long-term ambulatory use by clinically depressed subjects. Using the data that is gathered, we are able to test relevant hypotheses for the assessment of response to treatment of major depression in subjects. We show that we are indeed able to use physiologic and behavioral meas-ures to accurately correlate to outcome measures as they change through the treatment process. By taking the most promising features, we have developed simple algorithms that can quantify and classify depression state and effects of ECT based on physi-ologic and behavioral measures.
2. Background
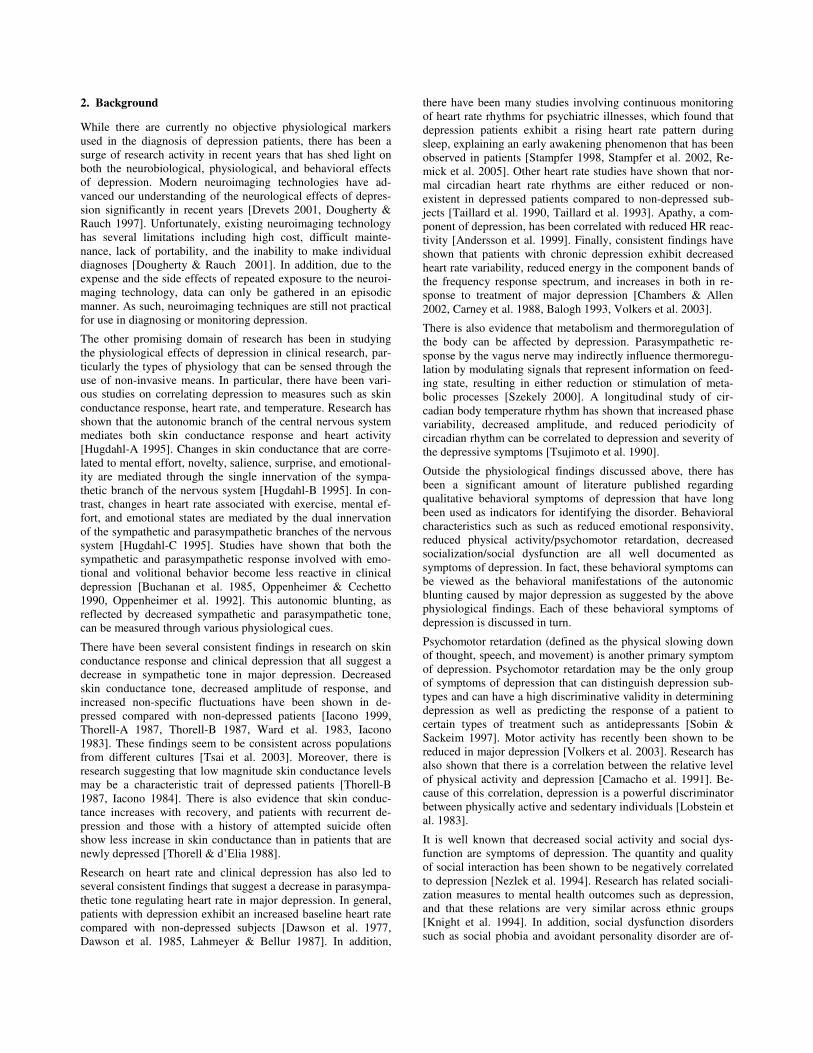
While there are currently no objective physiological markers used in the diagnosis of depression patients, there has been a surge of research activity in recent years that has shed light on both the neurobiological, physiological, and behavioral effects of depression. Modern neuroimaging technologies have ad-vanced our understanding of the neurological effects of depres-sion significantly in recent years [Drevets 2001, Dougherty & Rauch 1997]. Unfortunately, existing neuroimaging technology has several limitations including high cost, difficult mainte-nance, lack of portability, and the inability to make individual diagnoses [Dougherty & Rauch 2001]. In addition, due to the expense and the side effects of repeated exposure to the neuroi-maging technology, data can only be gathered in an episodic manner. As such, neuroimaging techniques are still not practical for use in diagnosing or monitoring depression.
The other promising domain of research has been in studying the physiological effects of depression in clinical research, par-ticularly the types of physiology that can be sensed through the use of non-invasive means. In particular, there have been vari-ous studies on correlating depression to measures such as skin conductance response, heart rate, and temperature. Research has shown that the autonomic branch of the central nervous system mediates both skin conductance response and heart activity [Hugdahl-A 1995]. Changes in skin conductance that are corre-lated to mental effort, novelty, salience, surprise, and emotional-ity are mediated through the single innervation of the sympa-thetic branch of the nervous system [Hugdahl-B 1995]. In con-trast, changes in heart rate associated with exercise, mental ef-fort, and emotional states are mediated by the dual innervation of the sympathetic and parasympathetic branches of the nervous system [Hugdahl-C 1995]. Studies have shown that both the sympathetic and parasympathetic response involved with emo-tional and volitional behavior become less reactive in clinical depression [Buchanan et al. 1985, Oppenheimer & Cechetto 1990, Oppenheimer et al. 1992]. This autonomic blunting, as reflected by decreased sympathetic and parasympathetic tone, can be measured through various physiological cues.
There have been several consistent findings in research on skin conductance response and clinical depression that all suggest a decrease in sympathetic tone in major depression. Decreased skin conductance tone, decreased amplitude of response, and increased non-specific fluctuations have been shown in de-pressed compared with non-depressed patients [Iacono 1999, Thorell-A 1987, Thorell-B 1987, Ward et al. 1983, Iacono 1983]. These findings seem to be consistent across populations from different cultures [Tsai et al. 2003]. Moreover, there is research suggesting that low magnitude skin conductance levels may be a characteristic trait of depressed patients [Thorell-B 1987, Iacono 1984]. There is also evidence that skin conduc-tance increases with recovery, and patients with recurrent de-pression and those with a history of attempted suicide often show less increase in skin conductance than in patients that are newly depressed [Thorell & d’Elia 1988].
Research on heart rate and clinical depression has also led to several consistent findings that suggest a decrease in parasympa-thetic tone regulating heart rate in major depression. In general, patients with depression exhibit an increased baseline heart rate compared with non-depressed subjects [Dawson et al. 1977, Dawson et al. 1985, Lahmeyer & Bellur 1987]. In addition,
there have been many studies involving continuous monitoring of heart rate rhythms for psychiatric illnesses, which found that depression patients exhibit a rising heart rate pattern during sleep, explaining an early awakening phenomenon that has been observed in patients [Stampfer 1998, Stampfer et al. 2002, Re-mick et al. 2005]. Other heart rate studies have shown that nor-mal circadian heart rate rhythms are either reduced or non-existent in depressed patients compared to non-depressed sub-jects [Taillard et al. 1990, Taillard et al. 1993]. Apathy, a com-ponent of depression, has been correlated with reduced HR reac-tivity [Andersson et al. 1999]. Finally, consistent findings have shown that patients with chronic depression exhibit decreased heart rate variability, reduced energy in the component bands of the frequency response spectrum, and increases in both in re-sponse to treatment of major depression [Chambers & Allen 2002, Carney et al. 1988, Balogh 1993, Volkers et al. 2003].
There is also evidence that metabolism and thermoregulation of the body can be affected by depression. Parasympathetic re-sponse by the vagus nerve may indirectly influence thermoregu-lation by modulating signals that represent information on feed-ing state, resulting in either reduction or stimulation of meta-bolic processes [Szekely 2000]. A longitudinal study of cir-cadian body temperature rhythm has shown that increased phase variability, decreased amplitude, and reduced periodicity of circadian rhythm can be correlated to depression and severity of the depressive symptoms [Tsujimoto et al. 1990].
Outside the physiological findings discussed above, there has been a significant amount of literature published regarding qualitative behavioral symptoms of depression that have long been used as indicators for identifying the disorder. Behavioral characteristics such as such as reduced emotional responsivity, reduced physical activity/psychomotor retardation, decreased socialization/social dysfunction are all well documented as symptoms of depression. In fact, these behavioral symptoms can be viewed as the behavioral manifestations of the autonomic blunting caused by major depression as suggested by the above physiological findings. Each of these behavioral symptoms of depression is discussed in turn.
Psychomotor retardation (defined as the physical slowing down of thought, speech, and movement) is another primary symptom of depression. Psychomotor retardation may be the only group of symptoms of depression that can distinguish depression sub-types and can have a high discriminative validity in determining depression as well as predicting the response of a patient to certain types of treatment such as antidepressants [Sobin & Sackeim 1997]. Motor activity has recently been shown to be reduced in major depression [Volkers et al. 2003]. Research has also shown that there is a correlation between the relative level of physical activity and depression [Camacho et al. 1991]. Be-cause of this correlation, depression is a powerful discriminator between physically active and sedentary individuals [Lobstein et al. 1983].
It is well known that decreased social activity and social dys-function are symptoms of depression. The quantity and quality of social interaction has been shown to be negatively correlated to depression [Nezlek et al. 1994]. Research has related sociali-zation measures to mental health outcomes such as depression, and that these relations are very similar across ethnic groups [Knight et al. 1994]. In addition, social dysfunction disorders such as social phobia and avoidant personality disorder are of-

tentimes co-occurrent with major depressive disorders [Alpert et al. 1997].
Changes in diurnal sleep patterns, specifically disturbances of sleep, are typical for most depressed patients and also belong to one of the core symptom groups of the disorder. In fact, there is a strong bi-directional relationship between sleep, sleep altera-tions, and depression [Riemann et al. 2001]. Studies have shown that it is possible to artificially manipulate the sleep-wake cycle (such as sleep deprivation or a phase advance of the sleep pe-riod) which can contribute to mood regulation, alleviate depres-sion symptoms and can even lead to the remission of untreated depression [Cartwright et al. 2003].
While these behavioral symptoms are all highly discriminative in predicting depression, they have traditionally been very quali-tative in nature. Using the LiveNet platform, we now have the ability to precisely and quantitatively measure these symptoms to develop objective behavioral measures. For example, by us-ing accelerometers, we can measure the effects of psychomotor retardation on the level of gross body movement. These acceler-ometers can also be used to identify regions of physical activity, sleep, and sedentary behavioral states throughout the day. We can also use voice analysis techniques to detect the psychomotor retardation effects of depression on speech. Although not spe-cific to the study of depression, speaking patterns as measured by talk time and turn taking have long been used as an index of social interaction [Warner 1992, Watt 1996, Warner et al. 1987]. Thus, by quantifying the speech patterns in the audio data, we can develop an effective measure of social interaction of an individual.
It is proposed that the combination of physiologic and behav-ioral metrics discussed above would be complimentary in the study of response to treatment in clinical depression. In the fol-lowing sections, we show that models of depression that inte-grates behavioral and physiologic measures can be very accurate in determining depression state of a patient as well as trending the effects of treatment.
3. MGH Experimental Protocol
MGH Human Subjects Approval
To obtain human subjects approval, we needed to comply with both MIT’s Committee on the Use of Humans as Experimental Subjects (COUHES) Department as well as the Partner’s Healthcare Internal Review Board at MGH. For this, we needed to provide documentation detailing the experimental protocol, subject consent procedures, and subject recruitment. It was nec-essary to explicitly describe every type of data collected from the subjects as well the equipment used in the study. The Live-Net monitoring and sensing apparatus was inspected by the MGH Bioengineering Department in order to pass human safety inspection as well as RF communications regulations at the hospital. Also of particular interest was to make sure the proto-col passed the Health Information Privacy Act (HIPA) that pro-tects an individual’s right to maintain their health information privacy. In order to comply with these regulations, we had to make sure that personally identifiable subject information was not included in the data that was collected. Both COUHES and MGH IRB consent was given for the study by October, 2004.
MGH Subject Selection
For the study, we are recruiting clinically depressed patients admitted to the MGH Psychiatric Inpatient Unit for ECT treat-ment to be entered into the study. ECT treatment was chosen due to its relatively rapid onset of effect and the uniformity of treatment procedures. The targeted subject population consists of patients who are diagnosed with major depressive disorder by the DSM-IV criteria [DSM 1994] and have a HAM-D score > 20. Prior inpatient treatment is allowed but not within the last six months. The selection of subjects is limited to English-speaking individuals who are capable of understanding the ques-tions on the questionnaires. Subjects are limited to age 60 or less due to autonomic blunting inherent in normal aging.
To participate in the project, patient subjects must meet the fol-lowing inclusion and exclusion criteria:
Inclusion Criteria: (1) Age 18-60 (2) Willingness to give written informed consent (3) Meet DSM-IV criteria for Major Depres-sive Episode (4) HAM-D score > 20 upon initial evaluation.
Exclusion Criteria: (1) Unstable medical illness including car-diovascular, hepatic, renal, respiratory, endocrine, or neurologic disorders (including seizure disorder) (2) Substance use disorder active within the last six months or a positive drug screen (3) Psychotic features (current episode or lifetime) as assessed by admitting physician (4) Severe character pathology as assessed by evaluating clinician (5) Currently treated with a medication known to possess anticholinergic properties which is known to interfere with SC measures (e.g., tricyclic antidepressants, clozapine, benztropine) (6) Currently treated with a medication known to possess beta-blocking properties which is known to interfere with HR (e.g. propranolol, atenolol) (7) Clinical or laboratory evidence of hypothyroidism (8) Serious suicide or homicide risk as assessed by evaluating clinician so as to pre-vent access to monitoring wires (9) Inability to participate safely throughout the study period (3 or more episodes of self-injurious behavior in the past year, documented history of poor treatment adherence) (10) Prior ECT treatment within the last six months.
MGH Subject Recruitment
It is our goal to recruit a total of 20 clinically depressed patients for the study (at the time of writing, a total of six subjects have been run through the protocol). The patient subjects are re-cruited with the help of MGH Somatic Therapy support staff and psychiatrists to identify potential subjects. Each subject is given a copy of a recruitment flyer at the time of evaluation and consideration as an ECT candidate. Potential subjects are asked if they are interested in receiving a phone call to further explain the study and answer any questions they have prior to admis-sion. Following admission to the MGH Psychiatric Inpatient Unit for ECT, study staff determine the eligibility of the subject in coordination with the admitting psychiatrist. Interested sub-jects meeting inclusion and exclusion criteria are then given a full copy of the informed consent for further review and con-tacted by the principal investigator in order to obtain full con-sent. Written informed consent is obtained from all patient sub-jects and therapists before protocol-specific procedures are car-ried out. Subjects are paid $150 for participation in the study. If a study subject does not complete the full duration of the study, a prorated amount of $10 per day or $50 per week is paid.

MGH Experimental Procedures
Once a patient subject agrees to participate in the study by sign-ing informed consent, a full screening medical and psychiatric history is taken by the admitting psychiatrist and a laboratory examination (including thyroid screening and urine toxicology) is performed. Patient subjects are also asked to authorize their therapists to provide the study staff with specific clinical infor-mation about current medications and diagnosis. Subjects are asked about current medications, as well as current medical and psychiatric problems. All medication and dosing is recorded, and pre-treatment ratings for the clinical outcome measures is obtained. No other medical information is requested.
ECT therapy is performed at an inpatient unit where the patient stays for the duration of their ECT regiment, which can last anywhere between a few days to many weeks. After an initial evaluation period, a patient is scheduled for ECT therapy treat-ments three times a week, every Monday/Wednesday/Friday. The total number of ECT sessions is determined by patient re-sponse, and can vary between a few sessions to many sessions.
The study requires constant monitoring for the duration of a patient’s stay at the hospital during ECT treatment. Every morn-ing, the subject is attended to by study staff to help put on the LiveNet monitoring system, which is worn during all waking hours during the day. This equipment is used to monitor the patient Mondays through Fridays, as well as certain selected days on weekends when staff was available. At night before sleep, the subject removes the monitoring gear, which is stored by nursing staff and replaced by fresh gear in the morning by study staff. An armband monitor is left on the patient 24-hours a day, 7 days a week to be able to monitor and capture diurnal behavioral activity.
At the beginning and end of the hospital stay as well as once a week during the patient’s stay at the clinic, patient subjects complete a number of questionnaires administered by an attend-ing psychiatric doctor to obtain clinical outcomes (see descrip-tions below). Another simple self-reported questionnaire asking about the patient’s emotional response is also completed four times a day (before meals and prior to sleep).
4. MGH Sensing and Data Collection
A LiveNet system is used to provide the ambulatory monitoring equipment necessary to monitor the patient and collect the physiology and behavioral data for the study. The LiveNet sys-tem is configured for automated long-term continuous monitor-ing using the PatientMonitor and PatientTracker applications. The system is worn by the subject to collect data throughout the entire patient’s hospital stay.
Every morning, subjects are required to wear a LiveNet system in order to monitor their physiology and behavior during the waking day. The LiveNet system is composed of a small pouch, clipped around the waist like a fanny-pack that serves to record the data, and the associated physiological sensors that are placed on the body. This system is worn continuously while awake and taken off only for the purposes of showering or sleeping. An-other armband monitor is also worn continuously throughout the day and night (outside of showering) in order to provide con-tinuous behavioral data. This monitor is worn by the patient 24-hours a day, and even left on during the actual ECT treatment
sessions. Thus, we have the full suite of physiology and behav-ioral data collected from the subjects during the day throughout the course of the hospital stay and throughout ECT treatment as well as 24-hour behavioral monitoring that is useful for diurnal pattern recognition as well as potentially picking up physiology changes during ECT therapy.
In addition, several Bluetooth location beacons are placed in a number of spots within the ward (specifically, the patient’s room and in the common areas frequented by patients such as the ward hallway and common dining area). These beacon IDs are recorded by the LiveNet system worn by the patient using the PatientTracker application in order to track the high-level movement patterns of the patients as they moved throughout the ward.
Figure 1: LiveNet system and associated sensor network used for the MGH Depression Study. In this study, we are measuring body motion, skin conductance (on the fingers and back of the arm), heart rate, heat flux/temperature, and voice activity to find how these types of non-invasive physiology and derived behavioral measures correlate to depression. The patients wear the system continuously for the entire duration of their stay (typically ranging from two weeks onward) for electro-convulsive therapy at the MGH in-patient psychiatric ward.
Physiology and Behavioral Measures
Heart rate data is obtained using a non-invasive Polar heart strap worn around the chest underneath the clothing. This sensor can wirelessly transmit heart pulse timing to a receiver board inter-faced to the SAK2. The skin conductance sensors are attached to the non-dominant hand of the patient (i.e., the left hand in most subjects) and connected to the BioSense board in order to meas-ure skin conductance response in the fingers. The skin conduc-tance response is sampled at 50 Hz, more than enough resolu-tion to catch the short-term changes in response due to the auto-nomic nervous system. An accelerometer in the BioSense board is used to measure gross body motion of the patient throughout the day, sampled at 50 Hz. A microphone is clipped to the cloth-ing near the upper chest and interfaced with the LiveNet system.
The microphone is used to provide audio feature data, sampled at 8 KHz, to monitor the amount of vocal activity and the char-acteristics of speech. In order to protect the privacy of the sub-ject, the raw audio data is not recorded so that speech content cannot be extracted. Upper-arm skin response, motion, heat flux, and temperature data is obtained using the BodyMedia armband sensor, and is sampled at 30 samples per minute to provide coarser resolution behavioral data.
The behavioral measures were largely extracted through the use of the accelerometer data collected. As discussed in the back-ground depression section, activity, sedentary state, sleep, and restlessness have all been shown to be correlated to depression. These behavioral states can all be accurately detected by proc-essing the accelerometer data through the algorithms described in Section 4.7.
Clinical Psychiatric Outcome Measures
In addition to the physiological/contextual measures that are collected, a variety of clinical psychological measures related to depression state, in the form of questionnaires, are collected. These questionnaire forms, specifically the HAM-D, CGI, and QLS described below, are completed by a physician or filled out by the patient upon entering the ECT program, at weekly inter-vals during their stay on the ward, and the day of release from the hospital. Descriptions of these clinical scales are summa-rized below:
Hamilton Depression Rating Scale (HAM-D): The HAM-D is a widely used, 21-item screening instrument designed to meas-ure the severity of illness in adults diagnosed with depression. It contains items measuring somatic symptoms, insomnia, working capacity, mood, guilt, psychomotor retardation, agitation, and anxiety. The HAM-D has demonstrated validity and reliability for measuring response to treatment [Hamilton 1960].
Clinical Global Impressions (CGI): The CGI is a 3-item scale that is used to assess treatment response and is scored by the therapist based upon assessment of the patient’s clinical status. The scales are severity of illness, global improvement, and effi-cacy. Illness severity and improvement are rated on 7-point scales and efficacy is rated on a 4-point scale [Guy 1976].
Quality of Life Scale (QLS): The QLS measures patient satis-faction and enjoyment across multiple domains including physi-cal health, mood, work, household duties, school/course work, leisure activity, social relations and general activity [Endicott et al. 1993].
Using these various scales, we have clinically significant out-comes related to a subject’s depression and mood state marked at regularly spaced intervals throughout the course of treatment. We can use these clinical outcomes to objectively trend the per-formance of the treatment and quantify a subject’s progress over time. We attempt to correlate physiology and behavior to these clinical outcomes in addition to the subjective outcomes of mood reported by the subject, as described in the following section.
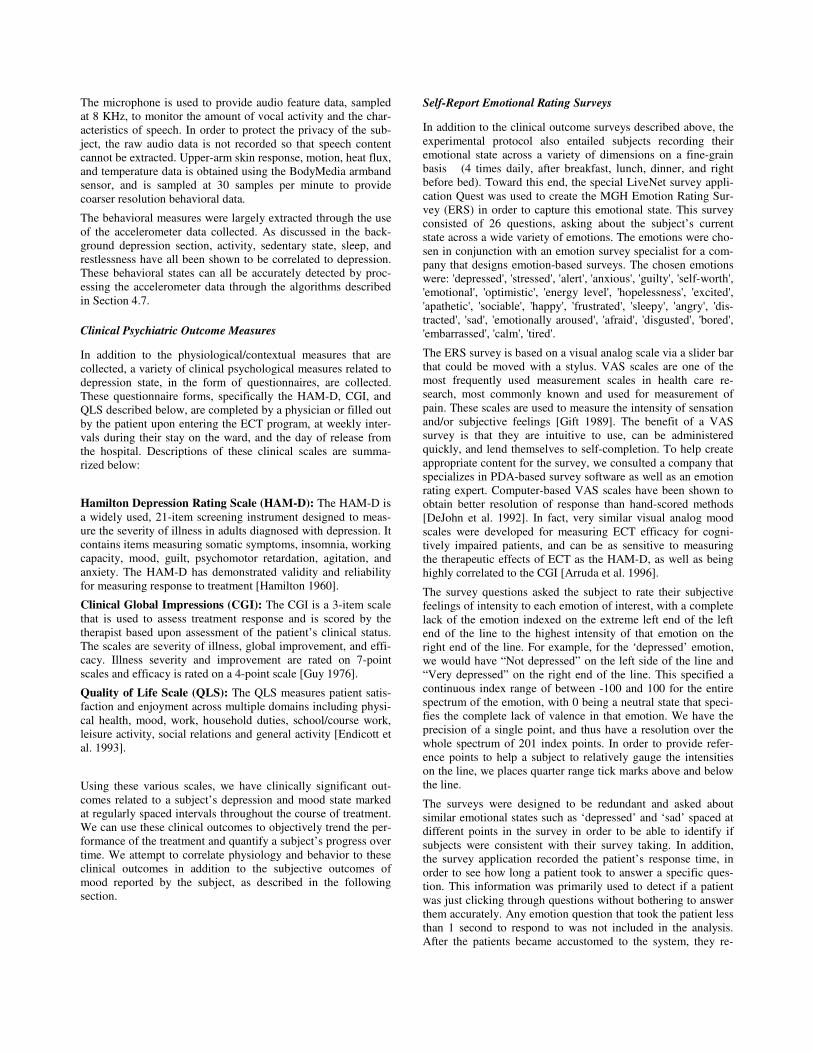
Self-Report Emotional Rating Surveys
In addition to the clinical outcome surveys described above, the experimental protocol also entailed subjects recording their emotional state across a variety of dimensions on a fine-grain basis (4 times daily, after breakfast, lunch, dinner, and right before bed). Toward this end, the special LiveNet survey appli-cation Quest was used to create the MGH Emotion Rating Sur-vey (ERS) in order to capture this emotional state. This survey consisted of 26 questions, asking about the subject’s current state across a wide variety of emotions. The emotions were cho-sen in conjunction with an emotion survey specialist for a com-pany that designs emotion-based surveys. The chosen emotions were: 'depressed', 'stressed', 'alert', 'anxious', 'guilty', 'self-worth', 'emotional', 'optimistic', 'energy level', 'hopelessness', 'excited', 'apathetic', 'sociable', 'happy', 'frustrated', 'sleepy', 'angry', 'dis-tracted', 'sad', 'emotionally aroused', 'afraid', 'disgusted', 'bored', 'embarrassed', 'calm', 'tired'.
The ERS survey is based on a visual analog scale via a slider bar that could be moved with a stylus. VAS scales are one of the most frequently used measurement scales in health care re-search, most commonly known and used for measurement of pain. These scales are used to measure the intensity of sensation and/or subjective feelings [Gift 1989]. The benefit of a VAS survey is that they are intuitive to use, can be administered quickly, and lend themselves to self-completion. To help create appropriate content for the survey, we consulted a company that specializes in PDA-based survey software as well as an emotion rating expert. Computer-based VAS scales have been shown to obtain better resolution of response than hand-scored methods [DeJohn et al. 1992]. In fact, very similar visual analog mood scales were developed for measuring ECT efficacy for cogni-tively impaired patients, and can be as sensitive to measuring the therapeutic effects of ECT as the HAM-D, as well as being highly correlated to the CGI [Arruda et al. 1996].
The survey questions asked the subject to rate their subjective feelings of intensity to each emotion of interest, with a complete lack of the emotion indexed on the extreme left end of the left end of the line to the highest intensity of that emotion on the right end of the line. For example, for the ‘depressed’ emotion, we would have “Not depressed” on the left side of the line and “Very depressed” on the right end of the line. This specified a continuous index range of between -100 and 100 for the entire spectrum of the emotion, with 0 being a neutral state that speci-fies the complete lack of valence in that emotion. We have the precision of a single point, and thus have a resolution over the whole spectrum of 201 index points. In order to provide refer-ence points to help a subject to relatively gauge the intensities on the line, we places quarter range tick marks above and below the line.
The surveys were designed to be redundant and asked about similar emotional states such as ‘depressed’ and ‘sad’ spaced at different points in the survey in order to be able to identify if subjects were consistent with their survey taking. In addition, the survey application recorded the patient’s response time, in order to see how long a patient took to answer a specific ques-tion. This information was primarily used to detect if a patient was just clicking through questions without bothering to answer them accurately. Any emotion question that took the patient less than 1 second to respond to was not included in the analysis. After the patients became accustomed to the system, they re-

ported that that emotion ratings survey was quite easy to fill out. The ERS survey could be completed in a few minutes.
The end of a survey allowed the patient to voluntarily record any additional relevant information regarding their emotional state, such as if they had visitors, extenuating circumstances, etc. A couple of the subjects provided quite insightful comments (e.g. a patient reporting on one survey that they just got a call from their boyfriend and were in a much happier mood as a result) that could potentially be useful in analyzing and under-standing the emotion rating data.
5. MGH Data Analysis
A total of six subjects were run through the experimental proto-col on the Blake11 Psychiatric Ward at MGH between January, 2005 and May, 2005. Of the six subjects, four of the subject runs consisting of two female and two male patients resulted in relatively complete sets of data through the duration of the ECT treatment stay (the first subject dropped out of the study within the first couple hours due to an anxiety attack because of the impending first-time ECT procedure, and the second subject run did not yield enough data because the subject exhibited psy-chotic tendencies and kept on taking off the monitoring appara-tus as well as being plagued with some procedural and technical issues). The dataset ranged from one week for the shortest stay, to one patient who stayed over 8 weeks. Average length of stay was 25.8 (± 26.2) days. These four data set runs formed the basis of the final data set that is used for analysis described be-low.
MGH Data Preprocessing
Each full day of patient recording resulted in up to nearly 1 GB of raw uncompressed physiological and audio data along with meta information such as timestamps, data type tags, etc. as well as information from the Bluetooth location beacons and subject-reported emotions rating data. It was common, however, that a day’s run did not generate a full gigabyte of data (either because the subject did not put on the monitoring gear until later in the day, or there were technical or procedural issues that prevented the system from recording properly). Also, the PatientMonitor application could encounter a system problem sporadically, and reset the system which starts a new log file. Thus, a day’s re-cording can result in multiple files that can vary in size, timing, and content between days.
The physiology data is first preprocessed by aligning and merg-ing and synchronizing the data files. The metadata is stripped and the data is aligned with timestamps. Each type of physiol-ogy data is then individually preprocessed and the all of the relevant features are generated. For all the physiology measures, the z-scored mean, standard deviation, max, max/min ratio, energy, entropy, first and second difference measures were cal-culated for the skin conductance, motion, heat flux, and tem-perature data. For the skin conductance response in particular, the data is first smoothed by convolving the signal with a 25-second Hanning window. For the skin conductance response, the standard features were normalized using the baseline normaliza-tion technique described by in Equation 4-19.
Since we are only interested in the gross body motion activity of the subject and not in a particular change in orientation, all three
channels of the 3D accelerometer data are first merged to create a single magnitude by taking the square root of the sum of the squares of each individual channel before the features are ex-tracted. The accelerometer data was also used to derive most of the behavioral features by passing them through the behavior classifiers for sleep, restlessness, sedentary behavior, and activ-ity behavior.
There are several data sampling rates used (50 Hz for the skin conductance and motion sensors, 0.5 Hz for the armband sen-sors, and 8 KHz for the audio). In order to synchronize and make the multimodal data streams uniform, we choose to down-sample the heterogeneous data into a common rate. All of the physiology data streams are uniformly down-sampled to the granularity of one sample per minute by chunking the data using minute-long averaging windows. While the data exists to be able to do more fine grain analysis, such as activity context from the accelerometer data, for our analysis we focus on more coarse-grain analysis that allows us to aggregate the physiology and behavioral data in such a fashion.
Audio data is processed separately. The raw signal is first passed through a number of scripts to generate the appropriate format for the speech segmentation algorithm. Since the seg-mentation algorithm requires a certain chunk in order to find the voicing and speech segments, we choose to divide the audio data into 10,000 1024-sample chunks (approximately 21.3 min-ute chunks). This allows the speech segmentation to proceed at a reasonable processing time. The data is also passed through a script to generate all of the 24 voice features described in Sec-tion 4.3.
The Bluetooth beacon data is preprocessed by using a script to strip out the location information from the Bluetooth IDs. While the PatientTracker software is primarily used to identify location beacons, it simply does a Bluetooth scan and records nearby enabled Bluetooth devices. As such, it oftentimes recorded the Bluetooth IDs of people carrying mobile phones and other de-vices. While this information can be used to effectively track the socialization patterns of the patient as well as timestamp interac-tion with study staff and visitors, for our initial analysis we do not consider this information and strip out any IDs that do not correspond to location beacons. By simply counting the result-ing location IDs, we can calculate the relative ratios of the time spent in the room and common areas.
For the subjects run through the protocol thus far, the heart rate data was corrupted due to the fact that the subject staff was not properly trained and placed the Polar receiver too close to a switching regulator on the SAK2 board. Thus, unfortunately, the acquired heart rate data was spotty and a systematic analysis has not been possible. This problem has been identified and fixed for future subject runs.
In the following analysis section, we first provide the analysis for Subject 6 as a case study of the analytical methodology that is used for every subject. We then summarize the results for each subject, and provide a longitudinal cross-subject analysis in order to identify the results from universal features that are common across subjects.
Raw Emotional Rating Survey Data
The emotional rating survey data for the subject is first manually cleaned by removing surveys that were incomplete or where it

was obvious that the subject did not fill out the survey appropri-ately (such as spending less than one second on each question with default value of ‘0’ recorded). The following charts show the self-reported data for Subject 6 through the duration of stay for treatment on the ward.
From the subject’s self-reported data, it is apparent that ECT treatment was successful. Looking at the relative trends for cor-related outcomes such as depression, guilt, feelings of hopeless-ness, and sadness, they all significantly decrease approximately midway through the treatment process (in week two of the sub-ject’s 3 week stay), while feelings of self-worth, optimism, en-ergy levels, and sociability all increase over the same period.
It is observed in the ERS data that particular emotion ratings can fluctuate over a large range due to individual circumstance (ef-fects of visitors, random events, even time of day). Studies have shown that there can be diurnal variations in mood (morning-worse or evening worse patterns) for different types of depres-sion and chronic dysthymia [Rusting & Larsen 1998]. To con-trol for diurnal mood variations as well as to reduce the effects of random fluctuations in emotions, we aggregate the emotion and physiology behavioral sensing data over larger windows to see if we can correlate any features at the granularity of days. Since we are more interested in being able to trend a patient’s baseline depression and emotions over long periods of time rather than trying to predict their instantaneous mood at the time of taking a survey, the resolution of a single day is about right.
Figure 2: Self-reported emotion rating data for Subject 6 over a 3-week treatment period. Each scale varies from between -100 to 100 on the y-axis, and time progresses to the right. We can see from the ratings that the ECT treatment was successful. Looking at the rela-tive trends for correlated outcomes such as depression, guilt, feel-ings of hopelessness, and sadness, they all significantly decrease approximately midway through the treatment process (in week two of the subject’s 3 week stay), while feelings of self-worth, optimism, energy levels, and sociability all increase over the same period.
The statistical characteristics of this aggregated emotional rating data (at the granularity of a day) for Subject 6 is summarized below.
Figure 3: Box and whisker plot of daily-averaged emotion rating data for Subject 6. Boxes have lines at the lower quartile, median (red), and upper quartile values, and whiskers show extent of the rest of the data. Outliers are shown as ‘+’s beyond the ends of the whiskers. We can see that from the diagram that there is a high degree of variation in many of the emotion ratings of interest, spe-cifically those related to depression.
We can see from this diagram that there is a high degree of variation in many of the emotions ratings of interest, specifically those related to depression. This variation in the data may be due to natural fluctuation in the daily moods of the patient, but also is in line with the fact that the treatment process has caused a permanent change in the baseline mood of the patient over time. In contrast, a few emotions ratings, such as ‘bored’ and ‘alert’ for this particular subject do not change very much at all over the treatment, as is expected. A patient could be expected to be suffer from ennui regardless of the treatment, as the ward has very little to offer by way of entertainment. Likewise, for this patient, we see that in general the ECT therapy did not af-fect the overall alertness of the patient, despite the known short-term grogginess and confusion that may occur immediately following an ECT treatment session.
In general, the emotions of depression, guilt, feelings of hope-lessness, sadness, self-worth, optimism, energy levels, and so-ciability for all the subjects in the study improved for the better through the course of ECT treatment. Many of the other emo-tions on the ERS survey are also commonly associated or are co-factors to depression, most notably anxiety, embarrassment, guilt, distractedness, and apathy. The manifestations of these emotions were not universally consistent in all of the subjects, and are more idiosyncratic to the individual circumstances of each patient.
Decomposing the Emotion Rating Data
Since the emotions used for the ERS survey were picked to capture the various facets of mood related to depression, there is a great deal of redundancy in the emotion ratings data. In order to investigate the underlying structure in the data, we can do a principal component analysis and look at the resulting principal component feature space. We can see the top eigenvalues of the resulting decomposition for the ERS data of Subject 6 in the following Pareto diagram:
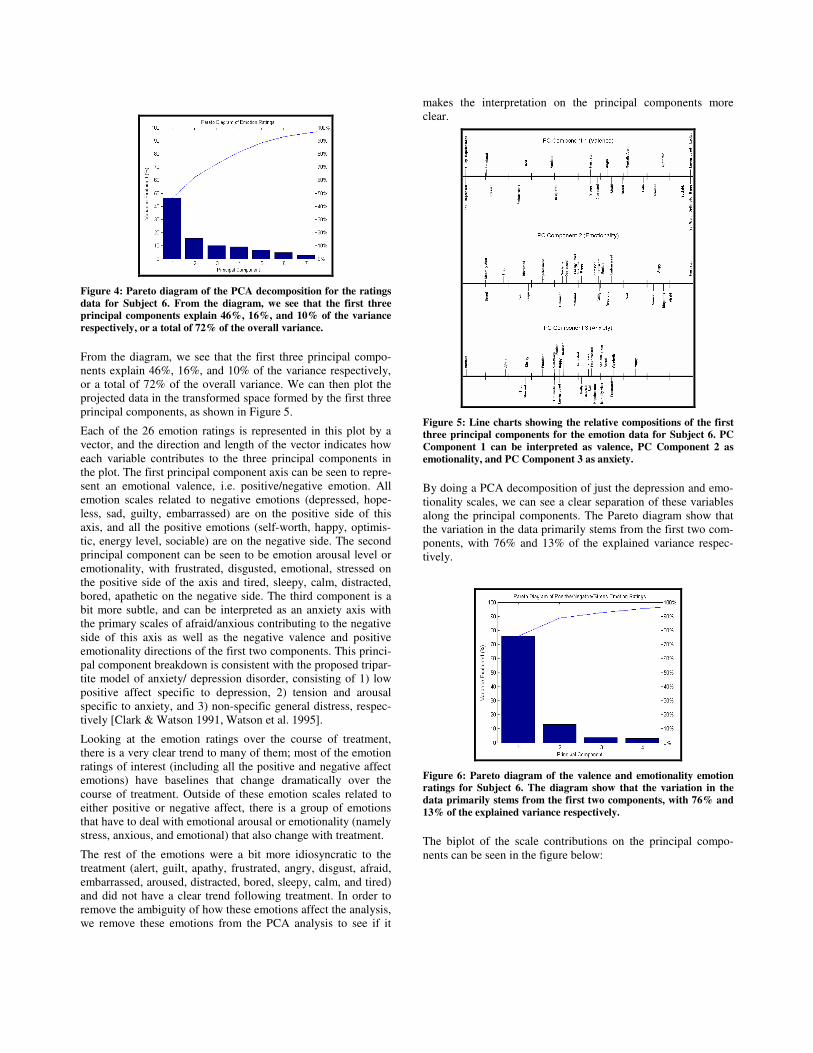
Figure 4: Pareto diagram of the PCA decomposition for the ratings data for Subject 6. From the diagram, we see that the first three principal components explain 46%, 16%, and 10% of the variance respectively, or a total of 72% of the overall variance.
From the diagram, we see that the first three principal compo-nents explain 46%, 16%, and 10% of the variance respectively, or a total of 72% of the overall variance. We can then plot the projected data in the transformed space formed by the first three principal components, as shown in Figure 5.
Each of the 26 emotion ratings is represented in this plot by a vector, and the direction and length of the vector indicates how each variable contributes to the three principal components in the plot. The first principal component axis can be seen to repre-sent an emotional valence, i.e. positive/negative emotion. All emotion scales related to negative emotions (depressed, hope-less, sad, guilty, embarrassed) are on the positive side of this axis, and all the positive emotions (self-worth, happy, optimis-tic, energy level, sociable) are on the negative side. The second principal component can be seen to be emotion arousal level or emotionality, with frustrated, disgusted, emotional, stressed on the positive side of the axis and tired, sleepy, calm, distracted, bored, apathetic on the negative side. The third component is a bit more subtle, and can be interpreted as an anxiety axis with the primary scales of afraid/anxious contributing to the negative side of this axis as well as the negative valence and positive emotionality directions of the first two components. This princi-pal component breakdown is consistent with the proposed tripar-tite model of anxiety/ depression disorder, consisting of 1) low positive affect specific to depression, 2) tension and arousal specific to anxiety, and 3) non-specific general distress, respec-tively [Clark & Watson 1991, Watson et al. 1995].
Looking at the emotion ratings over the course of treatment, there is a very clear trend to many of them; most of the emotion ratings of interest (including all the positive and negative affect emotions) have baselines that change dramatically over the course of treatment. Outside of these emotion scales related to either positive or negative affect, there is a group of emotions that have to deal with emotional arousal or emotionality (namely stress, anxious, and emotional) that also change with treatment.
The rest of the emotions were a bit more idiosyncratic to the treatment (alert, guilt, apathy, frustrated, angry, disgust, afraid, embarrassed, aroused, distracted, bored, sleepy, calm, and tired) and did not have a clear trend following treatment. In order to remove the ambiguity of how these emotions affect the analysis, we remove these emotions from the PCA analysis to see if it
makes the interpretation on the principal components more clear.
Figure 5: Line charts showing the relative compositions of the first three principal components for the emotion data for Subject 6. PC Component 1 can be interpreted as valence, PC Component 2 as emotionality, and PC Component 3 as anxiety.
By doing a PCA decomposition of just the depression and emo-tionality scales, we can see a clear separation of these variables along the principal components. The Pareto diagram show that the variation in the data primarily stems from the first two com-ponents, with 76% and 13% of the explained variance respec-tively.
Figure 6: Pareto diagram of the valence and emotionality emotion ratings for Subject 6. The diagram show that the variation in the data primarily stems from the first two components, with 76% and 13% of the explained variance respectively.
The biplot of the scale contributions on the principal compo-nents can be seen in the figure below:
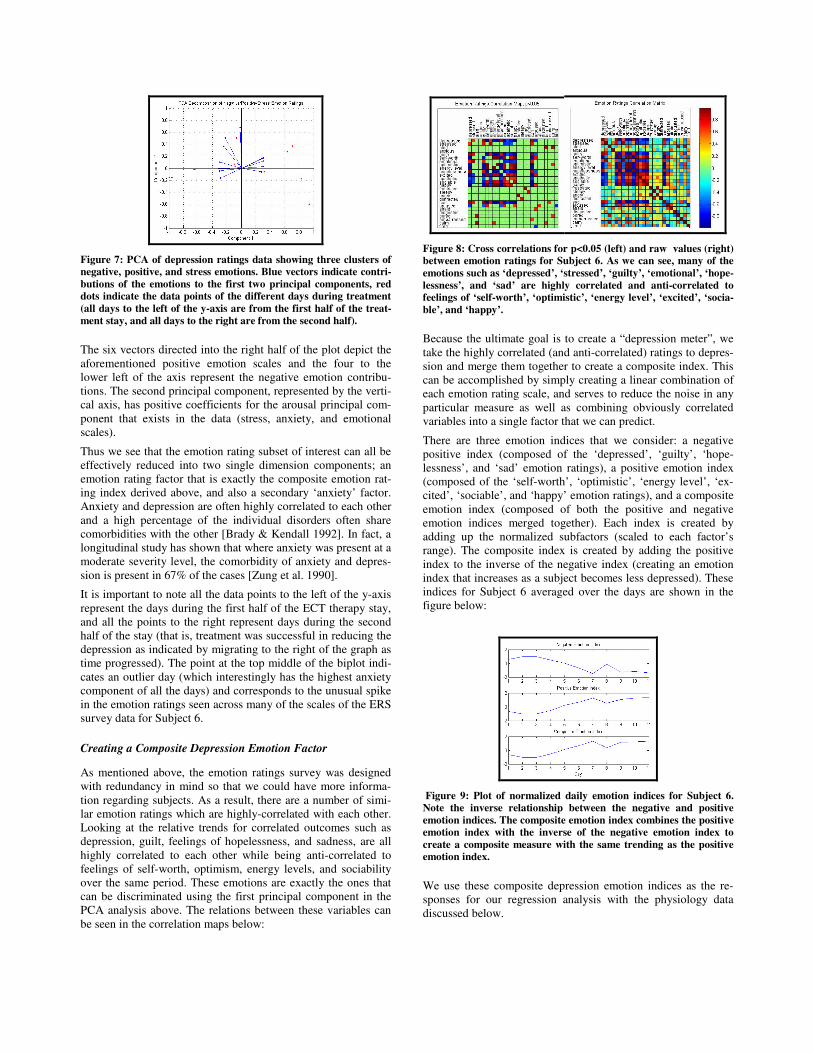
Figure 7: PCA of depression ratings data showing three clusters of negative, positive, and stress emotions. Blue vectors indicate contri-butions of the emotions to the first two principal components, red dots indicate the data points of the different days during treatment (all days to the left of the y-axis are from the first half of the treat-ment stay, and all days to the right are from the second half).
The six vectors directed into the right half of the plot depict the aforementioned positive emotion scales and the four to the lower left of the axis represent the negative emotion contribu-tions. The second principal component, represented by the verti-cal axis, has positive coefficients for the arousal principal com-ponent that exists in the data (stress, anxiety, and emotional scales).
Thus we see that the emotion rating subset of interest can all be effectively reduced into two single dimension components; an emotion rating factor that is exactly the composite emotion rat-ing index derived above, and also a secondary ‘anxiety’ factor. Anxiety and depression are often highly correlated to each other and a high percentage of the individual disorders often share comorbidities with the other [Brady & Kendall 1992]. In fact, a longitudinal study has shown that where anxiety was present at a moderate severity level, the comorbidity of anxiety and depres-sion is present in 67% of the cases [Zung et al. 1990].
It is important to note all the data points to the left of the y-axis represent the days during the first half of the ECT therapy stay, and all the points to the right represent days during the second half of the stay (that is, treatment was successful in reducing the depression as indicated by migrating to the right of the graph as time progressed). The point at the top middle of the biplot indi-cates an outlier day (which interestingly has the highest anxiety component of all the days) and corresponds to the unusual spike in the emotion ratings seen across many of the scales of the ERS survey data for Subject 6.
Creating a Composite Depression Emotion Factor
As mentioned above, the emotion ratings survey was designed with redundancy in mind so that we could have more informa-tion regarding subjects. As a result, there are a number of simi-lar emotion ratings which are highly-correlated with each other. Looking at the relative trends for correlated outcomes such as depression, guilt, feelings of hopelessness, and sadness, are all highly correlated to each other while being anti-correlated to feelings of self-worth, optimism, energy levels, and sociability over the same period. These emotions are exactly the ones that can be discriminated using the first principal component in the PCA analysis above. The relations between these variables can be seen in the correlation maps below:
Figure 8: Cross correlations for p<0.05 (left) and raw values (right) between emotion ratings for Subject 6. As we can see, many of the emotions such as ‘depressed’, ‘stressed’, ‘guilty’, ‘emotional’, ‘hope-lessness’, and ‘sad’ are highly correlated and anti-correlated to feelings of ‘self-worth’, ‘optimistic’, ‘energy level’, ‘excited’, ‘socia-ble’, and ‘happy’.
Because the ultimate goal is to create a “depression meter”, we take the highly correlated (and anti-correlated) ratings to depres-sion and merge them together to create a composite index. This can be accomplished by simply creating a linear combination of each emotion rating scale, and serves to reduce the noise in any particular measure as well as combining obviously correlated variables into a single factor that we can predict.
There are three emotion indices that we consider: a negative positive index (composed of the ‘depressed’, ‘guilty’, ‘hope-lessness’, and ‘sad’ emotion ratings), a positive emotion index (composed of the ‘self-worth’, ‘optimistic’, ‘energy level’, ‘ex-cited’, ‘sociable’, and ‘happy’ emotion ratings), and a composite emotion index (composed of both the positive and negative emotion indices merged together). Each index is created by adding up the normalized subfactors (scaled to each factor’s range). The composite index is created by adding the positive index to the inverse of the negative index (creating an emotion index that increases as a subject becomes less depressed). These indices for Subject 6 averaged over the days are shown in the figure below:
Figure 9: Plot of normalized daily emotion indices for Subject 6. Note the inverse relationship between the negative and positive emotion indices. The composite emotion index combines the positive emotion index with the inverse of the negative emotion index to create a composite measure with the same trending as the positive emotion index.
We use these composite depression emotion indices as the re-sponses for our regression analysis with the physiology data discussed below.
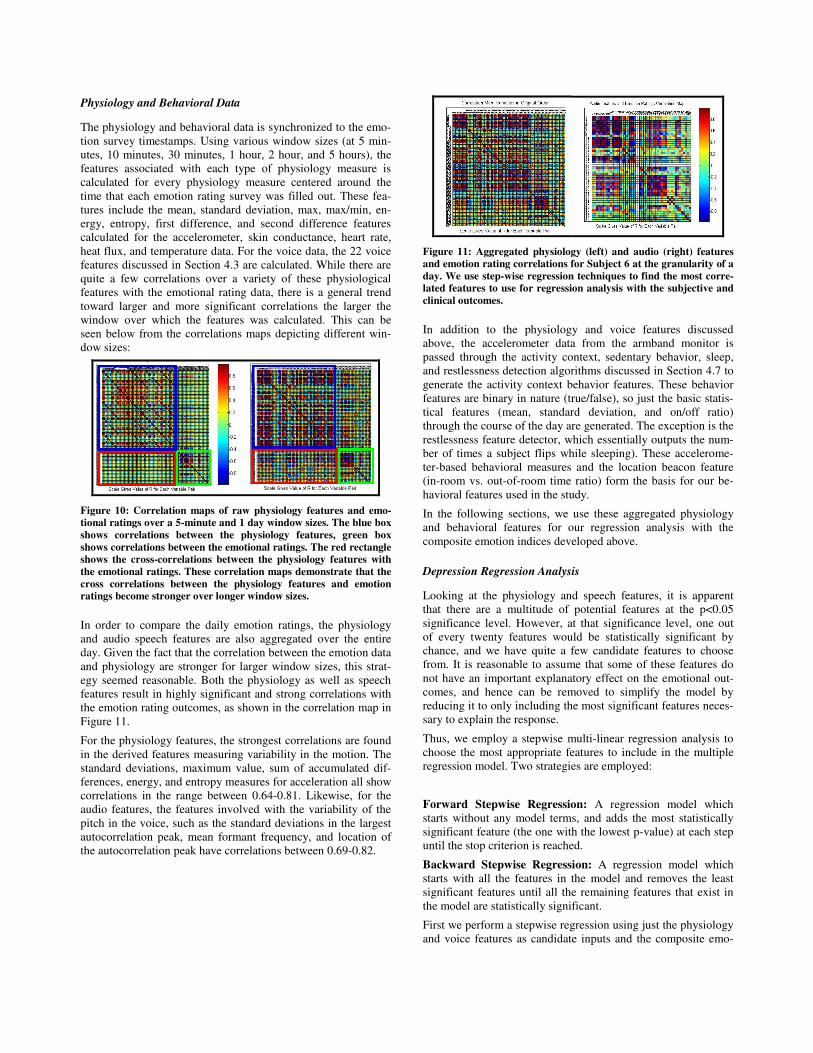
Physiology and Behavioral Data
The physiology and behavioral data is synchronized to the emo-tion survey timestamps. Using various window sizes (at 5 min-utes, 10 minutes, 30 minutes, 1 hour, 2 hour, and 5 hours), the features associated with each type of physiology measure is calculated for every physiology measure centered around the time that each emotion rating survey was filled out. These fea-tures include the mean, standard deviation, max, max/min, en-ergy, entropy, first difference, and second difference features calculated for the accelerometer, skin conductance, heart rate, heat flux, and temperature data. For the voice data, the 22 voice features discussed in Section 4.3 are calculated. While there are quite a few correlations over a variety of these physiological features with the emotional rating data, there is a general trend toward larger and more significant correlations the larger the window over which the features was calculated. This can be seen below from the correlations maps depicting different win-dow sizes:
Figure 10: Correlation maps of raw physiology features and emo-tional ratings over a 5-minute and 1 day window sizes. The blue box shows correlations between the physiology features, green box shows correlations between the emotional ratings. The red rectangle shows the cross-correlations between the physiology features with the emotional ratings. These correlation maps demonstrate that the cross correlations between the physiology features and emotion ratings become stronger over longer window sizes.
In order to compare the daily emotion ratings, the physiology and audio speech features are also aggregated over the entire day. Given the fact that the correlation between the emotion data and physiology are stronger for larger window sizes, this strat-egy seemed reasonable. Both the physiology as well as speech features result in highly significant and strong correlations with the emotion rating outcomes, as shown in the correlation map in Figure 11.
For the physiology features, the strongest correlations are found in the derived features measuring variability in the motion. The standard deviations, maximum value, sum of accumulated dif-ferences, energy, and entropy measures for acceleration all show correlations in the range between 0.64-0.81. Likewise, for the audio features, the features involved with the variability of the pitch in the voice, such as the standard deviations in the largest autocorrelation peak, mean formant frequency, and location of the autocorrelation peak have correlations between 0.69-0.82.
Figure 11: Aggregated physiology (left) and audio (right) features and emotion rating correlations for Subject 6 at the granularity of a day. We use step-wise regression techniques to find the most corre-lated features to use for regression analysis with the subjective and clinical outcomes.
In addition to the physiology and voice features discussed above, the accelerometer data from the armband monitor is passed through the activity context, sedentary behavior, sleep, and restlessness detection algorithms discussed in Section 4.7 to generate the activity context behavior features. These behavior features are binary in nature (true/false), so just the basic statis-tical features (mean, standard deviation, and on/off ratio) through the course of the day are generated. The exception is the restlessness feature detector, which essentially outputs the num-ber of times a subject flips while sleeping). These accelerome-ter-based behavioral measures and the location beacon feature (in-room vs. out-of-room time ratio) form the basis for our be-havioral features used in the study.
In the following sections, we use these aggregated physiology and behavioral features for our regression analysis with the composite emotion indices developed above.
Depression Regression Analysis
Looking at the physiology and speech features, it is apparent that there are a multitude of potential features at the p<0.05 significance level. However, at that significance level, one out of every twenty features would be statistically significant by chance, and we have quite a few candidate features to choose from. It is reasonable to assume that some of these features do not have an important explanatory effect on the emotional out-comes, and hence can be removed to simplify the model by reducing it to only including the most significant features neces-sary to explain the response.
Thus, we employ a stepwise multi-linear regression analysis to choose the most appropriate features to include in the multiple regression model. Two strategies are employed:
Forward Stepwise Regression: A regression model which starts without any model terms, and adds the most statistically significant feature (the one with the lowest p-value) at each step until the stop criterion is reached.
Backward Stepwise Regression: A regression model which starts with all the features in the model and removes the least significant features until all the remaining features that exist in the model are statistically significant.
First we perform a stepwise regression using just the physiology and voice features as candidate inputs and the composite emo-
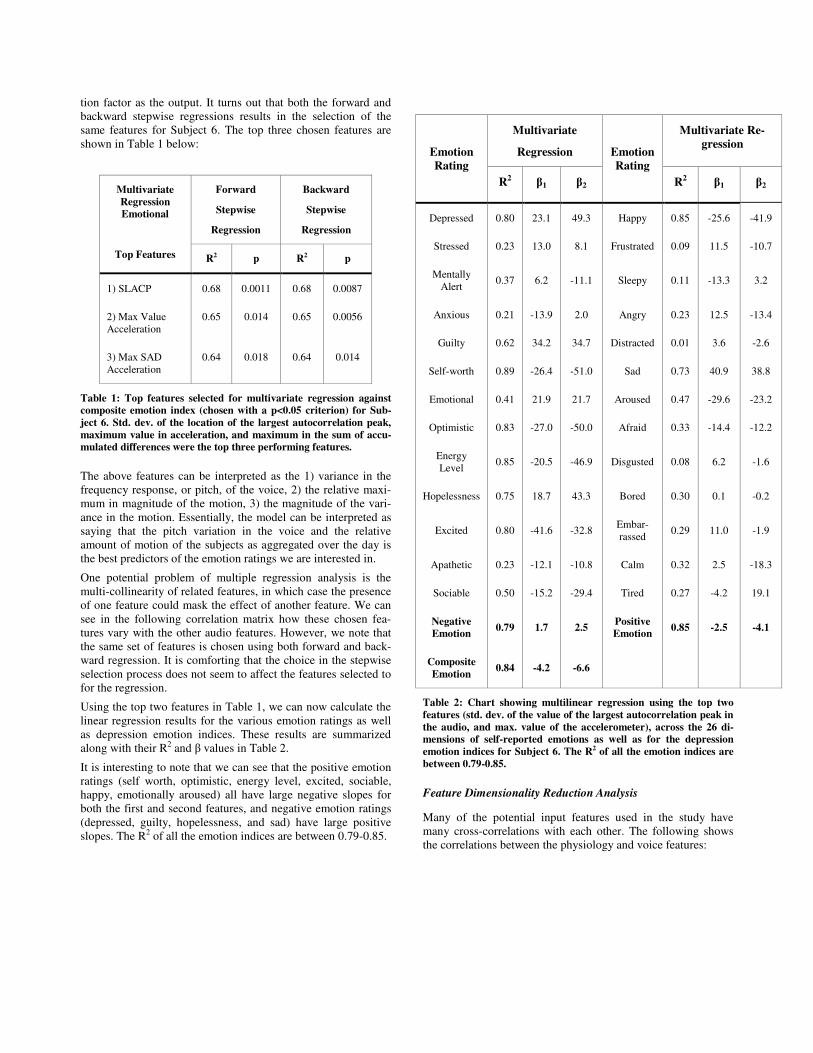
tion factor as the output. It turns out that both the forward and backward stepwise regressions results in the selection of the same features for Subject 6. The top three chosen features are shown in Table 1 below:
Forward
Stepwise
Regression
Backward
Stepwise
Regression
Multivariate Regression Emotional
Top Features R2 p R2 p
1) SLACP 0.68 0.0011 0.68 0.0087
2) Max Value Acceleration
0.65 0.014 0.65 0.0056
3) Max SAD Acceleration
0.64 0.018 0.64 0.014
Table 1: Top features selected for multivariate regression against composite emotion index (chosen with a p<0.05 criterion) for Sub-ject 6. Std. dev. of the location of the largest autocorrelation peak, maximum value in acceleration, and maximum in the sum of accu-mulated differences were the top three performing features.
The above features can be interpreted as the 1) variance in the frequency response, or pitch, of the voice, 2) the relative maxi-mum in magnitude of the motion, 3) the magnitude of the vari-ance in the motion. Essentially, the model can be interpreted as saying that the pitch variation in the voice and the relative amount of motion of the subjects as aggregated over the day is the best predictors of the emotion ratings we are interested in.
One potential problem of multiple regression analysis is the multi-collinearity of related features, in which case the presence of one feature could mask the effect of another feature. We can see in the following correlation matrix how these chosen fea-tures vary with the other audio features. However, we note that the same set of features is chosen using both forward and back-ward regression. It is comforting that the choice in the stepwise selection process does not seem to affect the features selected to for the regression.
Using the top two features in Table 1, we can now calculate the linear regression results for the various emotion ratings as well as depression emotion indices. These results are summarized along with their R2 and � values in Table 2.
It is interesting to note that we can see that the positive emotion ratings (self worth, optimistic, energy level, excited, sociable, happy, emotionally aroused) all have large negative slopes for both the first and second features, and negative emotion ratings (depressed, guilty, hopelessness, and sad) have large positive slopes. The R2 of all the emotion indices are between 0.79-0.85.
Multivariate
Regression
Multivariate Re-gression
Emotion Rating
R2 �1 �2
Emotion Rating
R2 �1 �2
Depressed 0.80 23.1 49.3 Happy 0.85 -25.6 -41.9
Stressed 0.23 13.0 8.1 Frustrated 0.09 11.5 -10.7
Mentally Alert 0.37 6.2 -11.1 Sleepy 0.11 -13.3 3.2
Anxious 0.21 -13.9 2.0 Angry 0.23 12.5 -13.4
Guilty 0.62 34.2 34.7 Distracted 0.01 3.6 -2.6
Self-worth 0.89 -26.4 -51.0 Sad 0.73 40.9 38.8
Emotional 0.41 21.9 21.7 Aroused 0.47 -29.6 -23.2
Optimistic 0.83 -27.0 -50.0 Afraid 0.33 -14.4 -12.2
Energy Level 0.85 -20.5 -46.9 Disgusted 0.08 6.2 -1.6
Hopelessness 0.75 18.7 43.3 Bored 0.30 0.1 -0.2
Excited 0.80 -41.6 -32.8 Embar-rassed 0.29 11.0 -1.9
Apathetic 0.23 -12.1 -10.8 Calm 0.32 2.5 -18.3
Sociable 0.50 -15.2 -29.4 Tired 0.27 -4.2 19.1
Negative Emotion 0.79 1.7 2.5 Positive
Emotion 0.85 -2.5 -4.1
Composite Emotion 0.84 -4.2 -6.6
Table 2: Chart showing multilinear regression using the top two features (std. dev. of the value of the largest autocorrelation peak in the audio, and max. value of the accelerometer), across the 26 di-mensions of self-reported emotions as well as for the depression emotion indices for Subject 6. The R2 of all the emotion indices are between 0.79-0.85.
Feature Dimensionality Reduction Analysis
Many of the potential input features used in the study have many cross-correlations with each other. The following shows the correlations between the physiology and voice features:
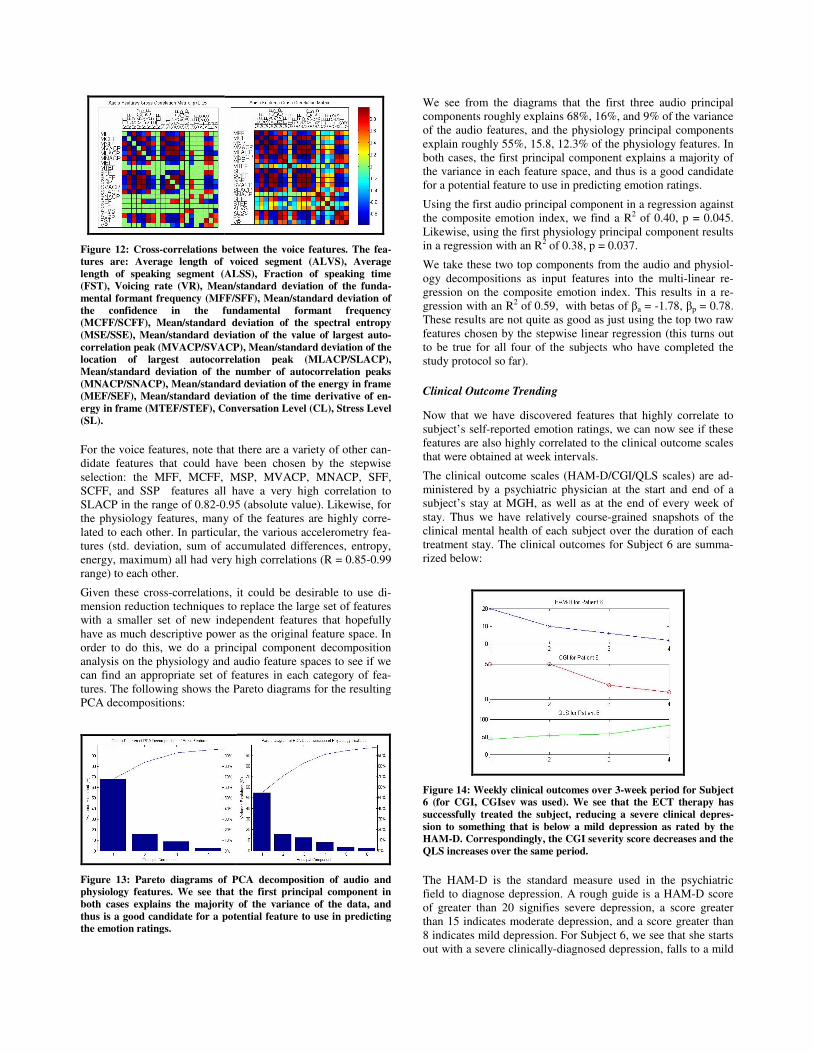
Figure 12: Cross-correlations between the voice features. The fea-tures are: Average length of voiced segment (ALVS), Average length of speaking segment (ALSS), Fraction of speaking time (FST), Voicing rate (VR), Mean/standard deviation of the funda-mental formant frequency (MFF/SFF), Mean/standard deviation of the confidence in the fundamental formant frequency (MCFF/SCFF), Mean/standard deviation of the spectral entropy (MSE/SSE), Mean/standard deviation of the value of largest auto-correlation peak (MVACP/SVACP), Mean/standard deviation of the location of largest autocorrelation peak (MLACP/SLACP), Mean/standard deviation of the number of autocorrelation peaks (MNACP/SNACP), Mean/standard deviation of the energy in frame (MEF/SEF), Mean/standard deviation of the time derivative of en-ergy in frame (MTEF/STEF), Conversation Level (CL), Stress Level (SL).
For the voice features, note that there are a variety of other can-didate features that could have been chosen by the stepwise selection: the MFF, MCFF, MSP, MVACP, MNACP, SFF, SCFF, and SSP features all have a very high correlation to SLACP in the range of 0.82-0.95 (absolute value). Likewise, for the physiology features, many of the features are highly corre-lated to each other. In particular, the various accelerometry fea-tures (std. deviation, sum of accumulated differences, entropy, energy, maximum) all had very high correlations (R = 0.85-0.99 range) to each other.
Given these cross-correlations, it could be desirable to use di-mension reduction techniques to replace the large set of features with a smaller set of new independent features that hopefully have as much descriptive power as the original feature space. In order to do this, we do a principal component decomposition analysis on the physiology and audio feature spaces to see if we can find an appropriate set of features in each category of fea-tures. The following shows the Pareto diagrams for the resulting PCA decompositions:
Figure 13: Pareto diagrams of PCA decomposition of audio and physiology features. We see that the first principal component in both cases explains the majority of the variance of the data, and thus is a good candidate for a potential feature to use in predicting the emotion ratings.
We see from the diagrams that the first three audio principal components roughly explains 68%, 16%, and 9% of the variance of the audio features, and the physiology principal components explain roughly 55%, 15.8, 12.3% of the physiology features. In both cases, the first principal component explains a majority of the variance in each feature space, and thus is a good candidate for a potential feature to use in predicting emotion ratings.
Using the first audio principal component in a regression against the composite emotion index, we find a R2 of 0.40, p = 0.045. Likewise, using the first physiology principal component results in a regression with an R2 of 0.38, p = 0.037.
We take these two top components from the audio and physiol-ogy decompositions as input features into the multi-linear re-gression on the composite emotion index. This results in a re-gression with an R2 of 0.59, with betas of �a = -1.78, �p = 0.78. These results are not quite as good as just using the top two raw features chosen by the stepwise linear regression (this turns out to be true for all four of the subjects who have completed the study protocol so far).
Clinical Outcome Trending
Now that we have discovered features that highly correlate to subject’s self-reported emotion ratings, we can now see if these features are also highly correlated to the clinical outcome scales that were obtained at week intervals.
The clinical outcome scales (HAM-D/CGI/QLS scales) are ad-ministered by a psychiatric physician at the start and end of a subject’s stay at MGH, as well as at the end of every week of stay. Thus we have relatively course-grained snapshots of the clinical mental health of each subject over the duration of each treatment stay. The clinical outcomes for Subject 6 are summa-rized below:
Figure 14: Weekly clinical outcomes over 3-week period for Subject 6 (for CGI, CGIsev was used). We see that the ECT therapy has successfully treated the subject, reducing a severe clinical depres-sion to something that is below a mild depression as rated by the HAM-D. Correspondingly, the CGI severity score decreases and the QLS increases over the same period.
The HAM-D is the standard measure used in the psychiatric field to diagnose depression. A rough guide is a HAM-D score of greater than 20 signifies severe depression, a score greater than 15 indicates moderate depression, and a score greater than 8 indicates mild depression. For Subject 6, we see that she starts out with a severe clinically-diagnosed depression, falls to a mild

depression after the first week of treatment, and is well on her way to recovery with a HAM-D score of 6 by the end of week 2.
The CGI is another clinical measure for assessing the depression level of a patient, and ranges between 3 (no depression) to 21 (very high depression). For Subject 6, the composite CGI scale was not obtained for the start so we use the severity measure subcomponent (which ranges from between 1 to 5) as proxy.
The QLS is a self-reported questionnaire asking about a pa-tient’s quality of life across a variety of dimensions of daily life (ranging from physical, social, work, household, classes, and leisure activities). Because some activities are not applicable in the in-ward setting at the hospital, instead of using the strict value of the QLS measure, we calculate a scaled percentage metric based on the ratio of the raw score to the maximum total score based on applicable questions. We see that the Subject 6’s QLS scores under 50% the first week, improves slightly in weeks 2 and 3, and then jumps up at the end of her treatment.
An interesting question to ask is how the subject’s self reported data and derived composite emotion indices correlates to these clinical measures. These correlations are shown in the correla-tion matrix below:
Figure 15: Correlation matrix of clinical outcomes and self-reported emotion indices (PSD = patient self-reported depression, -EF = negative emotion index, +EF = positive emotion index, CEF = com-posite emotion index). All correlations are in the range between 0.82-0.99.
We see that there are very strong positive correlations between the HAM-D, CGI, and negative emotion factor, as expected. Likewise, there are strong correlations between the QLS, the positive emotion factor, and the composite emotion factor (which was defined to be a positive emotion factor). These cor-relations indicate that the features that are relevant for the com-posite emotion indices are also very relevant for predicting the clinical outcomes as well.
Using the top two features picked for the composite emotion index, we get the following regression results when run on the clinical outcomes.
Multivariate
Regression
Clinical Outcome
R2 �1 �2
HAM-D 0.69 -0.02 2.48
CGI 0.94 -6.7 52.4
QLS 0.49 0.45 -2.82
Table 3: Clinical outcome regression results for Subject 6 using top two features chosen in stepwise regression analysis for the compos-ite emotion index, along with their betas.
While these regression results are not quite as good as with the self-reported emotion indices, they are still fairly accurate.
ECT vs. non-ECT days
One important aspect of the analysis thus far ignored was the fact that ECT treatment can result in changes in emotions and physiology. There is not a complete theory of why ECT treat-ment works, despite the fact that ECT is one of the most effec-tive treatments known (80% of subjects who do not respond to medication and other treatments become significantly improved following ECT). ECT works by running a current through the head, essentially shocking the brain and inducing a controlled seizure. While there are no serious long-term effects, immedi-ately after treatment ECT can cause somatic side effects such as nausea, tiredness, muscle aches and other physical discomfort as well as cognitive side effects such as headaches, disorienta-tion/confusion, and short-term memory loss.
For the subjects in the protocol, ECT treatment is normally initi-ated three times a week, every Monday/Wednesday/Friday in the early morning during the length of stay in the ward. Given the potential side effects of the treatment, it very plausible that ECT can cause the mood of subjects to change temporarily. The effects of ECT vary between subjects, we find the corresponding short-term swings in emotions to vary as well. Some subjects, such as Subject 6, did not exhibit negative symptoms related to the ECT treatment. Other, such as Subject 3, reacted to the ECT treatment which resulted in temporary shifts in emotion, typi-cally registered during the days of treatments right after an ECT session. These changes in emotion can be, at the least, partially explained by the physical discomfort reported by the patient.
Because the LiveNet systems were worn 24-hours a day, the monitoring systems were even present during the actual electro-shock therapy sessions. This offers the unique ability for us to monitor the physiological effects of ECT therapy before, after, and even during the treatment process itself. However, despite the potential shifts in physiology that occur during the ECT therapy itself and the short term mood swings that can result due to the side effects, we could find no strong relation correlating the aggregate physiology between ECT days and non-ECT days. Correlations comparing the physiology for the subjects were found between 0.09-0.15, or slightly better than chance. Non-supervised clustering analysis was also unable to partition the observational days based on the voice or physiology features alone (in contrast to using these features to cluster the depres-sion state of the individual), indicating that outside of short-term

changes, there were no aggregated physiology shifts that could be detected at the granularity of a day. This perhaps is a good thing in terms of the subject, indicating that there are no long-term physiology changes as a result of ECT treatment and any changes in physiology can be accounted for by the improvement in depression state.
In fact, existing research seems to confirm this finding; studies investigating the side effects of ECT could find no long-term cognitive effects following ECT, and any subjective somatic side effects during the ECT course did not change from pre-ECT measurements, suggesting that somatic side effects are related to depressive state rather than being induced by ECT [Devanand et al. 1995]. Another study corroborates this finding, reporting that the subjective side effects experienced by patients is related to depression level, and improvement in depression correlated with corresponding reductions in side effect burden [Brodaty et al. 2001].
Correlating Behavioral Features
It is very clear from the literature described in Section 7.2 that depressed patients readily exhibit behavioral changes as well as changes in socialization patterns. In addition to the raw physiol-ogy and audio features that were recorded there are some obvi-ous behavioral features that are readily derived from the data collected in the study. Using the LiveNet system, we can quan-tify many behavioral patterns and use these as features to corre-late with the emotional and outcome measures of interest. The behavioral measures we derive include the activity fraction (fraction of the day spent doing physical activity), sedentary fraction (fraction of the day spent in a sedentary state, i.e. not moving much but not sleeping), sleep fraction (the fraction of the day sleeping), restlessness fraction (average rate of flipping while sleeping), and in-room fraction (the fraction of the day spent in the room).
The results for the behavioral features, as correlated to the Composite Emotion Index is shown in the Table 4 below.
Regression
Statistics
Behavioral
Top Features
R2 p
1) Sedentary Fraction 0.64 0.012
2) In-Room Fraction 0.58 0.023
3) Activity Fraction 0.22 n.s.
4) Sleep Fraction 0.15 n.s.
5) Restlessness Fraction 0.09 n.s.
Table 4: Behavioral features correlations with Composite Emotion Index for Subject 6. Sedentary behavior was the best behavioral predictor for the subject, followed by the in-bedroom measure as determined by the location beacons.
Thus we see that behavioral features can correlate well with outcomes. The sedentary (the amount of time spent in a seden-tary state) and in-room location features perform the best, with correlations that are almost as good as the top voice and physi-ology features. The sedentary fraction and in-room fraction features are highly correlated, but this is probably due to the fact that within the room in the ward setting, there isn’t anything to do but really lie in bed to watch television. We would expect that in a more general ambulatory setting, these two features would potentially be different, with sedentary behavior more correlated with lack of energy and enthusiasm, while staying within your room may have a socialization component.
Although it is expected that activity fraction behavioral measure and the motion features aggregating motion characteristics above are correlated, apparently the activity feature is not as correlated to the emotion factor. The activity features doesn’t perform as well in this setting, but that is probably due to the fact that patients are in a ward with very limited options besides moving around from area to area, so there is very little activity overall.
Sleeping and restlessness features are correlated the least; in this setting, it appears that the amount of sleep and restlessness is not correlated to depression state (i.e., people sleep about the same regardless). A larger study population size is required to deter-mine if changes in sleep and or restlessness can be correlated to depression level.
In general, we find that while the behavioral features are quite correlated to outcomes, they do not outperform the physiology and voice features when using these features for regression.
Longitudinal Subject Results
In the above analysis, we have shown that it is possible to use aggregated physiology and behavioral features to predict de-pression state, based on the data for Subject 6. We now use the same methodology on the data of the other subjects run so far in the study.
Analysis for Subject 3 Subject 3, a woman in her mid thirties, was the second subject run through the protocol to completion, but the first that resulted in a full set of data. Subject 3 was only on the ward for a week and a half, but treatment was highly effective for her. It was found that Subject 3 exhibited relatively large changes in mood on a number of her ECT treatment days, which she attributed to physical discomfort following treatment. She was the only pa-tient run through the protocol thus far who exhibited these large fluctuations in mood.
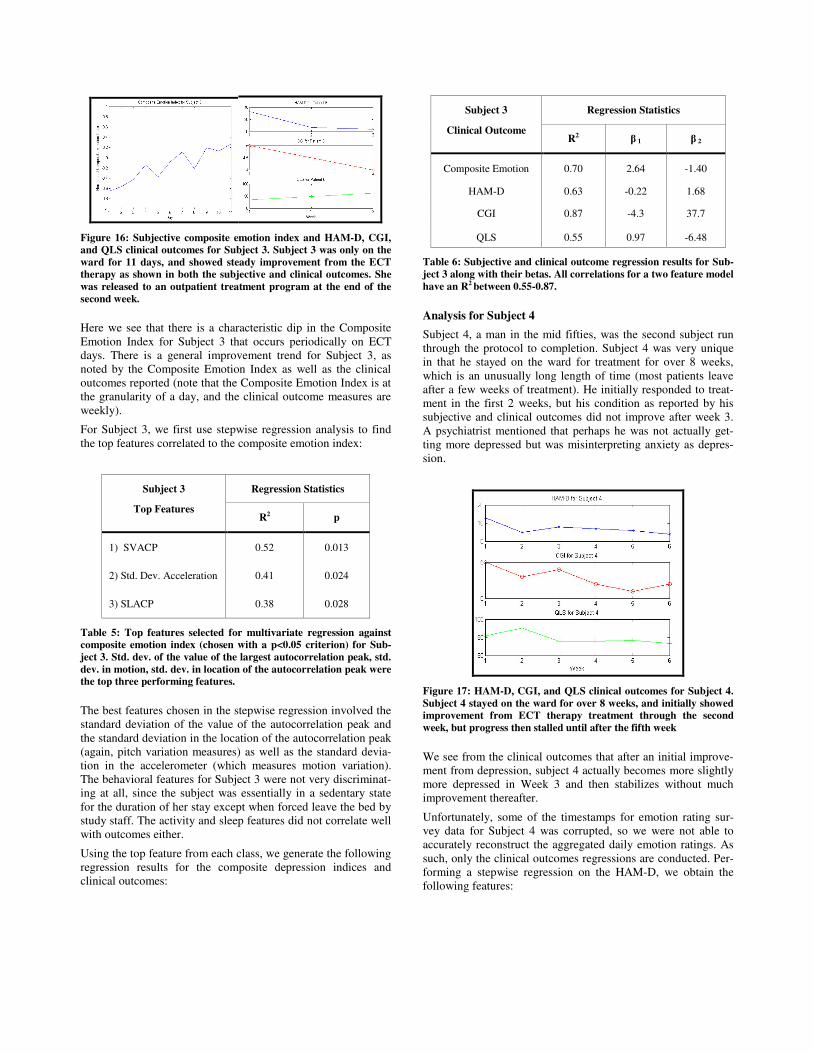
Figure 16: Subjective composite emotion index and HAM-D, CGI, and QLS clinical outcomes for Subject 3. Subject 3 was only on the ward for 11 days, and showed steady improvement from the ECT therapy as shown in both the subjective and clinical outcomes. She was released to an outpatient treatment program at the end of the second week.
Here we see that there is a characteristic dip in the Composite Emotion Index for Subject 3 that occurs periodically on ECT days. There is a general improvement trend for Subject 3, as noted by the Composite Emotion Index as well as the clinical outcomes reported (note that the Composite Emotion Index is at the granularity of a day, and the clinical outcome measures are weekly).
For Subject 3, we first use stepwise regression analysis to find the top features correlated to the composite emotion index:
Regression Statistics Subject 3
Top Features R2 p
1) SVACP 0.52 0.013
2) Std. Dev. Acceleration 0.41 0.024
3) SLACP 0.38 0.028
Table 5: Top features selected for multivariate regression against composite emotion index (chosen with a p<0.05 criterion) for Sub-ject 3. Std. dev. of the value of the largest autocorrelation peak, std. dev. in motion, std. dev. in location of the autocorrelation peak were the top three performing features.
The best features chosen in the stepwise regression involved the standard deviation of the value of the autocorrelation peak and the standard deviation in the location of the autocorrelation peak (again, pitch variation measures) as well as the standard devia-tion in the accelerometer (which measures motion variation). The behavioral features for Subject 3 were not very discriminat-ing at all, since the subject was essentially in a sedentary state for the duration of her stay except when forced leave the bed by study staff. The activity and sleep features did not correlate well with outcomes either.
Using the top feature from each class, we generate the following regression results for the composite depression indices and clinical outcomes:
Regression Statistics Subject 3
Clinical Outcome R2 � 1 � 2
Composite Emotion 0.70 2.64 -1.40
HAM-D 0.63 -0.22 1.68
CGI 0.87 -4.3 37.7
QLS 0.55 0.97 -6.48
Table 6: Subjective and clinical outcome regression results for Sub-ject 3 along with their betas. All correlations for a two feature model have an R2 between 0.55-0.87.
Analysis for Subject 4 Subject 4, a man in the mid fifties, was the second subject run through the protocol to completion. Subject 4 was very unique in that he stayed on the ward for treatment for over 8 weeks, which is an unusually long length of time (most patients leave after a few weeks of treatment). He initially responded to treat-ment in the first 2 weeks, but his condition as reported by his subjective and clinical outcomes did not improve after week 3. A psychiatrist mentioned that perhaps he was not actually get-ting more depressed but was misinterpreting anxiety as depres-sion.
Figure 17: HAM-D, CGI, and QLS clinical outcomes for Subject 4. Subject 4 stayed on the ward for over 8 weeks, and initially showed improvement from ECT therapy treatment through the second week, but progress then stalled until after the fifth week
We see from the clinical outcomes that after an initial improve-ment from depression, subject 4 actually becomes more slightly more depressed in Week 3 and then stabilizes without much improvement thereafter.
Unfortunately, some of the timestamps for emotion rating sur-vey data for Subject 4 was corrupted, so we were not able to accurately reconstruct the aggregated daily emotion ratings. As such, only the clinical outcomes regressions are conducted. Per-forming a stepwise regression on the HAM-D, we obtain the following features:

Regression Statistics Subject 4
Top Features R2 p
1) SFF 0.56 0.011
2) Motion Energy 0.47 0.023
3) Motion Entropy 0.42 0.031
Table 7: Top features selected for multivariate regression against composite emotion index (chosen with a p<0.05 criterion) for Sub-ject 4. Std. dev. of fundamental formant, motion energy, and motion entropy were the top three performing features.
Again, we see the reoccurrence of pitch variation (standard de-viation of fundamental formant frequency) and measures of the entropy and energy in the motion as the top features. Using the two top features, we generate the following regression results for the composite depression indices and clinical outcomes:
Regression Statistics Subject 4
Clinical Outcome R2 � 1 � 2
HAM-D 0.60 -1.5 5.4
CGI 0.89 -12.4 49.3
QLS 0.47 2.7 -10.5
Table 8: Subjective and clinical outcome regression results for Sub-ject 4. All correlations for a two feature model have an R2 between 0.47-0.89.
Analysis for Subject 5 Subject 5, a male in his around forty, responded very well to treatment, and was out of the ward within a week and a half, as shown in the figure below:
Figure 18: Subjective composite emotion index and HAM-D, CGI, and QLS clinical outcomes for Subject 5. Subject 5 stayed on the ward for only one and a half weeks, but showed improvement to ECT therapy treatment throughout his stay on the ward.
For subject 5, we first use stepwise regression analysis to find the top features correlated to the Composite Emotion Index:
Regression Statistics Subject 5
Top Features R2 p
1) SLACP 0.79 0.003
2) Std. Dev. Accel. 0.86 0.0028
3) Max. Num. Peaks Accel.
0.63 0.015
Table 9: Top features selected for multivariate regression against composite emotion index (chosen with a p<0.05 criterion) for Sub-ject 5. Std. dev. of the value of the largest autocorrelation peak, std. dev. in motion, maximum number of peaks in motion were the top three performing features.
Using the top feature from each class, we generate the following regression results for the composite depression indices and clinical outcomes:
Regression Statistics Subject 5
Clinical Outcome R2 � 1 � 2
Composite Emotion Index
0.72 1.8 -3.9
HAM-D 0.84 -0.7 5.3
CGI 0.95 -10.3 72.4
QLS 0.73 3.6 -8.3
Table 10: Subjective and clinical outcome regression results for Subject 5. All correlations for a two feature model have an R2 be-tween 0.72-0.95.
As many of the audio and physiology features are highly corre-lated, it is not surprising that individual features chosen in the stepwise regression of each subject are not the identical to each other. In addition, idiosyncrasies between subjects are to be expected. However, we would like to try to generalize the re-sults of the study to see if any universal features exist across the subjects that can be used to accurately trend depression.
Toward Creating a Universal Depression Meter
The above analysis shows that we can accurately predict an individual’s depression state based on both a combination of voice, physiological, and behavioral features. While it is always possible to create a personalized depression model based on an individual’s physiology and behavior, an interesting question to ask is if these same features hold across patient populations. While an appropriately powered longitudinal study is not possi-ble at the time of the writing of this technical report (with only 6 subjects run through the protocol), we can see if there are uni-versal features that can be used for clinical depression state clas-sification.
Taking the top performing features of each individual subject (discussed in the longitudinal results section above) and system-atically running the regressions with these features on the other
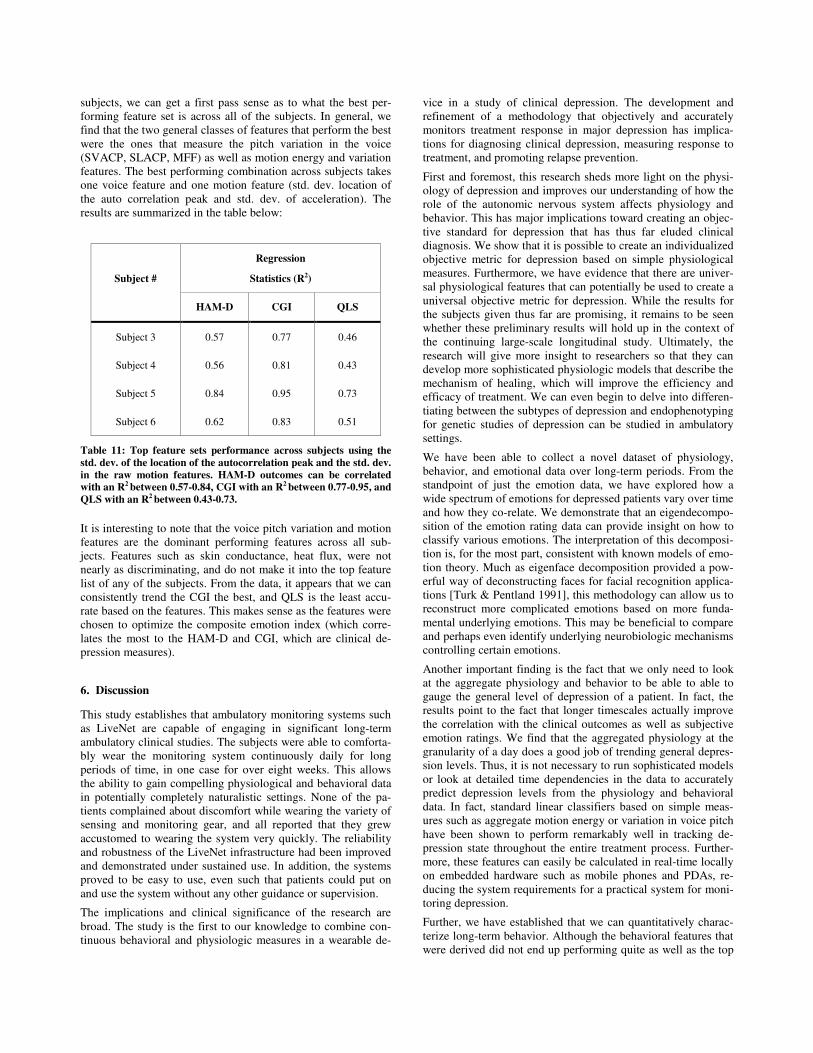
subjects, we can get a first pass sense as to what the best per-forming feature set is across all of the subjects. In general, we find that the two general classes of features that perform the best were the ones that measure the pitch variation in the voice (SVACP, SLACP, MFF) as well as motion energy and variation features. The best performing combination across subjects takes one voice feature and one motion feature (std. dev. location of the auto correlation peak and std. dev. of acceleration). The results are summarized in the table below:
Regression
Statistics (R2)
Subject #
HAM-D CGI QLS
Subject 3 0.57 0.77 0.46
Subject 4 0.56 0.81 0.43
Subject 5 0.84 0.95 0.73
Subject 6 0.62 0.83 0.51
Table 11: Top feature sets performance across subjects using the std. dev. of the location of the autocorrelation peak and the std. dev. in the raw motion features. HAM-D outcomes can be correlated with an R2 between 0.57-0.84, CGI with an R2 between 0.77-0.95, and QLS with an R2 between 0.43-0.73.
It is interesting to note that the voice pitch variation and motion features are the dominant performing features across all sub-jects. Features such as skin conductance, heat flux, were not nearly as discriminating, and do not make it into the top feature list of any of the subjects. From the data, it appears that we can consistently trend the CGI the best, and QLS is the least accu-rate based on the features. This makes sense as the features were chosen to optimize the composite emotion index (which corre-lates the most to the HAM-D and CGI, which are clinical de-pression measures).
6. Discussion
This study establishes that ambulatory monitoring systems such as LiveNet are capable of engaging in significant long-term ambulatory clinical studies. The subjects were able to comforta-bly wear the monitoring system continuously daily for long periods of time, in one case for over eight weeks. This allows the ability to gain compelling physiological and behavioral data in potentially completely naturalistic settings. None of the pa-tients complained about discomfort while wearing the variety of sensing and monitoring gear, and all reported that they grew accustomed to wearing the system very quickly. The reliability and robustness of the LiveNet infrastructure had been improved and demonstrated under sustained use. In addition, the systems proved to be easy to use, even such that patients could put on and use the system without any other guidance or supervision.
The implications and clinical significance of the research are broad. The study is the first to our knowledge to combine con-tinuous behavioral and physiologic measures in a wearable de-
vice in a study of clinical depression. The development and refinement of a methodology that objectively and accurately monitors treatment response in major depression has implica-tions for diagnosing clinical depression, measuring response to treatment, and promoting relapse prevention.
First and foremost, this research sheds more light on the physi-ology of depression and improves our understanding of how the role of the autonomic nervous system affects physiology and behavior. This has major implications toward creating an objec-tive standard for depression that has thus far eluded clinical diagnosis. We show that it is possible to create an individualized objective metric for depression based on simple physiological measures. Furthermore, we have evidence that there are univer-sal physiological features that can potentially be used to create a universal objective metric for depression. While the results for the subjects given thus far are promising, it remains to be seen whether these preliminary results will hold up in the context of the continuing large-scale longitudinal study. Ultimately, the research will give more insight to researchers so that they can develop more sophisticated physiologic models that describe the mechanism of healing, which will improve the efficiency and efficacy of treatment. We can even begin to delve into differen-tiating between the subtypes of depression and endophenotyping for genetic studies of depression can be studied in ambulatory settings.
We have been able to collect a novel dataset of physiology, behavior, and emotional data over long-term periods. From the standpoint of just the emotion data, we have explored how a wide spectrum of emotions for depressed patients vary over time and how they co-relate. We demonstrate that an eigendecompo-sition of the emotion rating data can provide insight on how to classify various emotions. The interpretation of this decomposi-tion is, for the most part, consistent with known models of emo-tion theory. Much as eigenface decomposition provided a pow-erful way of deconstructing faces for facial recognition applica-tions [Turk & Pentland 1991], this methodology can allow us to reconstruct more complicated emotions based on more funda-mental underlying emotions. This may be beneficial to compare and perhaps even identify underlying neurobiologic mechanisms controlling certain emotions.
Another important finding is the fact that we only need to look at the aggregate physiology and behavior to be able to able to gauge the general level of depression of a patient. In fact, the results point to the fact that longer timescales actually improve the correlation with the clinical outcomes as well as subjective emotion ratings. We find that the aggregated physiology at the granularity of a day does a good job of trending general depres-sion levels. Thus, it is not necessary to run sophisticated models or look at detailed time dependencies in the data to accurately predict depression levels from the physiology and behavioral data. In fact, standard linear classifiers based on simple meas-ures such as aggregate motion energy or variation in voice pitch have been shown to perform remarkably well in tracking de-pression state throughout the entire treatment process. Further-more, these features can easily be calculated in real-time locally on embedded hardware such as mobile phones and PDAs, re-ducing the system requirements for a practical system for moni-toring depression.
Further, we have established that we can quantitatively charac-terize long-term behavior. Although the behavioral features that were derived did not end up performing quite as well as the top

physiology and voice features, a number of them are signifi-cantly correlated to the depression outcomes. In general, many psychological and physiological disorders have symptoms that manifest as behavioral changes. Unfortunately, without a way to precisely quantify these behaviors, physicians can only qualita-tively describe these behaviors. With continuous monitoring, we now have a way to develop objective behavioral measures which can be used to help diagnose and/or classify disorders. The behavioral features used in this study, such as activity, sleep, sedentary measures, are generally quite applicable in a wide assortment of contexts. As these measures can all be de-rived in a completely non-invasive manner (through the use of a single body-worn accelerometer), they may be attractive in de-veloping depression classifiers in situations where other sensors such as microphones might be more cumbersome.
Once a reliable index of physiologic and behavioral metrics for depression has been established, we also have an automated methodology to be able to track patient response to treatment over time. As a tool for monitoring clinical change, these meas-ures are invariant to the type of treatment, be it psychotherapy, pharmacotherapy, ECT, or combination thereof. The degree of change in the developed measures can be directly related to the degree of response to the treatment. Thus, by monitoring pre and post treatment, therapeutic changes can be measured and as each subject acts as their own control for such purposes, objectivity is assured.
Furthermore, this monitoring can be done outside of the inpa-tient setting in completely natural settings, i.e. at the patient’s home, without the need for additional intervention or support. The preliminary results of this study demonstrate the tantalizing possibility of being able to accurately monitor and track depres-sion using a mobile phone with an integrated accelerometer. While a full PDA-based LiveNet system with sensor network was used in the study to collect the variety of physiology and behavior measures, our results show that we can accurately cor-relate depression to simple aggregated motion and voice fea-tures. By using a mobile phone, we thus have a platform that can be used to track depression while being completely transparent to the user. For individuals who are prone to relapses and severe cases of clinical depression, this ability to continuously monitor patients when they leave the ward is critical in being able to expand healthcare into the homecare domain where existing treatment methodologies have not yet demonstrated substantial effectiveness as compared to in-ward settings.
As we improve our understanding of how the autonomic nerv-ous system affects long-term physiology and behavior, we can begin to look at other potential mental disorders. The methodol-ogy that we have developed also has the potential to help in the pre-clinical assessment, early diagnosis, and treatment predic-tion of other severe psychopathologies that have likely physiol-ogic and behavioral correlates. These conditions include severe psychotic, mood, anxiety, communication, and personality dis-orders, and potentially even pervasive developmental disorders in children. For example, an easy target for assessment would be bipolar disorder, where a patient exhibits extreme swings in mood related to manic and depressive episodes. These episodes have corresponding swings in behavior which can easily be identified and quantified based on movement and speech pat-terns.
7. References
[Alpert et al. 1997] J. Alpert, L. Uebelacker, N. McLean, A. Nierenberg, J. Pava, J. Worthington III, J. Tedlow, J. Rosenbaum, and M. Fava (1997) “Social Phobia, Avoidant Per-sonality Disorder and Atypical Depression: Co-Occurrence and Clinical Implications”, Psychological Medicine, 27: 627-633
[Andersson et al. 1999] S. Andersson, J. Krogstad, and A. Fin-set (1999) “Apathy and Depressed Mood in Acquired Brain Damage: Relationship to Lesion Localization and Psychophysi-ological Reactivity”, Psychological Medicine [Arruda et al. 1996] J. Arruda, R. Stern, and S. Legendre (1996) “Assessment of Mood State in Patients Undergoing Elec-troconvulsive Therapy: The Utility of Visual Analog Mood Scales Developed for Cognitively Impaired Patients”, Convuls Ther., 12(4):207-12
[Brady & Kendall 1992] E. Brady & P. Kendall (1992) “Co-morbidity of Anxiety and Depression in Children and Adoles-cents”, Psychol Bull., 111(2):244-55
[Brodaty et al. 2001] H. Brodaty, D. Berle, I. Hickie, and C. Mason (2001) “‘Side Effects’ of ECT are Mainly Depressive Phenomena and are Independent of Age”, Journal of Affective Disorders, 66:237-245
[Buchanan et al. 1985] S. Buchanan, J. Valentine, and D. Pow-ell (1985) “Autonomic Responses are Elicited by Electrical Stimulation of the Medial but not Lateral Frontal Cortex in Rab-bits”, Behavioral Brain Research
[Camacho et al. 1991] T. Camacho, R. Roberts, N. Lazarus, G. Kaplan, and R. Cohen (1991) “Physical Activity and Depres-sion: Evidence from the Alameda County Study”, American Journal of Epidemiology, 134(2):220-231
[Carney et al. 1988] R. Carney, M. Rich, A. teVelde, J. Saini, K. Clark, K. Freedland (1988) “The Relationship Between Heart Rate, Heart Rate Variability and Depression in Patients with Coronary Artery Disease”, Journal of Psychosomatic Research, 32(2):159-164
[Cartwright et al. 2003] R. Cartwright, E. Baehr, J. Kirkby, S. Pandi-Perumal, J. Kabat (2003) “REM Sleep Reduction, Mood Regulation and Remission in Untreated Depression, Psychiatry Res., 121(2):159-67
[Chambers & Allen 2002] A. Chambers & J. Allen (2002) “Vagal Tone as an Indicator of Treatment Response in Major Depression”, Psychophysiology
[Chambers et al. 2002] G. Chambers, S. Venkatesh, G. West, and H. Bui (2002) “Hierarchical Recognition of Intentional Human Gestures for Sports Video Annotation”, International Conference on Pattern Recognition, IEEE Press
[Clark & Watson 1991] L. Clark & D. Watson (1991) “Tripar-tite Model of Anxiety and Depression: Psychometric Evidence and Taxonomic Implications”, J Abnorm Psychol. 100(3):316-36
[Dawson et al. 1977] M. Dawson, A. Schell, and J. Catania (1977) “Autonomic Correlates of Depression and Clinical Im-provement Following Electroconvulsive Shock Therapy”, Psy-chophysiology

[Dawson et al. 1985] M. Dawson, et al. (1985) “Diagnostic Utility of Autonomic Measures for Major Depressive Disor-ders”, Psychiatry Research
[Dawson et al. 1990] M. Dawson, A. Schell, and D. Filion (1990) “The Electrodermal System” In Cacioppo and Tassinary, editors, Principles of Psychophysiology: Physical, social and inferential elements, pp. 295-324. Cambridge University Press, Cambridge
[DeJohn et al. 1992] C. DeJohn, M. Marr, E. Molina, and A. McCardie, (1992) “A Computer-Based Visual Analog Scale”, Technical Report # A251852, Naval Aerospace Medical Re-search Labs, Pensacola, FL.
[Devanand et al. 1995] D. Devanand, L. Fitzsimons, J. Prudic, and H. Sackeim (1995) “Subjective Side Effects During Elec-troconvulsive Therapy”, Convuls Ther., 11(4):232-240
[Dougherty & Rauch 1997] D. Dougherty & S. Rauch (1997) “Neuroimaging and Neurobiological Models of Depression”, Harvard Review of Psychiatry
[Dougherty & Rauch 2001] D. Dougherty & S. Rauch (2001) Psychiatric Neuroimaging Research: Contemporary Strategies, American Psychiatric Publishing, Washington DC
[Drevets 2001] W. Drevets (2001) “Neuroimaging and Neuro-pathological Studies of Depression: Implications for the Cogni-tive-Emotional Features of Mood Disorders”, Current Opinion in Neurobiology
[DSM 1994] DSM-IV, T.F.o., (1994) “Diagnostic and Statistical Manual of Mental Disorders”, American Psychiatric Society, Washington, D.C.
[Endicott et al. 1993] J. Endicott, et al. (1993) “Quality of Life Enjoyment and Satisfaction Questionnaire: A New Measure”, Psychopharmacology Bulletin
[Gift 1989] A. Gift (1989) “Visual Analog Scales: Measurement of Subjective Phenomenon”, Nursing Research, 38(5):286-288
[Glass 1985] R. Glass (1985) “Electroconvulsive Therapy: Time to Bring It Out of the Shadows”, JAMA, 285:1346-1348, Elec-troconvulsive Therapy, NIH Consensus Statement
[Guy 1976] W. Guy (1976) “Clinical Global Impressions”, ECDEU Assessment Manual for Psychopharmacology, U.S. National Institutes of Health: Rockville, MD
[Hamilton 1960] M. Hamilton (1960) “A Rating Scale for De-pression”, Journal of Neurology, Neurosurgery and Psychiatry
[Hugdahl-A 1995] K Hugdahl (1995) Psychophysiology: The Mind-Body Perspective, Harvard University Press, Cambridge MA
[Hugdahl-B 1995] K. Hugdahl, (1995) Electrodermal Activity, in Psychophysiology: The Mind-Body Perspective, Harvard University Press, Cambridge, MA
[Hugdahl-C 1995] K. Hugdahl (1995) Cardiovascular Psycho-physiology, in Psychophysiology: The Mind-Body Perspective”, Harvard University Press, Cambridge MA
[Kessler et al. 2003] R. Kessler et al. (2003) “The Epidemiol-ogy of Major Depressive Disorder: Results From the National Comorbidity Survey Replication (NCS-R)”, Journal of the American Medical Association, 289(23):3095-3105
[Knight et al. 1994] G. Knight, L. Virdin, and M. Roosa (1994) “Socialization and Family Correlates of Mental Health Out-
comes among Hispanic and Anglo American Children: Consid-eration of Cross-Ethnic Scalar Equivalence” Child Dev., 65(1):212-224
[Lahmeyer & Bellur 1987] H. Lahmeyer & S. Bellur (1987) “Cardiac Regulation and Depression”, Journal of Psychiatric Research
[Lobstein et al. 1983] D. Lobstein, B. Mosbacher, and A. Ismail (1983) “Depression as a Powerful Discriminator between Physi-cally Active and Sedentary Middle-Aged Men”, J Psychosom Res., 27(1):69-76
[Murray & Lopez 1996] C. Murray & A. Lopez, Editors (1996) The Global Burden of Disease and Injury Series, Volume 1: A Comprehensive Assessment of Mortality and Disability from Diseases, Injuries, and Risk Factors in 1990 and Projected to 2020”, Published by the Harvard School of Public Health on behalf of the World Health Organization and the World Bank, Harvard University Press, Cambridge, MA
[Nezlek et al. 1994] J. Nezlek, M. Imbrie, and G. Shean, “De-pression and Everyday Social Interaction”, J Pers Soc Psychol., 67(6):1101-1111
[Oppenheimer & Cechetto 1990] S. Oppenheimer and D. Cechetto (1990) “Cardiac Chronotropic Organization of the Rat Insular Cortex”, Brain Research
[Oppenheimer et al. 1992] S. Oppenheimer, et al. (1992) “Car-diovascular Effects of Human Insular Cortex Stimulation”, Neu-rology
[Remick et al. 2005] R. Remick, W. Linden, P. McClean, G. Iverson, and M Gaetz, (2005) "A New Potential Marker for Abnormal Cardiac Physiology in Depression.", Journal of Be-havioral Medicine
[Riemann et al. 2001] D. Riemann, M Berger, and U. Voder-holzer (2001) “Sleep and Depression – Results from Psychobi-ological Studies: An Overview”, Biol Psychol, 57:67-103
[Rusting & Larsen 1998] C. Rusting & R. Larsen (1998) “Di-urnal Patterns of Unpleasant Mood: Associations with Neuroti-cism, Depression, and Anxiety”, Journal of Personality, 66(1):85
[Sobin & Sackeim 1997] C. Sobin, H. Sackeim (1997) “Psy-chomotor Symptoms of Depression”, Am J Psychiatry, 154(1):4-17
[Sung 2005] M. Sung (2005) “Non-Invasive Wearable Sensing Systems for Continuous Health Monitoring and Long-Term Behavior Modeling”, Ph.D. Thesis, MIT Department of Electri-cal Engineering and Computer Science
[Stampfer 1998] H. Stampfer: "Relationship between Psychiat-ric Illness and Circadian Pattern of Heart Rate" Journal of Psy-chiatry, 32:187-198
[Stampfer et al. 2002] H. Stampfer, G. Iverson (2002) "Reli-ability of Circadian Heart Rate Patterns in Psychiatry" (73):3
[Szekely 2000] M. Szekely (2000) “The Vagus Nerve in Ther-moregulation and Energy Metabolism”, Auton Neurosci, 85(1-3):26-38
[Taillard et al. 1990] J. Taillard, et al. (1990) “Heart Rate Cir-cadian Rhythm as a Biological Marker of Desynchronization in Major Depression: A Methodological and Preliminary Report”, Chronobiology International

[Taillard et al. 1993] J. Taillard, et al. (1993) “Sleep and heart Rate Circadian Rhythm in Depression”, Chronobiology Interna-tional
[Thorell-A et al. 1987] L. Thorell, B. Kjellman, and G. D'Elia (1987) “Electrodermal Activity in Relation to Diagnostic Sub-groups and Symptoms of Depressive Patients”, Acta Psychiat-rica Scandinavica
[Thorell-B et al. 1987] L. Thorell, B. Kjellman, and G. D'Elia (1987) “Electrodermal Activity in Antidepressant Medicated and Unmedicated Depressive Patients and in Matched Healthy Subjects”, Acta Psychiatrica Scandinavica
[Thorell & d’Elia 1988] L. Thorell & G. d'Elia (1988) “Elec-trodermal Activity in Depressive Patients in Remission and in Matched Healthy Subjects”, Acta Psychiatrica Scandinavica
[Tsai et al. 2003] J. Tsai, et al. (2003) “The Effects of Depres-sion on the Emotional Responses of Spanish-speaking Latinas”, Cultural Diversity & Ethnic Minority Psychology
[Tsujimoto et al. 1990] T. Tsujimoto , N. Yamada, K. Shimoda, K. Hanada, S. Takahashi (1990) “Circadian Rhythms in De-pression. Part II: Circadian Rhythms in Inpatients with Various Mental Disorders”, J Affect Disord.,18(3):199-210
[Turk & Pentland 1998] M. Turk and A. Pentland (1991) “Ei-genfaces for Recognition”, Journal of Cognitive Neuroscience, 3(1) [Volkers et al. 2003] A. Volkers, et al (2003) “Motor Activity and Autonomic Cardiac Functioning in Major Depressive Dis-order”, Journal of Affective Disorders
[Ward et al. 1983] N. Ward, H. Doerr, and M. Storrie (1983) “Skin Conductance: A Potentially Sensitive Test for Depres-sion”, Psychiatry Research
[Warner et al. 1987] R. Warner, et al. (1987) “Rhythmic Or-ganization of Social Interaction and Observer Ratings of Posi-tive Affect and Involvement”, Journal of Nonverbal Behavior
[Warner 1992] R. Warner (1992) “Dimensions of Social Inter-action Tempo: A Factor Analytic Study of Time and Frequency Domain Indexes Of Interaction Structure”, Journal of Psycho-linguistic Research
[Watson et al. 1995] D. Watson, K. Weber, J. Assenheimer, L. Clark, M. Strauss, and R. McCormick (1995) “Testing a Tripar-tite Model: I. Evaluating the Convergent and Discriminant Va-lidity of Anxiety and Depression Symptom Scales”, J Abnorm Psychol., 104(1):3-14
[Watt & VanLear 1996] J. Watt & C. VanLear (1996) Dy-namic Patterns in Communication, Sage Publications, Thousand Oaks, CA
Zung et al. 1990] W. Zung, K. Magruder-Habib, R. Velez, W. Alling (1990) “The Comorbidity of Anxiety and Depression in General Medical Patients: A Longitudinal Study”, J Clin Psy-chiatry, 51 Suppl:77-80; Discussion 81