Embed Size (px)
Citation preview
AL-TR-1991-0123
ARM BEHAVIORAL AND PHYSIOLOGICALS RESPONSES OF HORSES TO SIMULATEDT AIRCRAFT NOISER0NG Michelle M. LeBlanc
Christoph LombardRuth Massey
Elizabeth Klapstein
L Sandra Lieb
A UNIVERSITY OF FLORIDA
B GAINESVILLE, FLORIDA
oR JANUARY 1991
AT0 FINAL REPORT DECEMBER 1989 TO JANUARY 1991
R
Approved for public release; distribution is unlimited.
AIR FORCE SYSTEMS COMMANDmWRIGHT-PATTERSON AIR FORCE BASE, OHIO 45433-6573
NOTICES
When US Government drawings, specifications, or other data are usedfor any purpose other than a definitely related Governmentprocurement operation, the Government thereby incurs noresponsibility nor any obligation whatsoever, and the fact that theGovernment may have formulated, furnished, or in any way suppliedthe said drawings, specifications, or other data, is not to beregarded by implication or otherwise, as in any manner licensingthe holder or any other person or corporation, or conveying anyrights or permission to manufacture, use, or sell any patentedinvention that may in any way be related thereto.
Please do not request copies of this report from the ArmstrongLaboratory. Additional copies may be purchased from:
National Technical Information Service5285 Port Royal RoadSpringfield, Virginia 22161
Federal Government agencies and their contractors registered withthe Defense Technical Information Center should direct requests forcopies of this report to:
Defense Technical Information CenterCameron StationAlexandria, Virginia 22304-6145
TECHNICAL REVIEW A-TD APPROVAL
AL-TR-1991-0123
This report has been reviewed by the Office of Public Affairs (PA)and is releasable to the National Technical Information Service(NTIS)o At NTIS, it will be available to the general public,including foreign nations.
This technical report has been reviewed and is approved forpc-icat 1 on.
ROBERT C. KULL, R, NAJ R, USAFNSBIT Program Mar qer
FOR THE DIRECTOR
EDWARD F. MAHER, LT COL, USAF, BSCChief, Bioenvironmental Engineering Division

REPORT DOCUMENTATION PAGE Form Approved
IT OMB No. 0704-0188
Public reporting burden for this collection of information is estimated to average 1 hour per response, including the time for reviewing instructions, searching existing data sources,gathering and maintaining the data needed, and completing and reiewming the collection of information. Send comments regarding this burden estimate or any other aspect of thiscollection of information, including suggestions for reducing this burden. to Washington Headquarters Services. Directorate for information Operations and Reports, 1215 JeffersonDavis Highway, Suite 1204, Arlington, VA 22202-4302, and to the Office of Management and Budget, Paperwork Reduction Project (0704-0188), Washington. DC 20503.
1. AGENCY USE ONLY (Leave blank) 2. REPORT DATE 3. REPORT TYPE AND DATES COVERED •
10 January 1991 IFinal Report Dec 89 to Jan 914. TITLE AND SUBTITLE 5. FUNDING NUMBERSBehavioral and Physiological Responses of Horses to
Simulated Aircraft Noise 89-COOP-2-4929
PE: 63723F
6. AUTHOR(S) PR: 3037Michelle LeBlanc, Christoph Lombard, Ruth Massey, TA: 05Elizabeth Klapstein, & Sandra Lieb WU: 05
7. PERFORMING ORGANIZATION NAME(S) AND ADDRESS(ES) 8. PERFORMING ORGANIZATION
Department of Large Animal Clinical Sciences REPORT NUMBER
College of Veterinary Medicine
University of Florida
Gainesville, FL 32610
9. SPONSORING/MONITORING AGENCY NAME(S) AND ADDRESS(ES) 10. SPONSORING/MONITORINGAGENCY REPORT NUMBER
Noise and Sonic Boom Impact TechnologyWPAFB, OH 45433-6573 AL-TR-1991-0123
11. SUPPLEMENTARY NOTES
12a. DISTRIBUTION /AVAILABILITY STATEMENT 12b. DISTRIBUTION CODE
Approved for public release; distribution is unlimited.
13. ABSTRACT (Maximum 200 words)
The effects of simulated F-4 aircraft noise on pregnancy outcome, behavior, rate ofhabituation, cardiac function, serum cortisol and progestogen concentrations ofpregnant mares were determined. Eight experimental and 8 control mares were exposedto aircraft noise on days 320, 323, and 324 of pregnancy. The noise was heard over47 sec with sound intensity increasing at 54.7 dB/sec to a maximum of 115 dB.Behavior was viewed using closed circuit TV and tapes were scored by a 5-memberpanel. All treatment mares delivered live, normal foals without assistance. Mean
anxiety and movement scores were significantly different. Heart rate increasedduring noise periods, but without ectopic arrhythmias. Researchers observed someadaptation to the noise with less of a heart rate increase after successiveepisodes. Treatment mares experienced a significant rise in serum cortisol onlyafter the first exposure to noise. Progesterone concentrations in serum variedgreatly among individuals, but profiles were well within the normal range.
14. SUBJECT TERMS 15. NUMBER OF PAGESAircraft, Noise, Domestic Animals, Horses, 70
Disturbance, Physiological Effects 16. PRICE CODE
17. SECURITY CLASSIFICATION 18. SECURITY CLASSIFICATION 19. SECURITY CLASSIFICATION 20. LIMITATION OF ABSTRACTOF REPORT OF" THIS PAGE OF ABSTRACT
Unclassified Unclassified Unclassified UL
NSN 7540-01-280-5500 Standard Form 298 (Rev 2-89)Prescribed by ANSI SId Z3-18
iii 298 102

This Page Intentionally Left Blank
iv

ABSTRACT
The effects of simulated F-4 aircraft noise on pregnancy outcome,
behavior (startle reflex), rate of habituation, cardiac function,
serum cortisol and progestogen concentrations of heavily pregnant
mares were determined. Sixteen mares were assigned to treatment
or control groups (8 each) according to foaling dates. From day
313 of gestation until parturition, mares were housed in box
stalls between 1500 and 0900 hours. The remaining hours were
spent in pasture. Mares were placed in stalls on day 313 to day
319 so they could become acclimated to stall environment prior to
the start of the experiment on day 320. On days 320, 323, and
324 of gestation, the 8 treatment mares were exposed to four
daily simulated F-4 aircraft noise events. The simulated noise
was heard over 47 sec with sound intensity increasing at 54.7
dB/sec with a maximum of 115 dB. Three of the four noise
exposures were administered randomly between 1630 and 2200 hours
and the fourth was administered between 0600 and 0800 hours. On
day 321 of gestation, treatment mares were exposed to 6 noise
events spaced 10 min apart beginning at 2030.
Behavior of the mares was viewed through closed circuit security-
type black and white TV cameras with wide angle lenses that were
placed in each stall. The normal activities of all mares were
videotape recorded for one minute on the hour and half-hour from
0530 to 0700 hours and again from 1630 to 2200 hours on days 315,
318, 326 and 328 of gestation. To record agonistic behavior due
to noise, the mares were videotaped for one min each at 20, 10,
and 1 min prior to each noise event, and continuously from 0 to 4
min after each noise event and again for one min each at 10, 20,
and 40 min post noise. Tapes were reviewed by a panel of 5
members to evaluate anxiety and movement of treatment mares
related to the noise event. The difference between the pre-noise
and noise minute values was determined and statistically
analyzed.
v
Long-term recording of the electrocardiogram by Holter recorders
was performed on treatment mares to evaluate cardiac function.
Each treatment mare was instrumented for 2 of the 4 nights that
she was subjected to noise. Four control mares underwent
identical procedures except exposures to aircraft noise. The
cassette tapes were analyzed with a computer assisted Holter
analyzer and screened for ECG-abnormalities, especially ectopic
tachycardias, on full-disclosure printouts. The average hourly
heart rate, the number of premature supraventricular contractions
(APC), ventricular contractions (VPC), and sinus tachycardias
were recorded and analyzed statistically.
To determine the stress response due to aircraft noise, cortisol
was measured in serum collected prior to and after designated
noise events. Blood was collected 5 min prior and 5, 15, 30, 60,
90, and 120 min after noise events 1 and 4 on day 320, 323 and
324. Control mares were bled on day 320 of gestation using the
same blood collection schedule but were not subjected to aircraft
noise. On day 321 blood was collected prior to noise events 1
and 3 and after noise event 6 following the same sequence as for
day 320 (Table 9). Resting cortisol concentrations in all mares
were determined prior to the start of the experiment on day 319
by collecting blood 15, 30 and 45 min after placement of a
jugular catheter. Two weeks after the experiment was completed
blood was again collected from treatment mares to determine if
there were any residual effects from the experiment. Cortisol was
measured in serum by a competitive binding radioimmunoassay kit
(Gamma Coat, (1125) Cortisol) validated in our laboratory.
Differences between pre-noise treatment cortisol concentrations
and times after noise events were analyzed by paired Student t-
tests. Differences between treatment and control groups were
evaluated by Student t-tests.
vi
Progestogen concentrations in serum were evaluated to determine
the effects of simulated aircraft noise on the feto-placental
unit. Serum progestogen concentration was measured prior to
noise exposure, during noise exposure (on days 323 and 324) and
then every 3 days thereafter until 7 days before foaling at which
time serum progestogen was measured daily. The same protocol was
followed for control mares except they were not subjected to
noise. Progestogens were measured in plasma by a solid-phase
radioimmunoassay (Coat-a-count) previously validated in our
laboratory.
None of the mares, treatment or control, aborted. Treatment
mares all delivered live, normal foals without assistance,
whereas, one of the control mares delivered a stillborn foal that
required assistance.
We found that mean anxiety and movement scores (behavioral
analysis) were significantly different by treatment day with the
highest scores (highest degrees of anxiety and movement) seen
following the first noise on day 320. As the mares continued to
be subjected to the noise, scores decreased and it appears that
the scores fell significantly after the 5th noise on day 321.
All of the mares showed flight posture following the first noise
but at no time did any mare strike or run into the stall walls or
injure herself. Habituation rate varied among individuals with 7
of 8 mares habituating by the fifth noise on day 321 (anxiety
score < 3 -mare showing alert stance only). The eighth mare
habituated by the fourth noise on day 323.
There was a fairly consistent increase in heart rate (HR) during
the noise periods, however, without any ectopic arrhythmias. A
total of 55 noise episodes caused 21 "true sinus tachycardias"
(HR > 100 beats/min for 20 sec), 8 "false sinus tachycardias" (HR
> 100 beats/min for 5-19 sec) and 15 "transient increases in
heart rate" (HR > 70 but < 100 beats/min). Control mares
vii
experienced only 2 true sinus tachycardias and no false sinus
tachycardias or transient increases in heart. Treatment mares
had significantly higher heart rates during sound hours than
during no sound hours (57.4 + 10.5 versus 54.8 + 9.2, mean ± SD,
respectively; p < 0.05). The difference in average heart rates
for all hours, between control and treatment mares failed to
reach statistical significance (p > 0.05). We noticed some
adaptation to the noise with less of a heart rate increase with
repeated noise episodes, however, we did not have sufficient
numbers to prove it.
Mean cortisol concentrations in serum following catheterization
of the jugular vein on day 319 rose in treatment mares but not in
control mares. This rise was attributed to changes in cortisol
concentrations in 3 of the 8 treatment mares. These three mares
were accountable for 24 of the 26 serum samples containing > 60
ng/ml of cortisol. Treatment mares experienced a significant
rise in serum cortisol only after the first exposure to simulated
aircraft noise on day 320. This rise in cortisol was seen at 15,
30 and 120 min post noise (p < 0.01)
The progestogen concentrations in serum varied greatly among
individuals, however, the progestogen profiles were well within
the normal range. Because there were no abortions or major
changes in progestogen concentration, we conclude that simulated
aircraft noise does not affect adversely the feto-placental unit.
The result of this experiment suggests that mares exposed to jet
noise while they are in the confines of a familiar stall are
unlikely to injure themselves during a behavioral flight
response. This experiment did not measure the responses of mares
kept in larger open or novel spaces. Nor did it use live
flyovers where the mares might see as well as hear the planes.
However, since all of the mares in this experiment showed flight
behavior during at least the first simulated jet noise event, it
viii
is likely that in a larger space the flight responses could
result in a greater speed of gait (gallop) and distance covered.
This increase in speed and distance may increase the risk of
injury by running into objects. Therefore, it is suggested that,
if new horses are brought into an environment that is subject to
low level jet flyovers, they should remain stall confined until
their level of behavioral reaction is identified and they
habituate.
ix

This Page Intentionally Left Blank
x
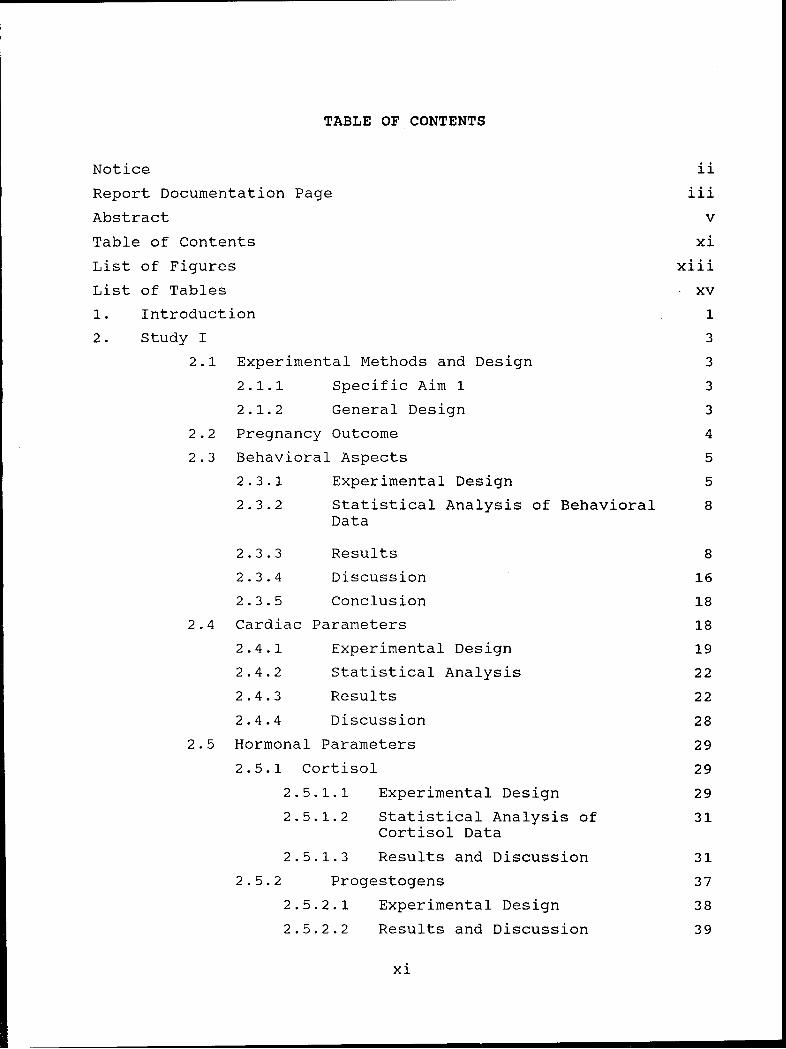
TABLE OF CONTENTS
Notice ii
Report Documentation Page iii
Abstract v
Table of Contents xi
List of Figures xiii
List of Tables xv
1. Introduction 1
2. Study I 3
2.1 Experimental Methods and Design 3
2.1.1 Specific Aim 1 3
2.1.2 General Design 3
2.2 Pregnancy Outcome 4
2.3 Behavioral Aspects 5
2.3.1 Experimental Design 5
2.3.2 Statistical Analysis of Behavioral 8Data
2.3.3 Results 8
2.3.4 Discussion 16
2.3.5 Conclusion 18
2.4 Cardiac Parameters 18
2.4.1 Experimental Design 19
2.4.2 Statistical Analysis 22
2.4.3 Results 22
2.4.4 Discussion 28
2.5 Hormonal Parameters 29
2.5.1 Cortisol 29
2.5.1.1 Experimental Design 29
2.5.1.2 Statistical Analysis of 31Cortisol Data
2.5.1.3 Results and Discussion 31
2.5.2 Progestogens 37
2.5.2.1 Experimental Design 38
2.5.2.2 Results and Discussion 39
xi
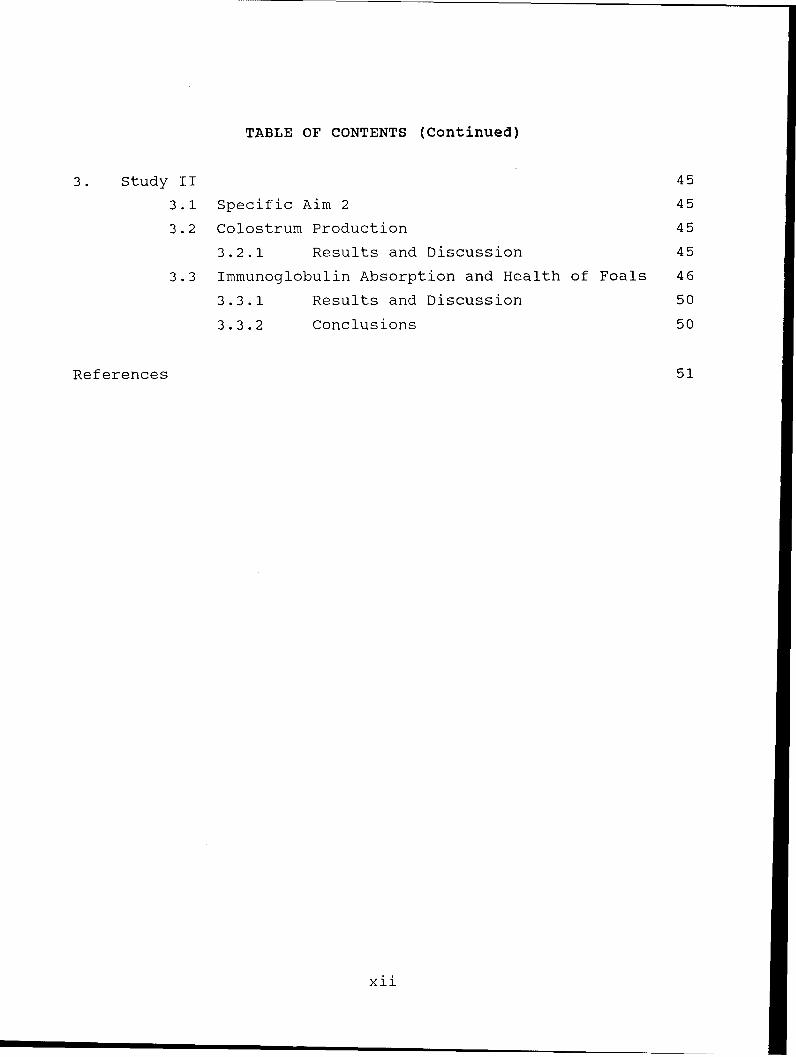
TABLE OF CONTENTS (Continued)
3. Study II 45
3.1 Specific Aim 2 45
3.2 Colostrum Production 45
3.2.1 Results and Discussion 45
3.3 Immunoglobulin Absorption and Health of Foals 46
3.3.1 Results and Discussion 50
3.3.2 Conclusions 50
References 51
xii

LIST OF FIGURES
Figure 1. Observation Area Noise Sub-Area Map 7
Figure 2. Mean Panel Anxiety Scores Treatment Mares 10
Figure 3. Mean Movement by Day of Gestation Treatment Mares 11
Figure 4. Mean Panel Anxiety Scores/Event 13Treatment Mares Day 321 of Gestation
Figure 5. Mean Movement by Event 15Treatment Mares Day 321 of Gestation
Figure 6. One Hour of Compressed ECG-data 21
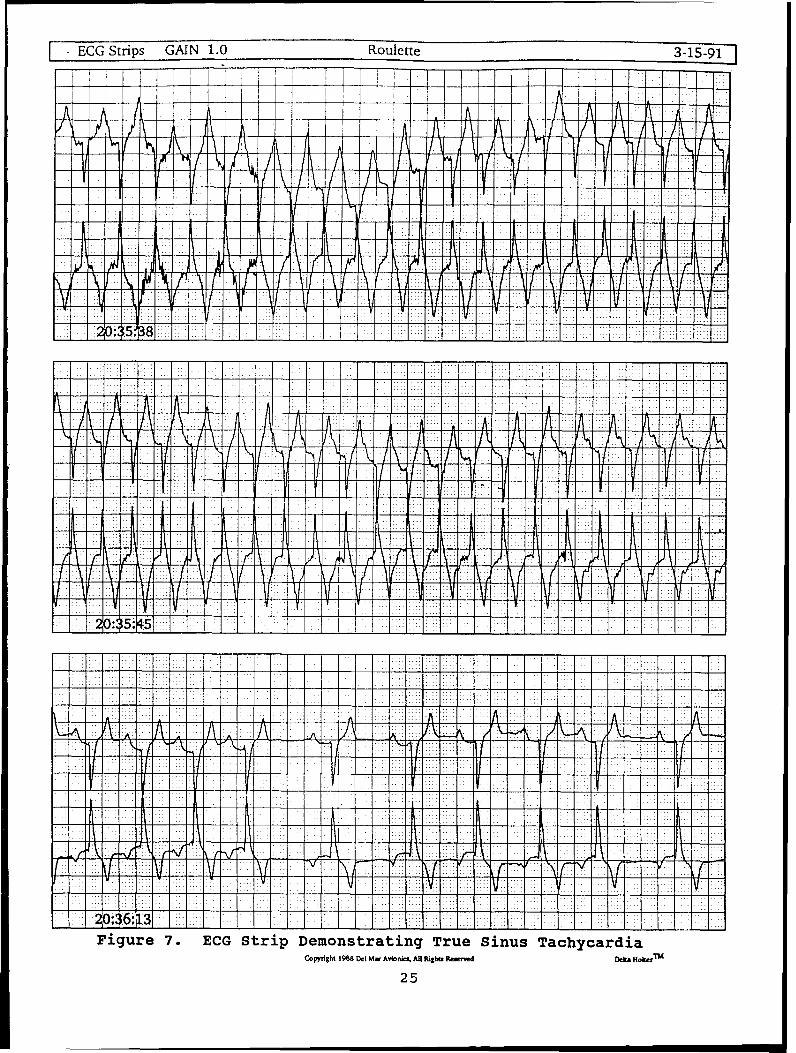
Figure 7. ECG Strip Demonstrating True Sinus Tachycardia 25
Figure 8. Serum Cortisol Concentrations 32Treatment Mare Means
Figure 9. Mean Serum Cortisol Concentrations 33Day 320 Noise Event 1
Figure 10. Serum Cortisol in Response to Sapling 34No Noise Event
Figure 11. Mean Serum Cortisol Concentrations 35Treatment Mare Means D321
Figure 12. Serum Progestogen Levels 40Control Mares
Figure 13. Serum Progestogen Levels 41Treatment Mares
Figure 14. Serum Progestogen Levels 42Treatment Mares
Figure 15. Serum Progestogen Levels 43Treatment Mares
Figure 16. Colostral IgG Production Over Time IgG 47
Figure 17. Colostral IgG Production Over Time Volume 48
Figure 18. Foal Serum IgG Absorption Over Time 49
xiii
This Page Intentionally Left Blank
xiv
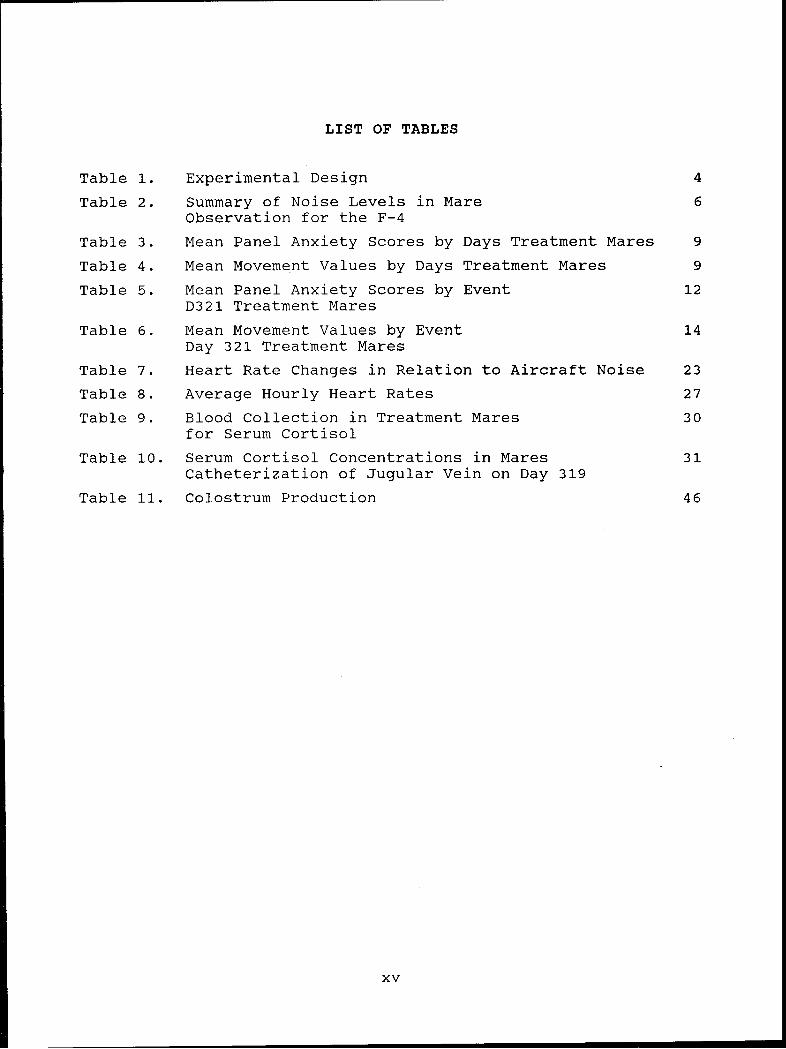
LIST OF TABLES
Table 1. Experimental Design 4
Table 2. Summary of Noise Levels in Mare 6
Observation for the F-4
Table 3. Mean Panel Anxiety Scores by Days Treatment Mares 9
Table 4. Mean Movement Values by Days Treatment Mares 9
Table 5. Mean Panel Anxiety Scores by Event 12D321 Treatment Mares
Table 6. Mean Movement Values by Event 14
Day 321 Treatment Mares
Table 7. Heart Rate Changes in Relation to Aircraft Noise 23
Table 8. Average Hourly Heart Rates 27
Table 9. Blood Collection in Treatment Mares 30for Serum Cortisol
Table 10. Serum Cortisol Concentrations in Mares 31Catheterization of Jugular Vein on Day 319
Table 11. Colostrum Production 46
xv

This Page Intentionally Left Blank
xvi

1. INTRODUCTION
Since the 1950's over 40 studies conducted in the United States
and overseas have addressed the acute effects of aircraft noise
and sonic booms on domestic animals. These studies have been
motivated both by public concerns and by claims leveled against
the United States Air Force for damage done to farm animals by
very low-level subsonic overflights. There are contradictions,
however, among controlled studies and between anecdotal reports
(claims against the USAF and popular accounts) and controlled
studies. Numerous claims suggest that catastrophic responses by
animals, such as stampedes, are possible, yet this is seldom seen
by researchers. Reasons for these contradictions include the
observational and short term nature of studies, the observation
of subtle effects that can not be proven statistically, and the
inability of researchers to design their project similar to the
conditions under which substantial damages had been reported in
claims.
Military pilots must become familiar with the aircraft that they
are assigned to fly. Training flights are conducted to enable
pilots to acquire basic flight skills, improve mobilization
readiness, and fulfill National defense mission requirements.
These Military Training Routes are conducted above rural areas.
Many times these areas have commercially-run and noncommercial
family farms, exotic animal farms, cattle ranches, and hunting
preserves. Because it is impossible to avoid all of these areas
the USAF is currently conducting studies to determine what is the
environmental impact of aircraft overflights. Information gained
from these studies will enable the USAF to avoid noise sensitive
areas, identified with research as being such, and provide
compensation for those facilities that are justifiably damaged.
1
This study was conducted to provide the USAF with a statistically
designed study that evaluates the effects of simulated F-4
aircraft noise on pregnant mares near term. It was designed to
determine the physiological and behavioral responses of mares to
aircraft noise.
2
2. STUDY I: EFFECTS OF SIMULATED AIRCRAFT NOISE ON
HEAVILY PREGNANT MARES
2.1 EXPERIMENTAL METHODS AND DESIGN
2.1.1 Specific Aim 1
Evaluate the effects of simulated F-4 aircraft noise on pregnancy
outcome, behavior (startle reflex), rate of habituation, cardiac
function, serum cortisol and progestogen concentrations of mares.
2.1.2 General Design
Sixteen pregnant mares were housed in pasture until day 313 of
gestation. These mares were of light horse breeds and included:
5 Saddlebred, 4 Thoroughbred, 4 Quarter Horse, 2 Morgans and 1
Standardbred. From day 313 until parturition, all mares were
housed in box stalls, 11 x 15 ft, from 1500 until 0900 hours.
During the remaining hours, 0900-1500, mares were turned out to
pasture. The 16 mares were assigned to a treatment or control
group (8 each) according to foaling dates. Foaling dates of
treatment mares were matched to those of control mares to reduce
the effect of season on gestation length (Table 1). All mares
were stalled in the same barn, however, in different sections to
ensure that control mares were not subjected to noise events. The
treatment and control mares were pastured in separate but similar
pastures once stalling began. All mares were fed hay and grain
and routine preventative veterinary management practices were
followed.
Mares were acclimated to the stall environment from day 313 to
day 319. On days 320, 323, and 324 of gestation, the eight
treatment mares were exposed to four daily simulated F-4 aircraft
noise events. The simulated noise was heard over 47 sec with
sound intensity increasing at 54.7 dB/sec and with maximum of 115
dBA. Three of the four noise exposures were administered between
3

1630 and 2200 hours and the fourth was administered between 0600
and 0800 hours. Exposure times were chosen randomly to avoid a
habituation response in mares. Exposure times were as follows:
On day 320-0630, 1630, 2000 and 2100; on day 323-0600, 1630,
1800, and 2030; and on day 324-0600, 1730, 2000 and 2200. On day
321 of gestation, treatment mares were exposed to 6 noise events
spaced 10 minutes apart beginning at 2030. This schedule was
chosen to simulate a worse case flight scenario. The remaining
eight control mares were not exposed to noise.
Table 1. Experimental Design
Assignment Group Due Date Foaling Date GestationLength
T1 T1 2-16-90 2-24-90 348T2 2-16-90 3-01-90 353T3 2-18-90 3-02-90 352T4 2-20-90 3-09-90 357
T5 T2 4-01-90 4-04-90 343T6 4-08-90 4-02-90 334T7 4-08-90 4-10-90 342T8 4-08-90 4-14-90 346
C1 C1 1-03-90 1-13-90 350
C2 C2 3-13-90 3-15-90 342C3 3-14-90 3-26-90 352
C4 C3 4-20-90 4-22-90 342CS 4-22-90 4-19-90 337
C6 C4 5-11-90 5-20-90 349C7 5-11-90 5-04-90 333C8 5-15-90 5-11-90 336
2.2 PREGNANCY OUTCOME
None of the mares, treatment or control, aborted. Treatment
mares all delivered live, normal foals without assistance,
whereas, one of the control mares delivered a stillborn foal that
required assistance. Gestation length of treatment mares was not
significantly different from control mares. Gestation lengths
4
for treatment and control mares were 346.9 + 7.3 and 342.6 + 7.1
days, respectively.
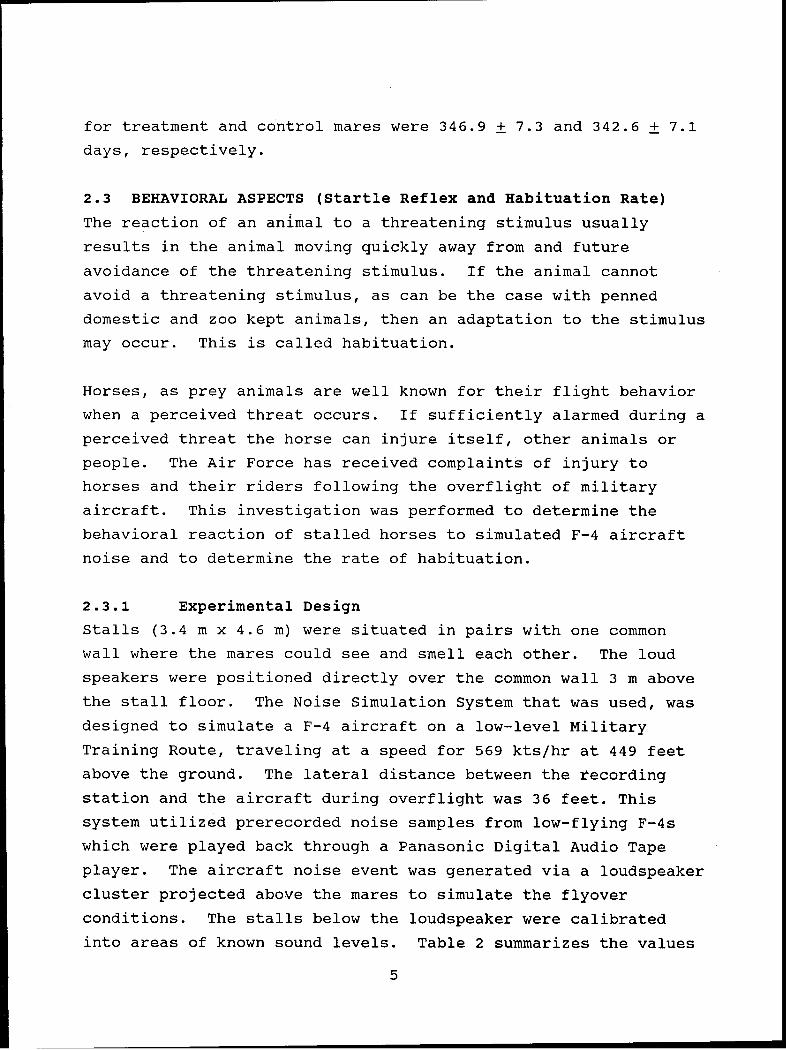
2.3 BEHAVIORAL ASPECTS (Startle Reflex and Habituation Rate)
The reaction of an animal to a threatening stimulus usually
results in the animal moving quickly away from and future
avoidance of the threatening stimulus. If the animal cannot
avoid a threatening stimulus, as can be the case with penned
domestic and zoo kept animals, then an adaptation to the stimulus
may occur. This is called habituation.
Horses, as prey animals are well known for their flight behavior
when a perceived threat occurs. If sufficiently alarmed during a
perceived threat the horse can injure itself, other animals or
people. The Air Force has received complaints of injury to
horses and their riders following the overflight of military
aircraft. This investigation was performed to determine the
behavioral reaction of stalled horses to simulated F-4 aircraft
noise and to determine the rate of habituation.
2.3.1 Experimental Design
Stalls (3.4 m x 4.6 m) were situated in pairs with one common
wall where the mares could see and smell each other. The loud
speakers were positioned directly over the common wall 3 m above
the stall floor. The Noise Simulation System that was used, was
designed to simulate a F-4 aircraft on a low-level Military
Training Route, traveling at a speed for 569 kts/hr at 449 feet
above the ground. The lateral distance between the recording
station and the aircraft during overflight was 36 feet. This
system utilized prerecorded noise samples from low-flying F-4s
which were played back through a Panasonic Digital Audio Tape
player. The aircraft noise event was generated via a loudspeaker
cluster projected above the mares to simulate the flyover
conditions. The stalls below the loudspeaker were calibrated
into areas of known sound levels. Table 2 summarizes the values
5
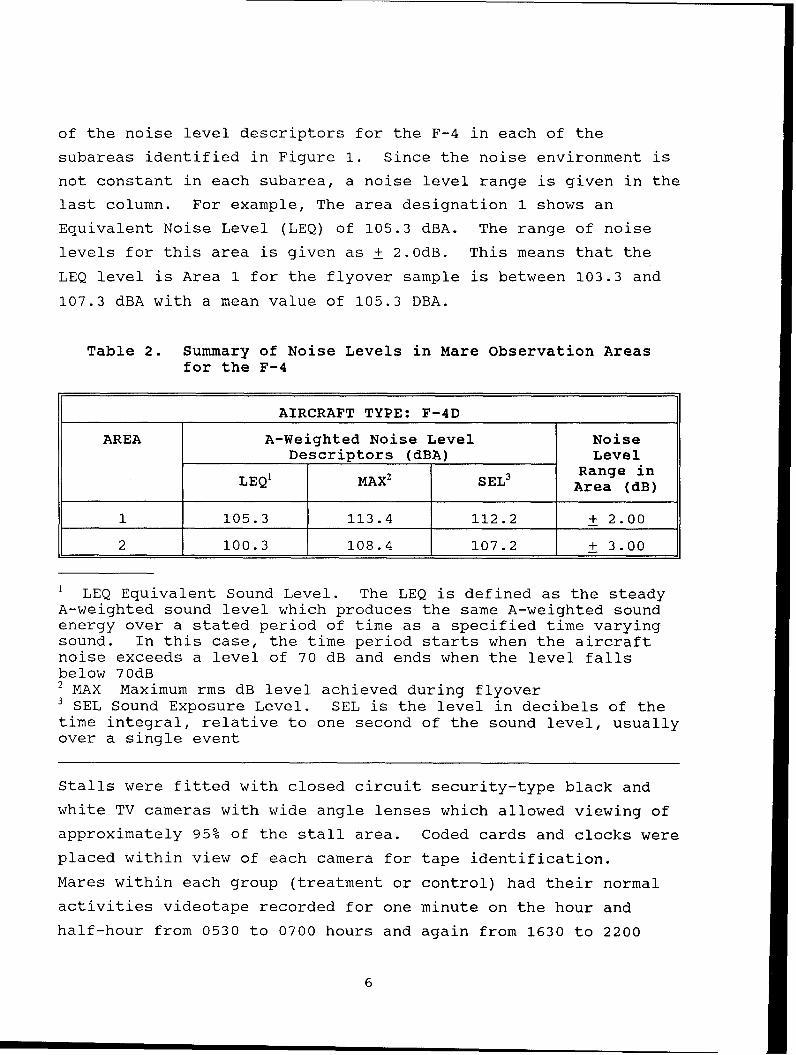
of the noise level descriptors for the F-4 in each of the
subareas identified in Figure 1. Since the noise environment is
not constant in each subarea, a noise level range is given in the
last column. For example, The area designation 1 shows an
Equivalent Noise Level (LEQ) of 105.3 dBA. The range of noise
levels for this area is given as + 2.0dB. This means that the
LEQ level is Area 1 for the flyover sample is between 103.3 and
107.3 dBA with a mean value of 105.3 DBA.
Table 2. Summary of Noise Levels in Mare Observation Areasfor the F-4
AIRCRAFT TYPE: F-4D
AREA A-Weighted Noise Level NoiseDescriptors (dBA) Level
LEQ1 MAX2 SEL' Range inArea (dB)
1 105.3 113.4 112.2 + 2.00
2 100.3 108.4 107.2 + 3.00
1 LEQ Equivalent Sound Level. The LEQ is defined as the steady
A-weighted sound level which produces the same A-weighted soundenergy over a stated period of time as a specified time varyingsound. In this case, the time period starts when the aircraftnoise exceeds a level of 70 dB and ends when the level fallsbelow 70dB2 MAX Maximum rms dB level achieved during flyover3 SEL Sound Exposure Level. SEL is the level in decibels of thetime integral, relative to one second of the sound level, usuallyover a single event
Stalls were fitted with closed circuit security-type black and
white TV cameras with wide angle lenses which allowed viewing of
approximately 95% of the stall area. Coded cards and clocks were
placed within view of each camera for tape identification.
Mares within each group (treatment or control) had their normal
activities videotape recorded for one minute on the hour and
half-hour from 0530 to 0700 hours and again from 1630 to 2200
6

hours on days 315, 318, 326 and 328 of gestation. To record
agonistic behavior due to noise treatment on days 320, 321, 323
and 324 of gestation, the mares were videotaped for one minute
each at 20, 10 and 1 minute prior to each noise event, and
continuously from 0 to 4 minutes after each noise event and again
for one minute each at 10, 20 and 40 minutes post noise.
HORSE STALL HORSE STALL
A/C B/D14 12 10 8 6 4 2 0 2 4 6 8 10 12 14
2-4-
,5 6-- -0 8
C
10
Figure 1. Observation Area Noise Sub-Area Map
A five member panel evaluated the tapes of the treatment mares
for agonistic behavior during the one minute just prior to the
noise event and during the minute starting with the beginning of
the noise event. The noise event lasted 47 seconds. The panel
members were experienced horse people and included a farrier, a
trainer, a breeder, a veterinarian and a backyard owner. The
horses were rated as follows: 2 = normal posture, 3 = alert an/or
irritation postures, 4 = alarm posture and 5 = flight posture as
described by Waring (1983). This was called the anxiety score,
7

assumed to be of increasing intensity and statistically analyzed
as continuous data. The movement scores were determined by
counting the total number of quadrants of the stall the horse
occupied or moved through during any given one minute period.
2.3.2 Statistical Analysis of Behavioral Data
Two separate analysis of variances were performed. The first
used data collected on days 320, 323, and 324 of gestation where
the response variables of anxiety and movement are averaged over
time and the second used day 321 of gestation only without
averaging the response variables over time. In each case the
difference is taken between before and during the noise treatment
values and this difference is analyzed as a Randomized Complete
Block design with horses as blocks.
2.3.3 Results
The results of effect of treatment day on mean anxiety and
movement scores for days 320, 323 and 324 are presented in Table
3 and 4. For the response, anxiety, there was a significant
difference in scores due to day of treatment (Figure 2). Anxiety
scores on day 320 were significantly higher than those on day 323
(p < 0.0001). Scores did not differ, however, between days 323
and 324. All of the treatment mares received an anxiety score of
5 (flight) from four or more of the panel members on the very
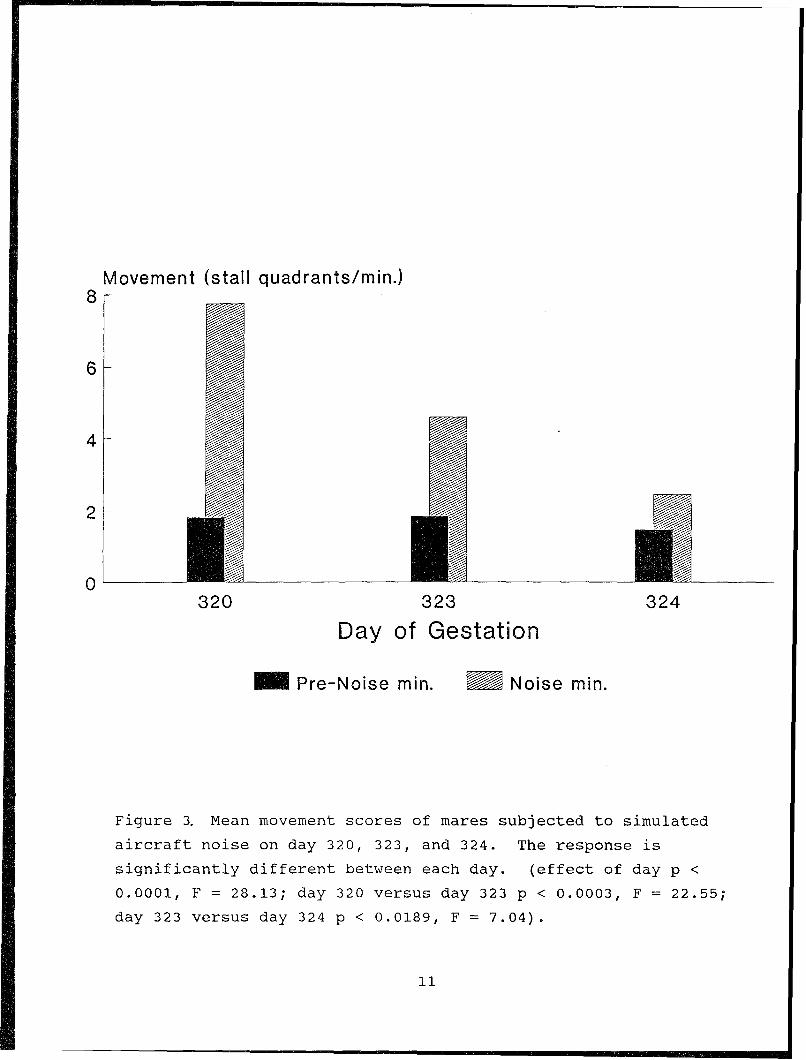
first noise exposure (day 320). For the response, movement, each
of the days (days 320, 323, and 324) are significantly different
from the others (Table 4; Figure 3, p < 0.01).
For day 321 (6 noise events in one hour), the mean anxiety score
decreased linearly over time (p < 0o0001; Table 5, Figure 4) as
did the movement score (p < 0.0005; Table 6, Figure 5). The mean
anxiety score for day 321 was 3.7. By the fifth noise event 7 of
the 8 mares had an anxiety score of 3 or less. The remaining
mare had a score of three or less by the last noise event on day
323.
8
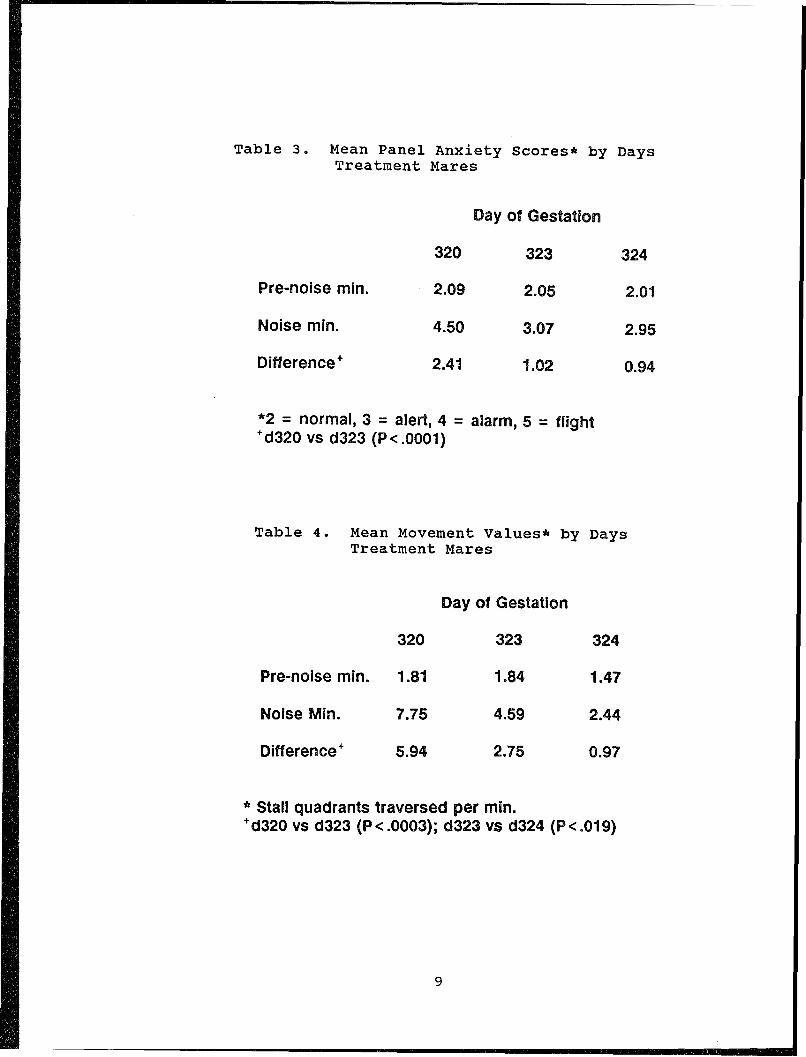
Table 3. Mean Panel Anxiety Scores* by Days
Treatment Mares
Day of Gestation
320 323 324
Pre-noise min. 2.09 2.05 2.01
Noise min. 4.50 3.07 2.95
Difference+ 2.41 1.02 0.94
*2 = normal, 3 = alert, 4 = alarm, 5 = flight+d320 vs d323 (P<.0001)
Table 4. Mean Movement Values* by DaysTreatment Mares
Day of Gestation
320 323 324
Pre-noise min. 1.81 1.84 1.47
Noise Min. 7.75 4.59 2.44
Difference + 5.94 2.75 0.97
* Stall quadrants traversed per min.+d320 vs d323 (P<.0003); d323 vs d324 (P<.019)
9

Pane& An'XieIjy Sos'5
25K
2
320 323 324
Day of Gestation
ElPre-Noise min. Noise min.
*2no~mal,3=alert4=alarm,5=f lght
Figure 2, Mean anxiety score of mares subjected to simulated
aircraft noise on days 320, 323, and 324. There was a
significant effect of day on anxiety score (p < 0.0001; F=
66.88). Mean anxiety score on day 320 was higher than on day 323
(p < 0.0001; F = 94.92). Anxiety scores did not differ on days
323 and 324 (p < 0.6067; F = 0 28).
10
Movement (stall quadrants/min.)
8-
6-
4-
2 -
0320 323 324
Day of Gestation
Pre-Noise min. Noise min.
Figure 3. Mean movement scores of mares subjected to simulated
aircraft noise on day 320, 323, and 324. The response is
significantly different between each day. (effect of day p <
0.0001, F = 28.13; day 320 versus day 323 p < 0.0003, F = 22.55;
day 323 versus day 324 p < 0.0189, F = 7.04).
11
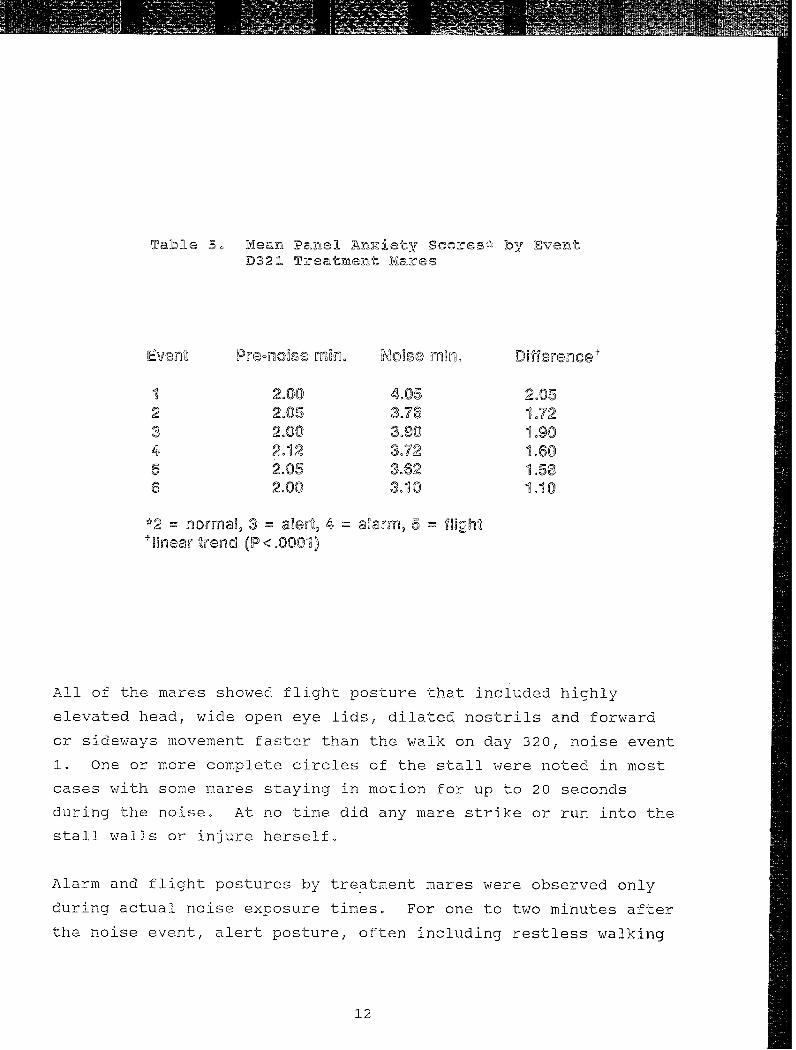
Table 5. lean Panel Anxiety Scores" by EventD321 Treatment lares
Event Pre-nolse M o olse rn~o Difarene +
1 2.00 4.05 2.052 2.05 3.78 1.723 2.00 3.90 !.90
4 2,2 3.72 1.605 2.05 3.62 1.586 2.00 3.10 1.10
*2 = normal, 3 = alert, 4 = alarm, 5 = ig:+linear tternd (P <.0001)
All of the mares showed flight posture that included highly
elevated head, wide open eye lids, dilated nostrils and forward
or sideways movement faster than the walk on day 320, noise event
1. One or more complete circles of the stall were noted in most
cases with some mares staying in motion for up to 20 seconds
during the noise. At no time did any mare strike or run into the
stall walls or injure herself.
Alarm and flight postures by treatment mares were observed only
during actual noise exposure times. For one to two minutes after
the noise event, alert posture, often including restless walking
12

Anxiety Score*
5-
4-
3-
2 --
2 3 4 5 6
Event Number
Pre-Noise M Noise
*2=normal,3=alert,4=alarm,5=flight
Figure 4. Mean anxiety scores of treatment mares on day 321 of
gestation by noise event. Mean anxiety scores decreased linearly
over time (p < 0.0001).
13
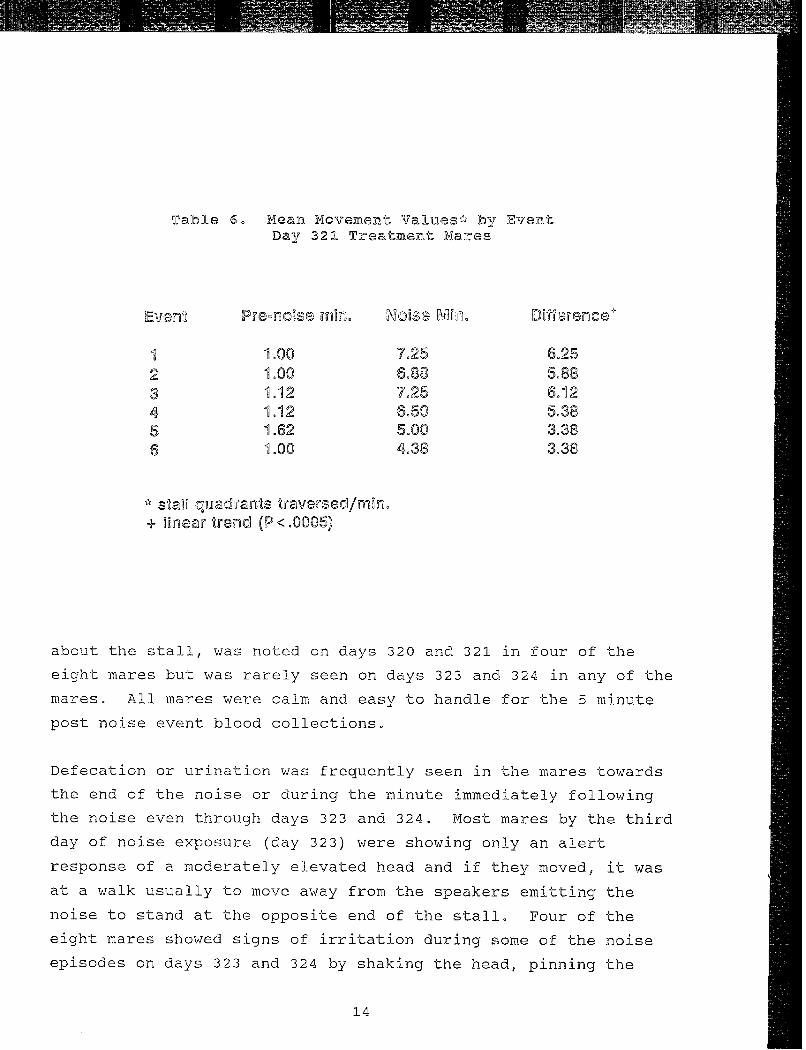
Table 6. Mean Movement Values* by EventDay 321 Treatment Mares
Evsn, Pre nosse ,nird] N oise "l.Dil re c +
1 1.00 7.25 6.252 1.00 6.88 5.883 1.12 7.25 6.124 1.12 6.50 5.385 1.62 5.00 3.386 1.00 4.38 3.38
* stal quadrants traversed/mi -+ linear trend (P <.0005)
about the stall, was noted on days 320 and 321 in four of the
eight mares but was rarely seen on days 323 and 324 in any of the
mares. All mares were calm and easy to handle for the 5 minute
post noise event blood collections,
Defecation or urination was frequently seen in the mares towards
the end of the noise or during the minute immediately following
the noise even through days 323 and 324. Most mares by the third
day of noise exposure (day 323) were showing only an alert
response of a moderately elevated head and if they moved, it was
at a walk usually to move away from the speakers emitting the
noise to stand at the opposite end of the stall. Four of the
eight mares showed signs of irritation during some of the noise
episodes on days 323 and 324 by shaking the head, pinning the
14
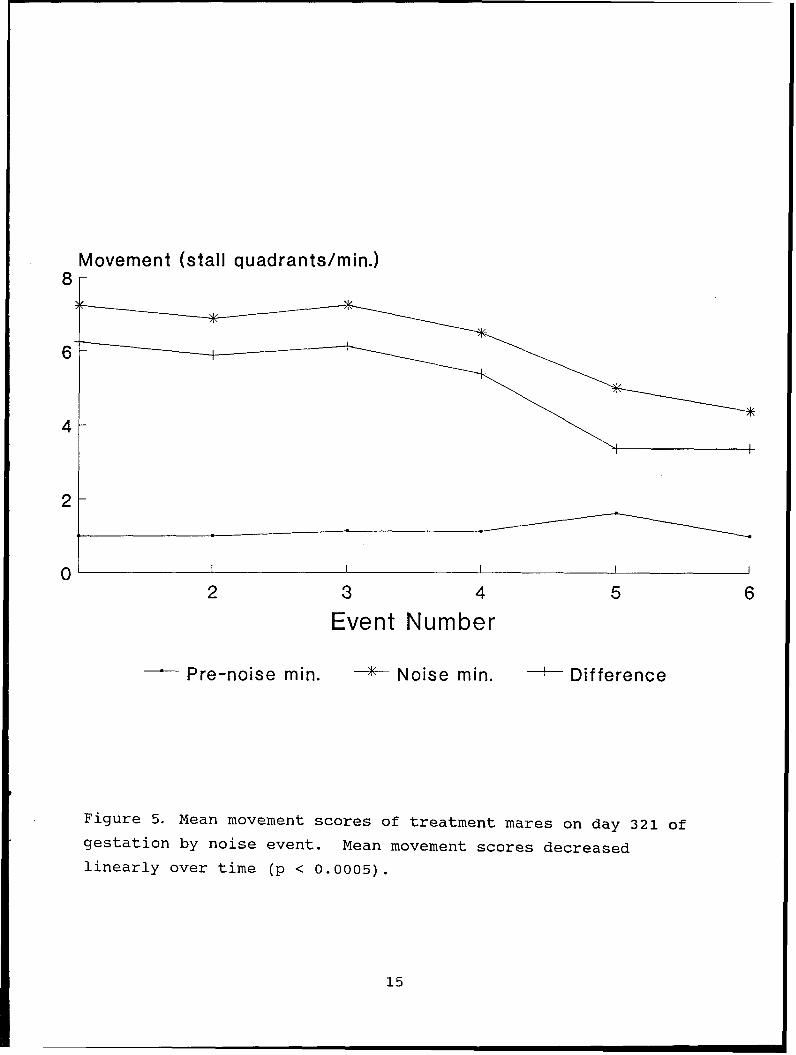
Movement (stall quadrants/min.)8-
4-
2
02 3 4 5 6
Event Number
Pre-noise min. + Noise min. - Difference
Figure 5. Mean movement scores of treatment mares on day 321 of
gestation by noise event. Mean movement scores decreased
linearly over time (p < 0.0005).
15
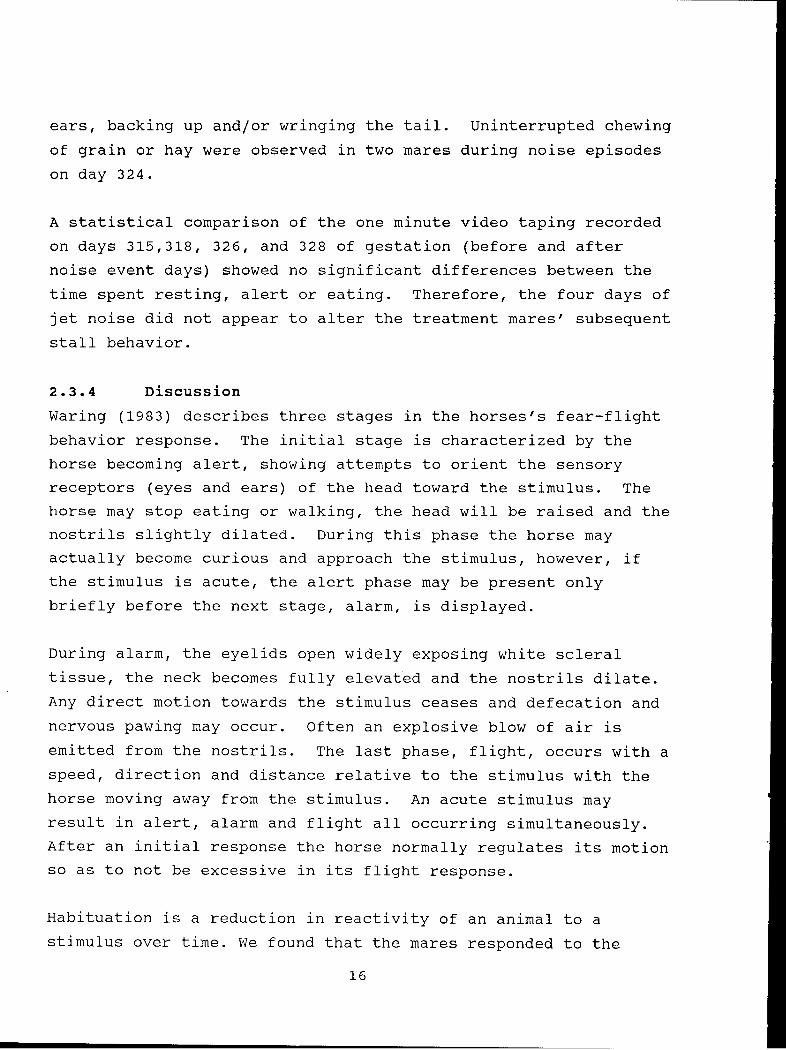
ears, backing up and/or wringing the tail. Uninterrupted chewing
of grain or hay were observed in two mares during noise episodes
on day 324.
A statistical comparison of the one minute video taping recorded
on days 315,318, 326, and 328 of gestation (before and after
noise event days) showed no significant differences between the
time spent resting, alert or eating. Therefore, the four days of
jet noise did not appear to alter the treatment mares' subsequent
stall behavior.
2.3.4 Discussion
Waring (1983) describes three stages in the horses's fear-flight
behavior response. The initial stage is characterized by the
horse becoming alert, showing attempts to orient the sensory
receptors (eyes and ears) of the head toward the stimulus. The
horse may stop eating or walking, the head will be raised and the
nostrils slightly dilated. During this phase the horse may
actually become curious and approach the stimulus, however, if
the stimulus is acute, the alert phase may be present only
briefly before the next stage, alarm, is displayed.
During alarm, the eyelids open widely exposing white scleral
tissue, the neck becomes fully elevated and the nostrils dilate.
Any direct motion towards the stimulus ceases and defecation and
nervous pawing may occur. Often an explosive blow of air is
emitted from the nostrils. The last phase, flight, occurs with a
speed, direction and distance relative to the stimulus with the
horse moving away from the stimulus. An acute stimulus may
result in alert, alarm and flight all occurring simultaneously.
After an initial response the horse normally regulates its motion
so as to not be excessive in its flight response.
Habituation is a reduction in reactivity of an animal to a
stimulus over time. We found that the mares responded to the
16
simulated aircraft noise by exhibiting all 3 stages of the fear-
flight response. With repeated exposure to the noise, the flight
phase was observed less frequently. The rate of habituation
varied considerably among individuals, however, a decrease in the
flight and alarm responses was seen in all mares by the 5th noise
on day 321. It appears that the mares may have habituated more
quickly during day 321 because of their repeated exposures to
simulated noise over a short time. Differences in behavioral
responses and in habituation rate among the mares may be due to
different perceptions of the stimulus which are regulated by
previous experience (Moberg 1985).
Krueger (1982) also reported adaptation in behavioral reaction
and heart rate of mares by the 4th or 5th overflight of a
particular aircraft. Erath (1984) exposed pregnant mares to
similar aircraft flyovers (jets and helicopters) on three
consecutive days (12 flyovers/day) and showed reductions in both
heart rates and plasma cortisol concentrations from the first to
the third day.
Horses, when compared with other grazing species, may show a more
violent response to impulse noises and hot blooded breeds, such
as the Thoroughbred, may not habituate as well as half-breeds
(Cottereau 1978). From the results of the dairy cow study
performed in conjunction with our study (Head HH 1991) it appears
that horses do react more violently to simulated aircraft noise
than dairy cows. Although this experiment used mares from several
breeds some known as hot (Thoroughbred and Saddlebred mares) and
some known as calm (Quarter Horse and Standardbred mares) there
were insufficient numbers to detect breed or temperament
differences. It has also been suggested that horses often show
little reaction to an unusual noise unless they become afraid of
the visually seen source (Schafer 1975). The mares in this study
did not show fear of the speakers in the stalls that emitted the
noise, but did respond to the noise.
17
2.3.5 Conclusion
Although all mares did show a flight response when subjected to
simulated aircraft noise, they habituated very quickly, usually
by the ninth noise treatment. It is very probable that if these
mares were in a large paddock that they may respond by running
when exposed to a loud, sudden jet noise for the first time. We
suggest that if new horses are brought into an environment that
is subject to repeated jet overflights, that they remain confined
until they habituate. Observation of behavior would be the best
method of evaluating habituation.
2.4 CARDIAC PARAMETERS
It is generally accepted that the noise generated by overflying
aircraft constitutes an annoyance in humans, but may,
particularly if occurring as a surprise, trigger a fright with
the resulting "flight" reaction in fractious animals such as the
horse. In horses, this "fright and flight" reaction appears to
be particularly pronounced and characterized by very rapid
elevation of the heart rate, induced by the release of endogenous
catecholamines resulting in tachycardias and possible ectopic
cardiac rhythms (Detweiler and Patterson 1972). These
tachycardias, however, are likely to be short and transient in
nature, and are unlikely to elevate the heart rate over prolonged
periods of time (i.e. minutes or even hours) unless one is
dealing with a particularly fractious, highstrung horse such as a
thoroughbred in training. Because of the transient nature of the
tachycardia, we do not believe of any resulting harmful effects,
unless the horse runs away during a noise episode and injures
itself during a stampede.
We hypothesize that the exposure to a sudden burst of aircraft
noise triggers a relatively short-lasting bout of excitement and
attempts to run away associated with only shortlasting (less than
a minute) sinus tachycardia and possibly supraventricular ectopic
18

tachyrhythmia in horses. In mares at late stages of their
pregnancy however, such catecholamine mediated stress-responses,
may be harmful and result in the induction of premature labor.
Long term recording of the electrocardiogram with so-called
Holter recorders (slow speed analog recording of the amplified
ECG-signal, and play-back with computer assisted processing)
appears uniquely suitable for undisturbed, long term monitoring
of the electrocardiogram of mares during their exposure to
aircraft noise.
2.4.1 Experimental Design
Each treatment mare was instrumented for 2 separate nights with a
holter ECG-recorder between their 320th and 324th day of
gestation. Monitors were placed on mares prior to the first
noise event of the evening and remained on the mares throughout
the night. Monitors were removed approximately 60 minutes after
the early morning noise event. Four pregnant mares served as
controls and underwent identical procedures except exposures to
aircraft noise. After clipping the hair and degreasing the skin
with alcohol-soaked sponges, 5 permanent self-adhesive disk
electrodes' were attached, 2 over the right scapula and 3 over
the left apex of the heart near the ventral midline. This allowed
the set-up of a bipolar base/apex lead (negative electrode over
the right scapula, positive electrode over the left apex), a
bipolar apex/base lead (negative electrode over the left apex,
positive electrode over the right scapula) and placement of one
additional electrode serving as the ground lead. The electrodes
were attached to the patient cable and to a commercially
available Holter recorder2, and the entire set-up attached around
the mare's chest with adhesive 2-inch tape and a surcingle.
AMI disp. electrodes
2Model 456A Electrocardiocorder, DelMar Avionics, Irvine CA92714
19

The signal quality of the two leads was verified with a regular
ECG machine, before a new battery and a regular tape recorder
cassette were installed in the recorder and the recording start
time was recorded on the internal digital clock of the
instrument. The mares were allowed to roam free in their stalls
during the night periods of recording and were disturbed as
little as possible, except for the drawing of venous blood
samples for hormonal analysis and cleaning out manure as
indicated. Next morning, the Holter recorders were taken off the
mares and the electrodes, leads and adhesive tape removed.
The cassette tapes were analyzed with a computer assisted Holter
analyzer3 with preset programs and additionally screened for ECG-
abnormalities, especially ectopic tachycardias, on full-
disclosure printouts, where 1 minute of analog ECG-signal (either
of the two leads, apex/base or base/apex) is printed out at slow
paperspeed and compressed to 1 line on regular 8 by 11 inch
paper. In this mode, 1 hour of compressed ECG-data may be
reviewed on a one page print-out (e.g. Figure 6). Additionally,
computer-assisted retrieval of any desired time of recording and
print-out of short strips at a regular ECG-recording speed (25
mm/sec) was done as needed, particularly during periods of
tachycardias or poor ECG signal due to muscle tremor to rule-out
artifacts.
The computer program was set up to count the average hourly heart
rate (HR), and to detect and count the number of premature
supraventricular contractions (APC), ventricular contractions
(VPC) and pauses greater than 2 seconds. We defined episodes of
"true sinus tachycardia" arbitrarily as episodes of sinus rhythm
with the heart rate in excess of 100/min lasting for 20 seconds
or longer, and episodes of "false sinus tachycardia" as sinus
3Model 152 Protrac, DelMar Avionics, Irvine CA 92714
20
Mini Disclosure Roulette 3-15-91
20:0020:0120:0220:03,444-1,"20:0420:0520:06
20:08
20:1020:120:1220:13
20:1520:1620:1720:1820:1920:2020:2120:2220:2320:2420:2520:26
20:2820:2920:3020:3120:3220:3320:34
20:3720:3820:3920:4020:4120:4220:43'20:4420:4520:4620:471 1 1 J20:4820:4920:5020:5120:5220:5320:54
20:5620:5720:5820:59
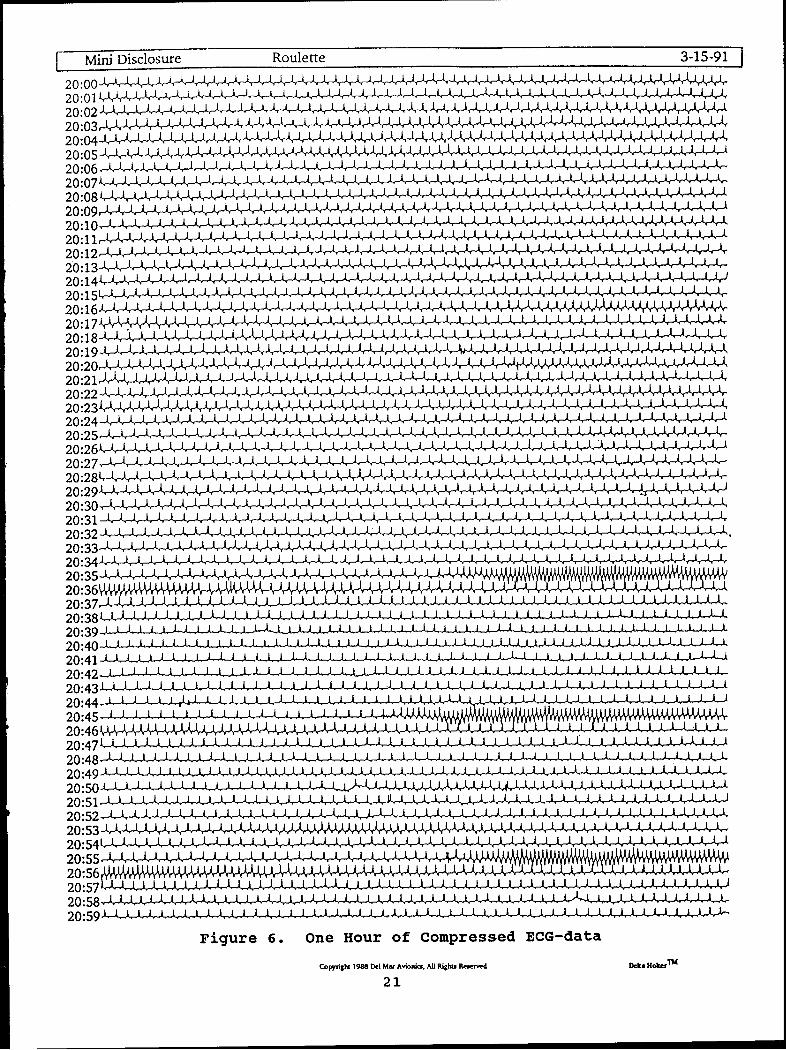
Figure 6. One Hour of Compressed ECG-data
Coffright 1988 Del Mw Avil All Right, R rlllId Delta HoMrTM
21
rhythm over 100/min lasting from 5 to 19 seconds. Episodes of
short rate increases (for less than 5 seconds) over 70/min, but
less than 100/min, were defined as "transient HR increases".
2.4.2 Statistical Analysis
For the analysis of the results, we averaged the hourly heart
rates for the entire recording time, exclusive of the hours with
noise exposure, and compared them to the averaged hourly heart
rates during which exposure to aircraft noise had occurred, with
paired t-tests for each individual mare. The average heart rates
of the control group of mares (without noise exposure) was
compared with the average heart rates of the noise-exposed mares
with Student's t-tests. Finally, we counted the episodes of "true
sinus tachycardia", "false sinus tachycardia" and transient "HR
increases" in relation to the episodes of aircraft noise, and
counted any such episodes unrelated to noise.
2.4.3 Results
One recording was lost from the recorder due to technical
malfunction of the equipment. One of the control mares foaled
before the 2nd night of Holter recording could be performed.
Otherwise, technically adequate recordings were generated from
each mare and could be analyzed by the computer.
Table 7A shows the heart rate changes (episodes of "true sinus
tachycardias", "false sinus tachycardia", and "transient heart
rate increases") in relation to aircraft noise. We noticed a
fairly consistent heart rate increase during the noise periods,
however without any ectopic arrhythmias (Figure 6). We were
surprised by the absence of any ectopic beats such as ventricular
premature contractions. Figure 7 shows an ECG strip from a mare
recorded at real speed of 25 mm/sec during an episode of true
sinus tachycardia. A total of 55 noise episodes caused a total of
21 "true sinus tachycardias", a total of 8 "false sinus
22

tachycardias", and a total of 15 "HR increases", resulting in a
total of 44 periods with noise-induced heart rate changes.
Table 7: Heart Rate Changes in Relation to Aircraft Noise
Definitions: TRUE SINUS TACH. = HR > 100 For 20 sec.FALSE SINUS TACH. = HR > 100 For 5-19 sec.HR INCREASES = HR > 70 but < 100
Table 7A. Related to Noise
MARES Record. Number of Number of Number of Number of# DATE Noise True Sinus False HR > 70
Episodes Tachs Tachs & < 100(peak HR) (peak HR)
T1 1-27-90 3 3 (120,120, 0 - 0120)
T1 1-30-90 4 0 - 0 - 4
T2 1-27-90 3 3 (150,175, 0 - 0175)
T2 1-30-90 4 0 - 0 - 1
T3 1-28-90 6 2 (110,100) 0 - 4
T4 1-26-90 3 1 (175) 0 - 0T4 1-28-90 6 2 (130,130) 2 (120,110) 2
T5 3-15-90 6 4 (175,150, 2 (120,120) 0150,120)
T5 3-17-90 4 3 (120,100, 0 - 1110)
T6 3-15-90 6 0 - 3 (100,120 2100)
T6 3-17-90 4 0 - 0 - 0
T7 3-14-90 2 2 (175,175) 0 - 0T7 3-16-90 1 0 - 0 - 1
T8 3-14-90 2 1 (150) 1 (130) 0T8 3-16-90 1 0 - 0 - 0
TOTAL 55 21 8 - 15
23

Table 7B. Unrelated to Noise
Mares Recording Number of Number of# Date True Tachs. False Tachs.
(peak HR) (peak HR)
T1 1-27-90 2 (130,110) 0 -
T1 1-30-90 0 - 2 -
T2 1-27-90 0 - 1 (130)T2 1-30-90 0 - 3 (100,100,100)
T3 1-28-90 0 - 0 -
T4 1-26-90 1 (130) 1 (130)T4 1-28-90 0 - 0 -
T5 3-15-90 0 - 0 -T5 3-17-90 2 (100,100) 1 (140)
T6 3-15-90 0 - 1 (100)T6 3-17-90 0 - 0 -
T7 3-14-90 0 - 1 (100)T7 3-16-90 0 - 3 (100,100,100)
T8 3-14-90 2 (120,150) 26 ***T8 3-16-90 0 - 3 (100,100,100)
Total 7 45
Control Mares
C1 4-21-90 1 (120) 0 -
C6 4-20-90 0 - 0 -
C6 4-22-90 0 - 0 -
C7 4-21-90 0 - 0 -
C7 4-24-90 1 (100) 0 -
C8 4-20-90 0 - 0 -C8 4-22-90 0 - 0 -
Total 2 - 0
***(120,110,100,100,100,110,100,110,100,100,120,120,120,140,110,120,120,130,120,100,110,110,100,110,110,110).
24
EGG Strips GAIN 1.0 Roulette 3-15-91
1--\ ~ - - - - ---
_J- 1 1- -
9 A
5 5 V .. ...
J-- -- iit V..
r: UVV. A
2 725
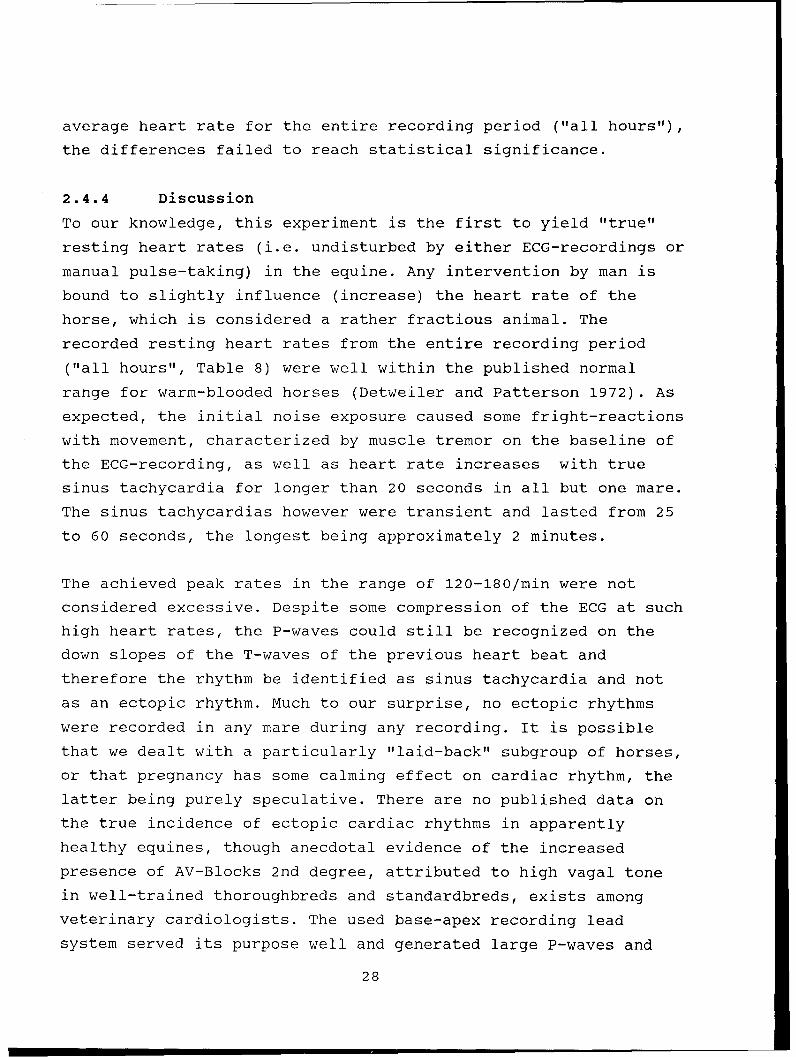
In contrast, a total of 7 "true sinus tachycardias" and a total
of 45 (26 in one mare alone) "false sinus tachycardias",
resulting in a total of 52 heart rate changes unassociated with
noise, occurred in treatment mares unrelated to aircraft noise,
(Table 7B). One individual mare, T6 didn't seem to get disturbed
very much and showed only mild heart rate increases without
developing tachycardias during noise periods. Another mare, T8,
appeared irritated during the experiment on the night of 3/14/90
and had frequent (a total of 26) episodes of "false sinus
tachycardia" unrelated to aircraft noise. The peak heart rates
reached during the episodes of tachycardia are also indicated in
Table 7. They fell into the ranges previously published (120-
180/min) (Detweiler and Patterson 1972) for sinus tachycardias in
the horse and were not considered excessive.
There appears to be some adaptation to the noise with less of a
heart rate increase with repeated noise episodes, however we did
not have sufficient numbers to prove it. For example, mare T1
showed 3 noise-related episodes of "true sinus tachycardia"
during the first night of recording, while only 4 noise-related
episodes of "transient HR increases" were recorded during the
second night of recording. There were no "true" and "false" sinus
tachycardias observed in control mares.
In Table 8, the average hourly heart rates are reported for
control and experimental mares, broken down into overall average
hourly heart rates, average hourly heart rates during hours with
aircraft noise and average hourly heart rates during hours
without noise. The difference of average heart rates for all
hours, between control and treatment mares failed to reach
statistical significance (p > 0.05). Despite considerable overlap
of the standard deviations, the means of the average heart rates
during "no sound" hours (54.8/min) were significantly different
from the "sound" hours (57.4/min), p < 0.05. When compared to the
26
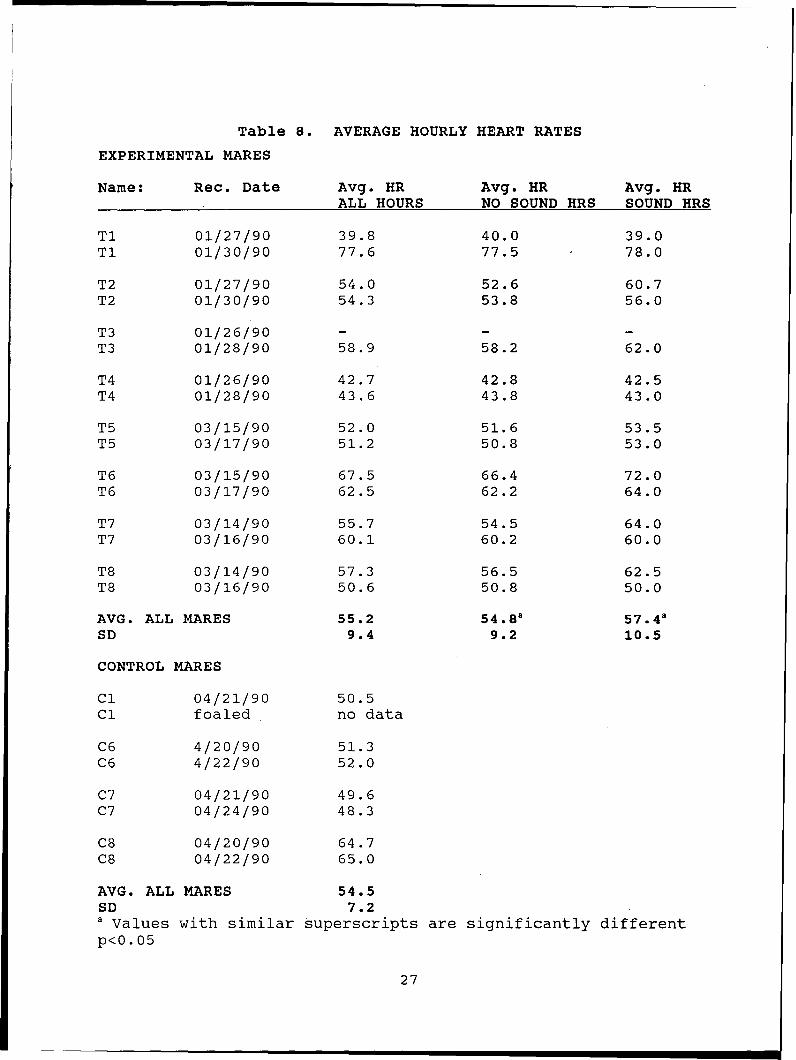
Table 8. AVERAGE HOURLY HEART RATES
EXPERIMENTAL MARES
Name: Rec. Date Avg. HR Avg. HR Avg. HRALL HOURS NO SOUND HRS SOUND HRS
Ti 01/27/90 39.8 40.0 39.0Ti 01/30/90 77.6 77.5 - 78.0
T2 01/27/90 54.0 52.6 60.7T2 01/30/90 54.3 53.8 56.0
T3 01/26/90 -
T3 01/28/90 58.9 58.2 62.0
T4 01/26/90 42.7 42.8 42.5T4 01/28/90 43.6 43.8 43.0
T5 03/15/90 52.0 51.6 53.5T5 03/17/90 51.2 50.8 53.0
T6 03/15/90 67.5 66.4 72.0T6 03/17/90 62.5 62.2 64.0
T7 03/14/90 55.7 54.5 64.0T7 03/16/90 60.1 60.2 60.0
T8 03/14/90 57.3 56.5 62.5T8 03/16/90 50.6 50.8 50.0
AVG. ALL MARES 55.2 54.8a 57.4"
SD 9.4 9.2 10.5
CONTROL MARES
Cl 04/21/90 50.5Cl foaled no data
C6 4/20/90 51.3C6 4/22/90 52.0
C7 04/21/90 49.6C7 04/24/90 48.3
C8 04/20/90 64.7C8 04/22/90 65.0
AVG. ALL MARES 54.5SD 7.2a Values with similar superscripts are significantly different
p<0.05
27
average heart rate for the entire recording period ("all hours"),
the differences failed to reach statistical significance.
2.4.4 Discussion
To our knowledge, this experiment is the first to yield "true"
resting heart rates (i.e. undisturbed by either ECG-recordings or
manual pulse-taking) in the equine. Any intervention by man is
bound to slightly influence (increase) the heart rate of the
horse, which is considered a rather fractious animal. The
recorded resting heart rates from the entire recording period
("all hours", Table 8) were well within the published normal
range for warm-blooded horses (Detweiler and Patterson 1972). As
expected, the initial noise exposure caused some fright-reactions
with movement, characterized by muscle tremor on the baseline of
the ECG-recording, as well as heart rate increases with true
sinus tachycardia for longer than 20 seconds in all but one mare.
The sinus tachycardias however were transient and lasted from 25
to 60 seconds, the longest being approximately 2 minutes.
The achieved peak rates in the range of 120-180/min were not
considered excessive. Despite some compression of the ECG at such
high heart rates, the P-waves could still be recognized on the
down slopes of the T-waves of the previous heart beat and
therefore the rhythm be identified as sinus tachycardia and not
as an ectopic rhythm. Much to our surprise, no ectopic rhythms
were recorded in any mare during any recording. It is possible
that we dealt with a particularly "laid-back" subgroup of horses,
or that pregnancy has some calming effect on cardiac rhythm, the
latter being purely speculative. There are no published data on
the true incidence of ectopic cardiac rhythms in apparently
healthy equines, though anecdotal evidence of the increased
presence of AV-Blocks 2nd degree, attributed to high vagal tone
in well-trained thoroughbreds and standardbreds, exists among
veterinary cardiologists. The used base-apex recording lead
system served its purpose well and generated large P-waves and
28
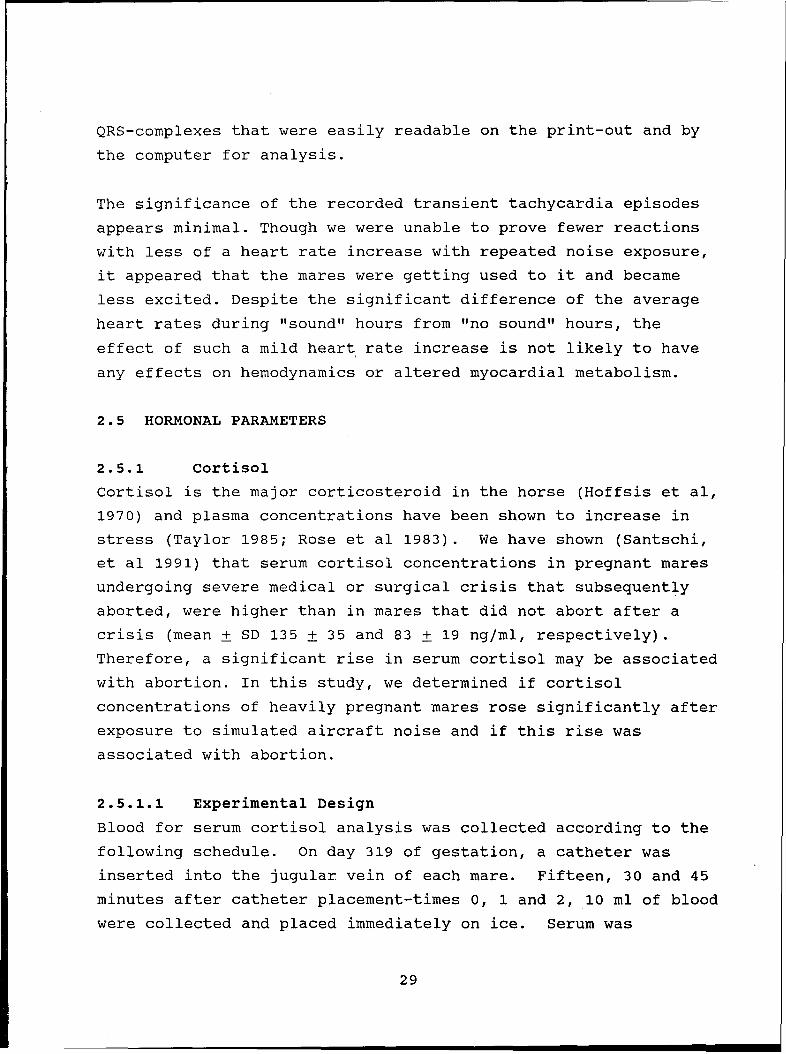
QRS-complexes that were easily readable on the print-out and by
the computer for analysis.
The significance of the recorded transient tachycardia episodes
appears minimal. Though we were unable to prove fewer reactions
with less of a heart rate increase with repeated noise exposure,
it appeared that the mares were getting used to it and became
less excited. Despite the significant difference of the average
heart rates during "sound" hours from "no sound" hours, the
effect of such a mild heart rate increase is not likely to have
any effects on hemodynamics or altered myocardial metabolism.
2.5 HORMONAL PARAMETERS
2.5.1 Cortisol
Cortisol is the major corticosteroid in the horse (Hoffsis et al,
1970) and plasma concentrations have been shown to increase in
stress (Taylor 1985; Rose et al 1983). We have shown (Santschi,
et al 1991) that serum cortisol concentrations in pregnant mares
undergoing severe medical or surgical crisis that subsequently
aborted, were higher than in mares that did not abort after a
crisis (mean + SD 135 + 35 and 83 + 19 ng/ml, respectively).
Therefore, a significant rise in serum cortisol may be associated
with abortion. In this study, we determined if cortisol
concentrations of heavily pregnant mares rose significantly after
exposure to simulated aircraft noise and if this rise was
associated with abortion.
2.5.1.1 Experimental Design
Blood for serum cortisol analysis was collected according to the
following schedule. On day 319 of gestation, a catheter was
inserted into the jugular vein of each mare. Fifteen, 30 and 45
minutes after catheter placement-times 0, 1 and 2, 10 ml of blood
were collected and placed immediately on ice. Serum was
29
harvested and stored at -200C in labelled, dated, 2 ml vials
until assayed. From days 320-324 blood was drawn from treatment
mares according to the schedule in Table 8. Blood was drawn from
control mares on days 320 of gestation according to the protocol
listed for noise cycle 1- day 320. To ensure that any rise in
serum cortisol concentration was due to noise, three treatment
mares were bled according to the protocol listed for noise cycle
1 two weeks after noise treatment.
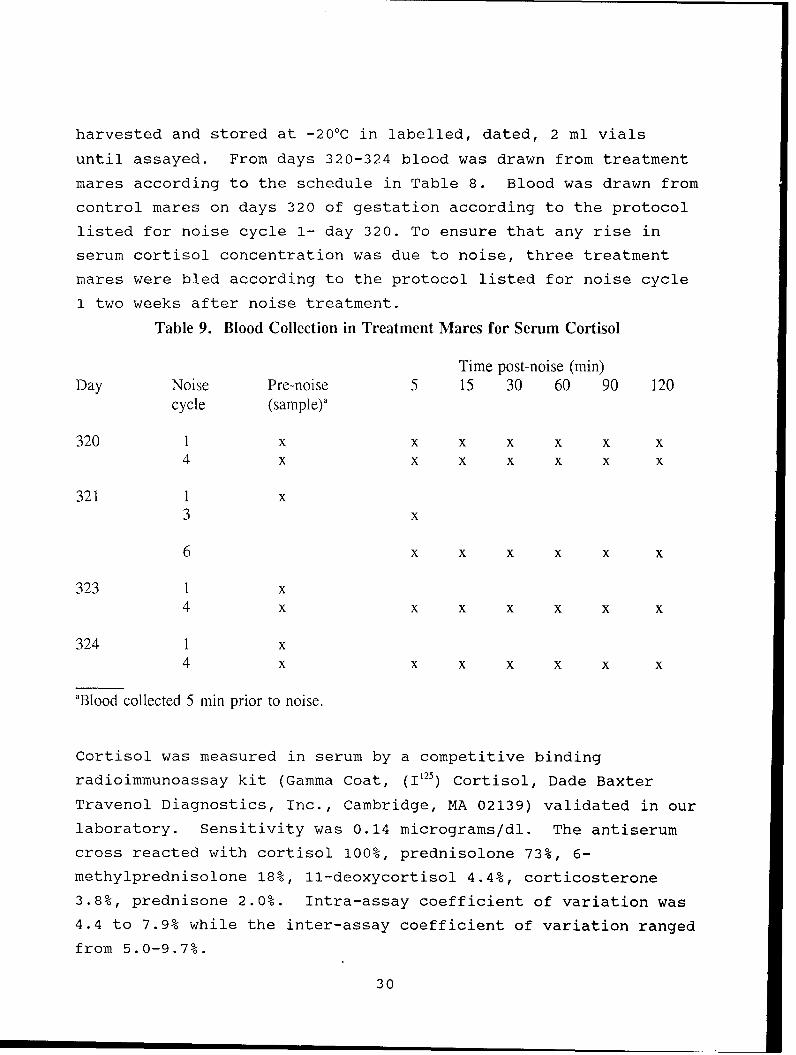
Table 9. Blood Collection in Treatment Mares for Serum Cortisol
Time post-noise (min)Day Noise Pre-noise 5 15 30 60 90 120
cycle (sample)a
320 1 x x x x x x x4 x x x x x x x
321 1 x3 x
6 x x x x x x
323 1 x4 x x x x x x x
324 1 x4 x x x x x x x
aBlood collected 5 min prior to noise.
Cortisol was measured in serum by a competitive binding
radioimmunoassay kit (Gamma Coat, (1125) Cortisol, Dade Baxter
Travenol Diagnostics, Inc., Cambridge, MA 02139) validated in our
laboratory. Sensitivity was 0.14 micrograms/dl. The antiserum
cross reacted with cortisol 100%, prednisolone 73%, 6-
methylprednisolone 18%, 11-deoxycortisol 4.4%, corticosterone
3.8%, prednisone 2.0%. Intra-assay coefficient of variation was
4.4 to 7.9% while the inter-assay coefficient of variation ranged
from 5.0-9.7%.
30
2.5.1.2 Statistical Analysis of Cortisol Data
Differences between pre-noise treatment cortisol concentrations
and times 5, 15, 30, 60, 90, and 120 after noise events were
analyzed by paired Student t-tests with p values < 0.05
considered significant. The effect of repeated blood collection
on serum cortisol concentrations on day 319 was analyzed by
paired Student t-tests. Differences between treatment and
control groups were evaluated by Student t-tests.
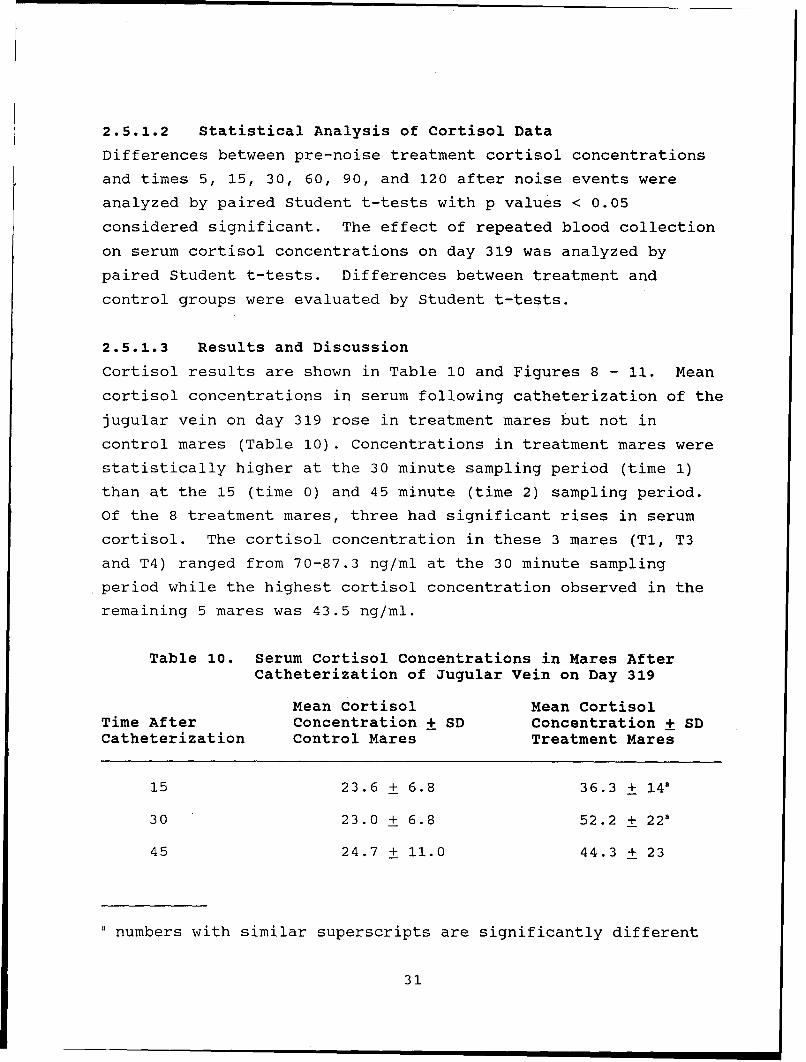
2.5.1.3 Results and Discussion
Cortisol results are shown in Table 10 and Figures 8 - 11. Mean
cortisol concentrations in serum following catheterization of the
jugular vein on day 319 rose in treatment mares but not in
control mares (Table 10). Concentrations in treatment mares were
statistically higher at the 30 minute sampling period (time 1)
than at the 15 (time 0) and 45 minute (time 2) sampling period.
Of the 8 treatment mares, three had significant rises in serum
cortisol. The cortisol concentration in these 3 mares (TI, T3
and T4) ranged from 70-87.3 ng/ml at the 30 minute sampling
.period while the highest cortisol concentration observed in the
remaining 5 mares was 43.5 ng/ml.
Table 10. Serum Cortisol Concentrations in Mares AfterCatheterization of Jugular Vein on Day 319
Mean Cortisol Mean CortisolTime After Concentration + SD Concentration + SDCatheterization Control Mares Treatment Mares
15 23.6 + 6.8 36.3 + 14a
30 23.0 + 6.8 52.2 + 22a
45 24.7 + 11.0 44.3 + 23
a numbers with similar superscripts are significantly different
31

Cortisol (ng/ml)55-
50- a
45- a
40-
35-
30-
25 - - I I Ipre 5 15 30 60 90 120
Time (minutes post noise event)
D320-1 -- -- D320-4 - D323-4 ---.... D324-4
Figure 8. Mean serum cortisol concentration of mares subject to
simulated aircraft noise on days 320, 323, and 324 of gestation.
Blood samples were collected before and after simulated noise
during noise event 1 on day 320, and event 4 on days 320, 323 and
324 of gestation. Mean cortisol concentration in serum of mares
was significantly higher at 15, 30 and 120 min post noise (a, p <
0.03) than before subjection to noise only after noise event 1,
day 320. The vertical bars represent the standard deviation at
each time point.
32

Cortisol (ng/ml)60
b
50
40
30
20
10
0 I I I
pre 5 15 30 60 90 120Time (minutes post noise event)
-~ Control - Treatment
Figure 9. Mean serum cortisol concentrations on day 320 of
gestation. Mean serum cortisol concentrations of treatment mares
prior to and after simulated noise during event 1, day 320 are
compared to control mares bled in a similar sequence but not
subjected to noise. Mean cortisol concentrations n serum of
treatment mares was significantly higher at 15, 30, and 120 min
post noise (b, p < 0.05) than concentrations measured in control
mares.
33
Cortisol (ng/ml)
60-
50
40
30 -
20
10
0Pre 15 30 60 90 120
Time (minutes)
- Treatment - Control
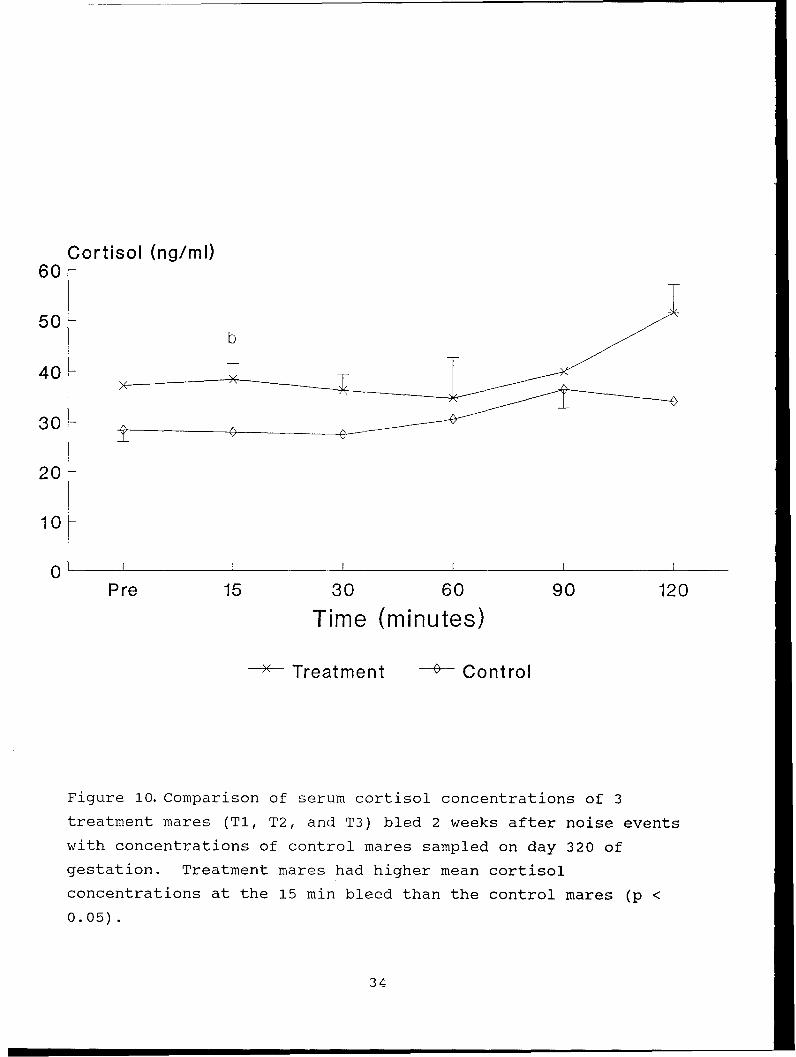
Figure 10. Comparison of serum cortisol concentrations of 3
treatment mares (TI, T2, and T3) bled 2 weeks after noise events
with concentrations of control mares sampled on day 320 of
gestation. Treatment mares had higher mean cortisol
concentrations at the 15 min bleed than the control mares (p <
0.05).
34
Cortisol (ng/ml)60- T0 140-
30
20
10
0I I I I I I
1-pre 5 15 30 60 90 120Time (minutes post noise event)
x 321-1-pre A 321-6
* 321-3-5
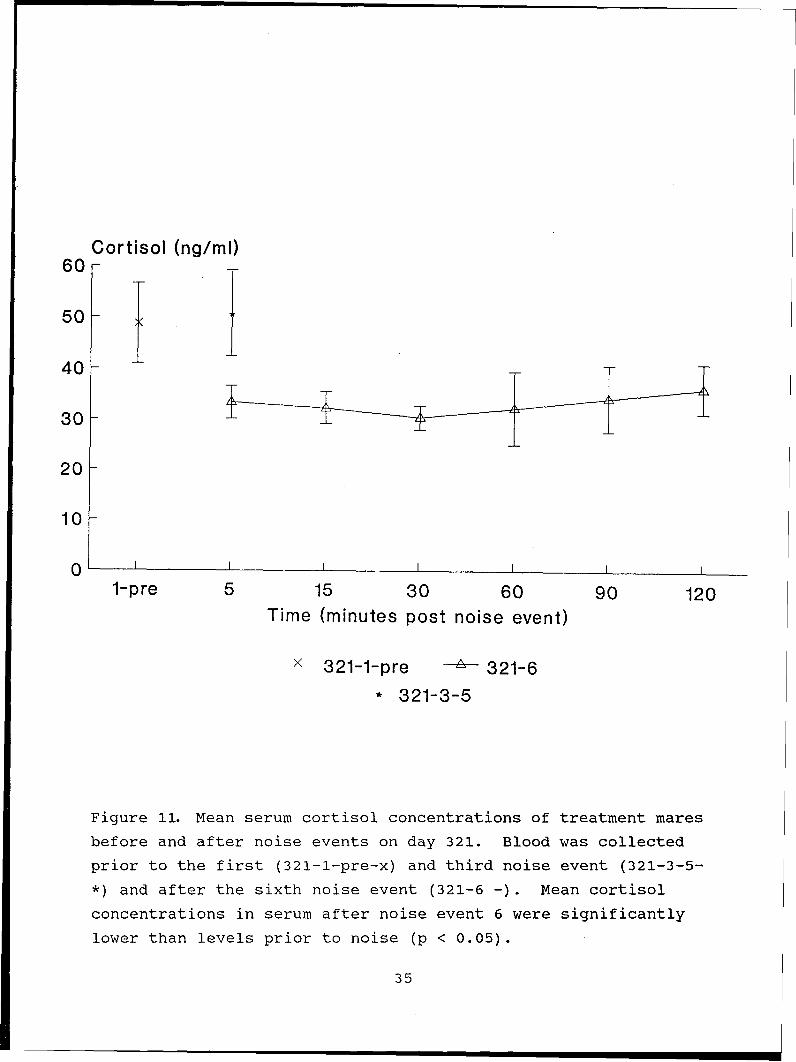
Figure 11. Mean serum cortisol concentrations of treatment mares
before and after noise events on day 321. Blood was collected
prior to the first (321-l-pre-x) and third noise event (321-3-5-
*) and after the sixth noise event (321-6 -). Mean cortisol
concentrations in serum after noise event 6 were significantly
lower than levels prior to noise (p < 0.05).
35
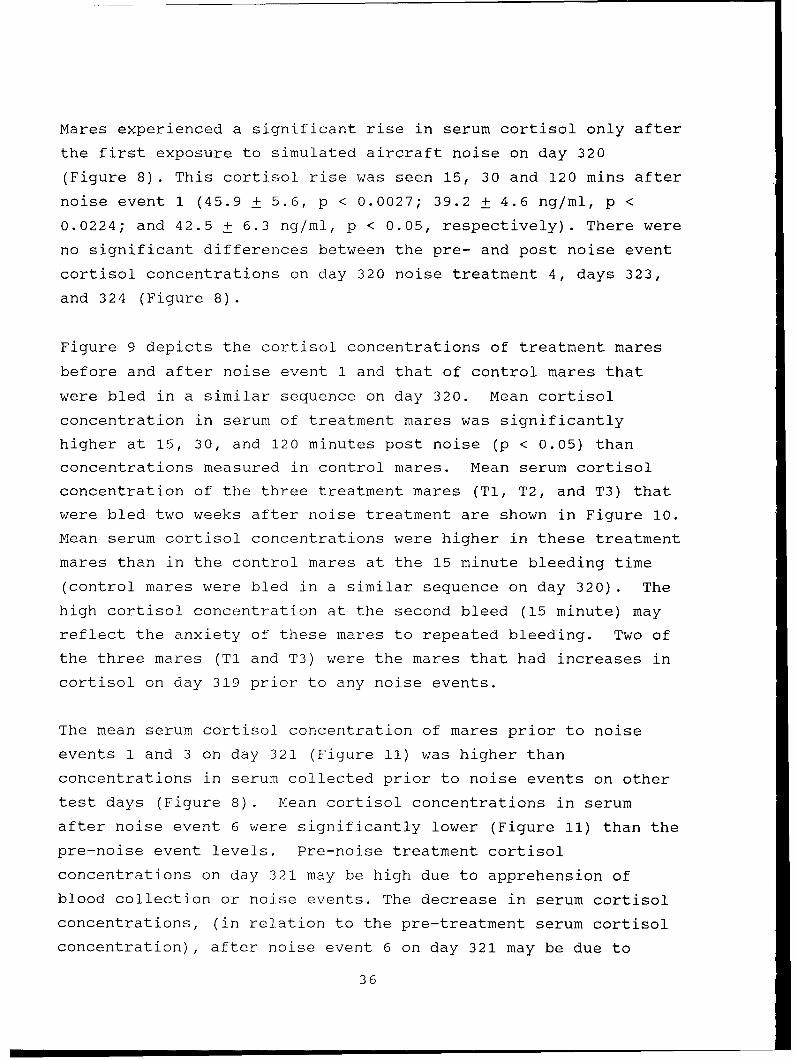
Mares experienced a significant rise in serum cortisol only after
the first exposure to simulated aircraft noise on day 320
(Figure 8). This cortisol rise was seen 15, 30 and 120 mins after
noise event 1 (45.9 + 5.6, p < 0.0027; 39.2 + 4.6 ng/ml, p <
0.0224; and 42.5 + 6.3 ng/ml, p < 0.05, respectively). There were
no significant differences between the pre- and post noise event
cortisol concentrations on day 320 noise treatment 4, days 323,
and 324 (Figure 8).
Figure 9 depicts the cortisol concentrations of treatment mares
before and after noise event 1 and that of control mares that
were bled in a similar sequence on day 320. Mean cortisol
concentration in serum of treatment mares was significantly
higher at 15, 30, and 120 minutes post noise (p < 0.05) than
concentrations measured in control mares. Mean serum cortisol
concentration of the three treatment mares (T1, T2, and T3) that
were bled two weeks after noise treatment are shown in Figure 10.
Mean serum cortisol concentrations were higher in these treatment
mares than in the control mares at the 15 minute bleeding time
(control mares were bled in a similar sequence on day 320). The
high cortisol concentration at the second bleed (15 minute) may
reflect the anxiety of these mares to repeated bleeding. Two of
the three mares (TI and T3) were the mares that had increases in
cortisol on day 319 prior to any noise events.
The mean serum cortisol concentration of mares prior to noise
events 1 and 3 on day 321 (Figure 11) was higher than
concentrations in serum collected prior to noise events on other
test days (Figure 8). Mean cortisol concentrations in serum
after noise event 6 were significantly lower (Figure 11) than the
pre-noise event levels. Pre-noise treatment cortisol
concentrations on day 321 may be high due to apprehension of
blood collection or noise events. The decrease in serum cortisol
concentrations, (in relation to the pre-treatment serum cortisol
concentration), after noise event 6 on day 321 may be due to
36

habituation. From the behavioral study it appears that all mares
had a significant decrease in movement after the fifth noise on
day 321 (ninth noise event of study). The low cortisol
concentrations in treatment mares after noise event 6 on day 321
may reflect this behavioral change.
There were 26 blood samples with a cortisol concentration > 60
ng/ml during the noise events. Twenty four of the 26 samples
were from the three mares (Ti, T3 and T4) that had high plasma
cortisol concentrations during the pre-noise bleed on day 319.
The remaining 2 samples were taken from treatment mare 8, one on
day 321-pre noise and the other on day 321 noise event 3 post 5
minutes.
In conclusion, a significant increase in cortisol was seen after
the first exposure to noise. This increase was not seen after
other noise episodes. Three mares were primarily responsible for
this rise in cortisol indicating that the response of mares to
noise varies considerably. From the cortisol and behavioral data
it is evident that the mares habituate to repeated noise events.
Until that occurs, care must be taken to avoid injury to the
horse and to people.
2.5.2 Progestagens
Abortion has been associated with severe maternal disease in the
horse, but the effect of maternal stress on the fetus and the
mechanism of abortion is unknown. Endocrine studies of stressed
pregnant mares suggest an effect on progestogen levels (van
Niekerk & Morganthal 1982; Ousey et al, 1987; Santschi et al,
1991), but its association with abortion remains conjectural.
High concentrations of progestagens are produced by the feto-
placental unit during the last trimester of pregnancy (Barnes et
al, 1975). A decrease in progestagens may reflect a decreased
ability of the feto-placental unit to produce progestagens and
transport them to the endometrium leading to the demise of the
37
fetus. We have shown that serum levels in the dam drop
dramatically if the fetus dies in-utero (Santschi, et al, 1991).
It has been assumed that simulated aircraft noise is stressful to
horses, particularly heavily pregnant mares. If the stress is
severe, abortion may result. We measured progestagens in this
study to determine if simulated aircraft noise affected the feto-
placental unit adversely.
2.5.2.1 Experimental Design
Serum progestogen concentration was measured in the following
blood samples collected from treatment mares: day 320 cycle 1
pre-noise event, days 323 and 324 cycle 4 120 minutes post-noise
event, and every third day thereafter until 7 days before foaling
at which time serum progestogen was measured daily. The same
protocol was followed for control mares except they were not
subjected to noise.
Progestagens were measured in plasma by a solid-phase
radioimmunoassay (Coat-a-count, Diagnostic Products Corp., Los
Angeles, CA) validated in our laboratory. Sensitivity was < 0.1
ng/ml. The antiserum crossreacted with progesterone (100%), 11-
deoxycorticosterone 1.7%, 11-deoxycortisol 2.4%, 17 alpha-
hydroxyprogesterone (0.3%), 20 alpha-dihydroprogesterone (2.0%),
5B-pregnane-3alpha-ol-20-one (0.2%), 5 alpha-Pregnane-3,20-dione
(0.8%), and 5 b-Pregnane-3,20-dione (1.3%). Intra-assay
coefficient of variation was 4.5-6.3% while the inter-assay
coefficient of variation ranged from 10 to 12%. While most of
the steroid measured early in pregnancy was probably
progesterone, during the last trimester of pregnancy the assay
would alsu be measuring the pregnanes, 17 alpha-
hydroxprogesterone, and 20 alpha-dihydroprogesterone (Seren et
al, 1981). The term progestagens is therefore used to refer to
the steroids measured by this assay.
38

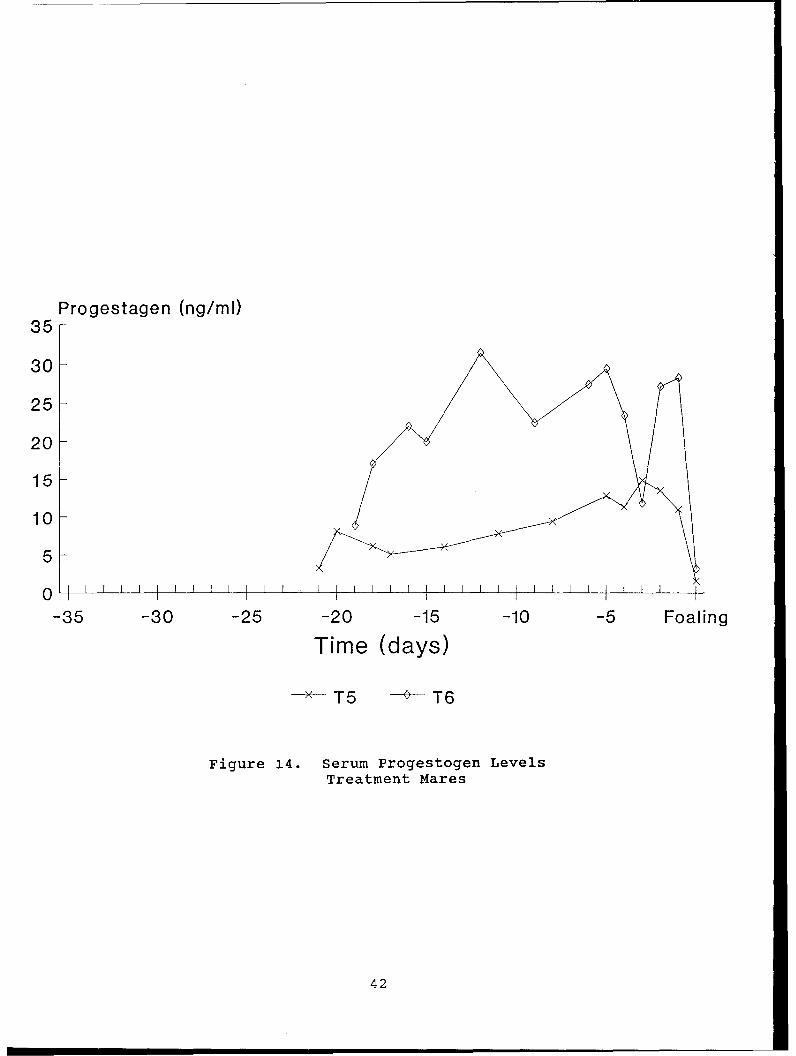
2.5.2.2 Results and Discussion
The progestogen concentrations varied greatly among individuals
(Figures 12-15), however, the progestogen profiles were well
within the normal range (Ginther 1979). During the last month of
pregnancy, progestagens gradually increased in all mares, peaking
2 days prior to parturition and falling off to zero at
parturition. In no mare did progestogen levels prior to
parturition fall below 2 ng/ml.
The progestogen values we obtained from mares in this study
differed from the studies performed in Germany by Krueger (1982)
and by Erath (1984). The'se differences may be due to assay
techniques. Progesterone is necessary for pregnancy maintenance
in the mare. Until day 80 of gestation, the corpus luteum is the
primary source of progesterone. At this time, the feto-placental
unit begins to contribute to the pool of circulating maternal
progestagens by producing 5 alpha-pregnanes. Plasma progesterone
begins to decline by day 120 and only small amounts of
progesterone are measurable in plasma by day 150. Presumably
pregnancy is then maintained by placental progestogen production
(Holtan et al, 1975). There is disagreement, however, on what is
considered to be the normal concentration of plasma progestogen
between Day 120 and parturition with daily progestogen values of
1 ng to 8 ng/ml reported as normal (Holtan et al, 1975; Squires
et al, 1974). The discrepancy between reports can be attributed
to cross-reaction of progesterone antiserum used in
radioimmunoassays with other progestagens. Because of this
cross-reactivity, interpretation of progesterone values obtained
by RIA after 80 days of gestation must be interpreted with
caution. A low plasma progesterone value may be due to a RIA
that is extremely progesterone specific. Our progestogen values
were always well above the minimum of 2 ng/ml. We conclude that
simulated F-4 aircraft noise did not affect pregnancy adversely.
39

Progestagen (ng/ml)
50-
40
30-
20-
10-
0-35 -30 -25 -20 -15 -10 -5 Foaling
Time (days)
-C4 C3 0C2
Figure 12. Serum progestogen concentrations in 3 control mares
prior to foaling. Blood was collected from mares from day 319
until parturition. The profiles are within the normal published
ranges.
40
Progestagen (ng/ml)
35-
30
25
20
15
10 ,
5 -
0-35 -30 -25 -20 -15 -10 -5 Foaling
Time (days)
T7 T8
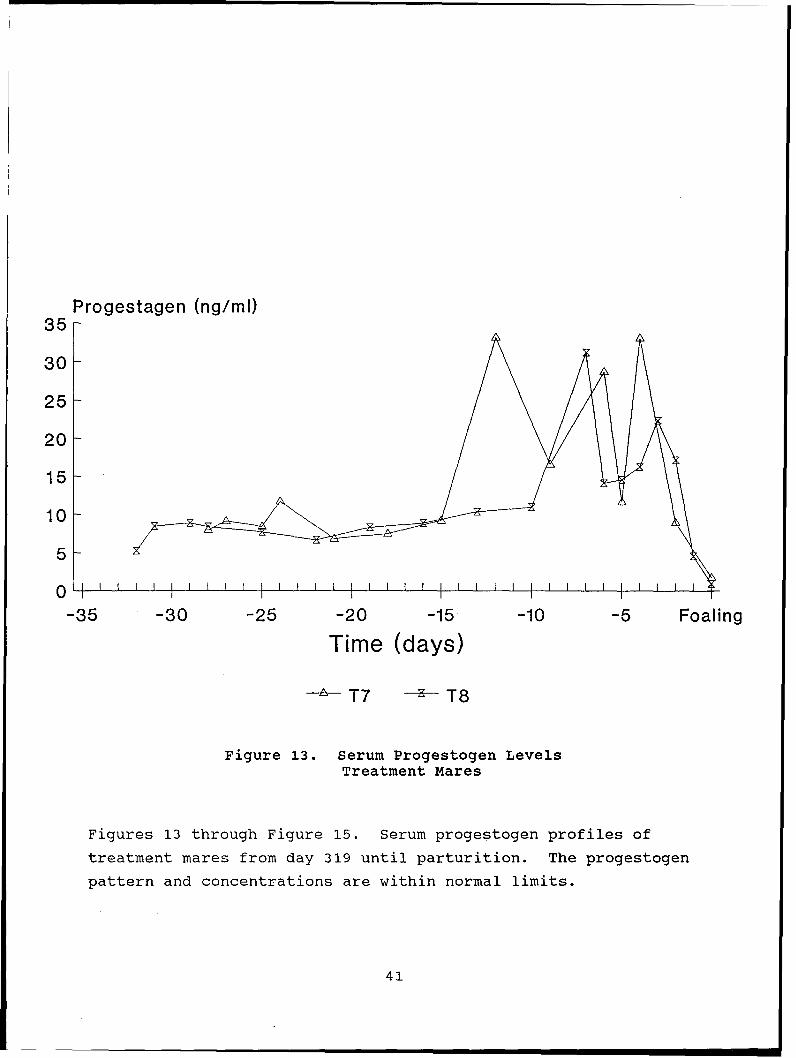
Figure 13. Serum Progestogen LevelsTreatment Mares
Figures 13 through Figure 15. Serum progestogen profiles of
treatment mares from day 319 until parturition. The progestogen
pattern and concentrations are within normal limits.
41
Progestagen (ng/ml)
35-
30
25
20
15 -
10
5
O4llrrlllll rllliilEillillilllliI f
-35 -30 -25 -20 -15 -10 -5 Foaling
Time (days)
ST5 - T6
Figure 14. Serum Progestogen LevelsTreatment Mares
42

Progestagen (ng/ml)
30-
25-
20
15
10
5
0
-35 -30 -25 -20 -15 -10 -5 Foaling
Time (days)
-T1 1 T2
Figure 15. serum Progestogen LevelsTreatment Mares
43
This Page Intentionally Left Blank
44
3. STUDY II: EFFECTS OF SIMULATED AIRCRAFT NOISE ON
COLOSTRUM PRODUCTION AND COLOSTRAL IMMUNOGLOBULIN
ABSORPTION BY FOALS
3.1 SPECIFIC AIM 2
Determine if colostrum production was adversely affected in mares
exposed to simulated aircraft noise two weeks prior to their
expected foaling date. The health and serum antibody absorption
of foals whose mares were subjected to simulated aircraft noise
was also compared to a group of control foals.
3.2 COLOSTRUM PRODUCTION
Upon foaling, mares were milked manually every 30 minutes until
the specific gravity of the mammary secretions was < 1.04. Our
previous work has shown that mares' milk has a specific gravity
of 1.04 and it contains minimal amounts of IgG (< 100 mg of
IgG/dl; LeBlanc et al 1986). The colostrum was stored in an
equine colostrum bank in labelled 250 ml containers at -200C.
The IgG content, and specific gravity, of each container of
colostrum was measured and the total amounts produced by each
mare were quantitated. Differences between treatment and control
mares were determined by Student-t tests.
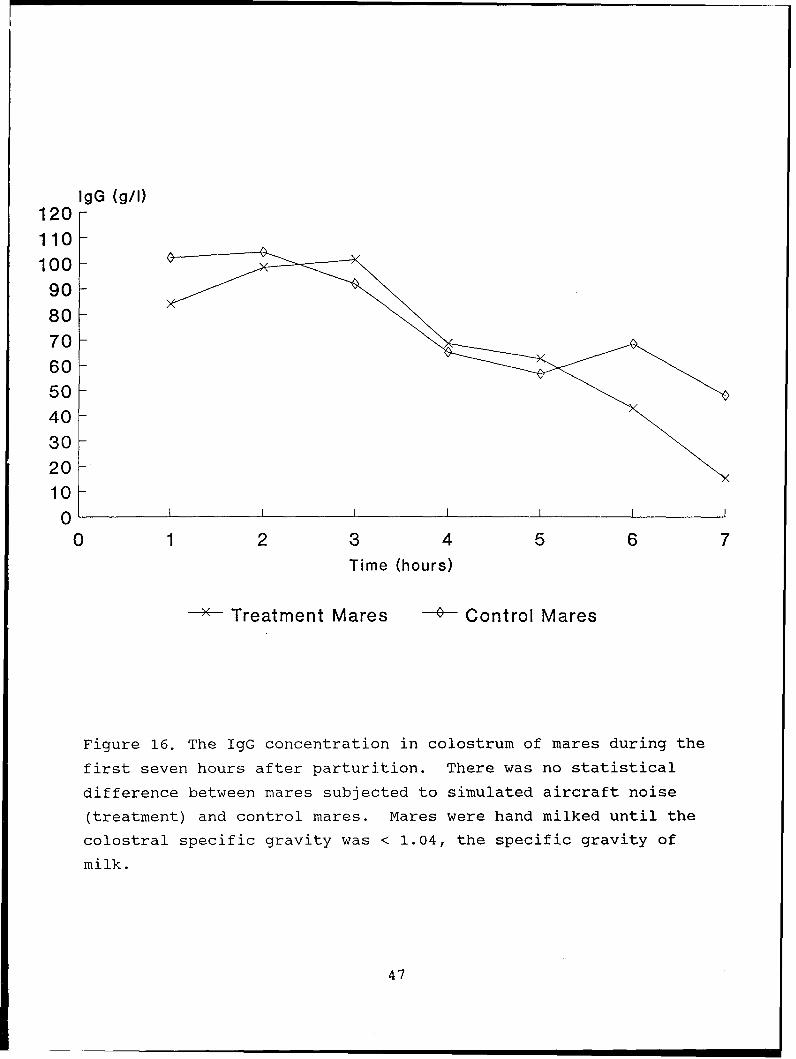
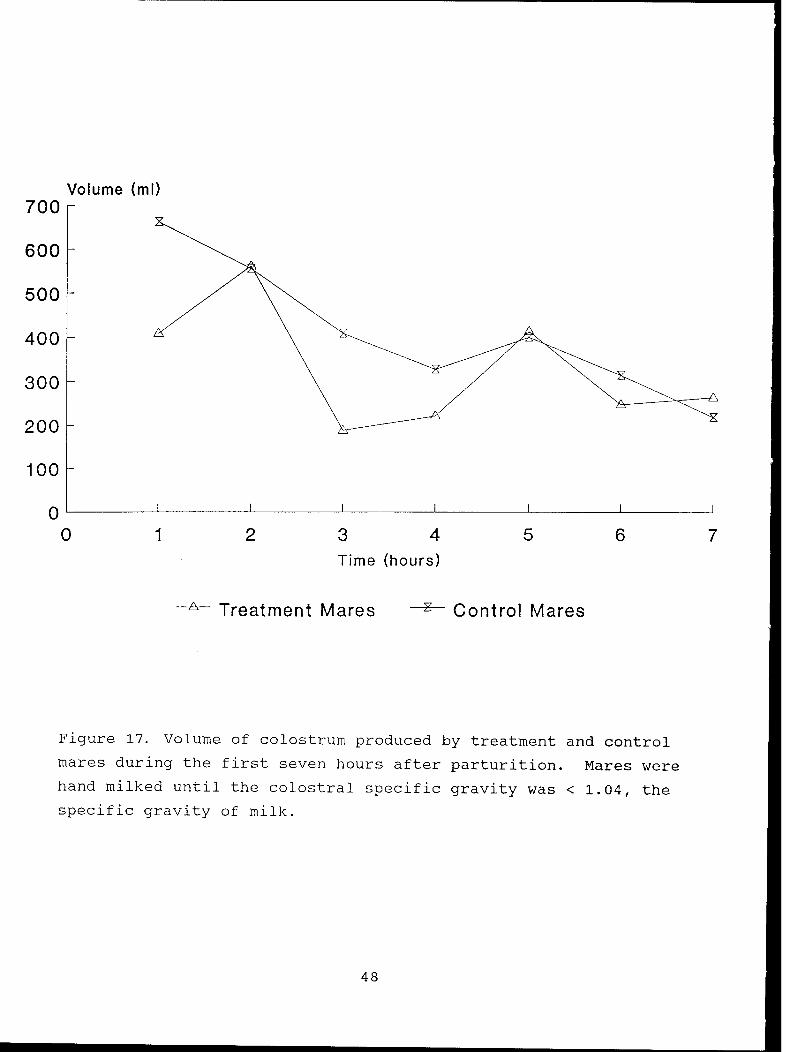
3.2.1 Results and Discussion
The colostrum production of treatment and control mares is
presented in Table 11 and Figure 16 and 17. There was no
statistical difference in the parameters measured between the two
groups. By 12 hours post foaling, no mares had detectable IgG
levels.
45
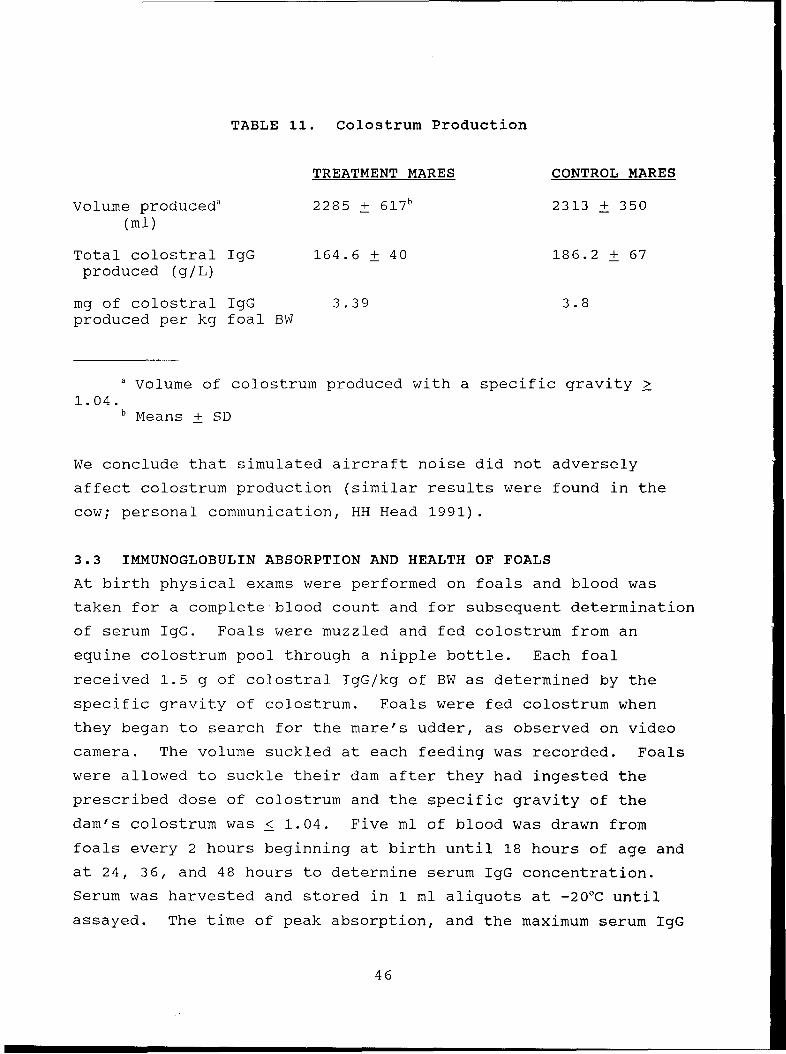
TABLE 11. Colostrum Production
TREATMENT MARES CONTROL MARES
Volume produced' 2285 + 6 1 7 b 2313 + 350(ml)
Total colostral IgG 164.6 + 40 186.2 + 67produced (g/L)
mg of colostral IgG 3.39 3.8produced per kg foal BW
a Volume of colostrum produced with a specific gravity1.04.
b Means + SD
We conclude that simulated aircraft noise did not adversely
affect colostrum production (similar results were found in the
cow; personal communication, HH Head 1991).
3.3 IMMUNOGLOBULIN ABSORPTION AND HEALTH OF FOALS
At birth physical exams were performed on foals and blood was
taken for a complete blood count and for subsequent determination
of serum IgG. Foals were muzzled and fed colostrum from an
equine colostrum pool through a nipple bottle. Each foal
received 1.5 g of colostral IgG/kg of BW as determined by the
specific gravity of colostrum. Foals were fed colostrum when
they began to search for the mare's udder, as observed on video
camera. The volume suckled at each feeding was recorded. Foals
were allowed to suckle their dam after they had ingested the
prescribed dose of colostrum and the specific gravity of the
dam's colostrum was < 1.04. Five ml of blood was drawn from
foals every 2 hours beginning at birth until 18 hours of age and
at 24, 36, and 48 hours to determine serum IgG concentration.
Serum was harvested and stored in 1 ml aliquots at -20'C until
assayed. The time of peak absorption, and the maximum serum IgG
46
IgG (g/l)120-110-100-90-807060-5040-
30-
2010-
0 I I I I I
0 1 2 3 4 5 6 7Time (hours)
STreatment Mares Control Mares
Figure 16. The IgG concentration in colostrum of mares during the
first seven hours after parturition. There was no statistical
difference between mares subjected to simulated aircraft noise
(treatment) and control mares. Mares were hand milked until the
colostral specific gravity was < 1.04, the specific gravity of
milk.
47
Volume (ml)
700-
600
500
400
300
200-
100
0 I I I I I
0 1 2 3 4 5 6 7Time (hours)
Treatment Mares 1 Control Mares
Figure 17. Volume of colostrum produced by treatment and control
mares during the first seven hours after parturition. Mares were
hand milked until the colostral specific gravity was < 1.04, the
specific gravity of milk.
48

Serum IgG mg/dI
2500-
2000
1500
1000
500
0I I I I I
0 4 8 12 16 20 24 28 32 36 40 44 48Age in Hours
Control Mean -- Treatment Mean
Figure 18. Serum IgG concentrations in foals during the first 48
hours of life. Serum IgG concentrations did not differ between
treatment and control foals.
49

concentration was determined. The complete blood counts of
experimental foals was compared to those of control foals. The
health of the foals was monitored for 4 months to determine if
experimental foals were more prone to infectious diseases.
3.3.1 Results and Discussion
No foal had detectable serum IgG levels prior to nursing. Seven
of eight treatment and nine of nine control foals had serum IgG
levels > 800 mg/dl by 8 hours of age (Figure 18). The maximum
serum IgG concentrations attained by foals did not differ
(2316.13 + 571 mg/dl for treatment foals and 2598 + 512 mg/dl,
for control foals). Time to peak absorption for treatment foals
was 13.5 + 2.2 hours and 12 + 2.8 hours for control foals. The
complete blood counts of all foals were within normal limits. No
foal experienced a disease that required antibiotic treatment
during the first 4 months of life. One foal had diarrhea at 7
days of age which was corrected with antidiarrheal medication.
3.3.2 Conclusions
Simulated aircraft noise did not adversely affect the health of
foals, or their ability to absorb colostrum during the first 12
hours of life.
50
REFERENCES
Ames DR (1978). Physiological responses to auditory stimuli, In:
Proceedings of Effects of Noise on Wildlife Eds: JF Fletcher and
RG Busnel, Academic Press NY 1978, pp 25-30.
Barnes RJ, Nathaniels ZPW, Rossdale PD, Comline RS and Silver M
(1975). Plasma progestogens and oestrogens in fetus and mother
in late pregnancy. J Reprod Fert (Suppl) 23, 617-623.
Cottereau PH (1978). Effect of sonic boom from aircraft on
wildlife and animal husbandry. Proceedings of Effects of Noise
on Wildlife Eds: JF Fletcher and RG Busnel, Academic Press, NY, p
66-67.
Detweiler DK, Patterson DF (1972). The cardiovascular system.
In: Equine Medicine and Surgery 2nd.Ed. Catcott EJ, Smithcors JF
Eds. Am Vet Public, Wheaton, Ill, pp 277-348.
Erath (1984). Untersuchungen Ueber die Auswirkungen von Fluglaerm
auf Endokrinologische und Physiologische Parameter bei in
Paddocks Gehaltenen Tragenden Stuten. Thesis. Hannover, W.
Germany. Translated by SICTRAN.
Fraser AF and Broom' DM (1990). Farm Animal Behavior and Welfare,
Third ed., Bailliere-Tindall, Phila. PA.
Ginther OJ (1979). Reproductive Biology of the Mare McNaughton
and Gunn, Inc, Ann Arbor, Michigan, 368-370.
Hoffsis GF, Murdick PW, Tharp VL, and Ault K (1970). Plasma
concentrations of cortisol and corticosterone in the normal
horse. J Am Vet Med Assoc 31:1379-1387.
51
Holtan DW, Nett TM, Estergreen VL (1975). Plasma progestins in
pregnant, postpartum and cycling mares. J Anim Sci 40:251-260.
Kreuger Klaus-Jochen (1982). Einflus von Flugloerm aufdie
Traechtigkeit des Pferdes unter Besonder Beruecksichtigung
Physiologischer und Endokrinologisher. Thesis. Faktoven,
Hannover, W. Germany. Translated by SICTRAN.
Moberg GP (1985). Biological response to stress: key to
assessment of animal well-being? in Animal Stress Ed: Gary P
Moberg, Animal Physiology Society, Bethesda, MD, 29-50.
Ousey JC, Rossdale PD, Cash RSG, and Worthy K (1987). Plasma
concentrations of progestogens, oestrone sulphate and prolactin
in pregnant mares subjected to natural challenge with equid
herpesvirus-l. J Reprod Fert (Suppl)35, 519-528.
Rose RJ, Hodgson DR, Sampson D and Chan W (1983). Changes in
plasma biochemistry in horses competing in a 160 km endurance
ride. Austral Vet J 60:101-105.
Santschi EM, LeBlanc MM, Weston PG (1991). Progestogen, estrone
sulfate and cortisol concentrations in pregnant mares during
medical and surgical disease. J Repro Fert Suppl IN PRESS.
Schafer M. (1975). The Language of the Horse, transl. by DM
Goodall, Arco Publ Co NY, pp 152-155.
Seren E, Tamanini C, Gaiani R, Bono G (1981). Concentrations of
progesterone, 17 alpha-hydroxyprogesterone and 20 alpha-
dihydroprogesterone in the plasma of mares during pregnancy and
at parturition. J Reprod Fert 63, 443-448.
52
Squires EL, Wentworth BC, Ginther OJ (1974). Progesterone
concentration in blood of mares during the estrous cycle,
pregnancy and after hysterectomy. J Anim Sci 39:759-767.
Taylor PM (1985). Changes in plasma cortisol concentration in
response to anesthesia in the horse. Proc 2nd Intl Vet Anes
(Abst) 165.
van Niekerk CH, Morgenthal JC (1982). Fetal loss and the effect
of stress on plasma progestogen levels in pregnant thoroughbred
mares. J Reprod Fert (Suppl) 32, 453-457.
Waring GH. (1983). Horse Behavior Noges Publications, Park Ridge,
New Jersey, pp 175-177.
5 3 *U.S. Governent Printing Office: 1991 - 648-069140228
This Page Intentionally Left Blank
54