Embed Size (px)
Citation preview
Obesity in Asian Populations
Vasanti Malik, ScDResearch Scientist
Department of NutritionHarvard T.H. Chan School of Public Health
National Academy of Sciences, Washington DC Tuesday October 9, 2018
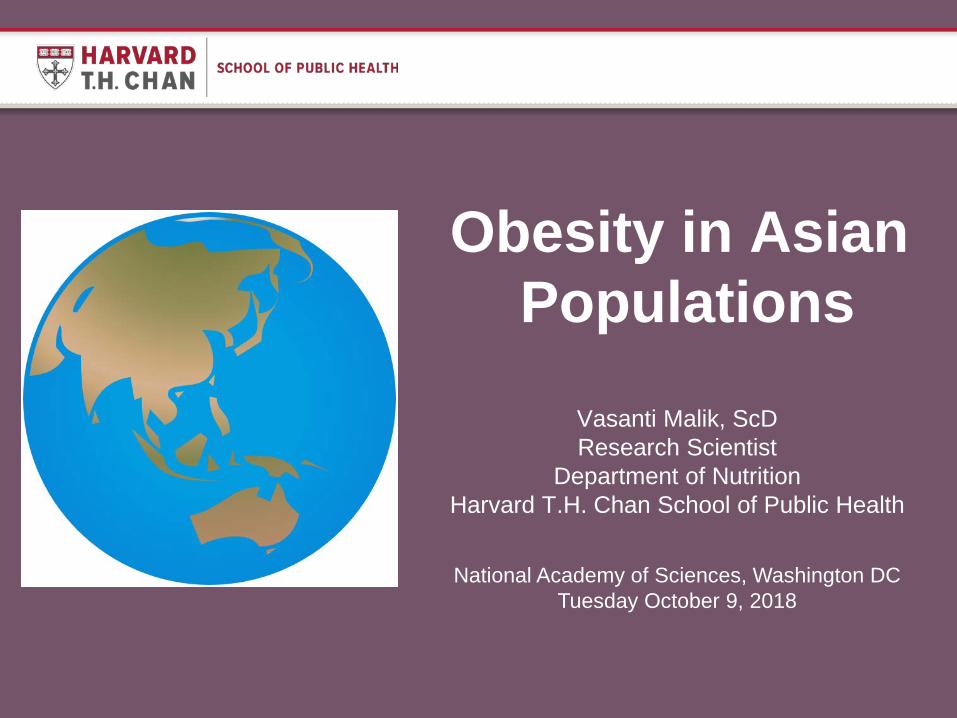
UN Food and Agriculture Organization/WHO
Prevalence of obesity (BMI >30) in adults (18 years+) by region
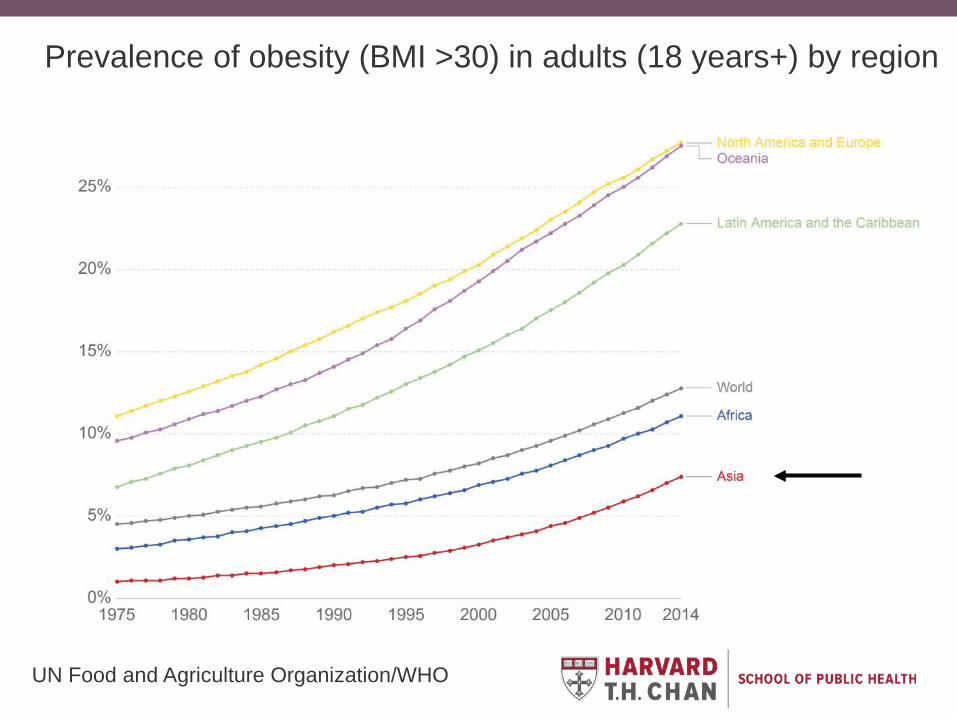
Prevalence of underweight and overweight or obesity by age and sex in urban and rural settings in India, 2004-2006 (n=236,039)
Annals of Epidemiology 25 (2015) 336-34
Vertical axis = prevalence Horizontal axis = age group (years), point estimates
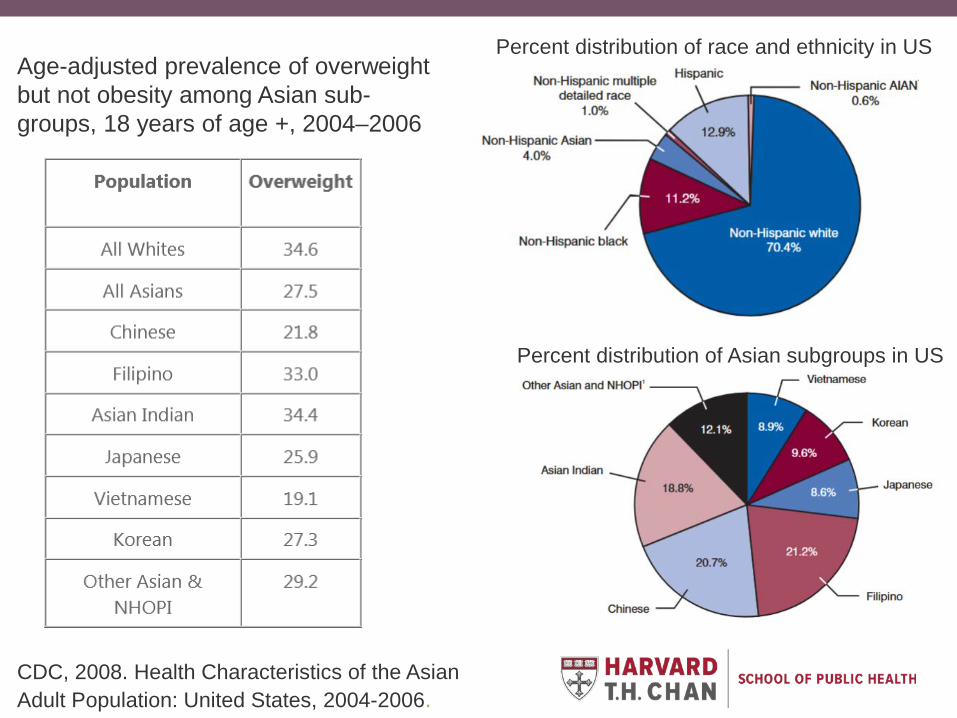
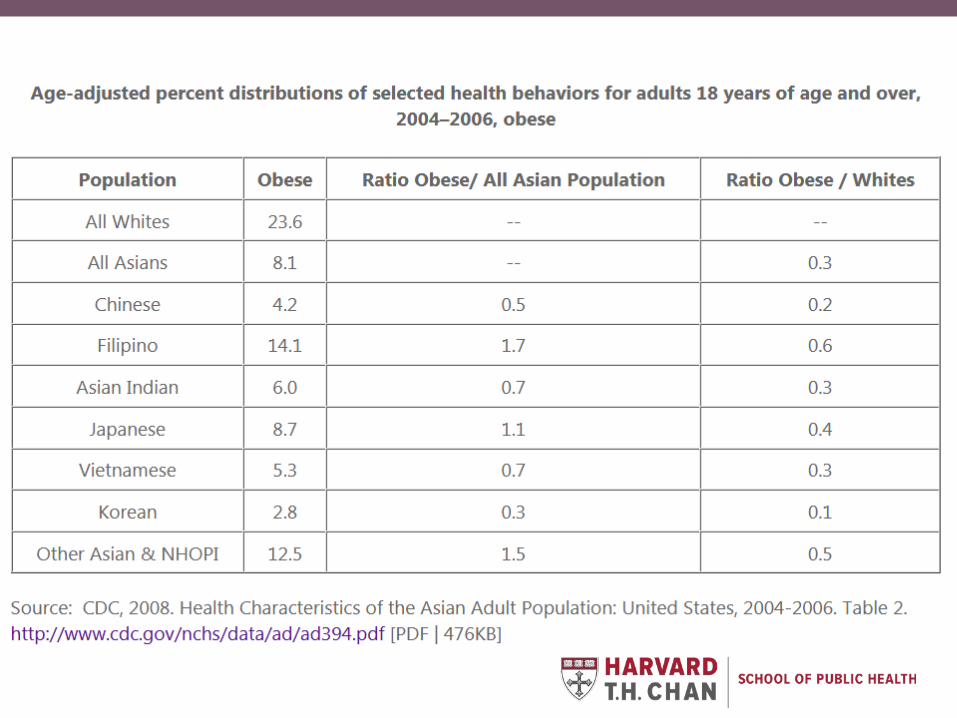
CDC, 2008. Health Characteristics of the Asian Adult Population: United States, 2004-2006.
Age-adjusted prevalence of overweight but not obesity among Asian sub-groups, 18 years of age +, 2004–2006
Percent distribution of Asian subgroups in US
Percent distribution of race and ethnicity in US
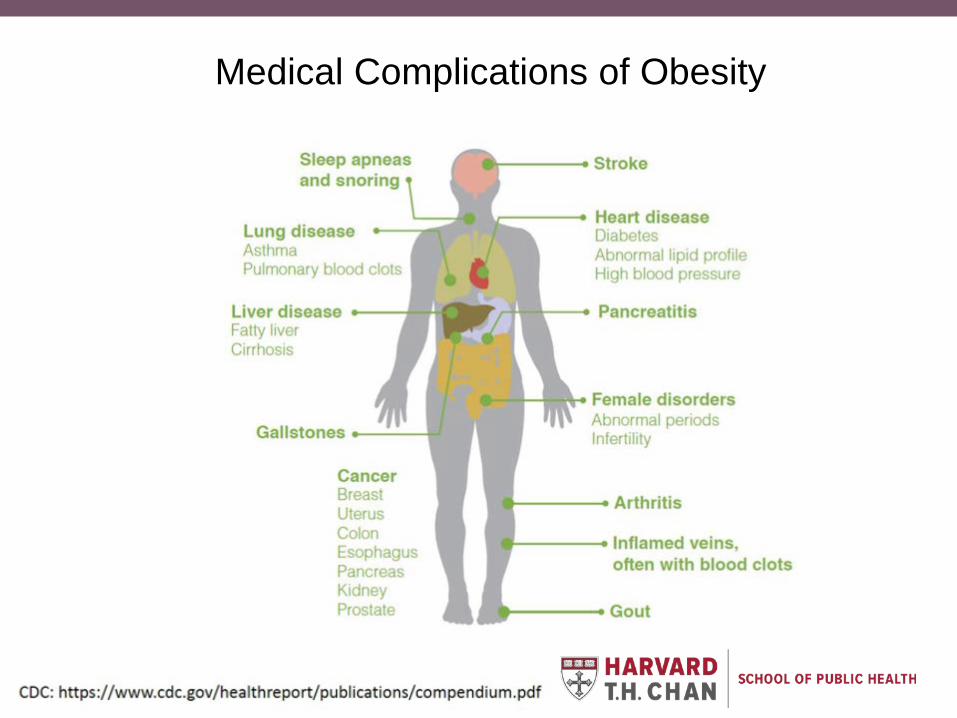
Medical Complications of Obesity

© World Health Organization 2016
Global trends in type 2 diabetes prevalence
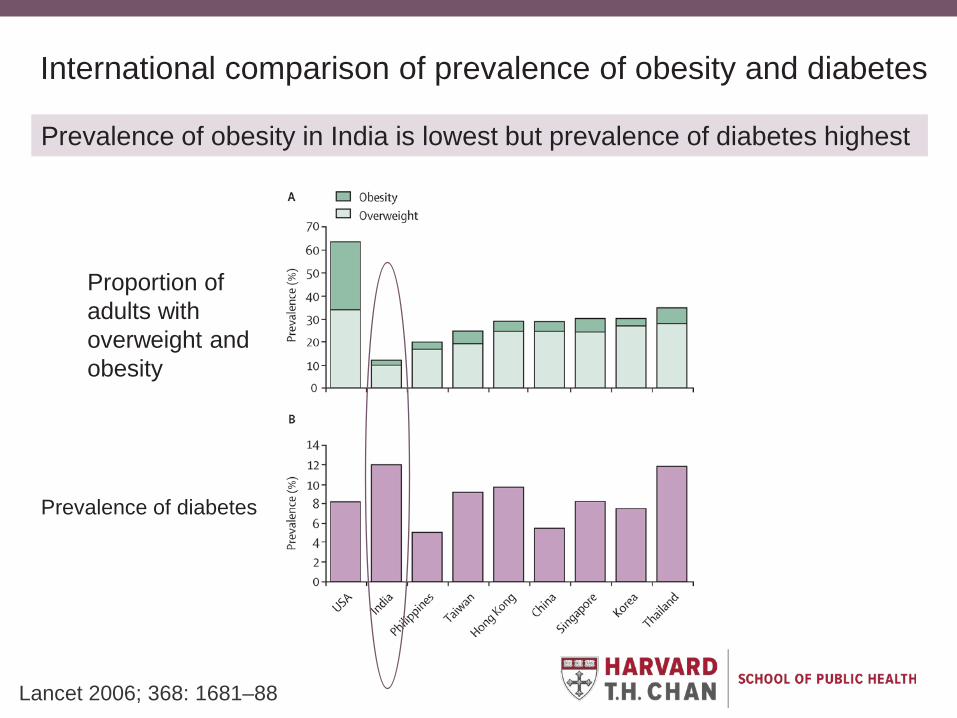
International comparison of prevalence of obesity and diabetes
Prevalence of diabetes
Proportion of adults withoverweight and obesity
Prevalence of obesity in India is lowest but prevalence of diabetes highest
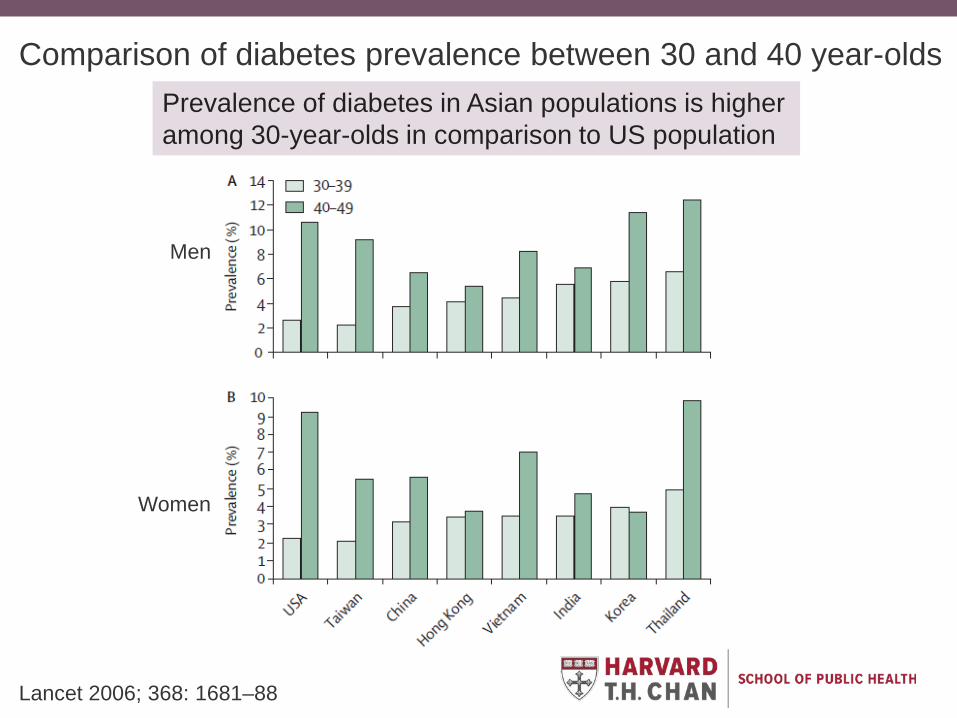
Lancet 2006; 368: 1681–88
Lancet 2006; 368: 1681–88
Comparison of diabetes prevalence between 30 and 40 year-olds
Men
Women
Prevalence of diabetes in Asian populations is higher among 30-year-olds in comparison to US population
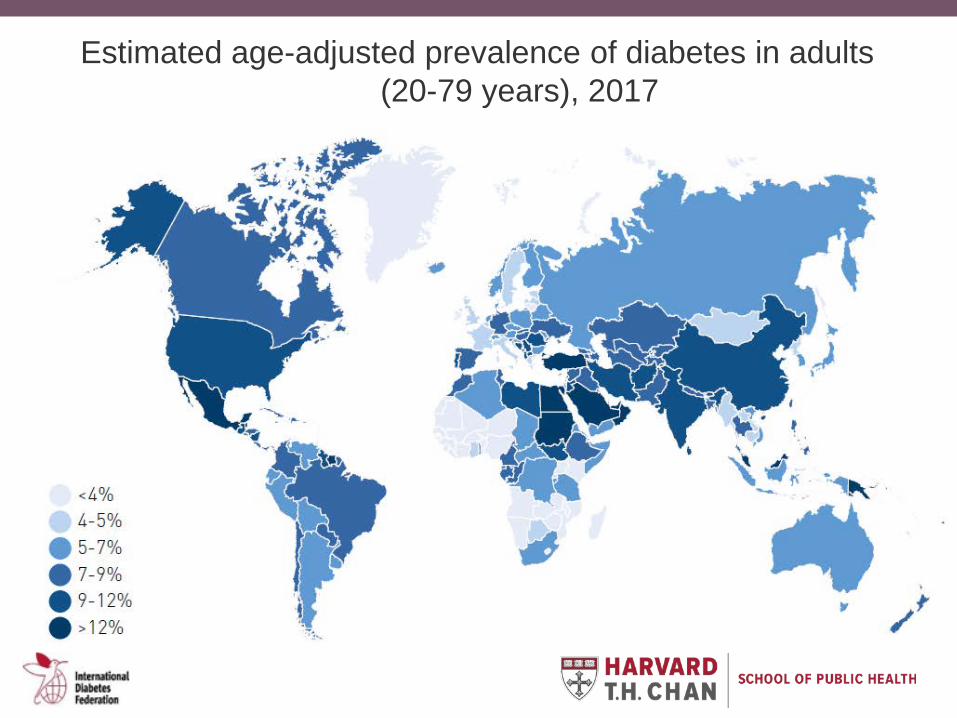
Estimated age-adjusted prevalence of diabetes in adults (20-79 years), 2017
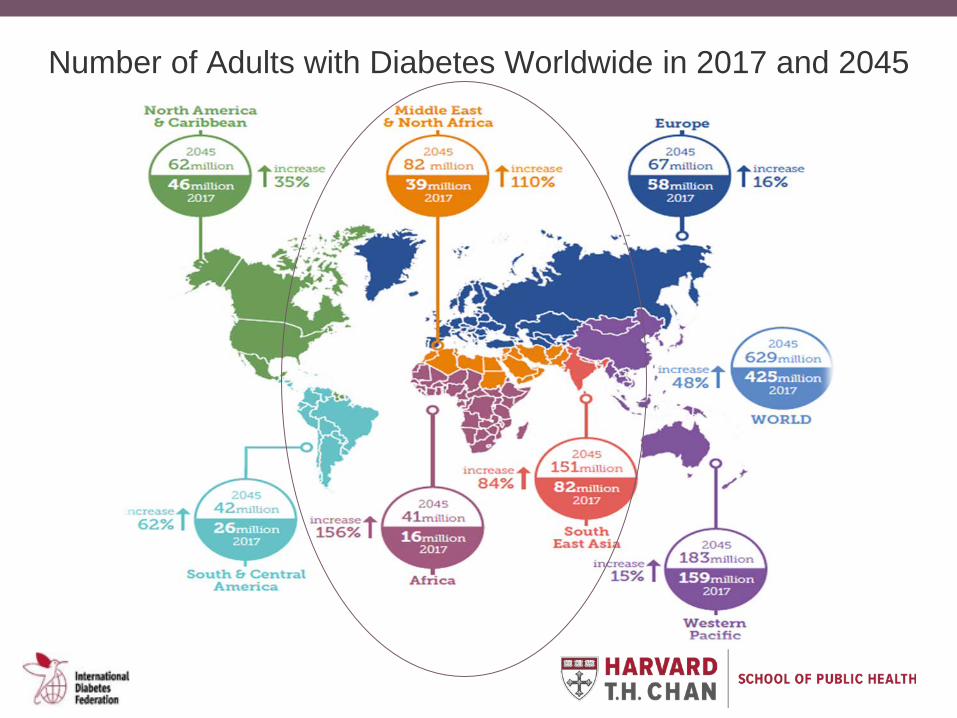
Number of Adults with Diabetes Worldwide in 2017 and 2045
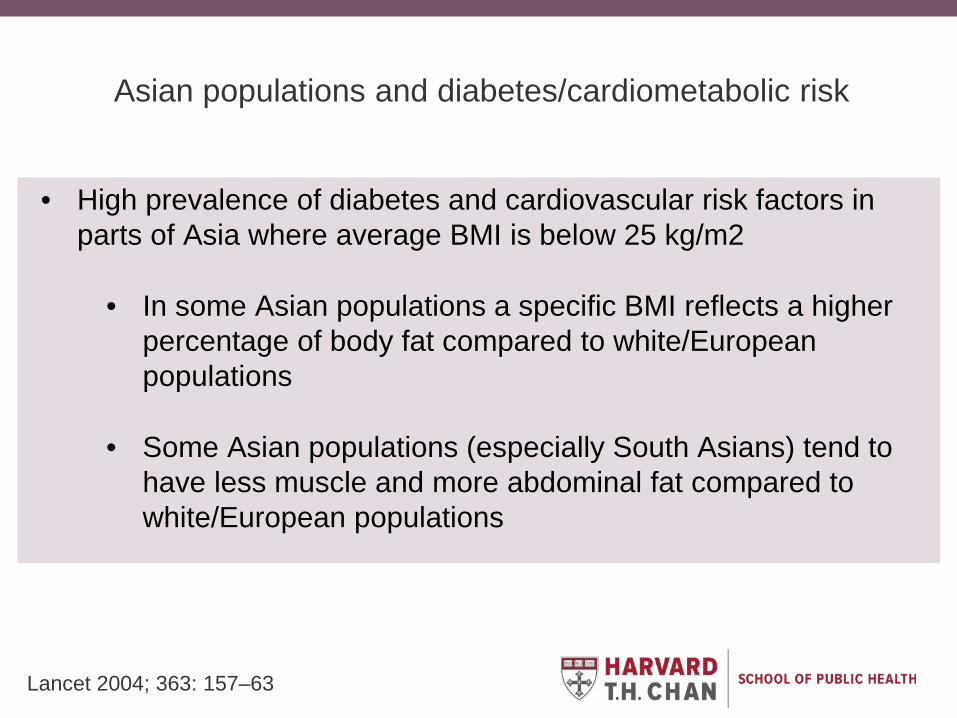
Asian populations and diabetes/cardiometabolic risk
• High prevalence of diabetes and cardiovascular risk factors in parts of Asia where average BMI is below 25 kg/m2
• In some Asian populations a specific BMI reflects a higher percentage of body fat compared to white/European populations
• Some Asian populations (especially South Asians) tend to have less muscle and more abdominal fat compared to white/European populations
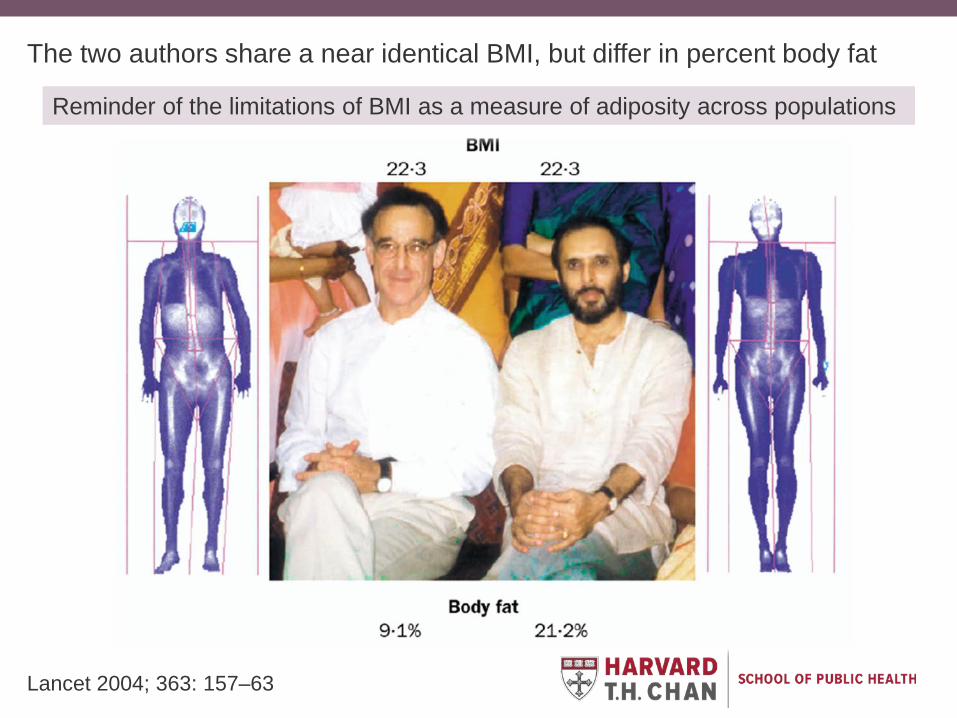
Lancet 2004; 363: 157–63
Lancet 2004; 363: 157–63
The two authors share a near identical BMI, but differ in percent body fat
Reminder of the limitations of BMI as a measure of adiposity across populations
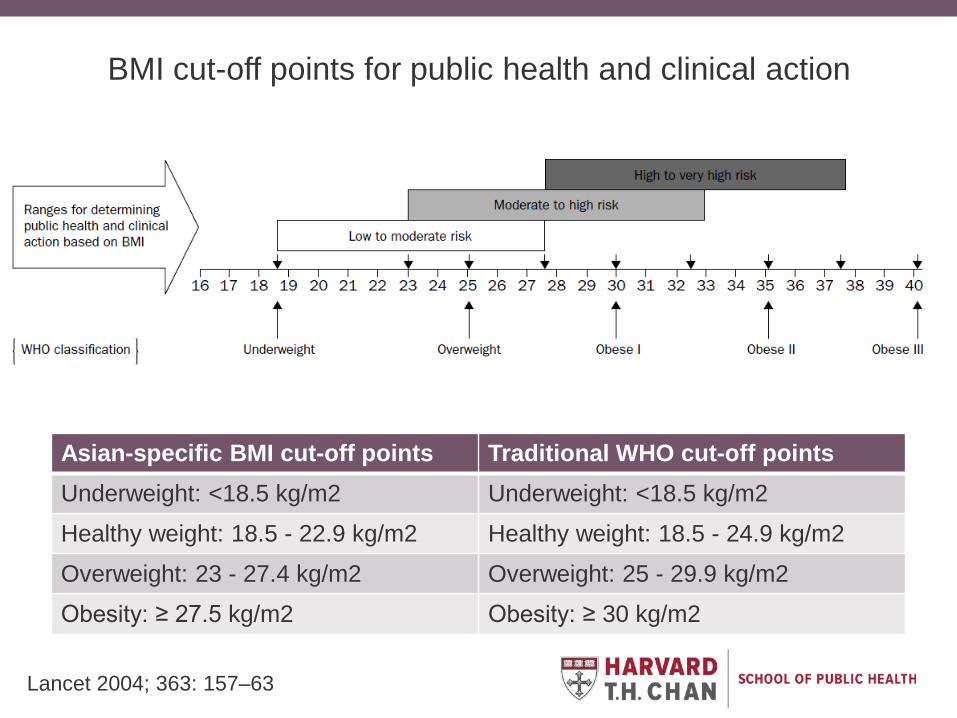
Asian-specific BMI cut-off points Traditional WHO cut-off pointsUnderweight: <18.5 kg/m2 Underweight: <18.5 kg/m2
Healthy weight: 18.5 - 22.9 kg/m2 Healthy weight: 18.5 - 24.9 kg/m2
Overweight: 23 - 27.4 kg/m2 Overweight: 25 - 29.9 kg/m2
Obesity: ≥ 27.5 kg/m2 Obesity: ≥ 30 kg/m2
BMI cut-off points for public health and clinical action
Lancet 2004; 363: 157–63

International Journal of Obesity (2000) 24, 1011-1017
The paradox of low BMI and high body fat percentage among Chinese, Malays and Indians in Singapore (n=291)
Indians had the highest body fat % and Chinese the lowest for the same BMI
For the same amount of body fat as Caucasians with a BMI of 30, the BMI cut-off points for obesity would be ~ 27 for Chinese and Malays and 26 for Indians
Ann Intern Med. 2017 May 2;166(9):628-636.
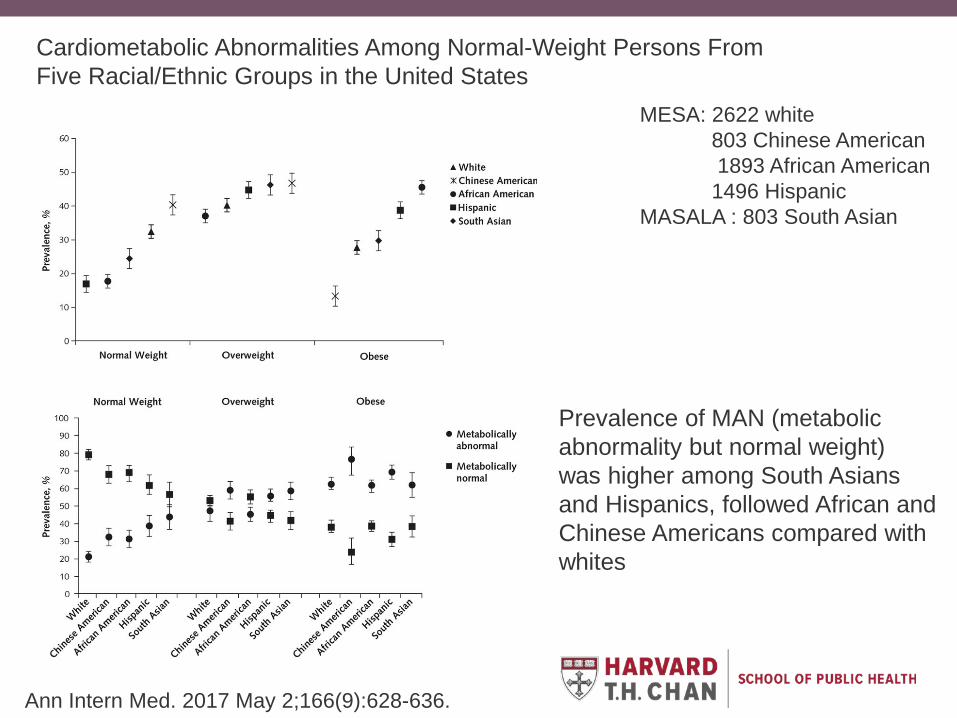
Cardiometabolic Abnormalities Among Normal-Weight Persons FromFive Racial/Ethnic Groups in the United States
MESA: 2622 white 803 Chinese American1893 African American
1496 Hispanic MASALA : 803 South Asian
Prevalence of MAN (metabolicabnormality but normal weight)was higher among South Asians and Hispanics, followed African andChinese Americans compared with whites
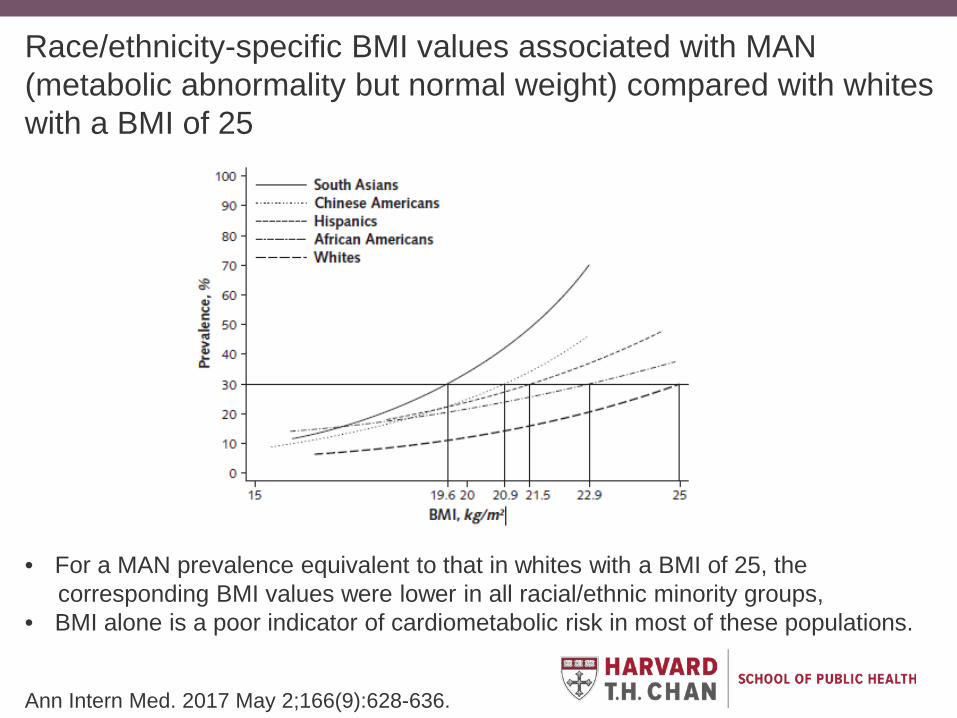
Race/ethnicity-specific BMI values associated with MAN (metabolic abnormality but normal weight) compared with whites with a BMI of 25
Ann Intern Med. 2017 May 2;166(9):628-636.
• For a MAN prevalence equivalent to that in whites with a BMI of 25, the corresponding BMI values were lower in all racial/ethnic minority groups,
• BMI alone is a poor indicator of cardiometabolic risk in most of these populations.

Circulation. 2007;115:2111-2118
For a given BMI, elevated glucose- and lipid- factors were more likely to be present in South Asian, Chinese, and Aboriginal populations compared with Europeans
Obesity Cut Points in a Multiethnic Population (n=1078 Canadians)
The cut point to define obesity, is lower by ~6 kg/m2 among non-European groups compared with Europeans
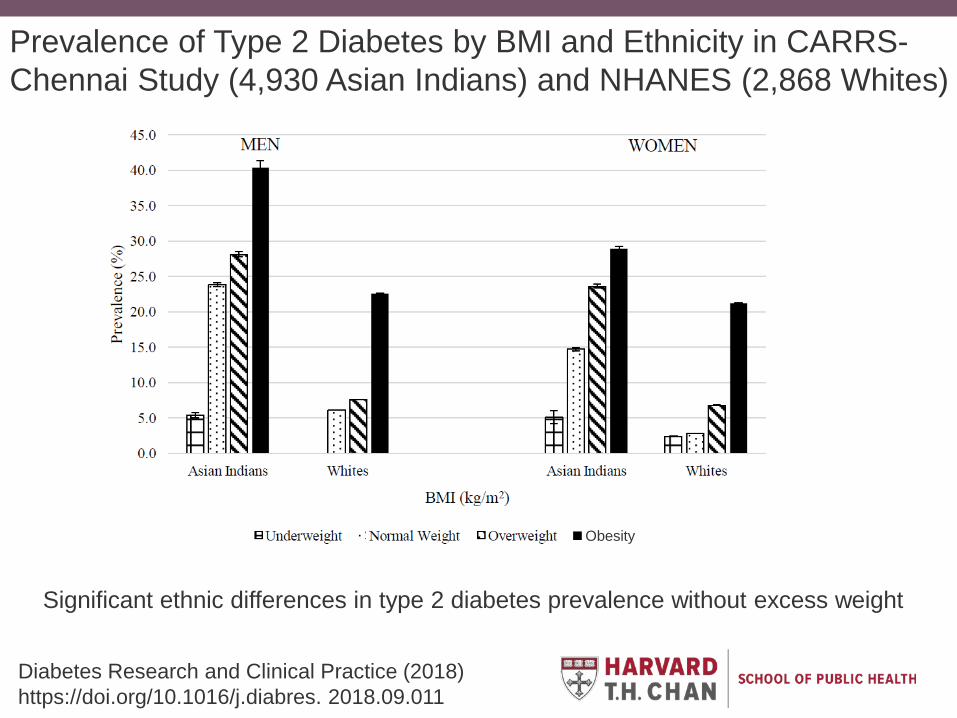
Prevalence of Type 2 Diabetes by BMI and Ethnicity in CARRS-Chennai Study (4,930 Asian Indians) and NHANES (2,868 Whites)
Diabetes Research and Clinical Practice (2018) https://doi.org/10.1016/j.diabres. 2018.09.011
Significant ethnic differences in type 2 diabetes prevalence without excess weight
Obesity
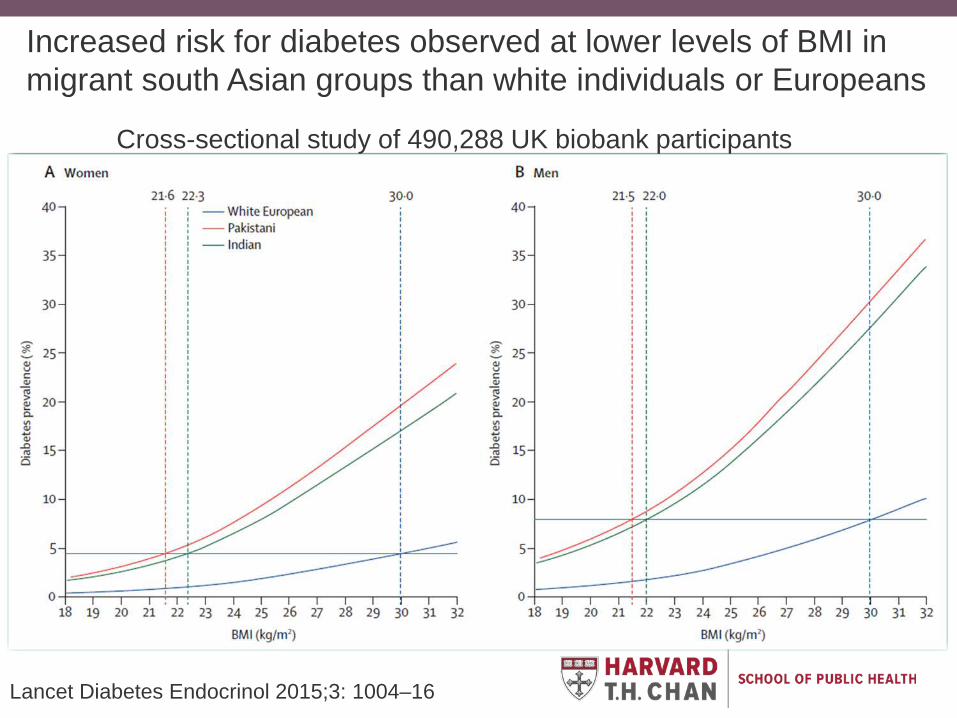
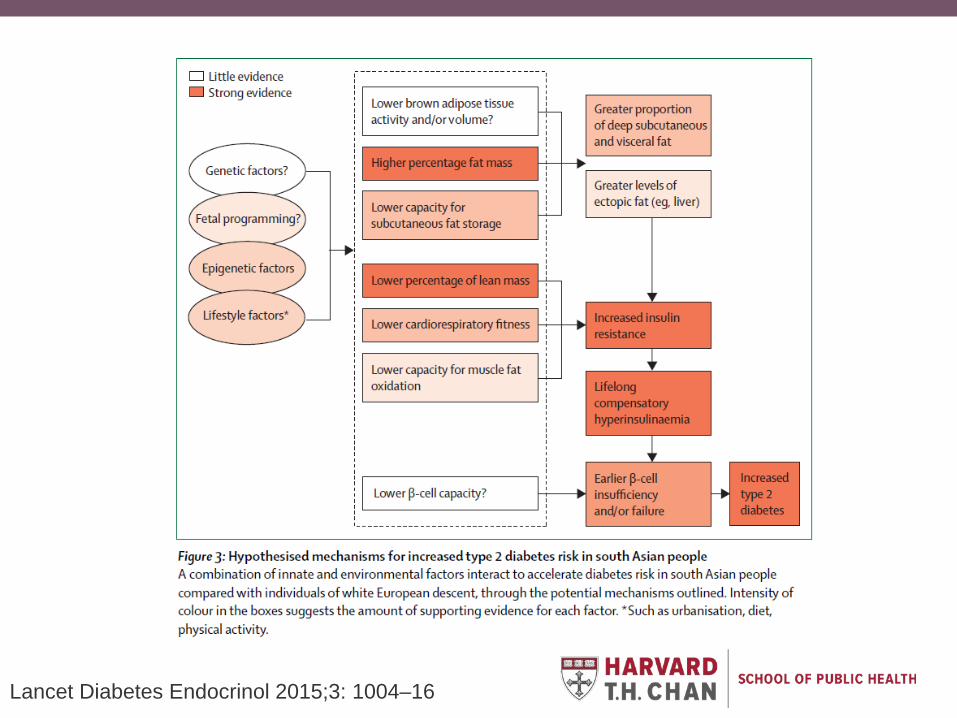
Lancet Diabetes Endocrinol 2015;3: 1004–16
Increased risk for diabetes observed at lower levels of BMI in migrant south Asian groups than white individuals or Europeans
Cross-sectional study of 490,288 UK biobank participants
Lancet Diabetes Endocrinol 2015;3: 1004–16
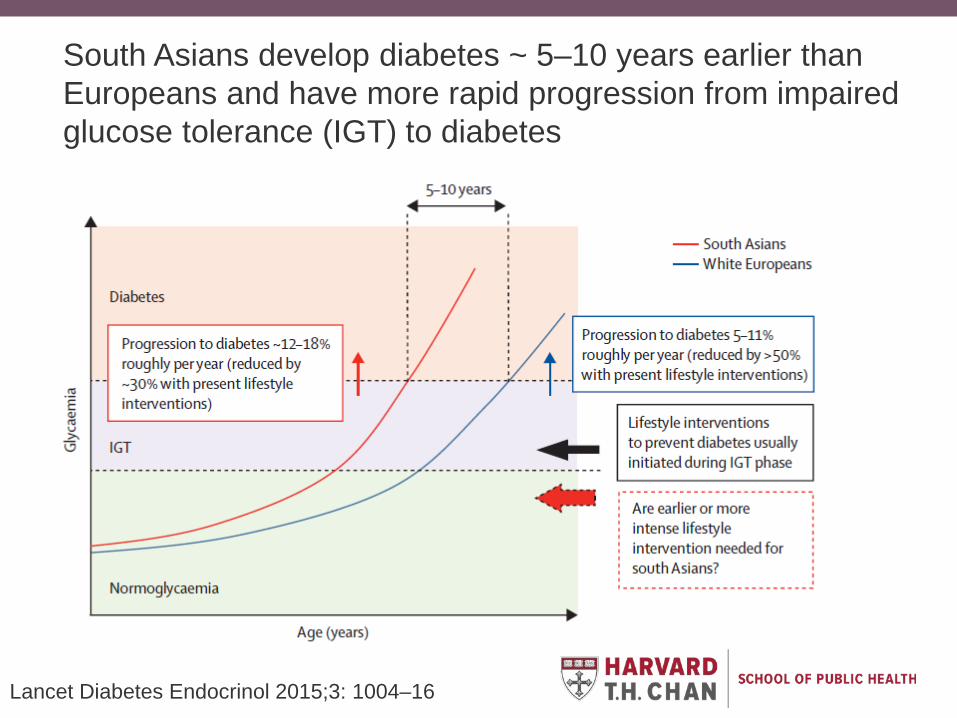
South Asians develop diabetes ~ 5–10 years earlier than Europeans and have more rapid progression from impaired glucose tolerance (IGT) to diabetes

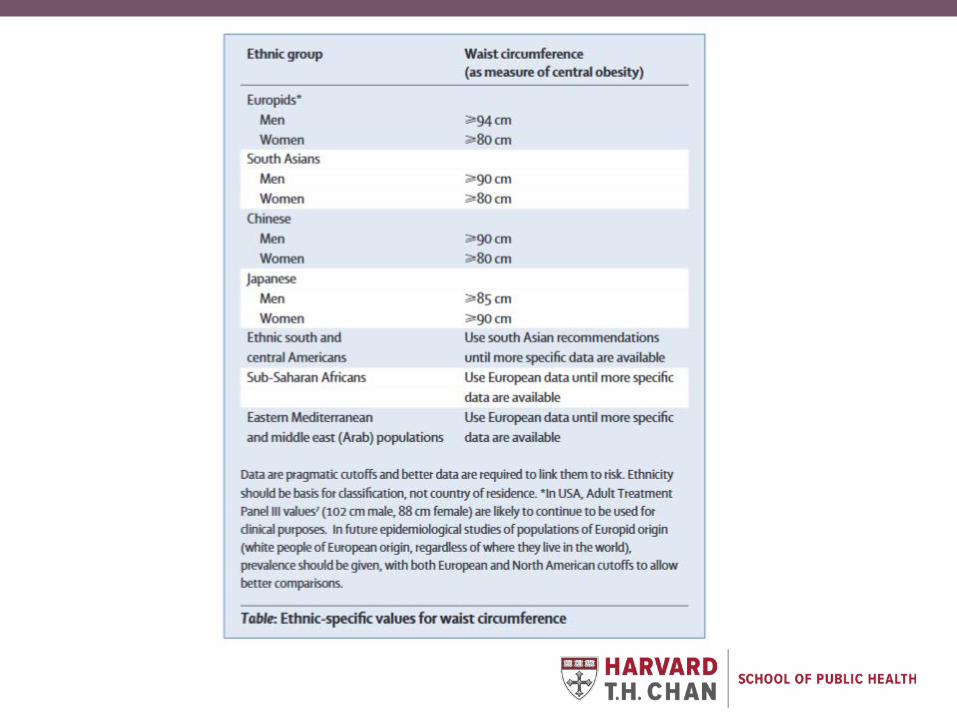
Waist circumference and waist–hip ratio: report of a WHO expert consultation, Geneva, 8–11 December 2008
Ethnic-specific cut-offs for waist circumference
Boys Girls
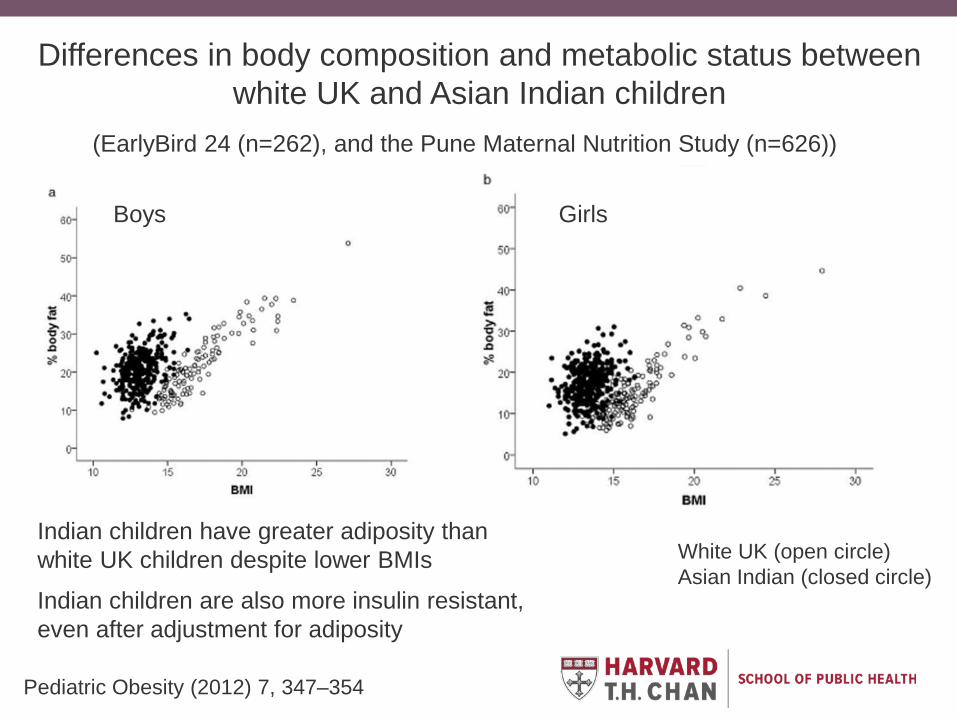
Differences in body composition and metabolic status between white UK and Asian Indian children
(EarlyBird 24 (n=262), and the Pune Maternal Nutrition Study (n=626))
Indian children have greater adiposity than white UK children despite lower BMIs
Indian children are also more insulin resistant, even after adjustment for adiposity
White UK (open circle) Asian Indian (closed circle)
Pediatric Obesity (2012) 7, 347–354

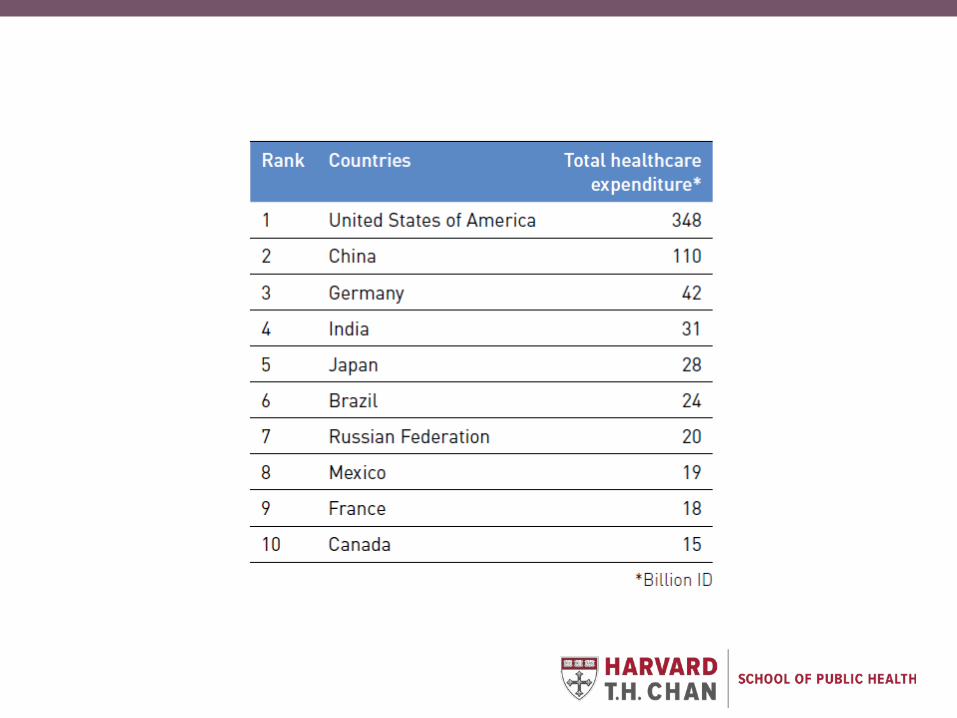
Total healthcare expenditure on diabetes (20-79 years) (ID)
IDF Diabetes Atlas - 8th Edition
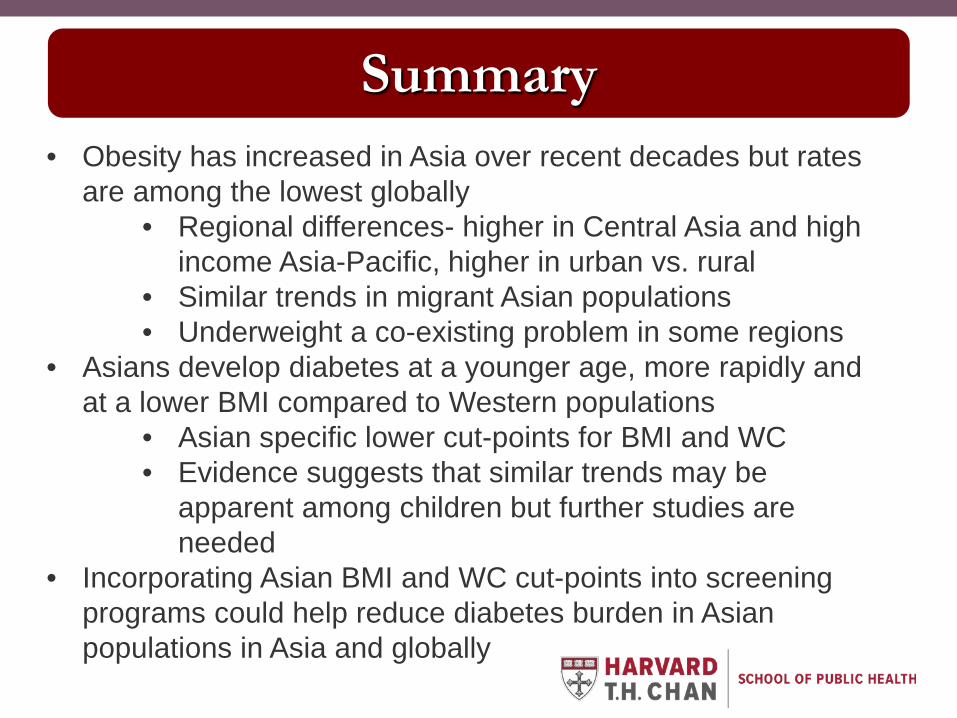
Summary• Obesity has increased in Asia over recent decades but rates
are among the lowest globally• Regional differences- higher in Central Asia and high
income Asia-Pacific, higher in urban vs. rural• Similar trends in migrant Asian populations• Underweight a co-existing problem in some regions
• Asians develop diabetes at a younger age, more rapidly and at a lower BMI compared to Western populations
• Asian specific lower cut-points for BMI and WC• Evidence suggests that similar trends may be
apparent among children but further studies are needed
• Incorporating Asian BMI and WC cut-points into screening programs could help reduce diabetes burden in Asian populations in Asia and globally

EXTRA SLIDES
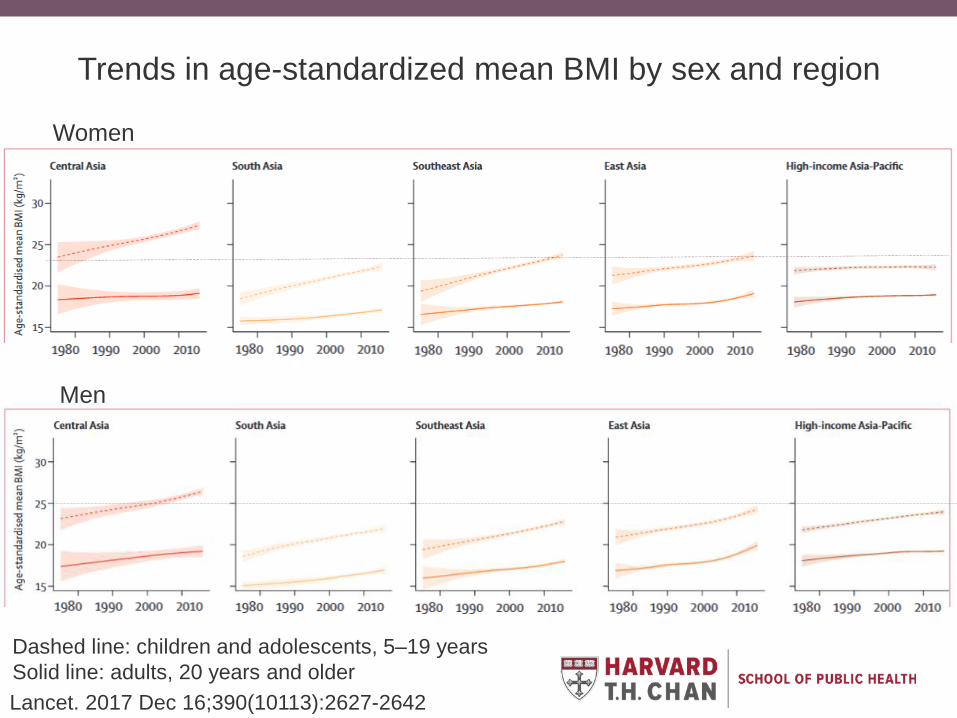
Women
Men
Lancet. 2017 Dec 16;390(10113):2627-2642
Trends in age-standardized mean BMI by sex and region
Dashed line: children and adolescents, 5–19 years Solid line: adults, 20 years and older

Men
Women
Prevalence of obesity (BMI >30) in adults (18 years+) by country
UN Food and Agriculture Organization/WHO
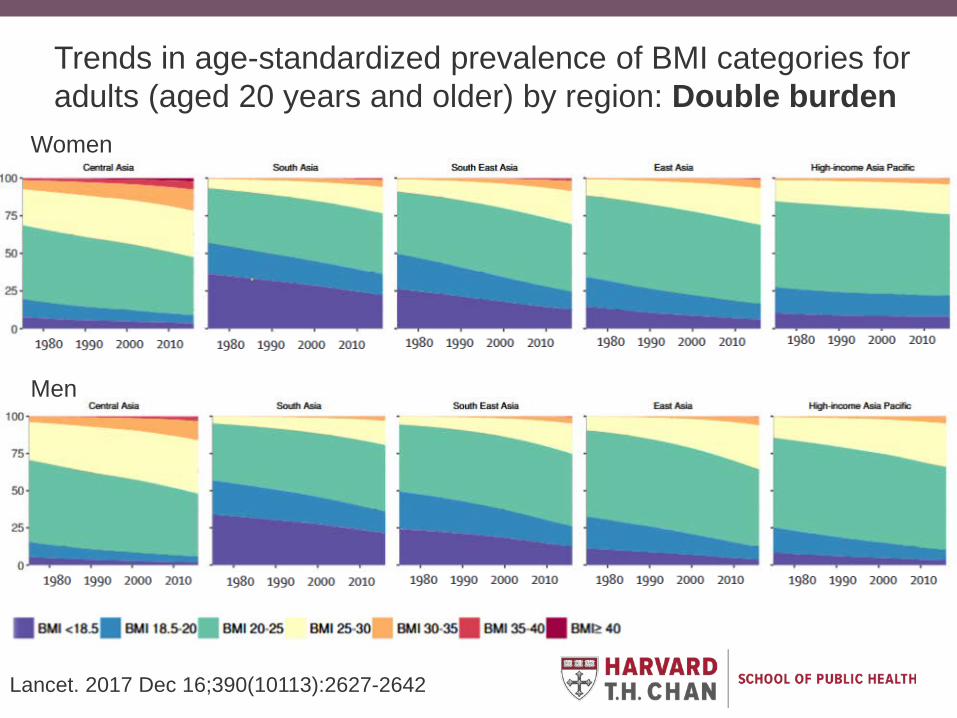
Women
Men
.
Trends in age-standardized prevalence of BMI categories for adults (aged 20 years and older) by region: Double burden
Lancet. 2017 Dec 16;390(10113):2627-2642
Lancet Diabetes Endocrinol 2015;3: 1004–16