Embed Size (px)
Citation preview
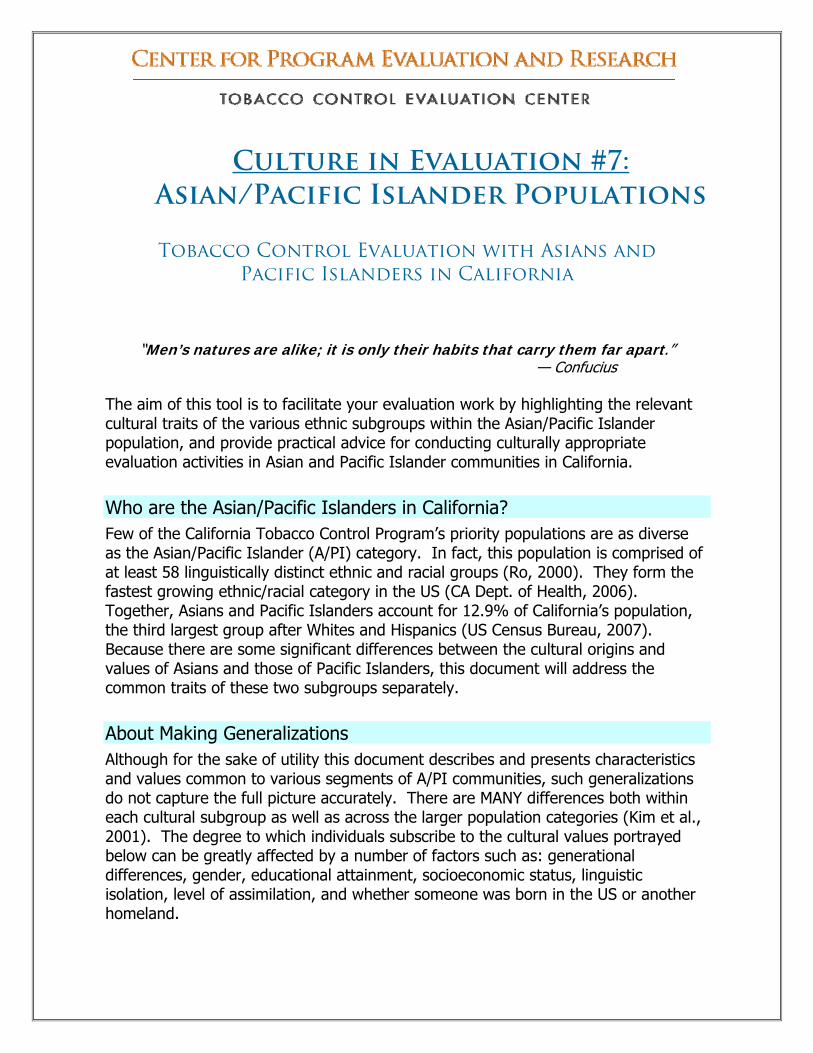
Culture in Evaluation #7:
Asian/Pacific Islander Populations
Tobacco Control Evaluation with Asians and
Pacific Islanders in California
“Men’s natures are alike; it is only their habits that carry them far apart.” — Confucius
The aim of this tool is to facilitate your evaluation work by highlighting the relevant cultural traits of the various ethnic subgroups within the Asian/Pacific Islander population, and provide practical advice for conducting culturally appropriate evaluation activities in Asian and Pacific Islander communities in California. Who are the Asian/Pacific Islanders in California? Few of the California Tobacco Control Program’s priority populations are as diverse as the Asian/Pacific Islander (A/PI) category. In fact, this population is comprised of at least 58 linguistically distinct ethnic and racial groups (Ro, 2000). They form the fastest growing ethnic/racial category in the US (CA Dept. of Health, 2006). Together, Asians and Pacific Islanders account for 12.9% of California’s population, the third largest group after Whites and Hispanics (US Census Bureau, 2007). Because there are some significant differences between the cultural origins and values of Asians and those of Pacific Islanders, this document will address the common traits of these two subgroups separately. About Making Generalizations Although for the sake of utility this document describes and presents characteristics and values common to various segments of A/PI communities, such generalizations do not capture the full picture accurately. There are MANY differences both within each cultural subgroup as well as across the larger population categories (Kim et al., 2001). The degree to which individuals subscribe to the cultural values portrayed below can be greatly affected by a number of factors such as: generational differences, gender, educational attainment, socioeconomic status, linguistic isolation, level of assimilation, and whether someone was born in the US or another homeland.
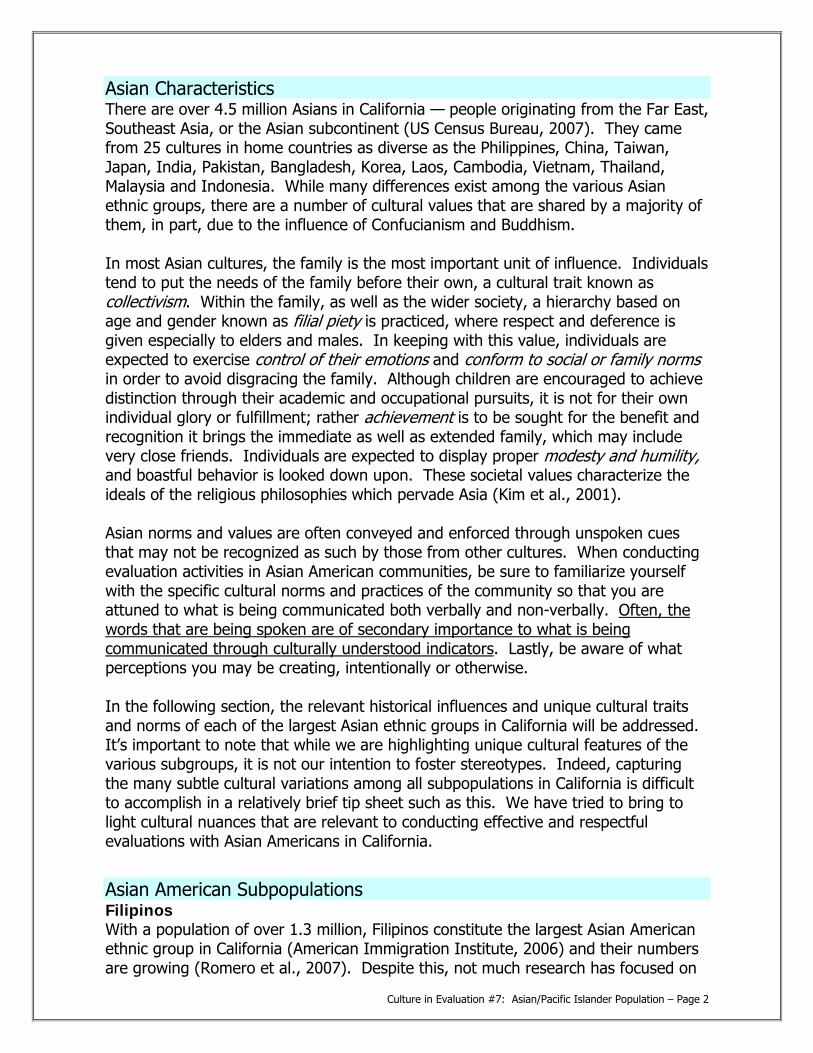
Asian Characteristics There are over 4.5 million Asians in California — people originating from the Far East, Southeast Asia, or the Asian subcontinent (US Census Bureau, 2007). They came from 25 cultures in home countries as diverse as the Philippines, China, Taiwan, Japan, India, Pakistan, Bangladesh, Korea, Laos, Cambodia, Vietnam, Thailand, Malaysia and Indonesia. While many differences exist among the various Asian ethnic groups, there are a number of cultural values that are shared by a majority of them, in part, due to the influence of Confucianism and Buddhism. In most Asian cultures, the family is the most important unit of influence. Individuals tend to put the needs of the family before their own, a cultural trait known as collectivism. Within the family, as well as the wider society, a hierarchy based on age and gender known as filial piety is practiced, where respect and deference is given especially to elders and males. In keeping with this value, individuals are expected to exercise control of their emotions and conform to social or family norms in order to avoid disgracing the family. Although children are encouraged to achieve distinction through their academic and occupational pursuits, it is not for their own individual glory or fulfillment; rather achievement is to be sought for the benefit and recognition it brings the immediate as well as extended family, which may include very close friends. Individuals are expected to display proper modesty and humility, and boastful behavior is looked down upon. These societal values characterize the ideals of the religious philosophies which pervade Asia (Kim et al., 2001). Asian norms and values are often conveyed and enforced through unspoken cues that may not be recognized as such by those from other cultures. When conducting evaluation activities in Asian American communities, be sure to familiarize yourself with the specific cultural norms and practices of the community so that you are attuned to what is being communicated both verbally and non-verbally. Often, the words that are being spoken are of secondary importance to what is being communicated through culturally understood indicators. Lastly, be aware of what perceptions you may be creating, intentionally or otherwise. In the following section, the relevant historical influences and unique cultural traits and norms of each of the largest Asian ethnic groups in California will be addressed. It’s important to note that while we are highlighting unique cultural features of the various subgroups, it is not our intention to foster stereotypes. Indeed, capturing the many subtle cultural variations among all subpopulations in California is difficult to accomplish in a relatively brief tip sheet such as this. We have tried to bring to light cultural nuances that are relevant to conducting effective and respectful evaluations with Asian Americans in California.
Asian American Subpopulations Filipinos
Culture in Evaluation #7: Asian/Pacific Islander Population – Page 2
With a population of over 1.3 million, Filipinos constitute the largest Asian American ethnic group in California (American Immigration Institute, 2006) and their numbers are growing (Romero et al., 2007). Despite this, not much research has focused on
Filipinos, and they are not as well understood as other Asian American subgroups in the US (Kitano, 1980; Agbayani-Siewert, 1994), especially when it comes to smoking (Romero et al., 2008). The diverse ethnicities, languages, and religions that exist in Filipino culture make it especially important to learn as much as possible about the specific Filipino-American community you’ll be working with before conducting your evaluation activities. Filipino Americans come from a country comprised of 7,100 islands where three different indigenous racial types speak 87 different tongues. People typically learn Tagalog, which serves as the national language, as well as their local language or dialect. Many also study English, the “language of status” used in business and government (Gochenour, 1990). Of the Filipinos in California, most speak Tagalog, Illocano, Visayan and English, although 36% say they don’t speak English very well (Dela Cruz, Padilla & Agustin, 2000). In addition to its many indigenous variations, Filipino culture was significantly shaped by the values of the foreign powers which have dominated it. Nearly four centuries of colonization by the Spanish and then the Americans have given Filipinos “a decidedly ‘Western’ orientation” which sets them apart from other Asian traditions (Gochenour, 1990). Catholicism, rather than Buddhism or Confucianism is the predominant religious belief system. Although Islam and native paganism are also practiced in some areas, the Philippines is uniquely the only Christian country in Asia. In addition, the sexes enjoy an equality that is not found in the patriarchy of other Asian cultures (Agbayani-Siewert, 1997). Strong social, economic and political leanings towards the United States stem from the four decades of American colonial occupation which began with the Philippine American War (1899-1913). This was further strengthened by American involvement in the Pacific through the establishment of US military bases. These factors account for the quick assimilation of Filipino immigrants in California and throughout the United States. One thing non-Filipinos may find difficult to fully appreciate is the extent to which maintaining smooth personal relationships governs every facet of Filipino behavior (Agbayani-Siewert, 1994; 1995). This value is upheld in each social interaction through the practice of:
1. Reciprocal obligation (utang ng loob). Relationships are cemented by the giving and receiving of favors or services. For example, small gifts are given as a token of appreciation for someone’s time. Honor requires that if a favor or service has been received, it must also be returned at some point.
2. Shame (hiya). The shame of the individual brings shame on the family. The threat of letting one’s family down helps enforce societal norms. Gossip, rather than open disagreement, may be used as a means to encourage a community member to start behaving properly.
Culture in Evaluation #7: Asian/Pacific Islander Population – Page 3
3. Going along with others (pakikisama). To Filipinos, it is often more important to maintain group harmony than to conclude business that leaves some people with hard feelings (Gochenour, 1990). In organizational settings, this might mean that it will take longer to complete tasks, as the primary emphasis is not on time but on reaching consensus and maintaining relationships. In
order to avoid looking self-important, Filipinos may be reluctant to voice an opinion unless they are asked individually.
4. Protection of self-esteem (amor propio). Filipinos are highly sensitive to criticism and may even feel humiliated (Lynch, quoted in Agbayani-Siewert & Revilla, 1995). Rather than raise an issue directly, Filipinos tend to use a third party to speak on their behalf (Gochenour, 1990). Humor is used as a means of social leveling — to bring down a notch those who are in positions of power or who are seen as too egotistical.
Being aware of these and other aspects of Filipino culture will enable your project to conduct evaluation activities in a way that shows respect and appreciation for the values and practices of Filipino-Americans. Chinese With a population of approximately 1,300,725, Chinese Americans comprise the second largest Asian ethnic group in California (US Census Bureau, 2007). The Chinese have had a presence in the state for generations, with the first waves of immigrants arriving during the Gold Rush era to work the mines and railroads. They suffered periods of severe discrimination, including policies which barred them from entering the US during 1882-1943 (Wong, 1995). The liberalization of US immigration policies in the 1960s and 1970s permitted large numbers of Chinese to immigrate to the US. Coming from communist China, nationalist Taiwan, the transitional economies of Hong Kong and Macau as well as parts of Southeast Asia, Chinese American immigrants and their descendents reflect the diversity of dialects, political systems, and experiences that brought them here. Early Chinese immigrants formed Chinatowns to settle and work in, initially as a defense against the racism they experienced. Because they were mostly excluded from mainstream society, Chinatowns developed their own social systems and governance through the rule of kin-related clans, benevolent associations and the tongs or secret societies. Even today, these organizations can serve either as entry points or “locked gates” to outsiders wanting access to Chinese American communities (Wong, 1995). Chinatowns still play a role in Chinese American settlement patterns. New Chinese immigrants tend to live in or near the Chinatowns of larger urban centers. There, both the husband and wife work in the “enclave economy” ― in restaurants, tourist shops, or the garment industry’s sweatshops. As Chinese Americans assimilate and move into white collar occupations, they typically leave Chinatowns for the suburbs. As they do so, they often adopt more Americanized ways (Wong, 1995). Educational achievement plays a big role in this upward mobility, achievement that far surpasses every other ethnic category in California, including Whites.
Culture in Evaluation #7: Asian/Pacific Islander Population – Page 4
Similar to other Asian cultures, the basic unit of Chinese society is the family, which traditionally included extended kinship under the same roof. Interactions between younger and older generations served to teach the young the significance of “knowing their place” in the household hierarchy and their duty to uphold the honor
of the family name. Additionally, parents expected their children to show unquestioning obedience. Modern Chinese American culture is much more lenient when it comes to strictness. Family size is now smaller, both men and women work and share in the housework and caring for their children, reflecting a greater equality between genders. However, elements of traditional values still play a role in maintaining the family honor. Chinese Americans have fewer divorces and hold more traditional views of women’s roles than the majority of Californians (Wong, 1995). When conducting evaluations with Chinese American communities, it’s important to be aware of certain key behaviors. Chinese society tends to be very hierarchical, honoring respect above all. Therefore, it’s a good idea to approach and earn the respect of the senior staffer or community member first. Before expecting to conduct business, a relationship needs to be established between the parties. You must allow time for this to develop and for your Chinese partners to get to know you. Take care not to inadvertently place a Chinese American community member in a position where he/she may “lose face”. In that case, you need to give them a way out with their dignity intact or the problem could remain intractable. Tobacco control evaluation efforts in the Chinese American community must be seen as long term and must be premised on harmony, cooperation and respect. Indochinese Indochinese Americans, comprised of Vietnamese (587,243), Laotians (69,290), Cambodians (96,491), Hmong (80,391) and ethnic Chinese (included in Chinese figures), differ significantly from the other Asian American subgroups that resettled in California. The Indochinese came to America not as immigrants, but as refugees from the 30-year Vietnam War and its aftermath which destroyed the region (Rumbaut, 1995). They had to flee their homelands under duress, with little expectation they’d ever be able to return. Also, with the exception of the first wave of Vietnamese, the Indochinese who fled were more rural and less educated than other Asians. Despite the common desire to escape the brutality and persecution of their homelands, there are notable differences among the various peoples classified as Indochinese. Two waves of Vietnamese came to America — first the cadre of elites who primarily worked in the US-backed South Vietnamese government, and later a wave of peasant farmers and ethnic Chinese merchants who became known as the “boat people.” The offspring of American soldiers also left Vietnam to flee the discrimination they faced as products of “collaboration” with the enemy. Survivors of the genocide of the “killing fields” of Pol Pot escaped with their lives from Cambodia. The slaughter of over one million during his reign of terror resulted in the higher number of female-headed households (i.e., widows) among Cambodians than in other Indochinese cultures (Rumbaut, 1995).
Culture in Evaluation #7: Asian/Pacific Islander Population – Page 5
The Hmong, rudimentary agriculturalists without a written language until the 1950s, were forced to leave their farms in the highlands of Laos after fighting alongside the US military. They suffered in refugee camps for years before being allowed to
resettle in the US, resulting in a greater number of health problems than other subgroups. Initially the Indochinese were dispersed throughout the United States to be absorbed into mainstream communities, but they soon clustered in ethnic-specific enclaves primarily in California — Cambodians in Long Beach, Laotians in San Diego, the Vietnamese in Orange County, and the Hmong in the San Joaquin Valley near Fresno. Besides the similarities of conditions in their home cultures, their current demographic statistics in the US differentiate the Indochinese from other Asians. Except for the Vietnamese, the Indochinese are the youngest of all of the Asian subgroups, having a median age of less than 20. Poverty rates among Indochinese subgroups are 2-5 times greater than those of other Asians and the US population as a whole (Rumbaut, 1995). Correspondingly, household and personal incomes, home ownership and self-employment rates are also significantly lower. In all likelihood, this can be attributed to the low level of education received in their home countries and the corresponding difficulty in learning English. Many of the refugees came with less than a 5th grade education and according to the 1990 census about half of Indochinese households did not speak English and were “linguistically isolated.” It is a challenge to adapt to a new culture and yet hold onto traditional values and norms. The Vietnamese, who practice Confucianism and Buddhism, are a “strongly collectivist” culture where the family structure is primarily patriarchal (Phinney, Ong & Madden, 2000). Parents promote obedience and industriousness in their children, who are expected to defer to parental guidance over their own desires, and remain in their parents’ home until they marry. For Laotians, Theravada Buddhism guides every aspect of their lives (Bankston, 2006). They commonly live close to extended family which provides a social and financial support. Of all of the Indochinese, the Cambodians suffered the worst atrocities in their homeland. As a result, many with any memory of those events suffer from demoralization and even post-traumatic stress and have more health problems (Eisenbruch, 2001). The Hmong are unique among the Indochinese in that they had no written language until the 1950’s. As a result, many older immigrants are illiterate and received little formal education. Some also still practice polygyny, having more than one wife, even in the US, although it is not common (Keown-Bomar, Dunnigan & Beirle, 2001). Social control is maintained within kinship clans and Hmong community or family associations are established to provide transition services to new refugees and others in the population. In short, Indochinese Americans have a relatively traumatic history of immigration to the US and the cultural values and norms among the ethnic subgroups within this population vary according to the conditions which propelled them out of their homelands.
Culture in Evaluation #7: Asian/Pacific Islander Population – Page 6
Asian Indians Immigrants from India, Pakistan, Bangladesh and Sri Lanka and their descendents comprise the over 515,000 Asian Indian Americans living in California (US Census Bureau, 2007). They come from a region with a wide-ranging diversity of cultures, languages and religions. Those most prevalent in the US are Gujerati, Bengali, Punjabi, Marathis and Tamils, each of whom speak their own language. While most are Hindus, there are also smaller numbers of Muslims, Buddhists, Jains, Zoroastrians and Sikhs. The first Asian Indians to arrive in California were the Sikhs who came during the Gold Rush era to work in logging camps, building railroads or in agriculture (Sheth, 1995). Later, they bought land and settled in the Imperial and Sacramento Valleys. The second wave of Asian Indians poured into the US after restrictive immigration laws were lifted in 1965. From then on, the immigrants from the Indian subcontinent were primarily urban professionals or those seeking a professional education (Weaver, 2005). They preferred to settle in large, urban centers such as San Francisco and Los Angeles with a majority entering into the fields of engineering, medicine, accounting and academia. Others own or work in small businesses such as travel agencies, ethnic groceries, clothing stores, gas stations or taxi services. Asian Indians also own or operate about 50 percent of all of the motels in the US (Pavri, 2006). As a result, they have done well both economically and educationally compared with other Asian American groups as well as Whites (Weaver, 2005). The vast majority speak fluent English, which has aided in their assimilation into American culture. Like other Asian American groups, traditional customs regarding marriage and family are at the base of Indian social life. Although assimilated into mainstream culture, Asian Indians strive to retain their culture and pass these values on to the next generation. Parents still exert strong social pressure on their children’s choices of spouses and careers even though second and third-generation Asian Indian women are more likely to work outside the home. Young people are encouraged to marry within their own ethnic group. As a result, Asian Indian American families stand apart from other Asian American families in that they have the lowest divorce rate and the lowest proportion of female-headed families. The stigma attached to divorce and the relatively high socioeconomic status of Indian Americans are two factors which account for the level of family stability in this group. In addition to the family, ethnic Indian organizations in the US have provided important social and cultural structure and support (Sheth, 1995).
Culture in Evaluation #7: Asian/Pacific Islander Population – Page 7
Forging trusted relationships with leaders of ethnic Indian organizations in the community can provide a valuable connection with influential members of the Indian American population, and open the door to meaningful and useful interactions. Because Asian Indian culture is typically more patriarchal, start by introducing yourself to the senior male in the organization or the family. Proficiency in English among many Asian Indian Americans means that there is less need for translation of English evaluation data collection instruments, but this will depend on the level of education (and perhaps the gender) of your target population.
Koreans Korean Americans make up the fifth largest Asian population in California, numbering about 464,000 (US Census Bureau, 2007). Like other Asian groups, the largest proportion of Korean immigrants made California their home as opposed to other parts of the US. Koreans came to the US as plantation workers at the turn of the century, as war brides and orphans after the Korean War, and as seekers of better economic opportunities from 1965 to the present. In California, they tended to settle in the Los Angeles, Long Beach, Orange County areas, even forming a vibrant Koreatown district of 25 square miles near downtown LA. The majority of those immigrating over the past 40 years have been middle class Koreans who previously held white collar jobs. Without sufficient language skills or accepted professional certification, most were forced to abandon previous occupations and take up low-paying service jobs or turn to self-employment (Min, 1995). Common Korean-owned enterprises are grocery or liquor stores; wig, fashion or import outlets; dry cleaning establishments; gas stations; and manicure salons. The core value of Korean culture is harmony with order, a value encouraged by Confucianism. In addition, strong adherence to family ties, the value of education, working hard, and the ambition to excel are highly respected principles. Traditional Korean values employ a strict patriarchy which emphasizes a respect for elders, the willingness of adult children to care for their parents, women as the primary homemakers, the need for loyalty, humility and reciprocity (Hur & Hur, 1999). American culture, with its emphasis on individualism, creates a challenging polarity between traditional Korean and acculturated values. This is especially true of marital relations as men try to maintain their ascendency over their wives who now are expected to work in the family business and still handle the household chores. Of all of the Asian groups, Koreans maintain the strongest ties to their native cultural practices and ethnicity (Min, 1995). This is related to three factors: the homogeneity of their homeland; a strong attachment to Korean Christian churches held both before immigrating and upon arrival; and the high concentration of Korean-owned small businesses. All of this is associated with slower rates of assimilation into American society.
Japanese
Culture in Evaluation #7: Asian/Pacific Islander Population – Page 8
As of 2007, there were almost 410,000 Japanese Americans in California, 113,000 of which were Issei, first generation Japanese immigrants (US Census Bureau, 2007). While Japanese Americans were heavily represented in farming occupations before WWII until their discriminatory internment into camps, the post-war years brought the vast majority of Japanese Americans to the larger city centers in California, such as Los Angeles and San Francisco. Since the mid-1960’s, the US population of Japanese descent has become increasingly American born. Third generation Japanese Americans, “Sansei”, are highly assimilated in American education, employment, housing, politics, friendships, and marriage, but there remains a
marked adherence to Japanese cultural values across generations (Weaver, 2005; Kim et al., 2001). There is considerable overlap between the cultural beliefs and practices of Japanese Americans and those of other Asian/Pacific Islander groups — for example, an emphasis on group needs over individual needs, and allegiance to family roles and responsibilities. But Japanese Americans often stand out among their Asian/Pacific Islander peers in their preference for formality (correctness) over spontaneity, and a high sensitivity to public regard, the latter associated with careful expression of private feelings in appropriate situations (Nishi, 1995). The Japanese American family — like other American families — provides a set of values for the regulation of daily social behavior. However, among Japanese Americans the marked emphasis on duty “gives the Japanese family a type of solidarity hardly to be conceived in the Western mind” (Nishi, 1995). Given the preference for more formal social interactions that Japanese Americans may have, it’s especially important to go through the proper channels when recruiting participants for an evaluation study, and to give plenty of advance notice for any evaluation activities requiring their time or input. Keep in mind that, due to the traditional Japanese preference for privacy with regard to expression of feelings, questions requiring someone to share closely-held thoughts, attitudes, or feelings may put respondents in an awkward position. Japanese Americans tend to value positive mutual social interactions and may not be comfortable expressing their true feelings about an issue if doing so might jeopardize the positive nature of the personal interaction. Assuring evaluation participants that there are no “wrong” answers and that responses will be kept confidential are helpful in encouraging frank responses.
Pacific Islanders Native Hawaiian and Other Pacific Islanders (NHOPIS) make up a small proportion of the total population in California, amounting to about 198,013 or 0.5% (US Census Bureau, 2007). They come from the 21 different cultures scattered across the 25,000 islands and atolls of Polynesia, Micronesia and Melanesia in the Pacific Island region. The groups with the largest populations in California are the Samoans (31,749), Native Hawaiians (24,375), Guamanians/Chamorros (23,380), Fijians (18,659) and Tongans (16,006). While these island peoples share a number of common cultural characteristics, they each have their own languages and traditions.
Culture in Evaluation #7: Asian/Pacific Islander Population – Page 9
The history of Pacific Island people differs quite a bit from Asian cultures, perhaps in part because they were more geographically isolated with smaller populations. Despite the changes that came as a result of contact with Western sailors, merchants and missionaries, Islanders managed to maintain a more tribal aspect to their societies — with governance carried out at multiple levels through the leadership of chiefs and where decisions were made by consensus. Many of the islands were colonized by the Europeans or the Americans; some, however, managed to retain their sovereignty.
The Samoan archipelago is divided into two political regions – in the east, the islands forming the US territory of American Samoa; in the west, the islands of the independent nation of Western Samoa. Native-born American Samoans have American citizenship and many Samoans (even in the west) speak English in addition to their local dialect. Samoan culture can be difficult to fathom with its complex social structure of chiefs and the use of elaborate oratory (Cox, 2006). Each extended family is governed by a chief who guards the family pride through the use of taboos. It is considered taboo to display physical affection in public, to offend young women or swear in their presence, or for clothing to reveal more of the leg than the calf. Rightly or wrongly, Samoans have a reputation for more violent behavior and brushes with the law than other Pacific Island peoples. Guam, the largest of the Mariana Islands, is the homeland of the Chamorros. An American Territory since 1898, Guam was colonized by the Spanish for several hundred years. Chamorro culture endured in part because the colonizers did not realize the culture was matrilineal (Villaverde, 2006). Despite occupation, the indigenous language is still spoken, along with English and Japanese. Guam played an important role in the battle of the Pacific during World War II. The foundation of Chamorro community is reciprocity and interdependence “rather than individualism” (Cunningham, 1992, cited by Villaverde, 2006). Chamorros have a complex social protocol which includes kissing the hands of elders to show respect. Like most other Pacific Island cultures, the approximately 320 islands of Fiji are governed by a system of tribal chiefs. In their society, social ceremonies and protocols are very important (Laverack & Brown, 2003). Even events such as meetings or workshops have a ceremonial component which should not be ignored. Drinking kava is a part of that and honored guests are expected to partake along with the rest of the attendees. Status is clearly delineated, and is reflected by where people sit. Those of lower status are seated further away from the center of the action, unless they are performing a ceremonial role. Hawaii, which includes 132 islands in its archipelago, became a US state in 1959 after its native monarchy was overthrown by the US government. Regaining some form of sovereignty is still a sensitive issue to native Hawaiians. Although the old ways are tempered by the stresses of modern life, certain elements of traditional culture are still practiced. While no longer raised primarily by grandparents, today children are considered the responsibility of the extended family. Older women are given great respect by the younger folk. Superstitions about evil spirits or bad luck are still guarded against with ti leaves or other practices (Winters & Swartz, 2006). And despite its popularity with tourists, hula is actually a form of worship and certain chants and dances are never revealed to “haoles” or white non-natives.
Culture in Evaluation #7: Asian/Pacific Islander Population – Page 10
The 36 inhabited islands of the Kingdom of Tonga are ruled by a constitutional monarchy. Society is split into three social classes: the king, the 33 families of the nobility, and the commoners. The population is bilingual, speaking the official languages of Tongan and English. Christianity was introduced to the island in 1826 and has played an important role in Tongan society ever since. The shortage of land
and the assistance of Mormon missionaries have prompted Tongans to immigrate to the US, primarily on the west coast where they are engaged mostly in service occupations. They have a low rate of college attendance (Cooper, 2006). Some cultural traits and values are shared across almost all of the Pacific Island peoples. Families are large, extended and frequently quite fluid. Those living in California often live in severely overcrowded conditions because of their family structure (Booth, 2007). Children may be raised by family members other than their parents. Family ties tend to be strong and require certain obligations to support others within the circle in a redistributive or reciprocal fashion. Social structure is often complex, defining and maintaining the status of members through social norms or taboos and ceremonial protocols. In many of the Pacific Island cultures women hold a lower status than men, and elders are given the highest respect. Because of health issues within PI ethnic groups, older adults die earlier, leaving a younger population overall than the California average (Villaverde, 2006). Religion plays an important role in communities. Church activities are part of the social fabric and ministers are highly esteemed. The central principle common to all Pacific Island cultures is hospitality, which is evidenced by hosting large communal meals, drinking kava and celebrations of storytelling, song and dance. In these interactions and everyday conversations, much of what is communicated (and expected as acceptable behavior in return) is conveyed through non-verbal cues which the outsider would be wise to learn about before interacting with Pacific Islanders. Only in this way can you hope to approach your evaluation activities in these communities with adequate cultural sensitivity. What role does tobacco play? Tobacco use prevalence rates vary across the different Asian or Pacific Islander cultural groups. However, in general, use rates by males within the category are higher than the California norm and the use rate by A/PI women is much lower (with a few exceptions). This is true of rates for ethnic groups in both their home countries and their communities in California. The Asian subgroups with the highest smoking rates among men were Koreans [35.9%], Vietnamese [31.6%] and Filipinos [24.4%] (Tang, Shimizu & Chen, 2005). Among women, the subgroups with the highest smoking prevalence shifts somewhat; Japanese women have the highest rate [12.7%], followed by Filipino women [10.5%] and Korean women [9.0%]. From these results, the effects of acculturation may be seen. The more acculturated men are in the US, the lower their smoking rate. However, for women the trend is reversed (Tong et al., 2008).
Culture in Evaluation #7: Asian/Pacific Islander Population – Page 11
Tobacco use data for Pacific Islanders is harder to come by, perhaps because their small populations in California preclude them from being a primary research focus. However, studies done elsewhere show Native Hawaiians, both male and female, as having significantly high smoking rates (42% of men and 34% of women in Hawaii) and American Samoan men having a 50% smoking rate and women a 14% rate (Lew & Tanjasiri, 2003).
Tobacco companies target Asian/Pacific Islander populations with culture-specific media messages which try to associate smoking with sophistication and becoming more “Americanized”. Advertisements portraying young female models with cigarettes blanket small local grocery stores and are aimed to reach women. The tobacco industry further extends its presence by sponsoring family-oriented and community events where it can recruit the next generation of smokers by exposing them to images of tobacco branding, promotional items and free samples. To compound the problem, A/PI communities usually lack cessation services and materials in appropriate languages. Outside of the pressures exerted from marketing campaigns, tobacco often plays a cultural role in many Asian or Pacific Islander communities. Cigarettes, bidis, chew or other forms of tobacco have become the expected form of signaling respect in gift-giving or when making offerings to ancestors or chiefs. Other beliefs attribute healing or healthful attributes to tobacco (South Asian Network Staff interview, 2008). A great amount of cultural sensitivity must be used to acknowledge the role of tobacco yet attempt to find alternatives for it in such traditions.
How can you connect with Asian/Pacific Islander populations?
Getting to Know the Community (Ideas from the American Cancer Society’s Guidebook for Divisions & Units)
Before you can design your evaluation activities, you’ll need to get an idea of who the players and the subgroups are within a community. Start with demographic information specific to the community. Get a current map of the area to note the location of subgroups within the population, service providers, important gathering places, etc. Contact the United Way and the CA/Nevada Community Action Partnership to find out which organizations operating in the community serve your target population. Look for ethnic associations or other likeminded organizations. Conduct key informant interviews with directors of those agencies and ask them who the leaders are in the community. Often, the true leaders are not in positions of power but are people who serve as information sources, role models and problem solvers in the community. Map out all locations that could be access points to your population. Note community organizations by location, ethnic makeup and size. Ask for recommendations of reliable informants who can act as your cultural guides to the community ― providing entrée to people’s trust, advising on the cultural appropriateness of your evaluation approach and data collection, and translating cultural cues.
Culture in Evaluation #7: Asian/Pacific Islander Population – Page 12
Minimize the fears the community may have about you as an outsider by building a relationship with them as a trustworthy, caring person/organization. As you attend community events and become known to people, they will be more likely to trust you
and participate in your tobacco control intervention and evaluation activities. So be prepared to be a resource, not just a data collector. People living in ethnic communities have many unmet needs. If you can help them access resources or services, it will be a fair trade of information. Make it a point to always carry through with any promises you make. As an outsider, you already need to prove yourself as someone worth trusting.
How can you involve A/PI populations in your evaluation activities?
Planning Your Evaluation As you set out to plan the who, what, where and when of your evaluation activities, remember that spending the extra time in the beginning stages to gain the acceptance and input from key community members can save you a lot of time in the end. Especially with Asian populations, it may take repeated meetings to establish rapport and gain trust. Do what is known as “social investigation” about the norms and taboos of that ethnic group even before you set up key informant interviews. Social investigation is the process of systematically learning and analyzing the various structures and forces of a community so that you gain a deeper understanding about the area, become familiar with the physical landscape, learn who to talk to, and meet community leaders and representatives of institutions and organizations who can help you enter a new community successfully (People’s CORE staff interview, 2008). In this way you can avoid many cultural pitfalls.
Involve key community informants in all levels of the planning and collection processes. They’ll be able to tell you what approaches will/won’t work. In this way you can ensure your tools and process are more culturally acceptable.
Ask about the language/dialects, cultural norms/taboos and literacy levels of the community. Find out what would be offensive or intimidating to that population.
When asking advice of leaders or community sources, do a lot of listening. In fact, at first do more listening than asking. Be open to what they’re saying. Don’t appear to be already informed about everything.
Ask people who give you a contact if you can mention them as the source of the information. Maintaining their confidentiality shows your respect for them.
Even though you’ve asked key informants what they believe their community thinks, feels or does, be sure to validate those assessments with members of the target population themselves.
Figure out which data collection methods will work best to gather the type of information you need. Will people be more comfortable responding individually or in a group? Find out if there are cultural norms against expressing negative or strong opinions.
Culture in Evaluation #7: Asian/Pacific Islander Population – Page 13
Frame tobacco control issues in terms of protecting children and the family. Even though some parents smoke, they are concerned about the risks of secondhand smoke and don’t necessarily want their children to smoke.
Learn about the cultural role that tobacco sometimes plays; acknowledge that such ties can be difficult to change; encourage cultural leaders to find meaningful alternatives that can be used.
Make sure to report the results of evaluation activities back to communities who participated through a variety of methods such as community debriefing meetings, public service announcements in local media, articles in area- or ethnic-specific newspapers or other formats of getting the word out.
Creating/Adapting Data Collection Instruments Because every cultural community has its own norms, social cues and lingo, a one-size-fits-all approach to designing data collection instruments can often hamper your attempts to collect unbiased data. Therefore, it is always a good idea to do a little research about what will most likely make sense to your target community.
First investigate which subgroups might exist in your sample. Decide if it would be useful to be able to separate out data by subgroups. If so, include demographic questions in your data collection instruments to identify the various populations.
Simply translating materials into another language is not enough. The appearance, format, examples as well as the wording need to be made culturally appropriate and relevant for each specific community. Be sure to involve cultural insiders or cultural interpreters in this development process.
Take the literacy levels, education and language of respondents into consideration when designing the format and type of data collection. Hmong populations especially can have low literacy, although many other ethnic subgroups may include a number of people with low education levels or low English proficiency.
Always pre-test data collection instruments with members of the target community (who are not already in your planned sample). Ask if the wording of the questions will be understood in the community; how they interpret the meaning of each question; whether there are more culturally relevant examples that could be used; if there are any other questions you should be asking; if there are other response choices that should be added to multiple choice questions; and how the format or method will work in this community. Make sure that all subgroups who will be in your sample understand things in the same way.
Put the most important information either first or last — these points will be remembered best. Cluster information by topic and use subheadings to clarify the format.
Use graphics to elucidate the text, not to decorate. Place captioned images or graphics next to the text it illustrates. Photos with word bubbles work well. Choose images familiar to the culture.
Childlike visuals or all capital letters are a turn-off to adults (Portis, 2003). Use cues like arrows, checks, or circles to highlight important information.
Make sure the wording, images and directions are clear and have only one meaning by pre-testing your data collection tools with your target population.
Culture in Evaluation #7: Asian/Pacific Islander Population – Page 14
Some people are not comfortable reading or answering a survey either in
English or their home language because they are functionally illiterate. To address this, have culturally competent interviewers ask questions rather than handing out written questionnaires.
Finding Asian/Pacific Islander Populations Go to where the population lives, works, congregates and obtains services, such as:
ethnic networks and associations schools (k-12 and adult) churches, temples and mosques legal aid programs MUH complexes/subsidized housing employment programs English as a Second Language classes hospitals/clinics community centers/events ethnic grocery stores cultural gatherings sports associations
Promoting Participation in Your Evaluation Activities Although finding ways to persuade individuals to take part in your evaluation work is an issue with all populations, there are a number of factors which you should be aware of when working with Asian/Pacific American communities.
Don’t expect the community to come to you. These populations generally prefer face-to-face interactions rather than more impersonal methods like using the phone or email. Don’t expect initial contact to result in your desired outcome right away. Most likely it will take multiple visits until people begin to feel they know you and can open up to you.
Because time is often a relative concept in some A/PI cultures, give people a range of time when they can meet you. Always add an extra 10 minutes or so for conversations to allow for making small talk before getting to the point.
Choose gathering places that are familiar and comfortable to the population. Ask whether people would prefer to gather in a local church, temple or other well-known spot rather than in an institutional setting like a school or office.
Select times that are convenient for your population. Take their work, child care or family duties into consideration. Few people will stay more than 1.5 hours.
Provide transportation and allow children to accompany their parent/s (and/or provide childcare); you’ll get more people to participate.
Make participants feel valued. Convey your respect to people with your speech and actions. Include ceremonial elements to meetings and events — in the opening make a big welcome and explain why their participation is necessary; at the closing express deep thanks and allow the opportunity for participants to make comments. It may even be important to include some kind of a culturally appropriate prayer (perhaps led by someone well-respected in the area.)
Culture in Evaluation #7: Asian/Pacific Islander Population – Page 15
Provide incentives for participation — a gift card from a local business, a T-shirt, cash, or something useful to your population. To minimize expenses, give a raffle ticket to each participant for the potential to win a prize.
Serve refreshments — food has a powerful cultural value and symbolism that cuts across all ethnic groups. It symbolizes hospitality and conveys to participants that you value their time. It can also function as an “icebreaker” during activities or meetings.
Collecting Data Because of the many subgroups within the Asian/Pacific Islander population, it will be nearly impossible to know what behaviors exhibited by your data collection team could prevent you from obtaining unbiased data and high response rates unless you’ve done your homework first with key informants from the community. Every culture will have its own norms that you need to be attuned to if you want cooperation.
Be aware of the intimidation factor. Find out what NOT to do in terms of what you wear, the way you talk, how to approach someone, as well as which data collection method is best suited, whether male or female data collectors will be given better access to participants, etc. For example, dressing too formally (like a suit and tie) can intimidate community members by conveying that you are an authority or power figure. This creates a sense of separation which may prevent people from speaking openly and candidly to you. Instead, dress casually but presentably in clothes that will allow you to blend in.
Wear a badge that identifies you with your organization (which by this time should be known in the community from your many initial visits). People aren’t likely to open their doors to you unless they know you or your organization.
Be humble when entering a new community. Let your attitude demonstrate that you are there because you want to learn from them.
Engage people without alienating them. Address people by their names and titles (e.g., Mr. Choi, Aunty Esmerelda, Dr. Sanjay). Speak in respectful (i.e., quiet) tones and never interrupt someone. Avoid being brash.
Because most everything in many A/PI communities is relationship-based, it is important to start every conversation with small talk. Don’t finish others’ sentences or try to cut the conversation short to get to the point; that is considered “rude and uncaring.” Begin conversations with something that you have in common, such as asking about their family.
Be aware of personal boundaries. Some cultures prefer a lot of space between themselves and the person they’re talking with. Others feel comfortable with a smaller distance. Look for clues from those you’re talking with by where they position themselves.
If you are invited into people’s homes, before entering look to see if shoes are left outside or just inside the door. Although your hosts would never say anything, failing to remove your shoes or at least offering to do so is a serious social misstep.
Culture in Evaluation #7: Asian/Pacific Islander Population – Page 16
Accept any food or gifts that are offered to you. It is considered rude if you don’t. In turn, expect to do the same when you invite people to meet with you. Reciprocity is an important cultural value.
Try to avoid asking direct or penetrating questions. Word things in a way that gets at information using the third person or a situational context (e.g., “Some people in the neighborhood have said that only the men smoke. Is that true in your household?”).
Remember that maintaining “face” or self-regard is important in Asian cultures. Try not to put people in a position where they feel criticized or incompetent. This is taken as a personal affront and you may lose any cooperation you were counting on.
Don’t mistake someone’s nodding or saying “yes” for true agreement or understanding. The desire to maintain harmony or to avoid revealing limitations often hides the fact that a person is not actually on board with a decision or that they did not fully comprehend what was said. Rather than saying “no”, hesitancy or ambiguity is used to express unwillingness or disagreement without giving offense.
Pay attention to the context of what is being communicated. Look to non-verbal cues to inform you as much as the words being spoken. You will need to rely on your homework about each culture to pick up on these things AND have a cultural guide with you. Otherwise, you’re likely to miss the import of what is or is not being communicated. For example in Southeast Asian cultures, smiling can be an expression of embarrassment or pain rather than happiness. Some ethnic groups avoid looking people directly in the eye as an expression of respect; others maintain eye contact while conversing. The amount varies by culture, so find out what’s the norm.
Accept what an individual cannot say about a person or situation and don’t press for more information. Remember that some A/PI cultures find it difficult to talk about personal issues or even to respond to direct questioning. Be sensitive to when it would be better to withdraw and come back again later.
Be aware that self-reported measures may be affected by the cultural norm for self-control and moderation, especially when it comes to feelings or emotions.
If you don’t understand someone’s accent, it’s ok to ask them to repeat what they’ve said or to ask for clarification. Don’t correct their speech, however.
When using an interpreter to translate, direct your questions to the person you’re asking, not the translator. This shows your respect. Also, the individual may actually understand more than s/he lets on. Never ask a child to interpret for their elders. This places the parent in a lower status position and causes a loss of face.
Use the language of the people. When speaking in English, refrain from using big words. Learn how to say “thank you” in their language to show your appreciation to them for sharing their opinions.
Tell your sources why you’re collecting data, how it will be used, what level of confidentiality you can give, and emphasize how the process will benefit the community.
Culture in Evaluation #7: Asian/Pacific Islander Population – Page 17
Record what people say in their own words. Resist the temptation to edit at this point. You can synthesize their comments later during analysis, but while you’re in the community it’s important for respondents to feel that their own voice is being heard.
Using Qualitative Methods When it appears that you’re just not getting the kind of information you should from a survey, you might consider trying a different approach to data collection. Because oral storytelling is a tradition in many Asian/Pacific Islander subgroups, that can be an effective way to get a richer, more realistic understanding of the issue.
Some strategies to try are: Rather than asking direct questions, invite subjects to tell you their stories
about the topic (e.g., life in their household). Pick the data you need out of the story as it is told to you. Pay attention, as well, to what is not being said. That may hold some important clues.
Ensure that you’re getting an accurate perspective by asking the person or group the same question in several ways during the interview or focus group. Gather data from more than one person.
Be aware that in some cultures, stories tend not to proceed linearly or chronologically. Instead, they are told in an episodic, random manner to emphasize specific points or for certain effect.
Use participant observation to learn more about the community or to validate data you’ve already collected.
Conclusion The idea for developing this guide for doing evaluation with Asian or Pacific Islander populations sprang out of a workshop on culturally competent evaluation conducted by the Tobacco Control Evaluation Center (TCEC) in August 2005. Notes generated by participant comments during the priority population-specific breakout session served as the starting point. From there, a review of relevant literature was conducted and input was added from evaluators, tobacco control project staff and other experts who work with Asian and Pacific Islander populations. However, the work is still unfinished. We haven’t yet heard what evaluation strategies have worked for you when conducting evaluation activities in the Asian/Pacific Islander communities you serve! We hope you’ll share your stories, advice, strategies and resources so we can continually improve this document. Please send your comments to Robin Kipke at the Tobacco Control Evaluation Center (TCEC) via email at: [email protected].
Culture in Evaluation #7: Asian/Pacific Islander Population – Page 18
We would like to thank the project directors, staff and evaluators of People’s Community Organization for Reform and Empowerment (CORE), the South Asian Network and other tobacco control projects in California for sharing their expertise about working with Asian and Pacific Islander communities with us. In particular we’d like to thank: Joe Navidad, Christine Araquel, Arturo “Al” Garcia and Jason Yap of People’s CORE and their evaluator, Dr. Veronica Acosta-Deprez; as well as Hamid Khan, Ranjeeta Chhetry, Rajwinder Kaur, Shabir Bashir and Prakash Ghimire of South Asian Network and their evaluator, Dr. William McCarthy. Their cultural knowledge helped make this document relevant and practical for practitioners in the field.
Reference List Agbayani-Siewert, P. 1994. “Filipino American Culture and Family: Guidelines for Practitioners.” Families in Society: The Journal of Contemporary Human Services, CEU article no. 44. Agbayani-Siewert, P. 1997. “The Dual World of Filipino Americans.” Journal of Multicultural Social Work 6 (1/2): 59-76. Agbayani-Siewert, P. and L. Revilla. 1995. “Filipino Americans.” Asian Americans: Contemporary Trends and Issues. Edited by Pyong Gap Min. Thousand Oaks, CA: Sage Publications. American Cancer Society. 1993. Guidebooks for Divisions and Units: Methods & Techniques of Reaching and Serving the Cancer Control Needs of the Socioeconomically Disadvantaged and Diversified Cultures. (Out of print, but available through the TECC library.) Baluja, K., J. Park, and D. Myers. 2003. “Inclusion of Immigrant Status in Smoking Prevalence Statistics,” in American Journal of Public Health 93 (4):642-646. Bankston, C. III. 2006. “Cambodian Americans.” Accessed 11/12/08. http://www.everyculture.com/multi/Bu-Dr/Cambodian-Americans.html — “Laotian Americans.” Multicultural America. Accessed 11/3/2008. http://www.everyculture.com/multi/Ha-La/Laotian-Americans.html Boase, B. 1997. Understanding Lao Culture. UNDP. Accessed 11/3/2008. http://www.seasite.niu.edu/lao/undp/understandingCulture.htm — Working with Your Lao Partner. UNDP. Accessed 11/3/2008. http://www.seasite.niu.edu/lao/undp/workingEffectively.htm Booth, L. 2007. A Profile of Pacific Islanders in Oakland, California. National Council on Crime and Delinquency. CA Dept. of Health Services, Tobacco Control Section. 2006. Communities of Excellence in Tobacco Control: Module II Priority Populations 4: 53-64. — 2005. Press Release (#05-60) on 2004 Data. Accessed on 10/30/08.
http://www.applications.dhs.ca.gov/pressreleases/store/PresReleases/05-60.html
CA State Department of Finance, Demographic Research Unit. 2007. California Current Population Survey Report: March 2006. http://www.dof.ca.gov/HTML/DEMOGRAP/ReportsPapers/ReportsPapers.php Cooper, A. 2006. “Tongan Americans.” Multicultural America. Accessed 11/12/2008. http://www.everyculture.com/multi/Sr-Z/Tongan-Americans.html Cox, P. 2006. “Samoan Americans.” Multicultural America. Accessed 11/12/2008. http://www.everyculture.com/multi/Pa-Sp/Samoan-Americans.html Dela Cruz, F., G. Padilla and E. Agustin. 2000. “Adapting a Measure of Acculturation for Cross-Cultural Research.” Journal of Transcultural Nursing, 11 (3):191-198.
Culture in Evaluation #7: Asian/Pacific Islander Population – Page 19
Eisenbruch, M. 1991. From Post-Traumatic Stress Disorder to Cultural Bereavement: Diagnosis of Southeast Asian Refugees. http://www.eisenbruch.com/about_us/Eisenbruch%20-%20From%20PTSD%20to%20cultural%20 bereavement.pdf
Gochenour, T. 1990. Considering Filipinos. Yarmouth, ME: Intercultural Press, Inc. Huang, G. 1993. “Beyond Culture: Communicating with Asian Pacific Islander American Children and Families.” Columbia University Digest 94 (Dec.) Accessed 11/2/08. http://eric-web.tc.Columbia.edu Hur, S. and B. Hur. 1999. Cited in Asian Culture Brief: Korea 2 (1). National Technical Assistance Center. Accessed 11/1/08. http://www.ntac.hawaii.edu/downloads/products/briefs/culture/pdf/ACB-Vol2-Iss1-Korea.pdf Keown-Bomar, J., T. Dunnigan and J. Beirle. 2001. “North American Hmong” Cultural Summary. Human Relations Area Files. Yale University. Accessed 11/3/08. http://ehrafworldcultures.yale.edu/ehrafe/cultureDescription.do?profileSelect=0&cultureDescription=1 Kim, B., et al. 2001. “Cultural Value Similarities and Differences among Asian American Ethnic Groups.” Cultural Diversity and Ethnic Minority Psychology 7 (4): 343-361. Laverack, G. and K. Brown. 2003. “Qualitative Research in a Cross-Cultural Context: Fijian Experiences.” Qualitative Health Research 13: 333. Accessed 1/13/09. http://qhr.sagepub.com/cgi/content/abstract/13/3/333 Lew, L. 1991. “Elderly Cambodians in Long Beach: Creating Cultural Access to Health Care.” Journal of Cross-Cultural Gerontology 6: 199-203. Lew, R. and S. Tanjasiri. 2003. “Slowing the Epidemic of Tobacco Use among Asian Americans and Pacific Islanders.” American Journal of Public Health 93 (5): 764-768. McLaughlin, L. and K. Braun. 1998. “Asian and Pacific Islander Cultural Values: Considerations for Health Care Decision Making.” Health and Social Work 23 (2). Migration Policy Institute. 2008. Fact Sheet on the Foreign Born: Demographic and Social Characteristics. Accessed on 9/29/08. http://www.migrationinformation.org/DataHub/state.cfm?ID=CA Nishi, S. 1995. “Japanese Americans.” Asian Americans: Contemporary Trends and Issues. Edited by Pyong Gap Min. Thousand Oaks, CA: Sage Publications. Pavri, T. 2006. “Asian Indian Americans.” Multicultural America. Accessed 11/4/08. http://www.everyculture.com/multi/A-Br/Asian-Indian-Americans.html People’s CORE Staff. 2008. Interviewed by Robin Kipke. Tape recording. June 6, 2008. PCORE office, Los Angeles, CA. Phinney, J., A. Ong and T. Madden. 2000. “Cultural Values and Intergenerational Value Discrepancies in Immigrant and Non-Immigrant Families.” Child Development 71 (2): 528-539. Portis, M. 2003. “Language Sensitive Health Education: Lessons from the Field.” California Journal of Health Promotion 1 (2):3-12. Ro, M. 2000. Overview of Asian and Asian Pacific Islanders in the United States and in California. www.communityvoices.org/Uploads/om3gfk55hhzyvrn00n4nerbf_20020828090003.pdf Romero, R. et al. 2008. “Smoking Trends among Filipino Adults in California, 1990-2002.” Preventative Medicine 46: 336-339.
Culture in Evaluation #7: Asian/Pacific Islander Population – Page 20
Rumbaut, R. 1995. “Vietnamese, Laotian and Cambodian Americans.” Asian Americans: Contemporary Trends and Issues. Edited by Pyong Gap Min. Thousand Oaks, CA: Sage Publications.
South Asian Network Staff. 2008. Interviewed by Robin Kipke. Tape recording. June 20, 2008 South Asian Network office, Artesia, CA. Sheth, M. 1995. “Asian Indian Americans.” Asian Americans: Contemporary Trends and Issues. Edited by Pyong Gap Min. Thousand Oaks, CA: Sage Publications. Swain, L. 2006. “Pacific Islander Americans.” Multicultural America: Le-Pa. Accessed 11/12/08. http://www.everyculture.com/multi/Le-Pa/Pacific-Islander-Americans.html Tang, H., R. Shimizu and M. Chen. 2005. “English Language Proficiency and Smoking Prevalance among California’s Asian Americans.” Cancer 104 (12 Suppl): 2982-8. American Cancer Society. http://www.interscience.wiley.com Tong, E. et al. 2008. “Smoking Behaviors among Immigrant Asian Americans Rules for Smoke-Free Homes.” American Journal of Preventative Medicine July, 35 (1): 64-67. US Census Bureau. 2007. “Selected Population Profile in the United States (California)” S0201 in American Community Survey 1-Year Estimates. Accessed 1/4/09. http://factfinder.census.gov/servlet/DatasetMainPageServlet?_program=ACS&_submenuId=&_lang=en&_ts= Villaverde, R. 2006. Guam website. University of Guam. Accessed 1/14/09. http://ns.gov.gu Weaver, H. 2005. Explorations in Cultural Competence: Journeys to the Four Directions. Belmont, CA: Thomson Brooks/Cole. Winters, E. and M. Swartz. 2006 “Hawaiians.” Multicultural America. Accessed 1/13/09. http://www.everyculture.com/multi/Ha-La/Hawaiians.html Wong, M. 1995. “Chinese Americans” in Asian Americans: Contemporary Trends and Issues. Edited by Pyong Gap Min. Thousand Oaks, CA: Sage Publications.
Resources
CULTURAL COMPETENCE American Cancer Society Guidebooks for Divisions and Units: Methods & Techniques of Reaching and Serving the Cancer Control Needs of the Socioeconomically Disadvantaged and Diversified Cultures.
► A rich resource of practical information about how to gain access to and work with diverse populations. No longer in print, but available from TECC (call # TECC RF 353)
Asian American & Pacific Islander Partnership: Evaluation of Activities
►Effective tobacco control strategies and ways to reach out to API communities published by the Asian and Pacific Islander American Health Forum in 2007. www.apiahf.org
Health Promotion in Diverse Cultural Communities ►Recommended by a tobacco control project director, this 58 page book by V. Gonzalez et al. was published by the Stanford Center for Research in Disease Prevention in 1991.
Beyond Culture: Communicating with Asian Pacific Islander American Children and Families http://www.capaa.wa.gov/pdf/education/BEYOND_CULTURE.pdf
►A paper authored by G. Huang in the Columbia University Digest 94 (December) which provides useful advice about reaching out to A/PI individuals.
Culture in Evaluation #7: Asian/Pacific Islander Population – Page 21
National Center for Cultural Competence http://www11.georgetown.edu/research/gucchd/nccc/
►This center, a part of Georgetown University, is a rich source of information about cultural competence. At their website, you can access a resource database filled with articles, papers, self-assessment checklists, demographic information and even curricula on cultural competence. In particular, see “Choosing and Adapting Culturally and Linguistically Competent Health Promotion Materials.”
Tobacco Control Evaluation Center (TCEC) http://www.tobaccoeval.ucdavis.edu
►Provides technical assistance, training and materials on culturally competent evaluation (as well as all other evaluation topics). The six how-to guides in the Culture in Evaluation series offer practical tips for conducting evaluation with various priority populations. These free publications can be downloaded from TCEC’s website.
DEMOGRAPHIC STATISTICS There are a number of sites where you can find good statistics on the characteristics of your target population. Unfortunately, they may not all come from the same year. So be careful to cite the source and year of the data. Also, be sure to clarify in your text if the statistics are for the entire US, California or for your county. CA Department of Education http://data1.cde.ca.gov/dataquest
►Source of data on high school exit exam results, which may be more useful than high school graduation data from the CA census which may not include current data for rural areas. It also provides data by ethnic group.
CA Department of Social Services (CDSS) http://www.cdss.ca.gov/research/default.htm
►Source of data and reports by county, population, unemployment, disability, refugee arrival, welfare and other assistance programs
CA State Department of Finance, Demographic Research Unit http://www.dof.ca.gov/Research/Research.php
►To get demographic statistics by CA county, search data sets for specific characteristics which can be used as context for your activities or in discussions with decision-makers
US Census Bureau website allows you to get state specific data from the Statistical Abstract of the United States. ►For a reference guide about how to use the annual data supplements from the US Census: http://factfinder.census.gov/home/saff/aff_acs2006_quickguide.pdf ►To find data for your county from the US Census go to http://factfinder.census.gov and type your county in the top left box.
►For data on education level and foreign born in California (Summary File 3): http://factfinder.census.gov/servlet/QTTable?_bm=y&-geo_id=04000US06&-qr_name=DEC_2000_SF3_U_DP2&-ds_name=DEC_2000_SF3_U ►For data on poverty levels in the Statistical Abstract, see Table 691: http://www.census.gov/prod/2006pubs/07statab/income.pdf
Culture in Evaluation #7: Asian/Pacific Islander Population – Page 22
EVALUATION RESOURCES Tobacco Control Evaluation Center (TCEC) http://www.tobaccoeval.ucdavis.edu
►Provides technical assistance, training and materials to help tobacco control projects funded by the CA Department of Health Services with their evaluation plans and activities. Maintains a repository of data collection instruments to share with client organizations. Posts on its website a variety of “how-to” publications, archived teleconferences and mini trainings on evaluation topics including culturally competent evaluation.
LITERACY RESOURCES California Health Literacy Initiative http://www.cahealthliteracy.org/resource_center.html
►This website has links to a variety of resources: clip art for health literacy, multilingual resources, materials for adult educators, a list of who’s who in the field of health literacy.
Health Education Council http://www.healthedcouncil.org
►Offers training and technical assistance in coalition development, needs assessment and development of materials in different languages or for specific populations.
Language Sensitive Health Education: Lessons from the Field ►A paper full of practical tips on formatting and wording of materials for working with low literacy populations. Authored by M. Portis in the California Journal of Health Promotion 1 (2):3-12.
TOBACCO CONTROL RESOURCES California Department of Health Services, Tobacco Control Section ►Culture-specific resources with tobacco use data prevalence and behavior in A/PI populations. — California Asian Indian Tobacco Use Survey - 2004. McCarthy, W. et al. 2005. — California Chinese American Tobacco Use Survey – 2004. Carr, K. et al. 2005. — California Korean American Tobacco Use Survey – 2004. Carr, K. et al. 2005. — Communities of Excellence in Tobacco Control: Module II Priority Populations 4: 53-64. Suggested Citation: Kipke, R., J. Elmen and T. Tsoukalas. 2009. Culture in Evaluation #7: Tobacco Control Evaluation with Asians and Pacific Islanders in California. Tobacco Control Evaluation Center. UC Davis, CA. http://tobaccoeval.ucdavis.edu
For more Tips & Tools and other resources, go to our website:
Culture in Evaluation #7: Asian/Pacific Islander Population – Page 23
http://tobaccoeval.ucdavis.edu