Embed Size (px)
Citation preview

Periscope Network
O&M Case Study ReportPeriscope WP4, Activity 6
WWW.PERISCOPE-NETWORK.EU

AUTHOR // Anthony Gray CO-AUTHOR // Hamish MacDonald, Nadezda Avanessova
DATE // 10-Mar-2021 REFERENCE // PN000376-RPT-003 – Rev. 1
STATUS // Private (Client use only)
REPORT
PERISCOPE O&M CASE STUDY
PERISCOPE WP4 ACTIVITY 6

PERISCOPE O&M Case Study 10-Mar-2021
ORE Catapult Private (Client use only) 2 PN000376-RPT-003 – Rev. 1
Disclaimer
Whilst the information contained in this report has been prepared and collated in good faith, ORE
Catapult makes no representation or warranty (express or implied) as to the accuracy or completeness
of the information contained herein nor shall we be liable for any loss or damage resultant from reliance
on same.
Document History
Revision Date Prepared by Checked by Approved by Revision History
1 10/03/2021 Anthony Gray Luke Eatough Tony Fong

PERISCOPE O&M Case Study 10-Mar-2021
ORE Catapult Private (Client use only) 3 PN000376-RPT-003 – Rev. 1
Executive Summary
There seems to be a lack of a clear business and carbon-reduction case to support robotics and autonomy
over the existing practices of Operations & Maintenance (O&M) in the offshore renewable energy (ORE)
sector. This report presents a comparative assessment of certain ORE O&M practices, evaluating
operational cost, live carbon emissions (i.e. from vessels), and Health and Safety (H&S) risk of known
tasks against Robotic and Autonomous Systems (RAS). The comparisons presented focus on the areas
of subsea inspection and maintenance for floating wind and wave assets, as well as blade inspections and
minor repairs for floating wind assets. These form deep-dive areas of interest within the PERISCOPE
project.
ORE Catapult’s in-house O&M simulation tool has been utilised for this study. Experience with bottom-
fixed offshore wind has informed the model inputs for the floating wind scenario, however, further
research has been undertaken to identify O&M activities for components specific to floating wind and
wave energy, such as mooring systems and dynamic cables. These reference O&M activities form the
base case. The RAS case has then been defined by adopting a multi-system approach, with estimations
made to the changes that Autonomous Surface Vessels (ASVs), Autonomous Underwater Vehicles
(AUVs), airborne drones, blade-crawling robots, and onshore-based technicians would have on these
reference O&M activities.
Two sites were selected for the analysis. The floating wind scenario represents a hypothetical site off the
North East coast of Scotland, consisting of sixty-six 15MW turbines. The wave energy site is located off
the North coast of Scotland and is a 10MW project, consisting of ten 1MW wave energy converters.
In both cases (floating wind and wave energy), the results of the modelling suggest that RAS can have a
positive impact on the O&M phase of offshore renewable energy projects. This was true across all three
performance metrics assessed in this study: operational expenditure (‘the cost case’), O&M vessel
emissions (‘the carbon case’), and personnel Health and Safety (H&S, ‘the risk case’).
Recommended next steps from this modelling work include:
i. creation of dedicated RAS testing facilities.
ii. initiation of an industry database for floating-specific components.
iii. incorporation of vessel emissions and H&S risk into O&M models as standard.
iv. validation of O&M models against real-world projects or, if that is not possible, verification
against other tools.

PERISCOPE O&M Case Study 10-Mar-2021
ORE Catapult Private (Client use only) 4 PN000376-RPT-003 – Rev. 1
Contents
1 Introduction ........................................................................................................... 7
1.1 ORE Catapult .............................................................................................................. 7
1.2 PERISCOPE ................................................................................................................ 7
1.3 Report Objective ........................................................................................................ 7
1.4 Floating Wind ............................................................................................................ 8
1.5 Wave Energy ............................................................................................................. 9
2 Methodology ........................................................................................................ 11
2.1 COMPASS Tool ........................................................................................................ 11
2.2 Scenario Definition ................................................................................................... 15
2.3 Reference Case O&M Activities ............................................................................... 20
2.4 RAS Case O&M Activities ........................................................................................ 26
2.5 Inputs and Data Sources ........................................................................................... 33
3 Results ................................................................................................................ 38
3.1 Economic Comparative Assessment......................................................................... 38
3.2 Emissions Comparative Assessment ........................................................................ 41
3.3 Risk Comparative Assessment .................................................................................. 45
4 Discussion ............................................................................................................ 51
4.1 Key Results ............................................................................................................... 51
4.2 Methodology Constraints ......................................................................................... 52
4.3 Recommendations ................................................................................................... 52

PERISCOPE O&M Case Study 10-Mar-2021
ORE Catapult Private (Client use only) 5 PN000376-RPT-003 – Rev. 1
Nomenclature
AEP Annual Energy Production
ASV Autonomous Surface Vessel
AUV Autonomous Underwater Vehicle
BEIS Department for Business, Energy & Industrial Strategy
CO2e Carbon Dioxide Equivalent
COMPASS Combined Operations and Maintenance, People, Assets and Systems Simulation
CTV Crew Transfer Vessel
ECMWF European Centre for Medium-Range Weather Forecasts
EMEC European Marine Energy Centre
FMEA Failure Modes and Effects Analysis
FOW Floating Offshore Wind
FOW CoE Floating Wind Centre of Excellence
FOWT Floating Offshore Wind Turbine
FTE Full Time Employee
GW Gigawatt
GWh Gigawatt-hour
H&S Health and Safety
IRENA International Renewable Energy Agency
KPI Key Performance Indicator
kW Kilowatt
kWh Kilowatt-hour
LCA Lifecycle Assessment
LCOE Levelised Cost of Energy
LPS Lightning Protection System
MIMRee Multi-Platform Inspection, Maintenance and Repair in Extreme Environments
MRE Marine Renewable Energy
MW Megawatt
MWh Megawatt-hour

PERISCOPE O&M Case Study 10-Mar-2021
ORE Catapult Private (Client use only) 6 PN000376-RPT-003 – Rev. 1
NDT Non-Destructive Testing
NREL National Renewable Energy Laboratory
NSR North Sea Region
O&M Operations and Maintenance
OEE Ocean Energy Europe
OPEX Operational Expenditure
ORE Offshore Renewable Energy
PPE Personal Protective Equipment
PWP Pelamis Wave Power
R&D Research and Development
RAS Robotic and Autonomous Systems
RDS-PP® Reference Designation System for Power Plants
ROV Remotely Operated Vehicle
Semi-sub Semi-Submersible Structure
SET Strategic Energy Transition
SOV Service Operation Vessel
SPARTA System Performance, Availability and Reliability Trend Analysis
TWh Terawatt-hours
UAS Unmanned Aircraft System (i.e. airborne drone)
UK United Kingdom
USV Unmanned Surface Vessel
WEC Wave Energy Converter
WES Wave Energy Scotland

PERISCOPE O&M Case Study 10-Mar-2021
1 Introduction
1.1 ORE Catapult
The Offshore Renewable Energy (ORE) Catapult is the UK’s flagship technology innovation and research
centre for offshore wind, wave and tidal energy. It is an independent, not-for-profit business that exists
to accelerate the development of offshore wind, wave and tidal technologies. ORE Catapult has regularly
participated in large-scale collaborative Research and Development (R&D), as well as innovative
commercial and public funded projects, amassing vast technical knowledge and know-how. Through
world-class testing and research programmes, ORE Catapult works for industry, academia and
government to improve technology reliability and enhance knowledge, directly impacting upon the cost
of offshore renewable energy. ORE Catapult has been involved in the development, testing and
economic assessment of a number of robotic and autonomous innovations for use in the offshore wind
industry.i
1.2 PERISCOPE
The North Sea Region (NSR) is a crucial area for Europe's Blue Economy with marine resources,
technologically advanced industries, major port areas and increased offshore activities. Due to global
drivers, the wider maritime, marine and offshore economies are exposed to profound challenges with
some industries undergoing significant changes, including increased production (offshore wind in
Denmark and Germany), as well as stagnation and decrease of production (oil & gas in UK and Norway)
- the NSR is experiencing a period of considerable restructuring.
PERISCOPE aims at establishing a permanent innovation ecosystem in the North Sea Region to grow
transnational innovation partnerships for sustainable business development in emerging blue markets.
PERISCOPE is a project co-funded by the North Sea Region Programme 2014 - 2020.ii
1.3 Report Objective
In seeking to structure future funding proposals around supporting this sector there seems to be a lack
of a clear business and carbon-reduction case to support autonomy over the existing practices of O&M
(Operations & Maintenance).
The objective is to carry out case studies that assess certain ORE O&M practices, comparing cost, live
carbon emissions (i.e. from vessels), and Health and Safety (H&S) risk of known practices against Robotic
and Autonomous Systems (RAS). These comparisons will focus on the areas of subsea inspection and
maintenance for floating wind and wave assets, as well as blade inspections and minor repairs for floating
wind assets. These form deep-dive areas of interest within the PERISCOPE project.

PERISCOPE O&M Case Study 10-Mar-2021
It is anticipated that these initial studies would support the case for progressing the level of autonomous
implementation for robotic vehicle applications in ORE O&M. The outcomes will assist potential new
funding applications to support autonomous solutions for the Marine Renewable Energy (MRE) sector,
by providing clear quantitative evidence for their implementation.
1.4 Floating Wind
The UK government has a target to reach 40GW of installed offshore wind capacity by 2030, as part of
an effort to reach Net Zero by 2050.iii This new target will require rapid build-out and development of
local supply chains to maximise the value of these projects to the UK economy. The majority of this 2030
target will be met by bottom-fixed offshore wind farm projects, however, the UK government recently
set a target of 1GW of floating offshore wind (FOW) to be delivered by 2030.iv A recent report from the
Floating Wind Centre of Excellence (FOW CoE) has recommended that this 2030 target be increased to
2GW in order to accelerate the cost reduction of FOW.v The report highlighted that, whilst initial cost
reduction is achieved through increasing levels of deployment, further cost reduction is gained through
the use of innovative technologies and techniques. Beyond 2030, floating offshore wind will play a key
role in the UK achieving its net zero ambition in 2050.
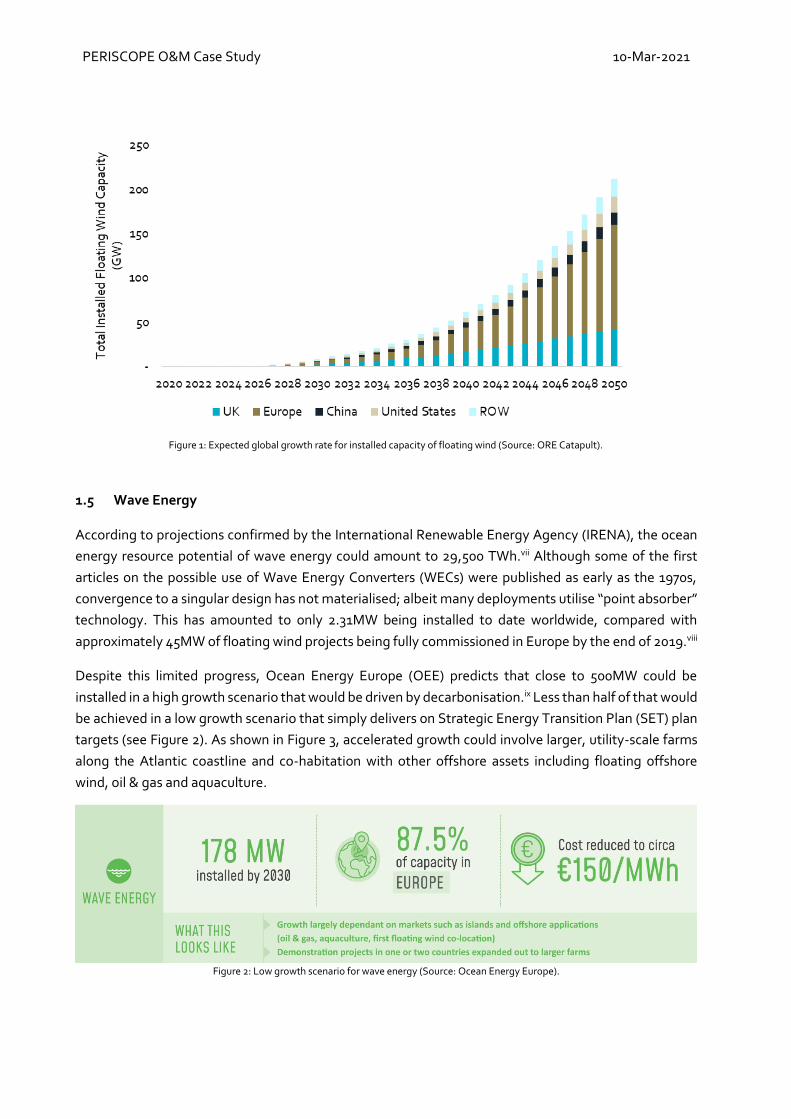
It is expected that other global markets, including Europe, will follow a similar growth rate as the UK in
floating wind, as shown in Figure 1. For example, trade body WindEurope state:
• Europe has most of the floating wind installed capacity and technology concepts including the
largest operational floating wind turbine and wind farm on the water in the world. It is a proven
technology.
• There will be nearly 350MW online in 2022 and at least 6 GW worth of projects that could be
commissioned by 2030 if they secure support.
• At least 7 countries in Europe have the ambition to develop floating wind in the next decade.
• Europe needs between 100-150 GW of floating wind to reach climate neutrality.
• Volumes backed-up with the right policies will continue to reduce cost to €40-60/MWh by 2030.vi
PERISCOPE O&M Case Study 10-Mar-2021
1.5 Wave Energy
According to projections confirmed by the International Renewable Energy Agency (IRENA), the ocean
energy resource potential of wave energy could amount to 29,500 TWh.vii Although some of the first
articles on the possible use of Wave Energy Converters (WECs) were published as early as the 1970s,
convergence to a singular design has not materialised; albeit many deployments utilise “point absorber”
technology. This has amounted to only 2.31MW being installed to date worldwide, compared with
approximately 45MW of floating wind projects being fully commissioned in Europe by the end of 2019.viii
Despite this limited progress, Ocean Energy Europe (OEE) predicts that close to 500MW could be
installed in a high growth scenario that would be driven by decarbonisation.ix Less than half of that would
be achieved in a low growth scenario that simply delivers on Strategic Energy Transition Plan (SET) plan
targets (see Figure 2). As shown in Figure 3, accelerated growth could involve larger, utility-scale farms
along the Atlantic coastline and co-habitation with other offshore assets including floating offshore
wind, oil & gas and aquaculture.
Figure 2: Low growth scenario for wave energy (Source: Ocean Energy Europe).
Figure 1: Expected global growth rate for installed capacity of floating wind (Source: ORE Catapult).

PERISCOPE O&M Case Study 10-Mar-2021
Figure 3: High growth scenario for wave energy (Source: Ocean Energy Europe).
The cost-reduction pathway for both wave and tidal energy, proposed by Ocean Energy Europe, sensibly
focuses on technology performance for the immediacy; higher yield from larger rotors and capacity
factors from a more consistent wind profile were amongst the primary drivers for the reduction in the
Levelised Cost of Energy (LCOE) in bottom-fixed offshore wind. The subsequent area of priority is stated
as ‘improved operations’, including an increased reliance on predictive and remote maintenance. To
ensure that the roadmap is not prolonged, it is imperative that wave energy does not attempt to replicate
the conventional approach of offshore wind O&M. Alongside remote monitoring, RAS can play an
influential role in a more proactive philosophy for O&M, imparting reductions not just in cost but also in
health & safety risk and carbon emissions. By highlighting areas of potential for RAS to make an impact
within wave energy O&M, PERISCOPE will have a greater understanding of where to focus future
developments.

PERISCOPE O&M Case Study 10-Mar-2021
2 Methodology
2.1 COMPASS Tool
ORE Catapult’s internal O&M simulation model, called the Combined Operations and Maintenance,
People, Assets and Systems Simulation (COMPASS) tool, has been used for this report. The COMPASS
tool is a Python-based model which is interfaced with Microsoft Excel for the input and output files. It
was originally designed for analysing traditional bottom-fixed offshore wind farms but has been adapted
for this report to model floating wind and wave energy farms. The COMPASS tool is intended primarily
for obtaining reliable estimates of Operational Expenditure (OPEX) of offshore renewable energy farms
for informing internal cost modelling projects. It takes key characteristics of an offshore wind farm, such
as number of turbines, site capacity etc., and applies a series of O&M activities.
The ‘bottom-up’ O&M reference activities are considered with respect to the Reference Designation
System for Power Plants (RDS-PP)® methodology of component assignment down to the subsystem
designation, as shown by the example in Table 1.x O&M activities are populated within these subsystems
for wind turbine components. Activities for the windfarm assets are assigned at a system level (e.g.
export cables) or where a clear designation could not be determined (e.g. seabed survey) at a windfarm
level.
Table 1: RDSPP® designation concept example (Wind Turbine Yaw Drive).
Main System System Subsystem
Description Wind Turbine Yaw System Yaw Drive
Code =G001 MDL 10
Code (Overall) =G001 MDL10
Each maintenance activity can either be planned (i.e. recurring scheduled measures which are organised
in advance, along with the resources required to carry out an O&M task) or unplanned (i.e. the result of a
turbine alarm or component failure) and has been assigned a rate (i.e. times per year per turbine for
scheduled maintenance, or failures per year per turbine for corrective maintenance). These rates have
been defined from a combination of publicly available academic sources (particularly Carroll et al., 2016)
as well as from the experience of the team at ORE Catapult.xi Activities are also assigned an average
duration and logistical requirements in the form of people and vessels needed. For the purposes of
COMPASS, activities informed by the evaluation of condition monitoring systems or other relevant
component data were not separately distinguished. The series of variables describing an activity are
indicated in Table 2.

PERISCOPE O&M Case Study 10-Mar-2021
Table 2: Activity parameters and descriptions.
Parameter Description Units
Planned A Boolean describing if the activity is a consequence of a failure (not planned) or is scheduled work (planned).
True | False
Rate The rate at which an activity is assumed to take place. occurrences / year
Risk
(Consequence)
1 - Negligible (No Injury/Damage) <£1,000 1
2 - Minor (Medical treatment required onsite/minor damage) £1,000<Loss<£5,000
2
3 - Moderate (Medical treatment required at hospital/modest damage) £5,000<Loss<£10,000
3
4 - Major (Reportable under RIDDOR as Major Injury or Disease/Significant Damage) £10,000<Loss<£50,000
4
5 - Catastrophic (Fatality/Major Damage) Loss > £50,000 5
Risk
(Probability)
1 - Rare e.g. 1 in 25 years 1
2 - Unlikely e.g. 1 in 5 years 2
3 - Possible e.g. 1 in every year 3
4 - Likely e.g. every 2/3 months 4
5 - Almost Certain daily/weekly 5
Equipment Cost of equipment needed to carry out the activity. This includes the cost of hiring equipment.
£ / occurrence
Consumables Cost of consumables used during the activity. £ / occurrence
Task Duration The length of time to undertake the activity work. This does not include transit time to the asset or downtime associated with the activity (captured separately).
hrs / occurrence
Downtime The length of time the asset is out of operation due to the activity taking place. This does not include the downtime caused by component failure. This can have a zero value if the asset is still operational as the activity is undertaken or be longer than the actual task duration.
hrs / occurrence
Urgency No need for immediate action. Intervene at a later date, potentially only if other inspections/repairs are to be carried out. Continue turbine operation
Low
Medium – Action required within a fixed time frame. Continue turbine operation.
Medium
Immediate action required to prevent (further) turbine damage. Stop turbine operation
High
Personnel A list and quantity of the different personnel types required to carry out the activity (e.g. rope-access technician, Jack-Up Vessel, Helicopter).
People (multiple) / occurrence
Crafts A list and quantity of the different transport mechanisms required to carry out the activity (e.g. SOV, Jack-Up Vessel, Helicopter).
Craft (multiple) / occurrence
The classification of risk in Table 3 is derived from the combination of both the probability and
consequence of the risk, defined in Table 2. This overall risk rating informs how work should proceed and
the level of risk control measures that should be performed in order to mitigate the risk; ranging from
‘Trivial’ (i.e. no action required) to ‘Very High’ (i.e. work must not be started or continued until the level
of risk has been reduced via permanent measures to at least a medium rating). In formal risk procedures,
an assessment would be performed again to see if the mitigatory actions are sufficient or if additional
controls are required before work can proceed. For the purposes of COMPASS, conventional O&M
activities that should already have safe processes in place are assessed and the higher levels of risk may

PERISCOPE O&M Case Study 10-Mar-2021
not be encountered. Therefore, the contrasting nature of different O&M tasks and approaches will be
more clearly observed when evaluating both the constituent components of probability and
consequence.
Table 3: Risk classification matrix.
Probability
Consequence
Negligible Minor Moderate Major Catastrophic
Rare Trivial Trivial Low Medium Medium
Unlikely Trivial Low Medium Medium High
Possible Low Low Medium High Very High
Likely Low Medium Medium High Very High
Almost Certain Low Medium High Very High Very High
There are two modes COMPASS can operate in: “deterministic” and “time-domain based”. The
deterministic mode of the COMPASS tool operates by taking failure rate and durations of activities and
results in an estimation of the annual usage for personnel and vessels, as well as the farm availability and
OPEX. The results can be presented at the lowest level (i.e. per activity and per subsystem for each asset)
or can be ‘rolled’ up into a high-level summary. The time-domain mode calculates the portions of costs,
availability and carbon emissions at each time step and then adds them together after calculations at all
timesteps are complete. The difference between two modes is shown in Figure 4. A combination of the
deterministic and time-domain modes of COMPASS have been used to obtain the results for this study.

PERISCOPE O&M Case Study 10-Mar-2021
At each time step in the time-domain mode, the COMPASS tool checks whether maintenance is required
and then checks for availability of personnel and vessels and suitable weather conditions (wave height
and wind speed). In the case of unplanned maintenance, the Monte Carlo method is applied in order to
model failures. The essence of this method is to generate a random number between 0 and 1 at each
timestep and based on this number determine whether the component has failed by comparing it to the
reliability of component (i.e. the probability of not failing, ‘R’). If this random number is below R(i), then
component has failed, if it is above, the component retains its operational state. Reliability at year (‘y’) is
Figure 4: Flow diagrams explaining two modes in COMPASS, input required and output from both modes.

PERISCOPE O&M Case Study 10-Mar-2021
estimated from the failure rate of components following equation derived from (Thies, 2012). Lambda
(‘λ’) denotes the number of failures in a given time period.xii
𝑅(𝑦) = 𝑒(−𝜆(𝑦))
Reliability at a timestep (‘R’) is then calculated using the following equation, where ‘n’ is the number of
timesteps in a year.
𝑅(𝑖) = √𝑅(𝑦)𝑛
At the end of the simulation, the COMPASS tool sums up all the costs from all timesteps associated with
O&M activities and adds fixed costs (e.g. IT and Onshore Base costs). In addition to all costs, the tool
calculates total energy produced by the project and calculates both time-based and energy-based
availabilities; where time-based availability is the proportion of time that a farm was operational and
energy-based availability is the proportion of energy that was generated out of ideal energy (if the entire
project was operating at full capacity 100% of the time). In addition to these conventional outputs, the
COMPASS tool calculates the overall risk rating associated with each activity and measures carbon
emissions emitted by operation vessels which are summed up in the outputs of a simulation.
2.2 Scenario Definition
The COMPASS tool requires the details of specific sites as an input. This includes aspects such as asset
coordinates, port locations, cable topology, available vessels, and design lifetime of the project. This
section details these inputs assumptions for the two baseline scenarios simulated in this study: the
floating wind farm and the wave energy array.
2.2.1 Floating Wind
The hypothetical floating wind farm used for this study is located off the North East (NE) coast of
Scotland and consists of sixty-six 15MW semi-submersible floating wind turbines located with a distance
of 2km to each other (in latitudinal and longitudinal directions). The site is located within the boundaries
of the NE8 seabed leasing area under the Scottish Government’s ‘sectoral marine plan for offshore wind
energy’ (‘ScotWind’).xiii This was highlighted as a site suitable for floating wind in the Floating Wind
Centre of Excellence’s cost reduction report.v
For this study, the site is located around 100km from the closest minor O&M port and the water depth in
that region reaches 100m. The approximate farm layout shown in Figure 5 and Figure 6 is used for
analysis. This is not intended to replicate how the real wind farm layout in that area will look, as no
environmental measurements nor wake assessments have been performed. However, it is sufficient for
O&M simulation. We have assumed the capacity of each offshore substation to be 500MW. Therefore,
two substations would be required for this site. These would be connected to the onshore substation in
Peterhead by three export cables. Fraserburgh and Peterhead are the closest O&M ports to the

PERISCOPE O&M Case Study 10-Mar-2021
considered wind farm, however, Peterhead has the capacity to play a role in assembly and manufacturing
and is therefore selected as the main O&M port for this farm.xiv
We have assumed that all repairs and maintenance in this farm are to be carried out offshore. The use of
Crew Transfer Vessels (CTVs) may be unfeasible for this site, given that the vessels would have to travel
approximately two hours to get to the farm. Therefore, a Service Operation Vessel (SOV) would be the
primary O&M vessel which can provide accommodation to the crew and withstand harsher sea
conditions. This would reduce travel time, although SOVs still need to transit back to port for resupply
missions every two weeks. In addition to accommodation for the crew, SOVs also have a walk-to-work
gangway to enable technicians to safely access turbines in harsher weather conditions than would
otherwise be possible with a CTV ‘push-on’ action. Future modelling could consider a tow-to-port
strategy for floating wind, identified as a potential cost saving in a recent report from the Offshore Wind
Innovation Hub. xv Table 4 summarises the details of the hypothetical floating wind farm selected for this
study.
Figure 5: Location and layout of the hypothetical floating wind farm used for this study.

PERISCOPE O&M Case Study 10-Mar-2021
Figure 6: Layout of the hypothetical floating wind farm used for this study, including cable topology and substation positions.
Table 4: High-level details for the hypothetical floating wind farm analysed in this study.
Parameter Units Value
Device Name text FOWT1
Device Rating MW 15
Number of Devices # 66
Farm Capacity MW 990
Design Lifetime years 25
Distance to O&M Base km 95
Distance to Cable Landfall km 95
Number of Export Cables # 3
Number of Offshore Substations # 2
Primary O&M Vessel text SOV
1 FOWT = Floating Offshore Wind Turbine

PERISCOPE O&M Case Study 10-Mar-2021
2.2.2 Wave Energy
The hypothetical wave energy farm used for this study is located off the North coast of Scotland and
consists of ten 1MW wave energy converters (WEC). The Pelamis WEC was the world’s first offshore wave
power converter to successfully generate electricity into a national grid in 2004 and has been selected for
this analysis.xvi It was a snake-like structure which generates electricity from the movement of hydraulic
rams located inside each joint (see Figure 7).
Figure 7: The Pelamis wave energy converter (Source: EMEC).
Before Pelamis Wave Power (PWP) went into administration in 2014, the company intended to develop
a 10MW wave energy farm at the Farr Point site. The quayside at Lyness in the Orkney islands was used
for all O&M activities during the testing and development of the Pelamis WECs at the European Marine
Energy Centre (EMEC). The map in Figure 8 shows the location and layout of the hypothetical wave
energy farm used in this analysis.
The O&M strategy for the Pelamis WEC was to tow the device back to port for all tasks, whereby any
maintenance and repairs would be undertaken at the quayside.xvii The processes of disconnection and
reconnection at the offshore site were designed in such a way to be as quick as possible using low-cost
multicat vessels (shown in Figure 9). No offshore maintenance or repair work on the WECs was intended,
however, cables and other subsea infrastructure would still require attention offshore. Table 5
summarises the details of the hypothetical wave farm selected for this study.

PERISCOPE O&M Case Study 10-Mar-2021
Figure 8: Location and layout of the hypothetical wave energy farm used for this study, including cable topology.
Figure 9: A Pelamis device being towed for installation at EMEC in 2012 (Source: Gray et al. 2017).
PERISCOPE O&M Case Study 10-Mar-2021
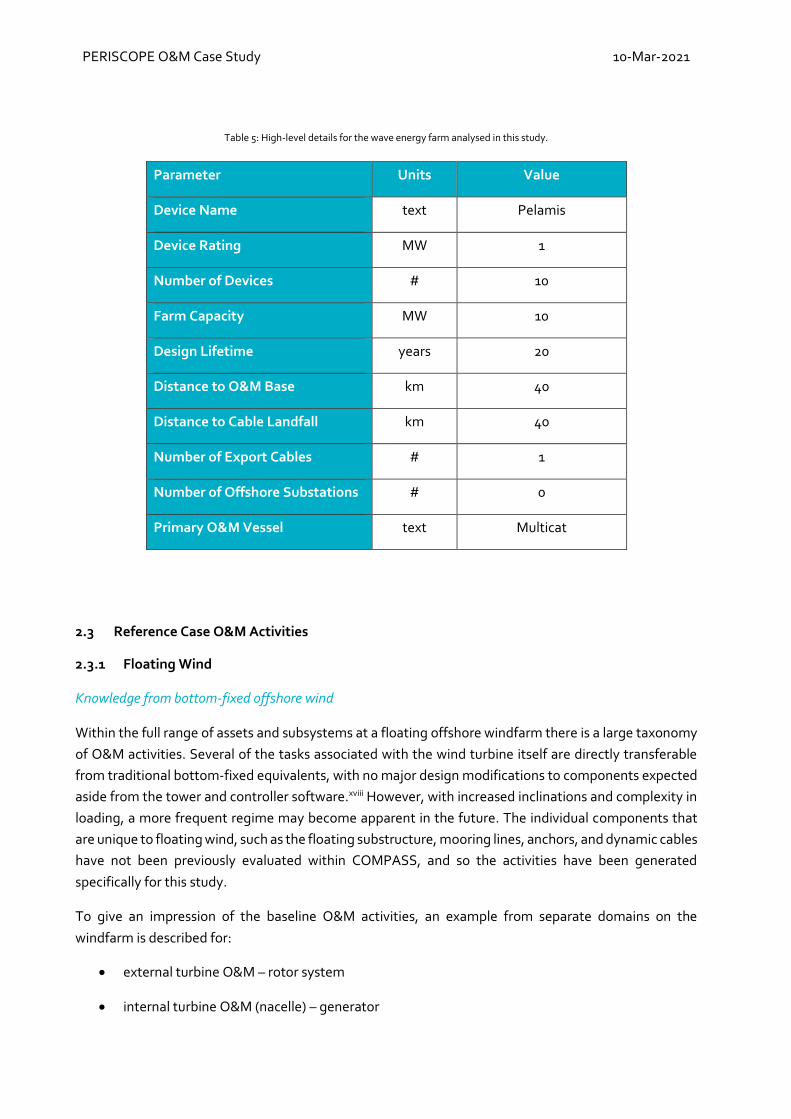
Table 5: High-level details for the wave energy farm analysed in this study.
Parameter Units Value
Device Name text Pelamis
Device Rating MW 1
Number of Devices # 10
Farm Capacity MW 10
Design Lifetime years 20
Distance to O&M Base km 40
Distance to Cable Landfall km 40
Number of Export Cables # 1
Number of Offshore Substations # 0
Primary O&M Vessel text Multicat
2.3 Reference Case O&M Activities
2.3.1 Floating Wind
Knowledge from bottom-fixed offshore wind
Within the full range of assets and subsystems at a floating offshore windfarm there is a large taxonomy
of O&M activities. Several of the tasks associated with the wind turbine itself are directly transferable
from traditional bottom-fixed equivalents, with no major design modifications to components expected
aside from the tower and controller software.xviii However, with increased inclinations and complexity in
loading, a more frequent regime may become apparent in the future. The individual components that
are unique to floating wind, such as the floating substructure, mooring lines, anchors, and dynamic cables
have not been previously evaluated within COMPASS, and so the activities have been generated
specifically for this study.
To give an impression of the baseline O&M activities, an example from separate domains on the
windfarm is described for:
• external turbine O&M – rotor system
• internal turbine O&M (nacelle) – generator

PERISCOPE O&M Case Study 10-Mar-2021
• subsea O&M – array cable
The wind turbine rotor is one of the most critical components within offshore wind O&M due to longer
downtime and cost of repair.xix Initial inspection of the wind turbine blades is carried out either by rope
access technicians, drones or from ground-based camera (either located on the transition piece or
vessel). xx Different windfarms will employ different strategies or combination of these methods, with
rope access obviously a task of high-risk consequence. Recent industry engagement suggests a transition
from an inspection of the blades every three years to biannually. Across all methods it was assumed a
minimum of two relevant personnel would be required to access the turbine by a SOV. With the time it
takes to transit, the necessary set-up and the length of modern blades only one turbine is anticipated to
be inspected per day using rope access, with ground-based solutions faster at three turbines a day and
drones the fastest at five turbines per day. Some drone inspection providers have been able to carry this
out faster with enhanced automation, but with other limiting factors and increasing turbine size this
assumption for piloted drone inspections was maintained. For the base case, it was also assumed the
internal blade inspections would be carried out by rope access. Currently, wind turbine blade repair tasks
or upgrades can only be carried out by a human technician. This can be carried out using rope access and,
if the damage is sufficiently minor, the rope access technician could make the necessary repairs on the
same inspection visit, but this is not included for consideration within COMPASS. Within COMPASS
repair is expected to last, on average, several days. If the damage requires structural repair, a repair
platform may be utilised. For conventional offshore wind turbines, removing or replacing the blade
requires the use of a heavy-lift jack-up vessel and many more technicians.
Figure 10 – Rope access technician examining a wind turbine blade (Source: Orbis Energy).
One of the main wind turbine components located within the nacelle is the generator. Typical inspection
duties include checking the overall alignment (adjusting if required) and examining the generator
bearing. As with many scheduled inspections, a team of two or three (one or more specialist and one
lower in hierarchy) undertake these duties which can take from four hours up to one day per turbine,
depending on the nature of the task. For specific electrical work, authorised technicians (such as
contractors) are expected to be utilised. Repair tasks typically last a few days and, similar to the wind
turbine blades, a jack-up vessel is required for a full generator replacement.

PERISCOPE O&M Case Study 10-Mar-2021
Unlike topside activities, the personnel and vessels involved can vary considerably for subsea
intervention. For the case of array cables, scheduled inspection is carried out to determine if the cables
have issues with burial, scour or if any other damage can be initially assessed. Conventionally this involves
the use of a manned survey vessel with three specialist personnel onboard. It is assumed within
COMPASS that this team can survey three array cables per day without asset downtime. For a more
accurate assessment of cable exposure or damage a further unscheduled subsea inspection may be
required. This can either be carried out using a tethered Remotely Operated Vehicle (ROV) or with a team
of divers. However, due to cost, deeper waters and H&S risk, diving operations tend only to be carried
out in exceptional circumstances at contemporary windfarms. ROV operations involve the use of a
specialist support vessel that can crane the vehicle into the water. It is assumed that a team of four (of
differing grades) would be able to inspect a cable in half a day with an observation class ROV. Repair of
the array cable may be required at the turbine/substation end with the team of three authorised
accessing by a SOV and taking on average three days for repair. For damage imparted elsewhere, a large
specialist vessel is required to remove a section of cable from the seabed, repair (jointing) and rebury. A
larger technician team is assumed to take five days with, on average, three turbines shut down for the
duration of work, but this could potentially take longer. A similar vessel would be required for complete
replacement of the array cable.
Floating wind-specific O&M activities
The following overview details some of the floating wind-specific O&M activities that have been defined
for this study.
Monopile maintenance activities have previously been defined in COMPASS for bottom-fixed wind
farms. For the floating wind configuration, these were replaced with maintenance activities associated
with a semi-submersible platform, mooring lines, anchors, and dynamic cables. Planned activities, their
rate and duration, associated consumables costs, personnel and vessels were estimated based on ORE
Catapult’s industry experience as well as publicly available sources.
Planned maintenance for the semi-submersible platform was considered the same as for the monopile
transition piece with an addition of one regular ROV survey to check the subsea part of the platform for
corrosion and cracks.
Taking ORE Catapult’s expertise and available literature into account, annual (once a year) and special
surveys (every five years) will be required for moorings.xxi Catenary moorings with drag-embedment
anchors are most commonly used on semi-submersible platforms. The floating wind farm case study will
assume this mooring configuration because there is more publicly available reliability and maintenance
data for this than for other options. The annual survey is assumed to be carried out with an observation
ROV to visually check the condition of all moorings. For a special survey (i.e. once every five years) it is
recommended where possible to raise moorings to the surface for a more detailed inspection. It is
assumed that half of the special surveys will be carried out with a vessel onto which a mooring will be
raised, and the other half with an observation ROV (i.e. subsea). Future floating platforms are expected
to use hybrid mooring systems which is a combination of chain and synthetic moorings. Periodic
inspections of moorings may involve checking an angle of the catenary mooring to estimate the changes

PERISCOPE O&M Case Study 10-Mar-2021
in tension, which can also be done by an observation ROV. Anchors are expected to be inspected
together with the moorings, anchor failure rates are very low (see Section 2.5.2) and so do not require
any additional planned inspection.
Planned maintenance for the dynamic cable has been added to the array cable maintenance activities
(originally defined for a bottom-fixed wind farm). Dynamic cables require regular (every couple of years)
visual inspection of bending stiffeners and hang-offs, any hardware attached to the cable free span,
buoyancy modules and cables themselves (for marine growth), protection sleeves and transition joints.xxii
All dynamic cable inspections are assumed to be done with an observation ROV to minimise the
deployment of divers and decrease health and safety risks, because water depth in the site area can reach
100m or more. Marine growth removal every 5 years was added as a regular activity to remove any
additional weight which may increase the tension in hanging cables, especially in the top 10-15m of the
cable.
Unplanned maintenance frequency is directly associated with failure rates of components (provided in
Section 2.5.2). Floating platforms are designed to withstand weather conditions without failure
throughout the lifetime of a turbine but, as with any offshore structures, dynamic sea conditions may
lead to the development of cracks. In these cases, unplanned welding activities may be required.
Synthetic moorings are expected to be used in future floating turbine assemblies, given ongoing
technology improvements regarding their physical properties and performance attributes. Synthetic
moorings can be damaged by contact with the seabed. Therefore, a hybrid system is considered, similar
to that discussed in Borg et al. (2020).xxiii Full mooring length is usually 4-6 times the water depth, to
make conservative estimations a value of 6 was chosen, with 1/6 consisting of synthetic rope and the rest
chain composition. For remediation of a mooring failure, it is assumed that the entire mooring together
along with the anchor are replaced (the old anchor presumably stays on the seabed unless there is no
space for another anchor). The cost of a replacement was estimated using the cost per meter (for both
chain and synthetic rope) multiplied by the mooring length, plus the cost of a new drag-embedded
anchor.xxiv If an anchor fails, both the anchor and the mooring are expected to be replaced even if the
mooring itself did not fail. However, this mooring may then be reused in other projects (e.g. testing or
less load-intensive deployments).
A similar approach to the moorings has been assumed for the dynamic cables. When dynamic cables fail,
they are replaced entirely between the transition joint and the connection with a turbine. The duration
of replacement is assumed to be the same as for the installation procedure, where the duration of
installation was based on a Corewind study.xxv The length and cost of a dynamic cable were estimated
using coefficients for 33kV cable taken from the same Corewind report. As there is limited data available,
a conservative assumption is made that at least one of the cable-supporting components (i.e. transition
joint, protection sleeve, buoy) will fail or be replaced once in the lifetime of a turbine. For example, over
the lifetime of a wind turbine, buoyancy modules lose up to 10% of their buoyancy, and so may require
replacement.
The reference O&M activities for the floating wind farm are summarised in terms of average annual
duration (i.e. annual rate multiplied by activity duration) in Figure 11.

PERISCOPE O&M Case Study 10-Mar-2021
Figure 11: Assumed average annual duration of floating wind O&M activities in each subsystem (per turbine, unless stated otherwise. Farm
surveys omitted).

PERISCOPE O&M Case Study 10-Mar-2021
2.3.2 Wave Energy
The O&M activities for the Pelamis wave energy devices have been extracted primarily from Wave
Energy Scotland’s (WES) O&M simulation tool.xxvi The information is also detailed in Gray et al. (2017).xvii
This O&M tool is configured to simulate a wave energy farm consisting of ten Pelamis WECs. It details
scheduled and unplanned O&M activities expected on the devices throughout their 20-year lifetime. All
device-based O&M activities are undertaken offsite, once the WEC has been towed back to port. The
WES tool does not detail inspection and maintenance of cables. Instead, we have extracted this
information in the same way as we have for the floating wind model (i.e. based on the knowledge of ORE
Catapult colleagues with experience of operating bottom-fixed offshore wind farms).
In terms of scheduled work, each WEC is assumed to undergo two forms of maintenance. The first is an
annual routine service to undertake activities such as replacing bearings, hoses, and oil, as well as
cleaning biofouling. It is carried out over seven days by four technicians. There is also a much more
labour-intensive refit of major component which is undertaken every 10 years (i.e. at the halfway point
of the design lifetime). It takes a team of seven technicians 23 days to complete this refit of major
components on each device. There is also scheduled work for array cables and export cables, which
primarily consists of subsea inspections and surveys.
Gray et al. (2017) state that Pelamis Wave Power carried out a Failure Modes and Effects Analysis (FMEA)
to identify the overall consequence of every potential failure on the WEC. This detailed analysis
subsequently fed the unplanned O&M activities stated in the WES O&M tool. The data was categorised
into sixteen O&M activities, broadly belonging to eight distinct subsystems: communications, control,
electrical, generator, hydraulics, moorings, sealing, and structure. For this study, we have utilised the
detail in the WES O&M (and Gray et al. 2017 paper) to create the O&M activities for the COMPASS tool,
where the ‘failure categories’ each has a failure rate and associated maintenance parameters, such as
power loss, parts cost and time to repair. These activities on the WEC are all deemed to be carried out
offsite (i.e. at port), where disconnection and connection at site is enabled with one multicat vessel. As
stated previously, the WES O&M tool does not contain information on array cable and export cable
failures, so we have utilised the same O&M activities as used for the floating wind scenario for those
assets.
The moorings failures listed in the WES O&M model undergo offsite repair, meaning that these activities
refer to the mooring connection point on the WECs. For this study, we have also added the same onsite
moorings O&M activities as previously defined for the floating wind farm (e.g. subsea inspections and
repairs).
The reference O&M activities for the WECs (and cables) are summarised in terms of average annual
duration (i.e. annual rate multiplied by activity duration) in Figure 12.

PERISCOPE O&M Case Study 10-Mar-2021
Figure 12: Assumed average annual duration of WEC O&M activities in each subsystem (per WEC, unless stated otherwise).
2.4 RAS Case O&M Activities
Many of the O&M activities specified in the floating wind and wave energy scenarios have potential to
utilise Robotics and Autonomous Systems (RAS). The impact of RAS on the offshore renewables
industry, a sector widely regarded as open to progress and innovation, is expected to be varied and far-
reaching. There are numerous areas within the lifecycle of offshore renewable energy that are expected
to benefit in some way from RAS, from autonomous underwater vehicles that take personnel out of
hazardous subsea environments, to sophisticated drones (i.e. Unmanned Aircraft Systems, UAS) that
can perform blade inspections in minutes.
For this study, we have decided to focus on selected opportunities for RAS which are expected to be
implemented in the short to medium term (i.e. in the next 5-15 years). Within this timeframe, ORE
Catapult anticipate that RAS will be implemented on a variety of survey and inspection tasks but are
unlikely to have a major role in manipulative tasks associated with component repairs (i.e. most repairs
will continue to be undertaken by qualified technicians). We expect that the utilisation of RAS will be
concentrated on four primary subsystems of an offshore renewable energy project:
1. General subsea inspections (including surveys)
2. Cables (array, export and dynamic)
3. Mooring systems
4. Turbine blades (not relevant for wave energy)

PERISCOPE O&M Case Study 10-Mar-2021
Small autonomous surface vessels (ASVs, also known as Unmanned Surface Vessels, USVs) are currently
available (e.g. Figure 13) that can undertake bathymetric and hydrographic surveys.xxvii We have assumed
that these vessels can be deployed from port for the reference cases, with no offshore activity by
personnel required because all data analysis can be carried out by two technicians based onshore. In this
study, this method is deemed to be suitable for undertaking planned surveys of the seabed, array cables
and export cables in the RAS scenarios.
Small ASVs do not have the ability to transport any personnel or items around the offshore site. However,
larger ASVs (e.g. Figure 14) are currently in development which are designed for integration with other
forms of robotics.xxviii For example, the Multi-Platform Inspection, Maintenance and Repair in Extreme
Environments (MIMRee) project aims to prove the successful integration of a large ASV with a blade
crawling robot (Figure 15) and an autonomous airborne drone (e.g. Figure 16). This project aims to
demonstrate that the blade crawling robot can be deployed onto wind turbine blades by an airborne
drone, launched from a large ASV. The blade crawling robot will then undertake internal inspections (i.e.
Non-Destructive Testing, NDT) and some light, planned repairs on turbine blades (including the
Lightning Protection System, LPS), whilst the airborne drone carries out external blade inspections. We
have again assumed that only two technicians, both based onshore, would be required to oversee the
operations and carry out the required data analysis (although much of the analysis process is likely to be
automated as well).
Figure 13: A small ASV suitable for bathymetric and hydrographic surveying (Source: ORE Catapult).

PERISCOPE O&M Case Study 10-Mar-2021
Figure 14: An example of a large ASV suitable for deployment
of other robotic systems (Source: OceanInfinity).
Figure 15: A blade crawling robot, developed by BladeBug
(Source: ORE Catapult).

PERISCOPE O&M Case Study 10-Mar-2021
Similarly, large ASVs could integrate with tether-less autonomous underwater vehicles (AUVs) (e.g.
Figure 17) to enable personnel-free launch and recovery. This would remove both the requirement for an
ROV support vessel and the need to place personnel in the dangerous offshore environment. This RAS
will replace activities involving ROVs and, with improved data processing (e.g. Figure 18), enable all data
processing to be undertaken by onshore-based personnel. For the RAS scenarios in this study, AUVs will
be deployed in this manner for inspection of array cables, export cables, dynamic cables, mooring
systems, and subsea sections of structures (e.g. the semi-submersible platform for turbines), as well as
for a more detailed survey inspection of the seabed.
Figure 17: Modus' seabed intervention AUV (Source: ORE Catapult).
Figure 16: SkySpecs' autonomous airborne drone (Source:
roboticsandautomationnews.com).

PERISCOPE O&M Case Study 10-Mar-2021
Each of the robotic and autonomous systems assessed in this study has clear impacts in the type and
number of vessels and personnel used in O&M activities. The systems are also likely to impact on duration
and frequency of activities. RAS are likely to fundamentally change the focus of O&M towards preventive
maintenance, rather than reactive. For example, a floating wind farm operator may decide to increase
the number of inspections undertaken by ASVs and AUVs (compared to the current rate) as this will
provide more data, leading to greater understanding of the farm’s assets, thereby enabling components
to be maintained before they reach a critical point of failure. As a result, we have increased the relevant
inspection rates and decreased the ‘matching’ repair rate where appropriate for this study.
There are many other possibilities for RAS impacting on the offshore renewable energy sector that
haven’t been considered in this study. This includes the potential for airborne drones to deliver spare
parts to turbines (for use by technicians), the option for robotics to remain at the offshore site as
residential systems, and RAS undertaking more extensive component repairs.xxix, xxx There are also some
other systems that haven’t been included in this study that may be implemented in the offshore
renewables sector within the next 5-15 years, such as the internal structure inspection robot “iFROG”
(Figure 19) and the residential, sea snake robot “Eelume” (Figure 20).xxxi, xxxii
Figure 18: Rovco's SubSLAM technology deployed on an ROV (Source: ORE Catapult).

PERISCOPE O&M Case Study 10-Mar-2021
Table 6 summarises the robotic and autonomous systems used in this study and how they impact on the
reference O&M activities in the floating wind and wave energy scenarios. In each case, these assumptions
help to form the ‘RAS case’ for the COMPASS simulations.
Figure 19: A monopile cleaning and inspection robot,
iFROG (Source: ORE Catapult).
Figure 20: A residential snake-like robot, Eelume
(Source: Equinor).

PERISCOPE O&M Case Study 10-Mar-2021
Table 6: Summary of the RAS assumptions made for the O&M activities in this study.
Robotic and Autonomous
System
Impact on Floating Wind Reference O&M Activities Impact on Wave Energy
Reference O&M Activities
1 small ASV
2 onshore technicians
Replaces existing logistics and reduces duration for array
cable surveys, export cable surveys and vessel-based
seabed surveys.
Replaces existing logistics
and reduces duration for
array cable surveys and
export cable surveys.
1 large ASV
1 airborne drone
2 onshore technicians
Replaces existing logistics and reduces duration of
external blade inspections.
Displaces the need for planned rope access and camera-
based external blade inspections.
N/A
1 large ASV
1 airborne drone
1 blade-crawler
2 onshore technicians
Replaces existing logistics and reduces duration of blade
LPS inspections.
Replaces existing logistics for light LPS repair.
Replaces existing logistics and reduces duration of internal
blade inspections.
Increases the frequency of planned blade inspections,
which leads to a decrease in frequency of blade repairs.
Replaces existing logistics of planned, minor blade repair.
N/A
1 large ASV
1 AUV
2 onshore technicians
Replaces existing logistics and reduces duration of
inspections of array cables, export cables, dynamic cables,
mooring systems, and subsea sections of platform
structures and substations.
Fully displaces the need for divers for inspections of array
cables, export cables, dynamic cables, mooring systems,
and subsea sections of platform structures and
substations.
Increases the frequency of inspections, which leads to a
decrease in frequency of repairs, of array cables, export
cables, dynamic cables, mooring systems, and subsea
sections of platform structures and substations.
Replaces existing logistics and reduces duration of ROV-
based seabed inspections.
Replaces existing logistics
and reduces duration of
inspections of array cables,
export cables and mooring
systems.
Fully displaces the need for
divers for inspections of array
cables, export cables and
mooring systems.
Increases the frequency of
inspections, which leads to a
decrease in frequency of
repairs, of array cables,
export cables and mooring
systems.

PERISCOPE O&M Case Study 10-Mar-2021
2.5 Inputs and Data Sources
2.5.1 Logistics
In order to calculate the operational expenditure and live emissions of the scenarios simulated by
COMPASS, inputs are required which characterised the vessels involved in the O&M activities. Realistic
vessel charter rates are difficult to obtain due to commercial sensitivities and, in the case of ASVs, lack
of technology readiness. ORE Catapult has leveraged the 4C Offshore ‘Wind Farm Service Vessels’
database to gain a greater understanding of the types of vessels used for offshore wind O&M.xxxiii The
database has been used to corroborate the input assumptions of vessel specifications such as average
speed, operational limits, personnel capacity and fuel consumption. Access to this data also provided
direct confirmation of the subcategories of vessels utilised at specific windfarms for different scenarios
and environmental conditions, not typically disseminated into the public domain. Key trends show how
the vessel supply chain has changed for offshore wind and upcoming adjustments to workboat fleets. A
vessels database from the DTOceanPlus project has also been used, primarily to inform assumptions for
anchor handler vessels and multicats (similar in specification to Crew Transfer Vessels).xxxiv In the
COMPASS tool, demobilisation fees are incurred if a vessel has not been used for 24 hours. In the absence
of real-sea experience with ASVs, we have assumed that their operational weather limits are the same
as similarly sized vessels (i.e. large ASV = CTV, small ASV = tug). This is a conservative assumption as it is
likely that ASVs can operate in more severe weather conditions due to the lack of crew and therefore
reduced H&S risk.
Table 7 shows selected vessel specifications assumed for this study (further details have not been
disclosed as they have been obtained through the 4C Offshore subscription service).
Table 7: Vessel specifications assumed for this study.
Vessel Type Annual
Fee
(£/year)
Mobilisation/
Demobilisation
Fee (£)
Day Rate
(£/day)
Average
Speed
(knots)
Fuel Type Fuel
Consumption
(litres/hour)
Anchor Handler - Large N/A 100,000 24,000 21 Marine Gas Oil 700
Anchor Handler - Small N/A 50,000 12,000 21 Marine Fuel Oil 500
ASV - Large N/A 25,000 15,000 21 Electric 0
ASV - Small N/A 5,000 4,000 42 Electric 0
Multicat N/A 5,000 4,000 42 Marine Fuel Oil 320
Service Operation
Vessel (SOV)
100,000 N/A N/A 11 Marine Gas Oil (+
battery hybrid)
300 (average,
higher when in
transit)
ROV Support Vessel N/A 100,000 24,000 21 Marine Fuel Oil 500

PERISCOPE O&M Case Study 10-Mar-2021
The UK government, via the Department for Business, Energy & Industrial Strategy (BEIS), provides
conversion factors which organisations can use to report on greenhouse gas emissions.xxxv The values for
kilograms of carbon dioxide equivalent (CO2e) emitted per litre of fuel burnt are 3.12204 for Marine Fuel
Oil and 2.7754 for Marine Gas Oil (due to a lower sulphur content). We have assumed that future ASVs
will have fully electric engines and emit zero carbon emissions (although ASVs presently in operation and
under development do use a range of fuels, including diesel and hybrid engines).xxxvi This study only
considers live emissions produced by the vessels and does not include the embodied carbon (e.g. the
carbon emitted in the initial process of creating and refining the fuel).
The COMPASS tool also requires day rates for personnel and robotics. In some instances, personnel will
be full time employees (FTEs) with annual salaries (and overhead costs added). In others, personnel are
treated as contractors, employed as and when they are required and incurring a day rate. We have
assumed that robotic systems are always treated as ‘contractors’ and therefore incur a day rate. Table 8
summarises our assumptions for these day rates (in bands, rather than monetary figures). Note: blade-
crawling robots and airborne drones are classed as ‘personnel’ in this study.
Table 8: Day rate assumptions for personnel and robotics.
Day Rate Band (representative of £/day) Personnel/Robotics Included
1 - Low Labourer
2
Technician
Onshore Technician
Airborne Drone
3
Skilled Technician
Rope Access Technician
Observation ROV
Blade-Crawling Robot
4 ROV Technician
Observation ROV with Payload
5
Authorised Technician
Work-Class ROV
Bottom-Crawling ROV
6 - High
Specialist
AUV
Diver

PERISCOPE O&M Case Study 10-Mar-2021
2.5.2 Failure Rate Data Sources
The failure rates for components in the COMPASS tool were originally built up for bottom-fixed offshore
wind farms using a combination of publicly available sources (particularly Carroll et al. and the System
Performance, Availability and Reliability Trend Analysis (SPARTA) Portfolio Review 2016, see Figure 21)
as well as from the experience of the team at ORE Catapult.xi, xxxvii
Many of these failure rates may be equally applicable to floating wind turbines (e.g. components inside
the nacelle, turbine blades etc.). However, several other components are unique to floating wind
turbines.
There is a lack of actual reliability data from floating wind turbines due, in part, to limited deployment to
date. Therefore, most failure rates are inferred from the oil & gas industry, reliability data from ships, and
other research areas. The synthetic mooring failure rate was estimated from the DTOcean+ project and
was combined from the “Polyester rope”, two “Connectors” and “Other” components’ failure rates,
assuming that the chain part of the mooring does not contribute significantly to its failure rate (as a large
proportion of the chain will lie on the seabed where the tension is significantly lower than in the hanging
section of the mooring).xxxviii This resulted in the failure rate presented in Table 9 which is lower than that
for a chain mooring. This was expected as synthetic ropes are resistant to corrosion and have a much
greater fatigue life (chain mooring failure rate is 0.0025-0.00378).xxxix, xl The anchor failure rate was taken
from a reliability study of drag embedment anchors.xli Structural damage frequency was assumed to be
the same as it is in the oil industry data for mobile platforms.xlii The array cable failure rate was updated
according to the latest research and the distance between turbines. xliii Failure data for dynamic cables
does not yet exist and, whilst cable manufacturers claim the fatigue life of dynamic cables is over 25
Figure 21: Comparison of subsystem monthly repair rates for bottom-fixed offshore wind
turbines (Source: SPARTA Portfolio Review 2016, ORE Catapult).
PERISCOPE O&M Case Study 10-Mar-2021
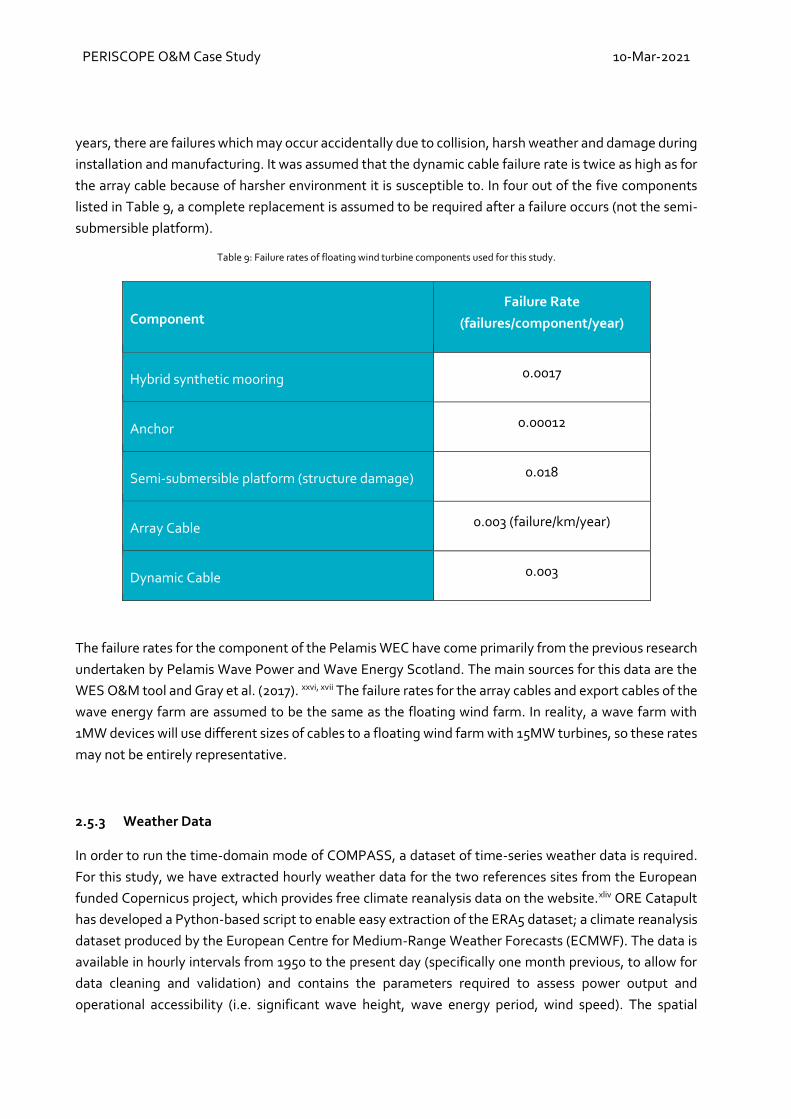
years, there are failures which may occur accidentally due to collision, harsh weather and damage during
installation and manufacturing. It was assumed that the dynamic cable failure rate is twice as high as for
the array cable because of harsher environment it is susceptible to. In four out of the five components
listed in Table 9, a complete replacement is assumed to be required after a failure occurs (not the semi-
submersible platform).
Table 9: Failure rates of floating wind turbine components used for this study.
Component Failure Rate
(failures/component/year)
Hybrid synthetic mooring 0.0017
Anchor 0.00012
Semi-submersible platform (structure damage) 0.018
Array Cable 0.003 (failure/km/year)
Dynamic Cable 0.003
The failure rates for the component of the Pelamis WEC have come primarily from the previous research
undertaken by Pelamis Wave Power and Wave Energy Scotland. The main sources for this data are the
WES O&M tool and Gray et al. (2017). xxvi, xvii The failure rates for the array cables and export cables of the
wave energy farm are assumed to be the same as the floating wind farm. In reality, a wave farm with
1MW devices will use different sizes of cables to a floating wind farm with 15MW turbines, so these rates
may not be entirely representative.
2.5.3 Weather Data
In order to run the time-domain mode of COMPASS, a dataset of time-series weather data is required.
For this study, we have extracted hourly weather data for the two references sites from the European
funded Copernicus project, which provides free climate reanalysis data on the website.xliv ORE Catapult
has developed a Python-based script to enable easy extraction of the ERA5 dataset; a climate reanalysis
dataset produced by the European Centre for Medium-Range Weather Forecasts (ECMWF). The data is
available in hourly intervals from 1950 to the present day (specifically one month previous, to allow for
data cleaning and validation) and contains the parameters required to assess power output and
operational accessibility (i.e. significant wave height, wave energy period, wind speed). The spatial

PERISCOPE O&M Case Study 10-Mar-2021
resolution of the ERA5 data is 0.5 decimal degrees, meaning that data can only be extracted at certain
points approximately 50 km apart. The data points selected for this study are shown in Figure 22,
alongside the approximate locations of the wave energy farm and floating wind site. The dataset runs
from 2004 to 2018 for the Farr Point site (wave energy farm) and from 1990 to 2019 for the floating wind
site. No further modifications to the data, such as synthetic time-series generation using Markov Chains,
have been carried out for this study.xlv
Figure 22: Map of the wave and floating wind farms with respect to the weather datapoints.

PERISCOPE O&M Case Study 10-Mar-2021
3 Results
The time-domain mode of the COMPASS tool has been used for the economic and carbon comparative
assessments in this study due to its enhanced fidelity over the deterministic version (i.e. includes weather
windows and logistical availabilities). It has also been used to obtain the number of personnel-to-turbine
transfers for the risk comparative assessment of the floating wind scenarios.
Ten simulations have been carried out using the COMPASS tool for each scenario and the mean values
from these simulations are presented, normalised to the relevant base case. The fact that component
failures are simulated using a Monte Carlo analysis means that no two runs will ever be exactly the same.
Therefore, 95% confidence bounds have been applied to the results, as presented in Gray (2017).xlvi Using
the following equation means it can then be said with 95% confidence that the true mean of the results
lies within those boundaries.
95% confidence bounds = 𝑥 ±z ∗ 𝜎
√n
Where x = mean, z-value = 1.96 (for 95% confidence), σ = standard deviation, n = population size.
3.1 Economic Comparative Assessment
The fixed operational costs of the floating wind and wave farms modelled in this study include
estimations of training budgets, personal protection equipment (PPE), onshore facilities (i.e. office rent,
electricity usage etc.), marine coordination, seabed leasing, and operational insurance. These fixed costs
have not been presented in this study as it is assumed that RAS has no impact. However, it is possible
that some of this fixed OPEX will be affected by the introduction of RAS and this should be incorporated
into further work. For example, with an increased level of autonomous robots active at the site, there
may be a smaller training budget as fewer people would need to undergo sea survival training.
3.1.1 Floating Wind
The floating wind modelling undertaken in this study indicates that RAS can reduce the operational
expenditure (OPEX) of the reference wind farm. This is achieved by decreasing the average annual costs
of utilising vessels and personnel. Figure 23 shows that annual charter costs for vessels decrease from
£53.2/kW in the base case to £51.2/kW in the RAS case, equating to a 3.7% reduction (Figure 24).
Personnel costs reduce from £4.7/kW to £3.9/kW (i.e. a 17.7% decrease) when blade-crawling robots and
airborne drones are used for some offshore O&M tasks, with onshore technicians coordinating and
interpreting the data. In both floating wind scenarios, personnel costs are marginal compared to vessel
fees, highlighting the sensitivity of OPEX to vessel usage. The 95% confidence intervals are very small
for the results, which indicates that the variable nature of the simulations has limited impact on the
economic outputs.

PERISCOPE O&M Case Study 10-Mar-2021
Figure 23: Comparative assessment of operational expenditure of vessels and personnel for the two floating wind cases.
Figure 24: Comparative assessment of OPEX of vessels and personnel for the two floating wind cases, normalised to the maximum.
Comparison to other data sources
The floating wind sector is still at an early stage of development, with demonstration and pre-commercial
projects currently operating and being constructed. Therefore, any annual OPEX estimations of the full
lifecycle of a commercial-scale floating wind farm come from other modelling studies. A 2014 study by
Myhr et al. calculated that the total OPEX for a floating wind farm would cost €131/kW (i.e. £114/kW at
an exchange rate of €1.15 to £1) and identified vessel rates as the primary sensitivity in the modelling.xlvii
The Carbon Trust published a report in 2015 which suggested that floating wind farms would incur annual
OPEX of £200/kW at the prototype stage, £140/kW at pre-commercial level, and £90/kW when full

PERISCOPE O&M Case Study 10-Mar-2021
commercial scale is achieved.xlviii A more recent study by the US National Renewable Energy Laboratory
(NREL) suggests much lower OPEX values for floating wind, ranging from $84/kW (i.e. £59/kW at $1.42
to £1) down to $38/kW (i.e. £27/kW) as deployment increases.xlix This large range in estimations highlights
the uncertainty involved in modelling an early-stage technology such as floating wind. For further
reference, a “Guide to an offshore wind farm” (published on behalf of ORE Catapult and the Crown
Estate) estimated OPEX of a bottom-fixed offshore wind farm to be approximately £75/kW.xx Our
modelling results in this study indicate that the reference floating wind farm would incur £57.9/kW for
vessels and personnel. This does not take other elements of OPEX into account, such as consumables,
equipment, spare parts or operational insurance.
3.1.2 Wave Energy
The results of the wave energy scenarios show that RAS can decrease the OPEX of the farm by reducing
the annual costs of vessels and personnel. Figure 25 highlights that annual charter costs for vessels
reduces from £88/kW to £72/kW when ASVs are utilised, which equates to a 18% decrease (Figure 26).
However, it should be noted that the 95% confidence intervals (i.e. error bars) for the vessel costs are
quite close to overlapping across the two scenarios. This is due to there being more variability in the
vessel cost results, compared to personnel, as most vessels are chartered on an ad hoc basis with large
fees and are therefore more dependent on the randomised nature of the simulations. The 95%
confidence intervals are also much wider for vessel costs in the wave energy scenario than in the floating
wind case, due to the types of vessels required for some tasks. For example, most O&M tasks in the wave
energy case are undertaken offsite after towing the WEC with a low-cost multicat. However, there are
some activities that happen onsite using much higher-cost vessels which have lower frequencies (i.e.
occur less often), meaning that some simulations will show these higher costs and others won’t.
Personnel costs decrease from £32/kW to £28/kW when robotics (offshore) and onshore technicians are
used for many O&M activities (i.e. 13% reduction).
Figure 25: Comparative assessment of operational expenditure of vessels and personnel for the two wave energy cases.

PERISCOPE O&M Case Study 10-Mar-2021
Figure 26: Comparative assessment of OPEX of vessels and personnel for the two wave energy cases, normalised to the maximum.
Comparison to other data sources
Given the nascent stage of the wave energy sector, there are very few data sources with which to verify
the OPEX estimated by the COMPASS tool. In Gray (2017), the base case of the same wave energy farm
assessed in this study was calculated to incur OPEX of approximately £1.09m.xlvi This equates to £109/kW
for the 10 MW wave farm. This calculation does not include O&M activities on mooring systems and
subsea cabling, but it does include the cost of spare parts and onsite facilities, which haven’t been
presented in the OPEX results in this study. Another study by Tecnalia indicates that annual OPEX per
WEC would be approximately €37.26k-€42.83k, although the capacity of the modelled device is not
specified.l Our model results show an OPEX of £120/kW for vessel and personnel costs (or £120k per
device), which is higher than previous estimates, especially as our results do not include the cost of spare
parts and onsite facilities.
3.2 Emissions Comparative Assessment
The results presented here are the emissions produced by vessels (i.e. from burning fuel) during the O&M
phase of each scenario. These figures assume no changes to fuel type in other vessels (i.e. conventional
vessels may be fitted with the capability to use low or zero emission fuel in the future), nor does the
modelling include details such as varying consumption rates at different stages of an operation. An in-
depth lifecycle assessment (LCA) would be needed to analyse further details of carbon emissions such as
embodied carbon of vessels, spare parts, infrastructure changes, and the electricity needed to charge
ASVs.

PERISCOPE O&M Case Study 10-Mar-2021
3.2.1 Floating Wind
The floating wind scenario results indicate that the annual emissions of O&M vessels at the farm can be
decreased with the implementation of RAS. Figure 27 indicates that annual O&M vessel emissions drop
from approximately 11.7m kg (or 11,700 tonnes) of carbon dioxide equivalent (CO2e) in the base case to
9.9m kg (i.e. 9,900 tonnes) in the RAS case. This represents a 15.7% decrease in annual emissions (Figure
28).
Figure 27: Comparative assessment of vessel emissions for the two floating wind cases.
Figure 28: Comparative assessment of vessel emissions for the two floating wind cases, normalised to the maximum.
Annual emissions can also be presented as ‘grams of CO2e per kilowatt hour’ (kWh) of energy produced.
The COMPASS tool calculates annual energy production (AEP) of turbines when configured for bottom-

PERISCOPE O&M Case Study 10-Mar-2021
fixed or floating offshore wind farms. By this metric, the annual emissions from O&M vessels reduce from
3.4 gCO2e/kWh in the base case to 2.8 gCO2e/kWh in the RAS case.
Figure 29: Comparative assessment of vessel emissions for the two floating wind cases, per unit of energy generated by the farm.
Comparison to other data sources
Modelling work presented in a recent paper by Gray identified that a SOV operating at a large, bottom-
fixed wind farm, located far from shore, might produce 2.1 tonnes of CO2e per GWh of energy generated
by the wind farm per year.li The results in this study are higher, however, it is worth noting that the figures
here include emissions from all O&M vessels at the farm, not just the SOV. As a further point of reference,
Ørsted, one of the world-leading developers of offshore wind farms, publish high-level emissions figures
into the public domain. In 2019, Ørsted’s sustainability report stated that 42 kt of CO2e were produced
during crew transport and service vessel operations.lii This figure, combined with the 12,000 GWh of
energy produced by Ørsted’s offshore wind farms in 2019, results in estimated annual O&M vessel
emissions of 3.5 tonnes of CO2e per GWh of energy generated.liii
3.2.2 Wave Energy
The results of the wave energy scenarios show that the annual emissions produced by the farm’s O&M
vessels can be reduced by utilising zero-carbon electric ASVs for some activities. Figure 30 indicates that
annual vessel emissions reduce from 457 tonnes of CO2e to 269 tonnes when ASVs are utilised, which
equates to a 41% decrease (Figure 31).

PERISCOPE O&M Case Study 10-Mar-2021
Figure 30: Comparative assessment of vessel emissions for the two wave energy cases.
Figure 31: Comparative assessment of vessel emissions for the two wave energy cases, normalised to the maximum.
Annual energy production of the Pelamis WECs has not been calculated by the COMPASS tool. However,
Thomson et al. (2019) state that each of the Pelamis devices will generate 2.97 GWh per year.liv This
equates to 29.7 GWh per year for the ten-device farm in this study. The results of the modelling indicate
that emissions by this metric will reduce from 15.4 gCO2e/kWh in the base case to 9.1 gCO2e/kWh in the
RAS case.

PERISCOPE O&M Case Study 10-Mar-2021
Figure 32: Comparative assessment of vessel emissions for the two wave energy cases, per unit of energy generated by the farm.
Comparison to other data sources
Perhaps the most comprehensive work to date on understanding emissions from wave energy devices
has been undertaken by Dr Camilla Thomson at the University of Edinburgh. A 2011 paper identified that
the operations and maintenance phase of the Pelamis device would incur 7 gCO2/kWh, which includes
embodied carbon.lv Clearly, our estimation of 15.4 gCO2e/kWh for the base case, which only include
emissions from burning fuel in vessels, is much higher than this previous work. However, it should be
noted that the 2011 paper states that ‘the device itself has very few operational requirements’, which
contradicts the subsequent data released by Wave Energy Scotland (used for this study).
3.3 Risk Comparative Assessment
Working in a dangerous offshore environment brings inherent Health and Safety (H&S) risks. The
offshore wind industry still has significant improvements to make in terms of H&S, with 2019 recording
the highest lost-time-injury-frequency in recent years (Figure 33). Many of the high potential incidents
for personnel in the offshore wind sector have occurred during working at height, routine maintenance,
and turbine access/egress, as reported by G+, the global health and safety organisation for the offshore
wind industry (Figure 34).lvi It is clear that any technology which reduces the amount of time people need
to spend in the dangerous offshore environment will have benefits in terms of decreasing the number of
high-potential H&S incidents. With increasing levels of deployment expected in floating wind and wave
energy over coming years, it is vital that H&S is made a key focus point of future offshore developments.

PERISCOPE O&M Case Study 10-Mar-2021
Figure 33: H&S record of global offshore wind projects in the G+ programme, 2014-2019 (Source: G+).
Figure 34: 2019 high potential incidents in offshore wind - top 10 work process breakdown (Source: G+).
3.3.1 Floating Wind
Results of the floating wind scenarios indicate a shift of personnel from dangerous offshore activities to
coordinating operations from the safety of an onshore base when RAS are implemented. The base case
showed a total of 1,508 hours spent offshore annual by personnel, compared to 906 hours in the RAS
case (i.e. a reduction of 39.9%). This reduction can be seen for a selected group of personnel types in
Figure 35. The darker colours in the graph indicate higher risk classifications. The results show that
offshore working time for ROV technicians (who would be onboard the ROV support vessel) is reduced
from 146 hours/year in the base case to 4 hours/year when those tasks are undertaken by AUVs,
supported by onshore-based technicians. The use of divers (regarded as one of the most high-risk
activities) is almost entirely removed in the RAS case.

PERISCOPE O&M Case Study 10-Mar-2021
Figure 35: Comparison of the average time spent offshore by selected personnel types for the two floating wind cases, where darker colours
represent high risk classifications.
The COMPASS tool can also be used to identify the number of turbine transfers undertaken by personnel.
This action forms the basis of the G+ ‘access/egress’ and ‘transfer to/from vessel’ work processes
highlighted in Figure 34. The modelled number of personnel-to-turbine transfers per year (on average) is
presented in Figure 36 for those personnel types that would undertake such actions. The total number of
personnel-to-turbine transfers per year decreases from 2,657 in the base case to 2,587 in the RAS case
(i.e. a 2.6% reduction). For the 66-turbine farm in this study, this equates to a reduction of 1.05 personnel
transfers per turbine per year. Almost all of this reduction comes from fewer rope access technicians (a
20% reduction, as shown in Figure 37) needing to transfer onto turbines (as some of their work is replaced
by RAS). This is an important point to note given that that these activities involve working at height,
which is second in the top ten high-potential incidents of 2019.
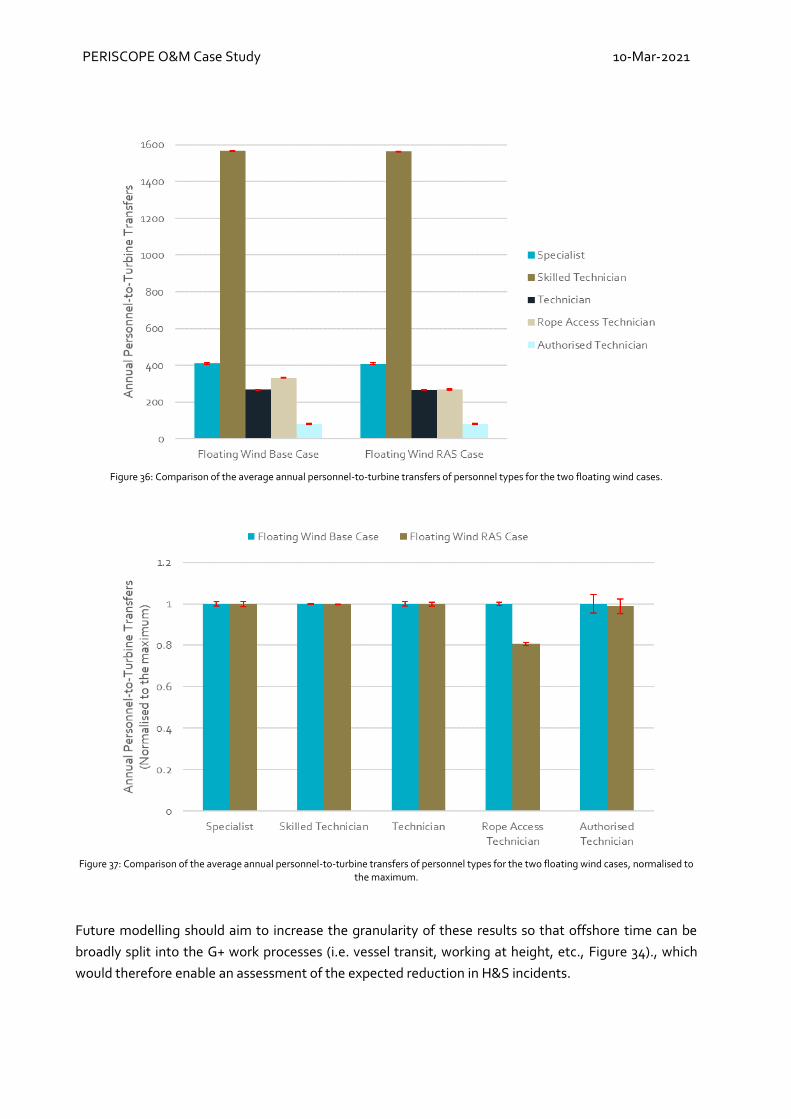
PERISCOPE O&M Case Study 10-Mar-2021
Figure 36: Comparison of the average annual personnel-to-turbine transfers of personnel types for the two floating wind cases.
Figure 37: Comparison of the average annual personnel-to-turbine transfers of personnel types for the two floating wind cases, normalised to
the maximum.
Future modelling should aim to increase the granularity of these results so that offshore time can be
broadly split into the G+ work processes (i.e. vessel transit, working at height, etc., Figure 34)., which
would therefore enable an assessment of the expected reduction in H&S incidents.

PERISCOPE O&M Case Study 10-Mar-2021
Comparison to other data sources
The SPARTA Portfolio Review from 2018/2019 identified that offshore wind farms in that period had
approximately 6.81 personnel transfers per turbine per month.lvii In the most recent SPARTA update, this
number decreased to 6.49 personnel transfers per turbine per month, confirming the downward trend in
recent years (see Figure 38).lviii We would expect the downward trend to continue as larger offshore wind
farms are constructed and operational strategies improve. For the floating wind farm in this study, 6.49
personnel transfers per turbine per month would equate to 5,140 personnel-to-turbine transfers per year.
Despite the expected downward trend, this value is almost twice as high as the modelled figure for the
base case (2,657), so further investigation of this parameter is recommended in future studies.
Figure 38: Average number of personnel transfers per turbine per month in the SPARTA portfolio across multiple years (Source: SPARTA
2021).
3.3.2 Wave Energy
The modelling results of the wave energy scenarios also show a shift of personnel from dangerous
offshore activities when RAS are utilised. The base case showed a total of 318 hours spent offshore annual
by personnel, compared to 152 hours in the RAS case (i.e. a reduction of 52.3%).The average annual hours
spent offshore by selected personnel types are presented in Figure 39, where the darker colours indicate
higher risk classifications. This highlights that the time required offshore by divers, ROV technicians and
mooring/cable specialists during O&M of the wave energy farm is completely removed in the RAS case,
with those activities being undertaken by AUVs deployed from ASVs, supported by onshore-based
technicians.

PERISCOPE O&M Case Study 10-Mar-2021
Figure 39: Comparison of the average time spent offshore by selected personnel types for the two wave energy cases, where darker colours
represent high risk classifications.
Comparison to other data sources
There is no available data, to the authors’ knowledge at the time of writing, that assesses offshore
working time for wave energy devices.
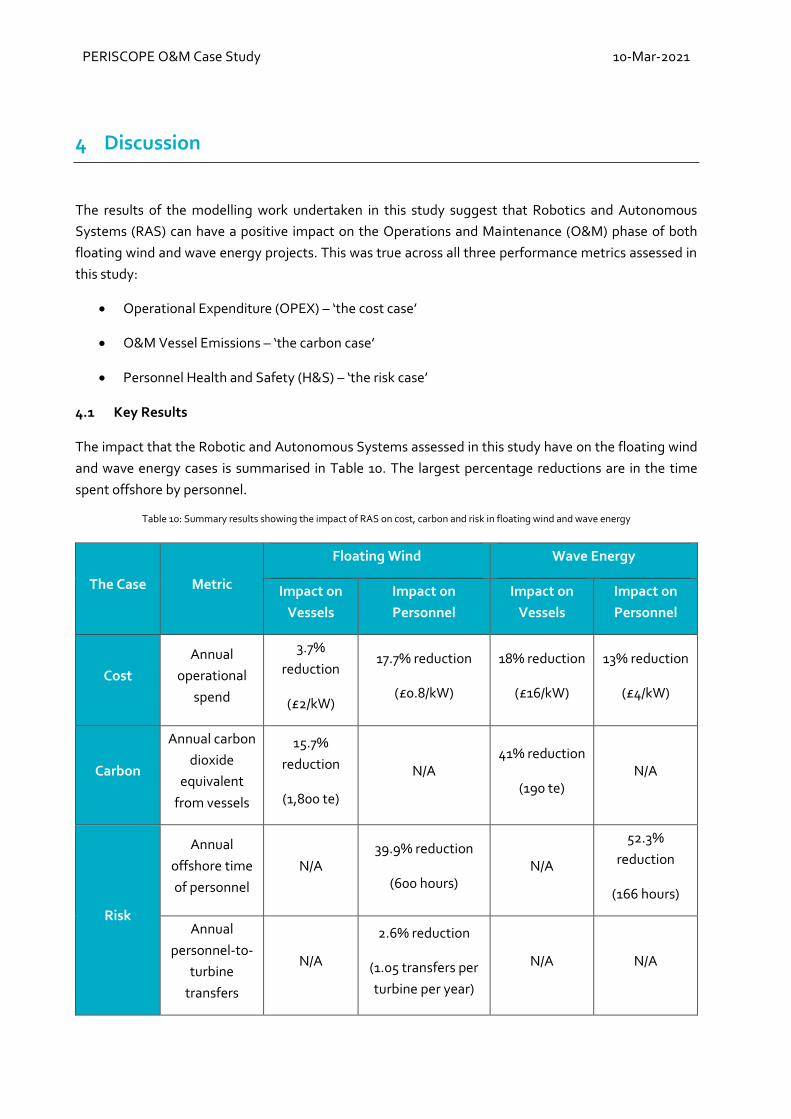
PERISCOPE O&M Case Study 10-Mar-2021
4 Discussion
The results of the modelling work undertaken in this study suggest that Robotics and Autonomous
Systems (RAS) can have a positive impact on the Operations and Maintenance (O&M) phase of both
floating wind and wave energy projects. This was true across all three performance metrics assessed in
this study:
• Operational Expenditure (OPEX) – ‘the cost case’
• O&M Vessel Emissions – ‘the carbon case’
• Personnel Health and Safety (H&S) – ‘the risk case’
4.1 Key Results
The impact that the Robotic and Autonomous Systems assessed in this study have on the floating wind
and wave energy cases is summarised in Table 10. The largest percentage reductions are in the time
spent offshore by personnel.
Table 10: Summary results showing the impact of RAS on cost, carbon and risk in floating wind and wave energy
The Case Metric
Floating Wind Wave Energy
Impact on
Vessels
Impact on
Personnel
Impact on
Vessels
Impact on
Personnel
Cost
Annual
operational
spend
3.7%
reduction
(£2/kW)
17.7% reduction
(£0.8/kW)
18% reduction
(£16/kW)
13% reduction
(£4/kW)
Carbon
Annual carbon
dioxide
equivalent
from vessels
15.7%
reduction
(1,800 te)
N/A 41% reduction
(190 te) N/A
Risk
Annual
offshore time
of personnel
N/A 39.9% reduction
(600 hours) N/A
52.3%
reduction
(166 hours)
Annual
personnel-to-
turbine
transfers
N/A
2.6% reduction
(1.05 transfers per
turbine per year)
N/A N/A

PERISCOPE O&M Case Study 10-Mar-2021
4.2 Methodology Constraints
The modelling work presented in this report was carried out using ORE Catapult’s in-house COMPASS
(Combined Operations and Maintenance, People, Assets and Systems Simulation) simulation tool. The
tool is configured for bottom-fixed offshore wind farms primarily but was adapted for this study to model
floating wind and wave energy projects. COMPASS has not yet been validated against actual ORE
installations.
In this study, one site off the North East coast of Scotland was considered for floating wind, with a
separate site assessed for wave energy off the North coast of Scotland. In both cases, the scenarios are
hypothetical and are not intended to be representative of any projects under development or in
construction. Floating wind is at a much more advanced stage of development than wave energy, with
pre-commercial projects under construction in UK and European waters. Nevertheless, neither floating
wind nor wave energy has seen any projects operating for a significant amount of time. Therefore, the
assumptions used in this modelling work will need refinement as further experience is gained and more
knowledge becomes available.
Another focus area of the PERISCOPE project is tidal energy, which has not been addressed in this study.
Tidal energy is also at an early stage of development but is expected to contribute to the UK and
European energy mix over coming years. Some tidal energy designs have floating substructures, similar
to the wave energy converter assessed in this study. Therefore, the utilisation of RAS and the associated
cost, carbon and risk benefits for these devices would likely be similar to the results of the wave energy
scenario in this study. Bottom-fixed tidal energy devices (i.e. entirely subsea) could perhaps benefit even
more from RAS. For example, Autonomous Underwater Vehicles (AUVs) could carry out subsea blade
inspections. Further development of the COMPASS tool would be required to assess the O&M phase of
tidal energy farms.
This modelling work has focussed on several different types of RAS, with the changes to inputs
(compared to the reference case) based primarily on engineering judgement. A better assessment of a
technology can be made when it is analysed in isolation, rather than as part of a multi-system modelling
approach. For example, if a RAS was being tested at a particular offshore wind farm, then the COMPASS
tool could be configured for that site, with the inputs refined given the experiences of that particular
technology. In any O&M simulation tool, refinement of the inputs (e.g. vessel charter rates) is key to
obtain realistic estimations of OPEX and other Key Performance Indicators (KPIs).
4.3 Recommendations
4.3.1 Improvements to Inputs
The best way to improve inputs to O&M simulation tools is with increased testing and real-sea
experience. As the floating wind and wave energy sectors advance, albeit at different paces, more
information will become available which we can use to improve estimations of project KPIs. For example,
an increased knowledge of component failure rates will improve our understanding of

PERISCOPE O&M Case Study 10-Mar-2021
corrective/unplanned maintenance. In the meantime, testing in real-world conditions is of huge
importance. This is particularly true of RAS, where inputs to models, such as inspection time compared
to current methods, or differences in operational weather limits, can be refined and understood. Two key
recommendations to improve inputs to O&M models are as follows:
• International collaboration is needed on compiling failure rates of floating-specific components
(e.g. mooring lines, dynamic cables).
• Dedicated RAS testing facilities are necessary to de-risk the technologies and enable the next
step of real-sea demonstration at commercial offshore renewable energy projects.
4.3.2 Further Modelling Suggestions
Several suggestions for future O&M modelling have been identified in this study. These include:
• Validate O&M models against real-world projects or, if that is not possible, verify against other
tools.
• Analyse tow-to-port O&M strategies for floating wind.
• Incorporate vessel emissions and H&S risk into models as standard, which should include aligning
H&S classifications with organisations like G+.
• A better understanding of vessel charter rates would be beneficial.
• Undertake detailed assessment, with refined assumptions (including operational weather limits),
of one technology or RAS at a time.
• Run many simulations of the same scenario to reduce percentage error.
PERISCOPE O&M Case Study 10-Mar-2021
List of Figures
Figure 1: Expected global growth rate for installed capacity of floating wind (Source: ORE Catapult). ... 9 Figure 2: Low growth scenario for wave energy (Source: Ocean Energy Europe). .................................. 9 Figure 3: High growth scenario for wave energy (Source: Ocean Energy Europe). ................................. 10 Figure 4: Flow diagrams explaining two modes in COMPASS, input required and output from both modes. .................................................................................................................................................. 14 Figure 5: Location and layout of the hypothetical floating wind farm used for this study. ..................... 16 Figure 6: Layout of the hypothetical floating wind farm used for this study, including cable topology and substation positions........................................................................................................................ 17 Figure 7: The Pelamis wave energy converter (Source: EMEC). ............................................................. 18 Figure 8: Location and layout of the hypothetical wave energy farm used for this study, including cable topology. ............................................................................................................................................... 19 Figure 9: A Pelamis device being towed for installation at EMEC in 2012 (Source: Gray et al. 2017). ..... 19 Figure 10 – Rope access technician examining a wind turbine blade (Source: Orbis Energy). ................ 21 Figure 11: Assumed average annual duration of floating wind O&M activities in each subsystem (per turbine, unless stated otherwise. Farm surveys omitted). .................................................................... 24 Figure 12: Assumed average annual duration of WEC O&M activities in each subsystem (per WEC, unless stated otherwise). ...................................................................................................................... 26 Figure 13: A small ASV suitable for bathymetric and hydrographic surveying (Source: ORE Catapult). . 27 Figure 14: An example of a large ASV suitable for deployment of other robotic systems (Source: OceanInfinity). ..................................................................................................................................... 28 Figure 15: A blade crawling robot, developed by BladeBug (Source: ORE Catapult). ............................ 28 Figure 16: SkySpecs' autonomous airborne drone (Source: roboticsandautomationnews.com). .......... 29 Figure 17: Modus' seabed intervention AUV (Source: ORE Catapult). ................................................... 29 Figure 18: Rovco's SubSLAM technology deployed on an ROV (Source: ORE Catapult). ....................... 30 Figure 19: A monopile cleaning and inspection robot, iFROG (Source: ORE Catapult). .......................... 31 Figure 20: A residential snake-like robot, Eelume (Source: Equinor). ..................................................... 31 Figure 21: Comparison of subsystem monthly repair rates for bottom-fixed offshore wind turbines (Source: SPARTA Portfolio Review 2016, ORE Catapult). ...................................................................... 35 Figure 22: Map of the wave and floating wind farms with respect to the weather datapoints. .............. 37 Figure 23: Comparative assessment of operational expenditure of vessels and personnel for the two floating wind cases. ............................................................................................................................... 39 Figure 24: Comparative assessment of OPEX of vessels and personnel for the two floating wind cases, normalised to the maximum. ................................................................................................................ 39 Figure 25: Comparative assessment of operational expenditure of vessels and personnel for the two wave energy cases. ............................................................................................................................... 40 Figure 26: Comparative assessment of OPEX of vessels and personnel for the two wave energy cases, normalised to the maximum. ................................................................................................................ 41 Figure 27: Comparative assessment of vessel emissions for the two floating wind cases. ..................... 42 Figure 28: Comparative assessment of vessel emissions for the two floating wind cases, normalised to the maximum. ...................................................................................................................................... 42 Figure 29: Comparative assessment of vessel emissions for the two floating wind cases, per unit of energy generated by the farm. .............................................................................................................. 43 Figure 30: Comparative assessment of vessel emissions for the two wave energy cases. ..................... 44 Figure 31: Comparative assessment of vessel emissions for the two wave energy cases, normalised to the maximum. ...................................................................................................................................... 44

PERISCOPE O&M Case Study 10-Mar-2021
Figure 32: Comparative assessment of vessel emissions for the two wave energy cases, per unit of energy generated by the farm. .............................................................................................................. 45 Figure 33: H&S record of global offshore wind projects in the G+ programme, 2014-2019 (Source: G+). ............................................................................................................................................................. 46 Figure 34: 2019 high potential incidents in offshore wind - top 10 work process breakdown (Source: G+). ............................................................................................................................................................. 46 Figure 35: Comparison of the average time spent offshore by selected personnel types for the two floating wind cases, where darker colours represent high risk classifications. ....................................... 47 Figure 36: Comparison of the average annual personnel-to-turbine transfers of personnel types for the two floating wind cases. ....................................................................................................................... 48 Figure 37: Average number of personnel transfers per turbine per month in the SPARTA portfolio across multiple years (Source: SPARTA 2021). ................................................................................................ 49 Figure 38: Comparison of the average time spent offshore by selected personnel types for the two wave energy cases, where darker colours represent high risk classifications. ................................................. 50
List of Tables
Table 1: RDSPP® designation concept example (Wind Turbine Yaw Drive). .......................................... 11 Table 2: Activity parameters and descriptions. ...................................................................................... 12 Table 3: Risk classification matrix. ......................................................................................................... 13 Table 4: High-level details for the hypothetical floating wind farm analysed in this study. .................... 17 Table 5: High-level details for the wave energy farm analysed in this study. ......................................... 20 Table 6: Summary of the RAS assumptions made for the O&M activities in this study. ......................... 32 Table 7: Vessel specifications assumed for this study. ........................................................................... 33 Table 8: Day rate assumptions for personnel and robotics. ................................................................... 34 Table 9: Failure rates and replacement costs for floating wind turbine components. ............................ 36

PERISCOPE O&M Case Study 10-Mar-2021
References
i ORE Catapult (2020). The robots leading the renewable energy revolution. Available from: https://ore.catapult.org.uk/stories/the-robots-leading-the-renewable-energy-revolution/. ii Interreg North Sea Region (2020). Welcome to PERISCOPE's webspace. Available from: https://northsearegion.eu/periscope/. iii UK Government (2019). UK becomes first major economy to pass net zero emissions law. Available from: https://www.gov.uk/government/news/uk-becomes-first-major-economy-to-pass-net-zero-emissions-law. iv UK Government (2020). New plans to make UK world leader in green energy. Available from: https://www.gov.uk/government/news/new-plans-to-make-uk-world-leader-in-green-energy. v ORE Catapult (2021). Floating Offshore Wind: Cost Reduction Pathways to Subsidy Free. Floating Offshore Wind Centre of Excellence. Available from: https://ore.catapult.org.uk/wp-content/uploads/2021/01/FOW-Cost-Reduction-Pathways-to-Subsidy-Free-report-.pdf. vi WindEurope (2020). Business Intelligence, Floating Offshore Wind. Available from (sign in required): https://windeurope.org/data-and-analysis/product/floating-offshore-wind/. vii International Renewable Energy Agency (2020). Fostering a blue economy: Offshore renewable energy. Available from: https://www.irena.org/publications/2020/Dec/Fostering-a-blue-economy-Offshore-renewable-energy. viii WindEurope (2020). Offshore Wind in Europe. Key trends and statistics 2019. Available from: https://windeurope.org/data-and-analysis/product/offshore-wind-in-europe-key-trends-and-statistics-2019/. ix Ocean Energy Europe (2020). 2030 Ocean Energy Vision Industry analysis of future deployments, costs and supply chains. Available from: https://www.oceanenergy-europe.eu/wp-content/uploads/2020/10/OEE_2030_Ocean_Energy_Vision.pdf. x VGB PowerTech (2014). RDS-PP® Application Guideline Part 32: Wind Power Plants (VGB-S-823-32-2014-03-EN-D). xi Carroll, J., McDonald, A. and McMillan, D. (2015). Failure rate, repair time and unscheduled O&M cost analysis of offshore wind turbines. Wind Energy, 19(6), pp.1107-1119. xii Thies, P. (2012). Advancing Reliability Information for Wave Energy Converters. Ph.D. University of Exeter. Available from: https://ore.exeter.ac.uk/repository/handle/10036/4053. xiii Scottish Government (2020). Sectoral marine plan for offshore wind energy. Available from: https://www.gov.scot/publications/sectoral-marine-plan-offshore-wind-energy/. xiv Crown Estate Scotland (2020). Ports for offshore wind: a review of the net-zero opportunity for ports in Scotland. Available from: https://www.arup.com/perspectives/publications/research/section/ports-for-offshore-wind-a-review-of-the-net-zero-opportunity-for-ports-in-scotland. xv Offshore Wind Innovation Hub (2020). Floating Wind: Cost modelling of major repair strategies. Available from: https://offshorewindinnovationhub.com/industry_insight/floating-wind-cost-modelling-of-major-repair-strategies/. xvi EMEC (2021). Pelamis Wave Power. Available from: http://www.emec.org.uk/about-us/wave-clients/pelamis-wave-power/. xvii Gray, A., Dickens, B., Bruce, T., Ashton, I. & Johanning, L. (2017). Reliability and O &M sensitivity analysis as a consequence of site-specific characteristics for wave energy converters. Ocean Engineering. 141, pp. 493-511. Available from: https://www.sciencedirect.com/science/article/pii/S0029801817303359. xviii Carbon Trust, “Floating Wind Joint Industry Project - Phase II summary report,” 2020. Available from https://www.carbontrust.com/resources/floating-wind-joint-industry-project-phase-2-summary-report. xix D. Cevasco, S. Koukoura, and A. J. Kolios, “Reliability, availability, maintainability data review for the identification of trends in offshore wind energy applications,” Renew. Sustain. Energy Rev., vol. 136, no. September 2020, p. 110414, 2021. Available from 10.1016/j.rser.2020.110414 xx BVG Associates (2019). Guide to an offshore wind farm. Updated and extended. Available from: https://ore.catapult.org.uk/?industryreports=guide-to-an-offshore-wind-farm. xxi Kai-Tung, M. et al. (2019) Chapter 12 - Inspection and monitoring, Mooring System Engineering for Offshore Structures, Gulf Professional Publishing, Pages 233-253, ISBN 9780128185513, Available from: https://www.sciencedirect.com/science/article/pii/B9780128185513000120.

PERISCOPE O&M Case Study 10-Mar-2021
xxii Kvarts, T., Lesur, F. (2015). CIGRE TB 610 - Offshore generation cable connections. CIGRE. Working Group B1.40. pp. 144-145. Available from: http://www.e-cigre.org/publication/610-offshore-generation-cable-connections. xxiii Borg, M. et al. (2020) Technical Definition of the TetraSpar Demonstrator Floating Wind Turbine Foundation. Energies. [Online] 13 (18), 4911. Available from: http://dx.doi.org/10.3390/en13184911. xxiv Rhodri, J., Marc, C. R. (2015) Floating Offshore Wind: Market and Technology Review, Carbon Trust, Available from: https://www.carbontrust.com/resources/floating-offshore-wind-market-technology-review. xxv Corewind (2020) D3.1 Review of the state of the art of dynamic cable system design. Available from: https://corewind.eu/wp-content/uploads/files/publications/COREWIND-D3.1-Review-of-the-state-of-the-art-of-dynamic-cable-system-design.pdf. xxvi Wave Energy Scotland (2021). O&M Model - Pelamis P2 Case study. Available from (sign in required): https://library.waveenergyscotland.co.uk/other-activities/design-tools-and-information/tools/om-simulation-tool/om-model-pelamis-p2-case-study/. xxvii EchoBlue Ltd. (2021). Autonomous and Unmanned Surface Vessels for Marine Monitoring, Surveying and Rescue. Available from: https://www.unmannedsystemstechnology.com/company/oceanalpha/. xxviii ORE Catapult (2019). Multi-Platform Inspection, Maintenance and Repair in Extreme Environments (MIMRee). Available from: https://ore.catapult.org.uk/stories/mimree/. xxix Equinor (2020). Equinor completes world’s first logistics operation with a drone to an offshore installation. Available from: https://www.equinor.com/en/news/20200828-drone-transport-troll.html. xxx OffshoreWind.Biz (2021). Fugro Developing Offshore Drone Base for Wind Farm Maintenance. Available from: https://www.offshorewind.biz/2021/02/03/fugro-developing-offshore-drone-base-for-wind-farm-maintenance/?utm_source=offshorewind&utm_medium=email&utm_campaign=newsletter_2021-02-04. xxxi ORE Catapult (2020). Amphibious iFROG robot leaps ahead in ability to inspect and maintain offshore assets. Available from: https://ore.catapult.org.uk/press-releases/ifrog-leaps-ahead-in-ability-to-inspect-and-maintain-offshore-assets/. xxxii Equinor (2021). Eelume — the snake robot that’s a caretaker on the seabed. Available from: https://www.equinor.com/en/magazine/here-are-six-of-the-coolest-offshore-robots.html. xxxiii 4C Offshore (2021). Subscribe to our Wind Farm Service Vessel Information. Available from: https://www.4coffshore.com/subscriptions/wind-farm-service-vessels/. xxxiv DTOcean+ (2020). Deliverable D5.7 - Logistics and Marine Operations Tools - Alpha Version. Available from: https://www.dtoceanplus.eu/Publications/Deliverables/Deliverable-D5.7-Logistics-and-Marine-Operations-Tools-alpha-version. xxxv UK Government (2020). Greenhouse gas reporting: conversion factors 2020. Available from: https://www.gov.uk/government/publications/greenhouse-gas-reporting-conversion-factors-2020. xxxvi XOcean (2021). XO-450 Unmanned Surface Vessel. Technical specification. Available from: https://xocean.com/technology/. xxxvii SPARTA (2017) SPARTA Portfolio Review 2016. Available from: https://ore.catapult.org.uk/wp-content/uploads/2018/02/SPARTAbrochure_20March-1.pdf. xxxviii DTOcean+ (2015). Deliverable 4.6 - Framework for the prediction of the reliability, economic and environmental criteria and assessment methodologies for Moorings and Foundations. Available from: https://www.dtoceanplus.eu/content/download/2525/file/DTO_WP4_ECD_D4.6.pdf. xxxix Weller, S.D. et al. (2015). Synthetic Mooring Ropes for Marine Renewable Energy Applications. Renewable Energy, Volume 83, Pages 1268-1278, ISSN 0960-1481. Available from: https://www.sciencedirect.com/science/article/abs/pii/S0960148115002402. xl Fontaine, E. et al. (2014) Industry survey of past failures, pre-emptive replacements and reported degradations for mooring systems of floating production units. Offshore Technology Conference. Available from: https://onepetro.org/OTCONF/proceedings-abstract/14OTC/4-14OTC/D041S047R002/172127. xli Moharrami, M. & Shiri, H. (2018). Reliability of drag embedment anchors for applications in Canadian deep offshore. xlii Moan, T. (2009) Development of accidental collapse limit state criteria for offshore structures, Structural Safety, Volume 31, Issue 2, Pages 124-135, ISSN 0167-4730, Available from: https://www.sciencedirect.com/science/article/pii/S0167473008000659.

PERISCOPE O&M Case Study 10-Mar-2021
xliii Warnock, J., McMillan, D., Pilgrim, J. & Shenton, S. (2019). Failure Rates of Offshore Wind Transmission Systems. Energies. [Online]. 12 (14). p.p. 2682. Available from: http://dx.doi.org/10.3390/en12142682. xliv Copernicus Climate Change Service (2021). Climate reanalysis. Available from: https://climate.copernicus.eu/climate-reanalysis. xlv Gray, A., Johanning, L. & Dickens, B. (2015). A Markov chain model to enhance the weather simulation capabilities of an operations and maintenance tool for a wave energy array. Available from: https://ore.exeter.ac.uk/repository/handle/10871/21653. xlvi Gray, A. (2017). Modelling Operations and Maintenance Strategies for Wave Energy Arrays. EngD Thesis. University of Exeter. Available from: https://ore.exeter.ac.uk/repository/handle/10871/27909. xlvii Myhr, A., Bjerkseter, C., Ågotnes, A. & Nygaard, T. A. (2014). Levelised cost of energy for offshore floating wind turbines in a life cycle perspective. Renewable Energy. 66, pp. 714-728. Available from: https://www.sciencedirect.com/science/article/pii/S0960148114000469. xlviii The Carbon Trust (2015). Floating Offshore Wind: Market and Technology Review. Available from: https://www.carbontrust.com/resources/floating-offshore-wind-market-technology-review. xlix Musial, W., Beiter, P. & Nunemaker, J. (2020). Cost of Floating Offshore Wind Energy Using New England Aqua Ventus Concrete Semisubmersible Technology. Available from: https://www.nrel.gov/docs/fy20osti/75618.pdf. l Tecnalia (2017). Operational model for offshore operation of wave energy converters. OPERA, Open Sea Operating Experience to Reduce Wave Energy Costs. Deliverable D6.2. Available from: http://opera-h2020.eu/wp-content/uploads/2017/09/OPERA_D6.2_Operational-model-for-offshore-operation-of-WECs_TECNALIA_20170727_v1.0.pdf. li Gray, A. (2021). Setting a Benchmark for Decarbonising O&M Vessels of Offshore Wind Farms. Available from: https://ore.catapult.org.uk/analysisinsight/setting-benchmark-decarbonising-om-vessels-offshore-wind-farms/. lii Ørsted (2019). Sustainability Report 2019. Available from: https://orsted.com/-/media/annual2019/Sustainability-report-2019-online-version.pdf. liii Ørsted (2019). Summary 2019. Annual report and sustainability report. Available from: https://orsted.com/-/media/annual2019/AR19-EN-Summary-2019.pdf. liv Thomson, C., Chick, J. & Harrison, C. (2019). An LCA of the Pelamis wave energy converter. The International Journal of Life Cycle Assessment. 24, pp. 51–63. Available from: https://doi.org/10.1007/s11367-018-1504-2. lv Thomson, C., Harrison, G. & Chick, J. (2011). Full Life Cycle Assessment of a Wave Energy Converter. IET Conference Renewable Power Generation RPG 2011, pp. 1–6. Available from: https://www.researchgate.net/publication/236623994_Full_life_cycle_assessment_of_a_wave_energy_converter lvi G+ Global Offshore Wind Health & Safety Organisation (2020). 2019 incident data report. Available from: https://www.gplusoffshorewind.com/__data/assets/pdf_file/0004/752863/PDF-G-2019-incident-report.pdf. lvii SPARTA (2020) SPARTA Portfolio Review 2018/19. Available from: https://s3-eu-west-1.amazonaws.com/media.newore.catapult/app/uploads/2019/11/04144204/OREC01_8853-SPARTA-digital_FINAL.pdf?__hstc=20425319.69d600e34f7d2099a8d2d0b0e62d90eb.1552907741314.1602060305475. lviii SPARTA (2021) SPARTA Portfolio Review 2019/20. Available from: https://ore.catapult.org.uk/wp-content/uploads/2021/02/SPARTA-Review-2020.pdf.

periscope-network.eu
Periscope Network