Embed Size (px)
Citation preview
Oakland University
Fiscal Year 2006 Budget Report
Oakland University SenateNovember 17, 2005

Economic Update
Economic Review
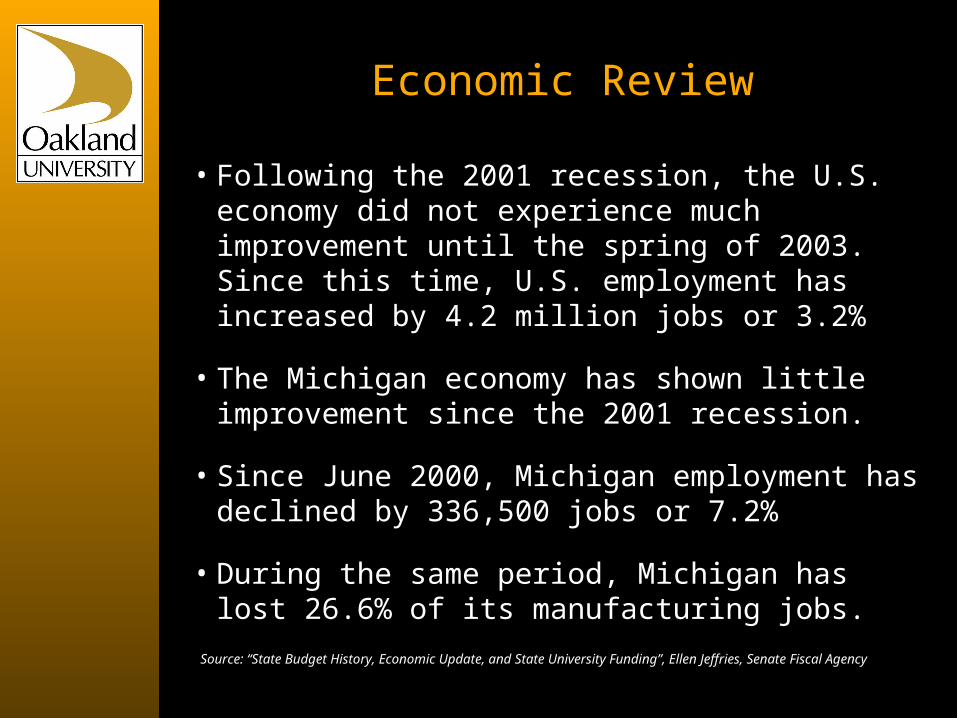
• Following the 2001 recession, the U.S. economy did not experience much improvement until the spring of 2003. Since this time, U.S. employment has increased by 4.2 million jobs or 3.2%
• The Michigan economy has shown little improvement since the 2001 recession.
• Since June 2000, Michigan employment has declined by 336,500 jobs or 7.2%
• During the same period, Michigan has lost 26.6% of its manufacturing jobs.
Source: “State Budget History, Economic Update, and State University Funding”, Ellen Jeffries, Senate Fiscal Agency
Economic Review (continued):
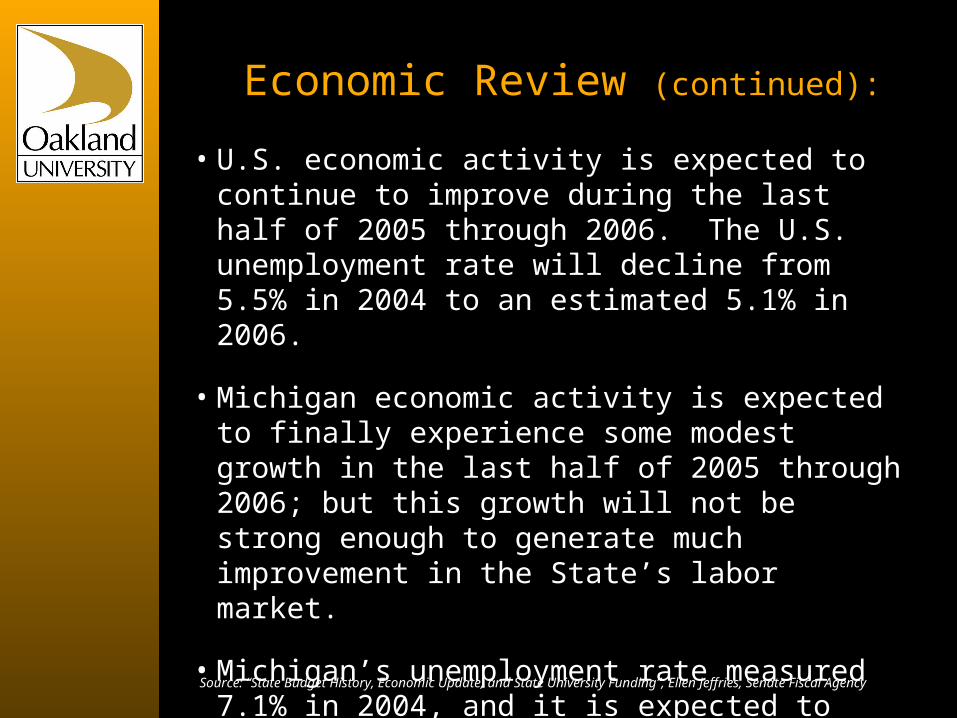
• U.S. economic activity is expected to continue to improve during the last half of 2005 through 2006. The U.S. unemployment rate will decline from 5.5% in 2004 to an estimated 5.1% in 2006.
• Michigan economic activity is expected to finally experience some modest growth in the last half of 2005 through 2006; but this growth will not be strong enough to generate much improvement in the State’s labor market.
• Michigan’s unemployment rate measured 7.1% in 2004, and it is expected to edge up to 7.2% in 2005 and 7.4% in 2006.
Source: “State Budget History, Economic Update, and State University Funding”, Ellen Jeffries, Senate Fiscal Agency
Revenue Review
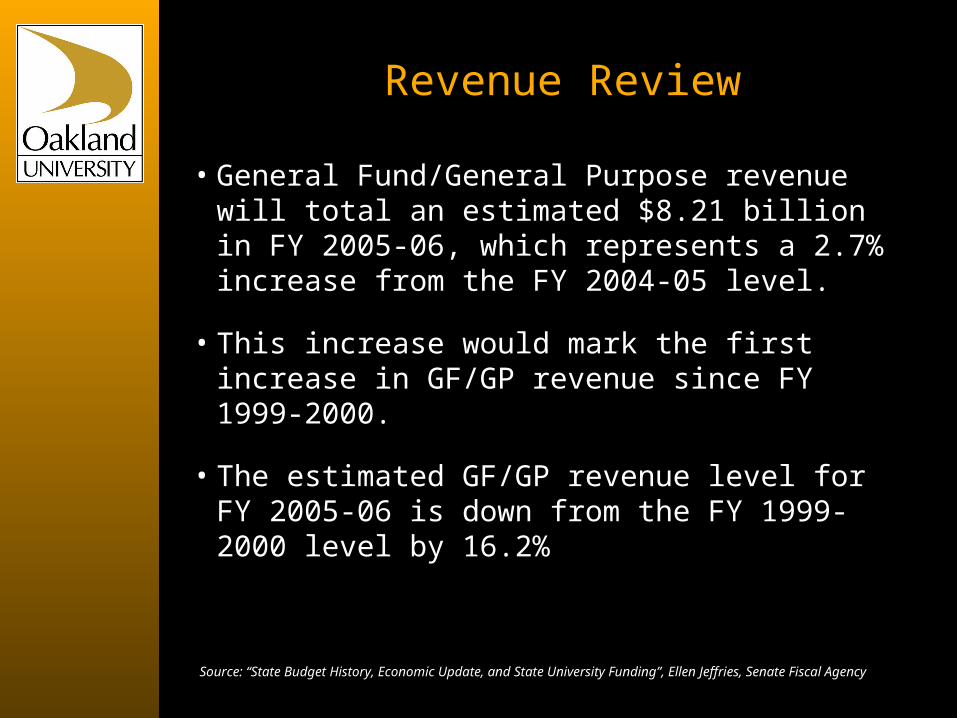
• General Fund/General Purpose revenue will total an estimated $8.21 billion in FY 2005-06, which represents a 2.7% increase from the FY 2004-05 level.
• This increase would mark the first increase in GF/GP revenue since FY 1999-2000.
• The estimated GF/GP revenue level for FY 2005-06 is down from the FY 1999-2000 level by 16.2%
Source: “State Budget History, Economic Update, and State University Funding”, Ellen Jeffries, Senate Fiscal Agency
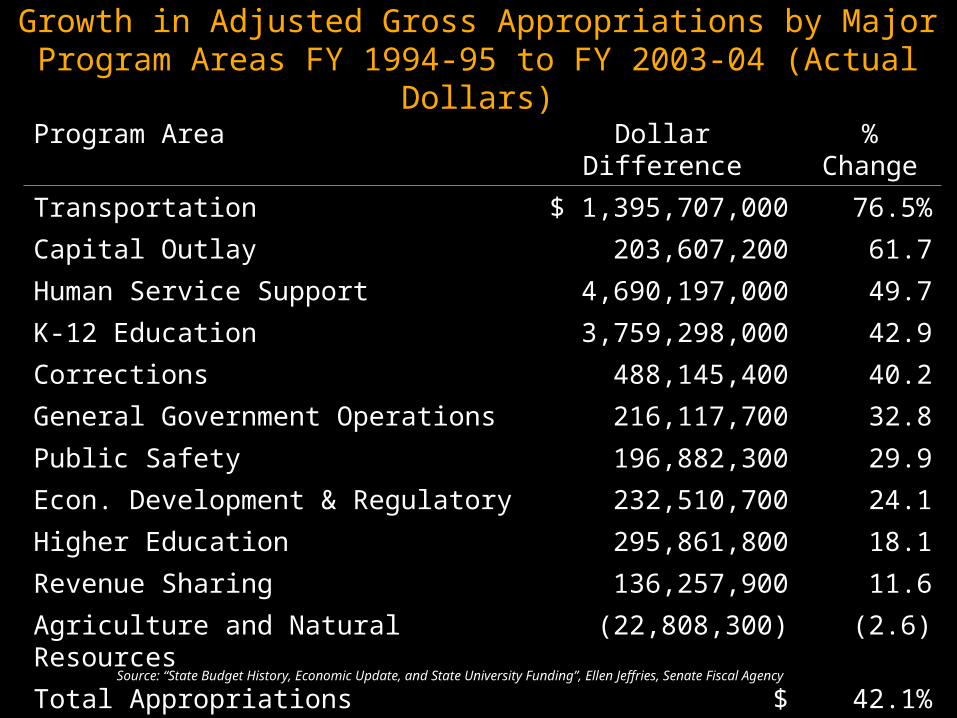
Growth in Adjusted Gross Appropriations by Major Program Areas FY 1994-95 to FY 2003-04 (Actual Dollars)
Source: “State Budget History, Economic Update, and State University Funding”, Ellen Jeffries, Senate Fiscal Agency
Program Area Dollar Difference % Change
Transportation $ 1,395,707,000 76.5%
Capital Outlay 203,607,200 61.7
Human Service Support 4,690,197,000 49.7
K-12 Education 3,759,298,000 42.9
Corrections 488,145,400 40.2
General Government Operations 216,117,700 32.8
Public Safety 196,882,300 29.9
Econ. Development & Regulatory 232,510,700 24.1
Higher Education 295,861,800 18.1
Revenue Sharing 136,257,900 11.6
Agriculture and Natural Resources (22,808,300) (2.6)
Total Appropriations $ 11,591,780,000 42.1%

Making the Case in Lansing
Progress in Communicating Our Message
• Despite limited resources, state elected officials continue to address the needs and concerns of universities like Oakland
Economic Outlook Uncertain
• Although state revenues have significantly improved in recent months, Michigan still trails the rest of the nation and is plagued by the uncertainty of the manufacturing industry, particularly automotive
• Opportunities for state funding for applied and basic research, technology transfer and commercialization may be forthcoming under the economic stimulus package currently being negotiated at the state level
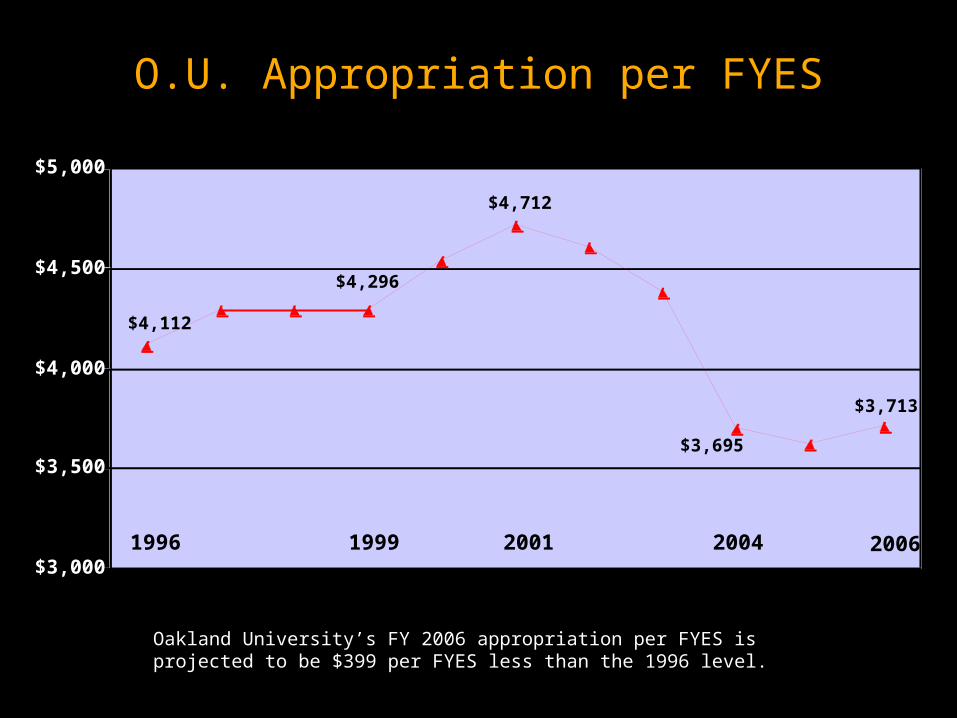
O.U. Appropriation per FYES
$3,713
$3,695
$4,712
$4,296
$4,112
$3,000
$3,500
$4,000
$4,500
$5,000
1996 1999 2001 2004 2006
Oakland University’s FY 2006 appropriation per FYES is projected to be $399 per FYES less than the 1996 level.
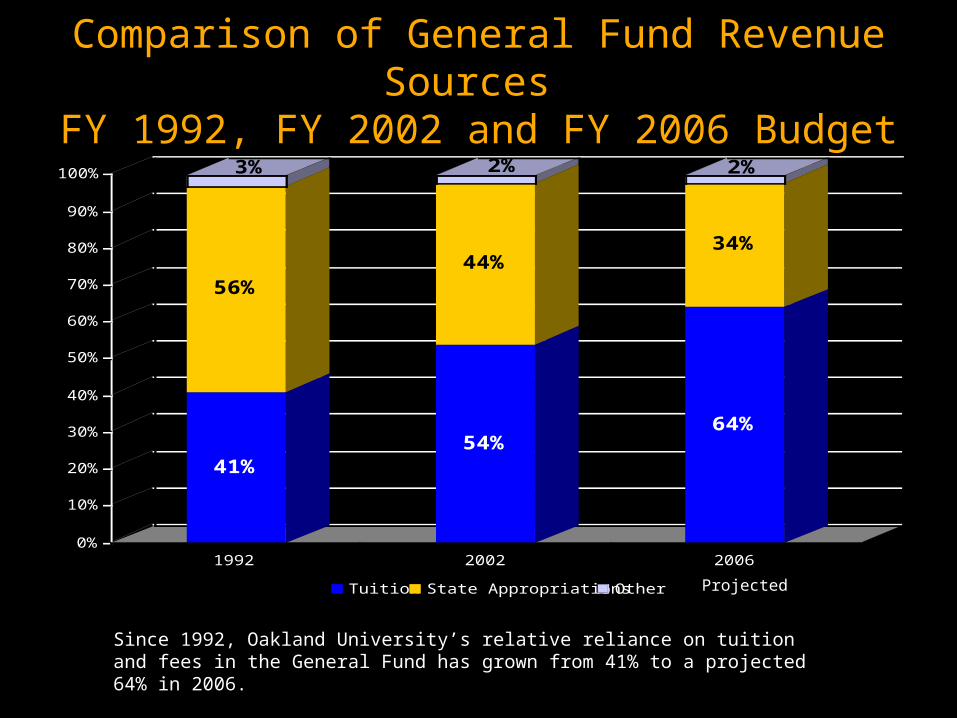
Since 1992, Oakland University’s relative reliance on tuition and fees in the General Fund has grown from 41% to a projected 64% in 2006.
Comparison of General Fund Revenue Sources FY 1992, FY 2002 and FY 2006 Budget
41%
56%
3%
54%
44%
2%
64%
34%
2%
0%
10%
20%
30%
40%
50%
60%
70%
80%
90%
100%
1992 2002 2006
Tuition State Appropriations Other Projected
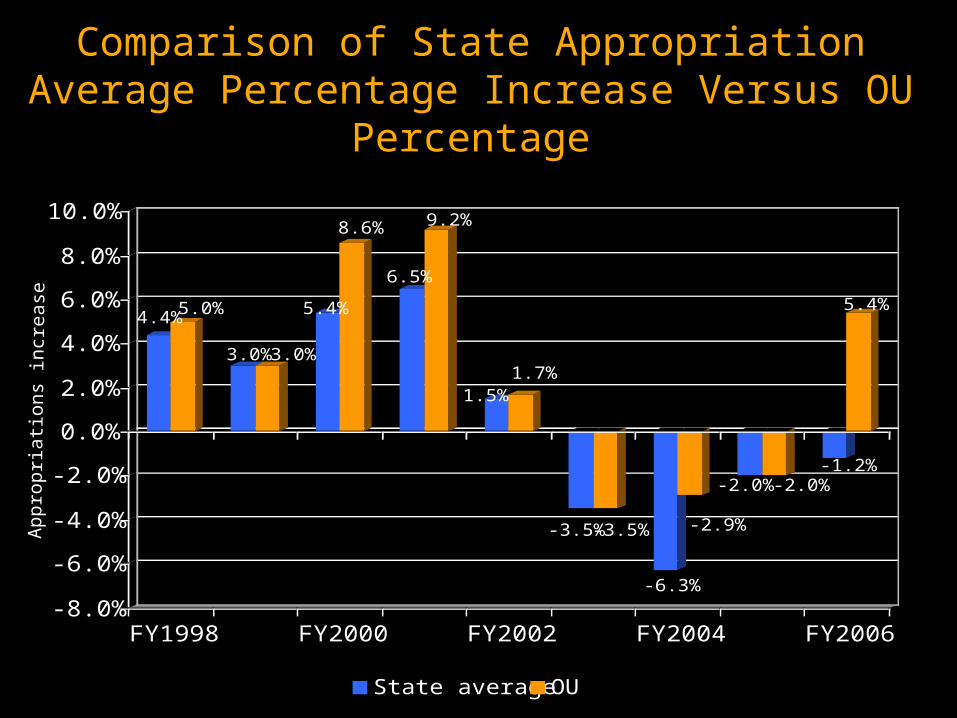
Comparison of State Appropriation Average Percentage Increase Versus OU Percentage
4.4%5.0%
3.0% 3.0%
5.4%
8.6%
6.5%
9.2%
1.5%1.7%
-3.5%-3.5%
-6.3%
-2.9%
-2.0% -2.0%-1.2%
5.4%
-8.0%
-6.0%
-4.0%
-2.0%
0.0%
2.0%
4.0%
6.0%
8.0%
10.0%
FY1998 FY2000 FY2002 FY2004 FY2006
State average OU
App
ropr
iatio
ns in
crea
se
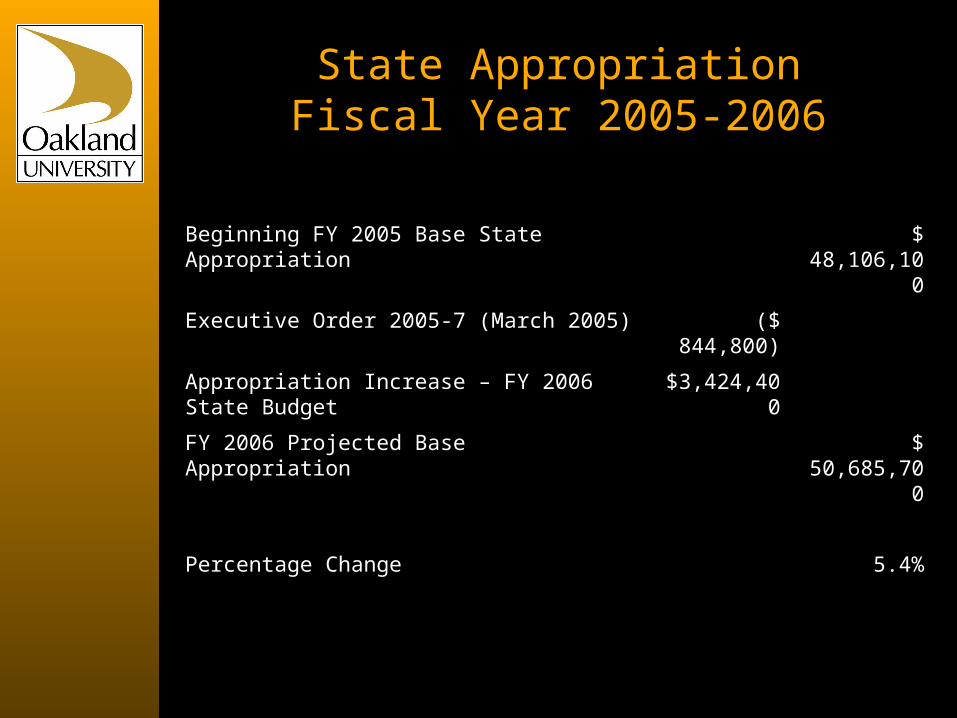
State AppropriationFiscal Year 2005-2006
Beginning FY 2005 Base State Appropriation $ 48,106,100
Executive Order 2005-7 (March 2005) ($ 844,800)
Appropriation Increase – FY 2006 State Budget $3,424,400
FY 2006 Projected Base Appropriation $ 50,685,700
Percentage Change 5.4%
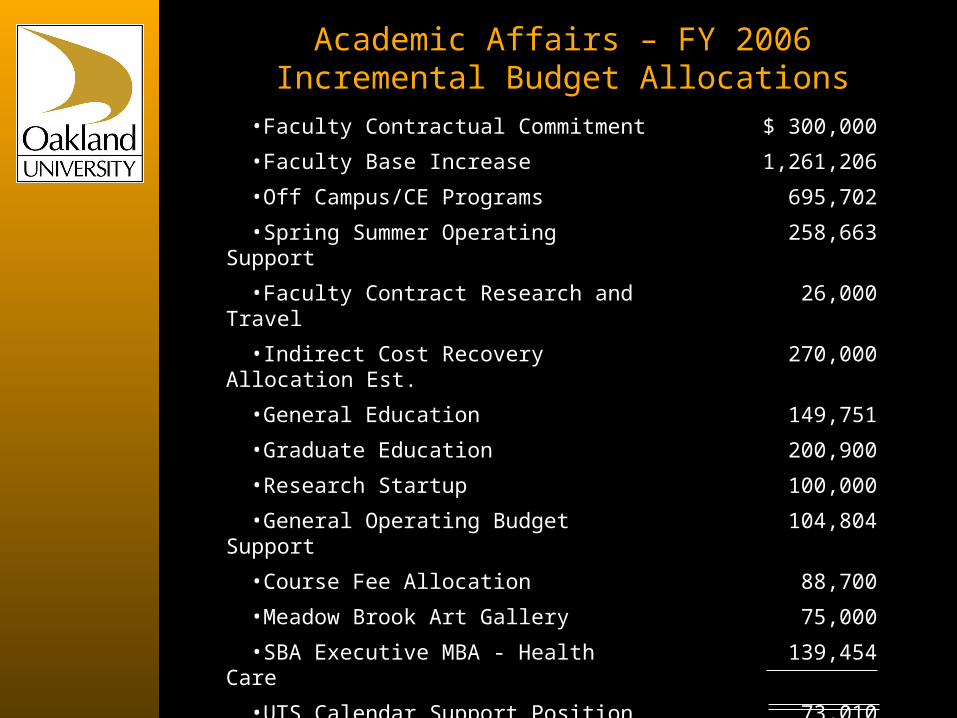
Academic Affairs – FY 2006Incremental Budget Allocations
•Faculty Contractual Commitment $ 300,000
•Faculty Base Increase 1,261,206
•Off Campus/CE Programs 695,702
•Spring Summer Operating Support 258,663
•Faculty Contract Research and Travel 26,000
•Indirect Cost Recovery Allocation Est. 270,000
•General Education 149,751
•Graduate Education 200,900
•Research Startup 100,000
•General Operating Budget Support 104,804
•Course Fee Allocation 88,700
•Meadow Brook Art Gallery 75,000
•SBA Executive MBA - Health Care 139,454
•UTS Calendar Support Position 73,010
•SHS Clinical Sites 19,950
•Web CT and MERIT Site License 325,500
Total Allocations $ 4,088,640
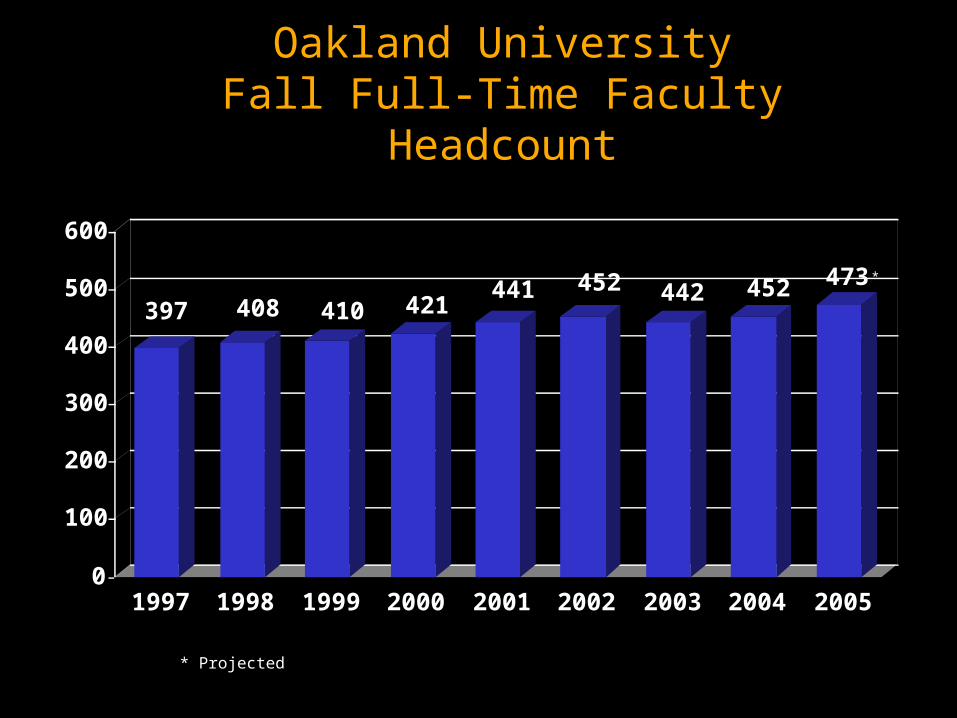
397 408 410 421441 452 442 452 473
0
100
200
300
400
500
600
1997 1998 1999 2000 2001 2002 2003 2004 2005
Oakland UniversityFall Full-Time Faculty Headcount
*
* Projected
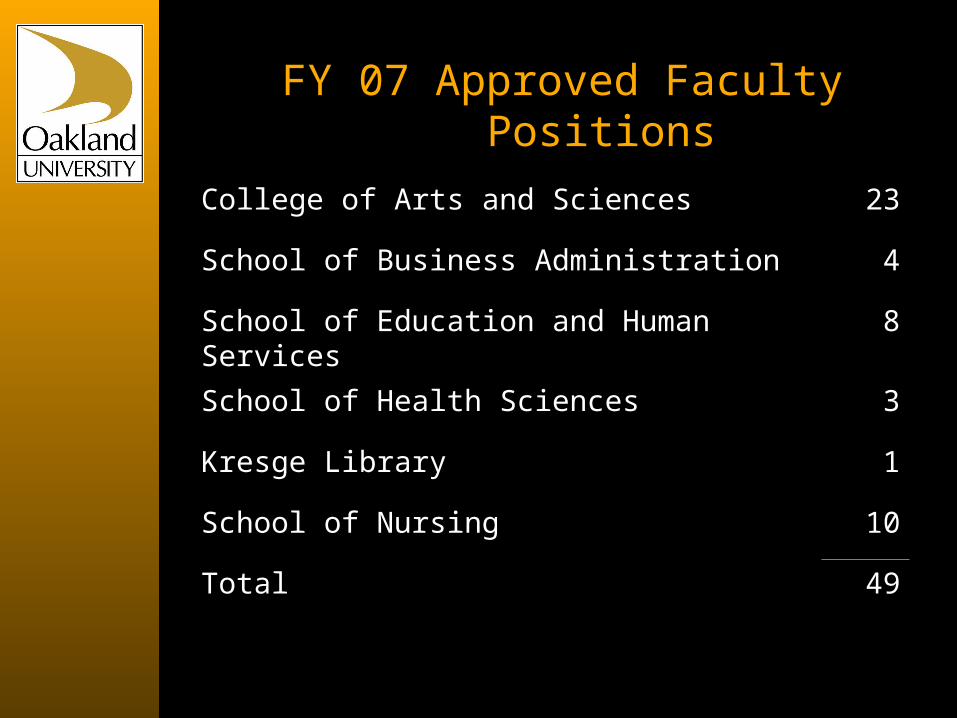
FY 07 Approved Faculty Positions
College of Arts and Sciences 23
School of Business Administration 4
School of Education and Human Services 8
School of Health Sciences 3
Kresge Library 1
School of Nursing 10
Total 49
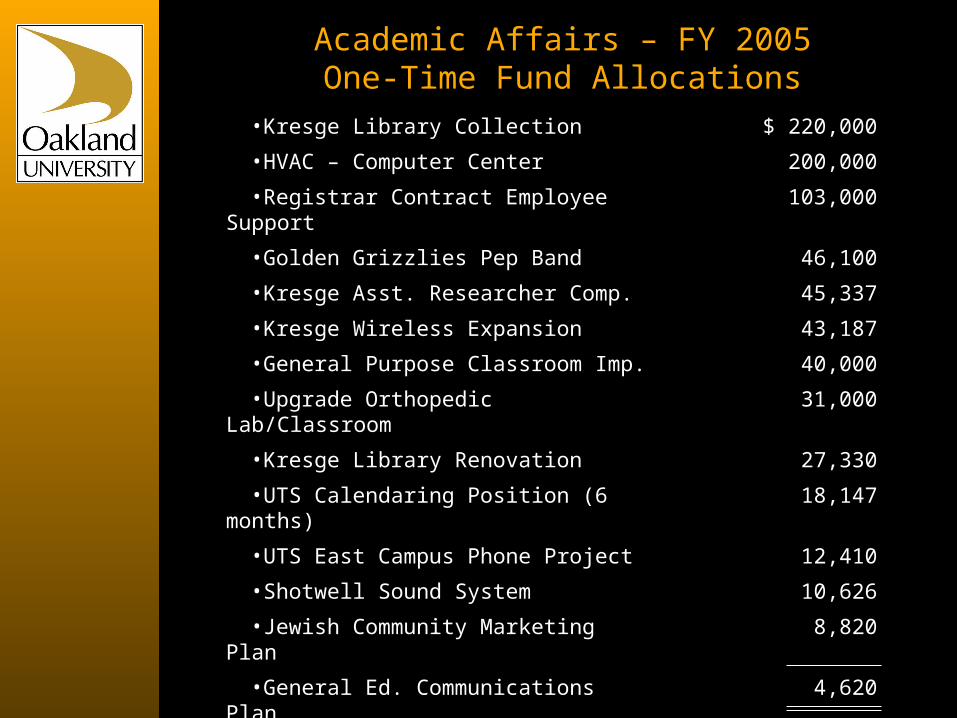
Academic Affairs – FY 2005One-Time Fund Allocations
•Kresge Library Collection $ 220,000
•HVAC – Computer Center 200,000
•Registrar Contract Employee Support 103,000
•Golden Grizzlies Pep Band 46,100
•Kresge Asst. Researcher Comp. 45,337
•Kresge Wireless Expansion 43,187
•General Purpose Classroom Imp. 40,000
•Upgrade Orthopedic Lab/Classroom 31,000
•Kresge Library Renovation 27,330
•UTS Calendaring Position (6 months) 18,147
•UTS East Campus Phone Project 12,410
•Shotwell Sound System 10,626
•Jewish Community Marketing Plan 8,820
•General Ed. Communications Plan 4,620
•Assistant Researcher (Grants) 3,647
•Sigma Xi Support 2,500
Total One-Time Allocations $816,724
Focus on Support for Academic Programs
• Budget Incentives to Support Future Enrollment Growth
• Research Support and Success
• Capital Campaign
• Partnerships to Leverage Excellence
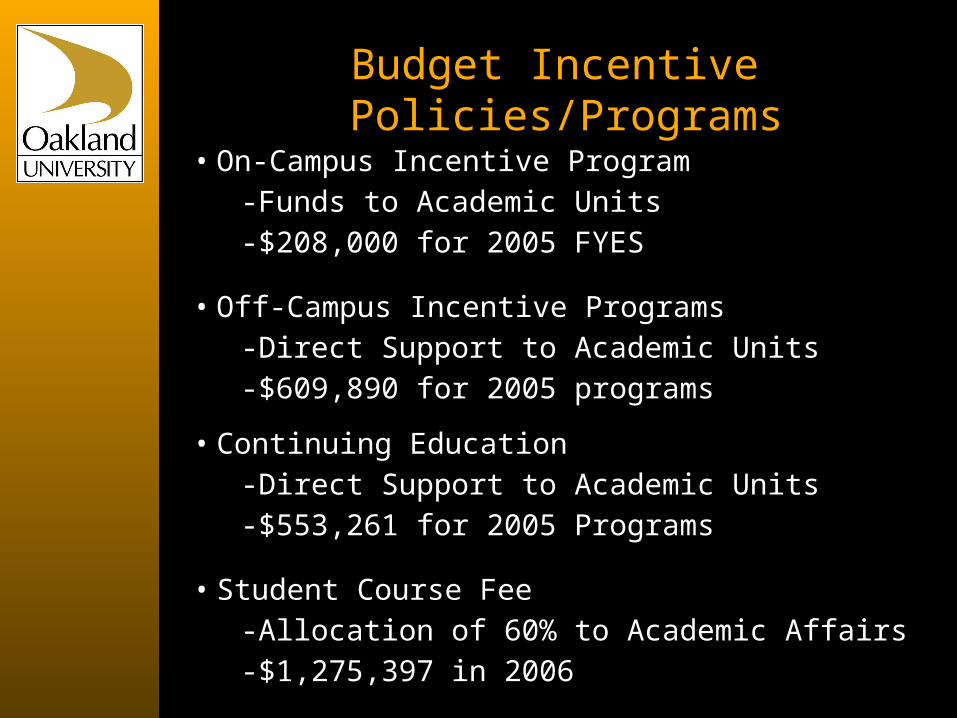
Budget Incentive Policies/Programs
• On-Campus Incentive Program-Funds to Academic Units-$208,000 for 2005 FYES
• Off-Campus Incentive Programs-Direct Support to Academic Units-$609,890 for 2005 programs
• Continuing Education-Direct Support to Academic Units-$553,261 for 2005 Programs
• Student Course Fee-Allocation of 60% to Academic Affairs-$1,275,397 in 2006
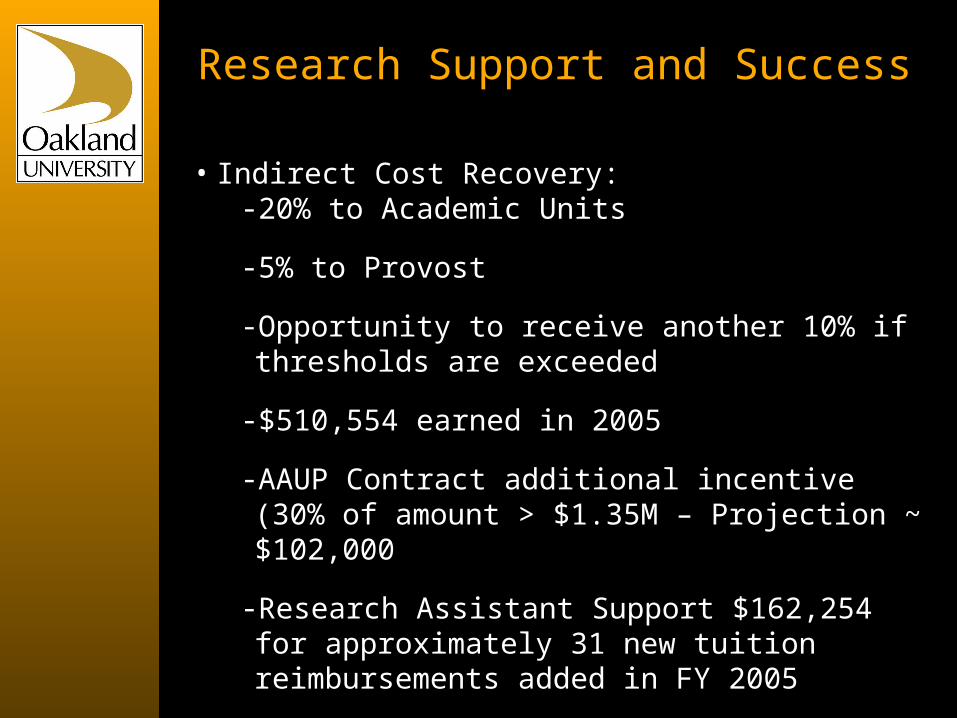
Research Support and Success
• Indirect Cost Recovery:- 20% to Academic Units
- 5% to Provost
- Opportunity to receive another 10% if thresholds are exceeded
- $510,554 earned in 2005
- AAUP Contract additional incentive (30% of amount > $1.35M – Projection ~ $102,000
- Research Assistant Support $162,254 for approximately 31 new tuition reimbursements added in FY 2005
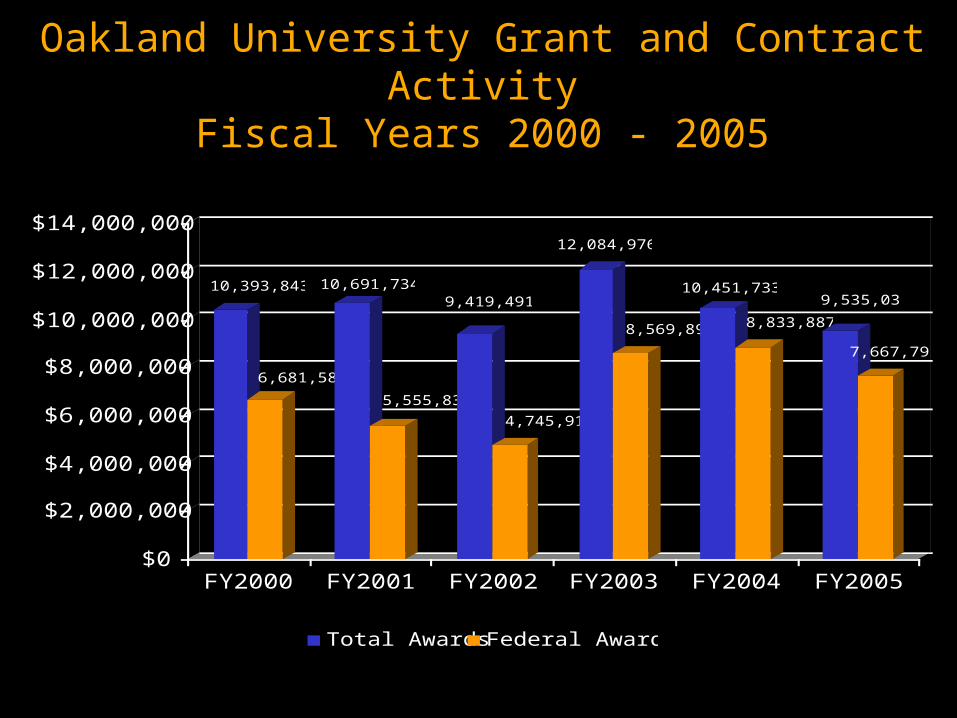
Oakland University Grant and Contract ActivityFiscal Years 2000 - 2005
10,393,843
6,681,581
10,691,734
5,555,832
9,419,491
4,745,917
12,084,976
8,569,890
10,451,733
8,833,887
9,535,036
7,667,791
$0
$2,000,000
$4,000,000
$6,000,000
$8,000,000
$10,000,000
$12,000,000
$14,000,000
FY2000 FY2001 FY2002 FY2003 FY2004 FY2005
Total Awards Federal Awards
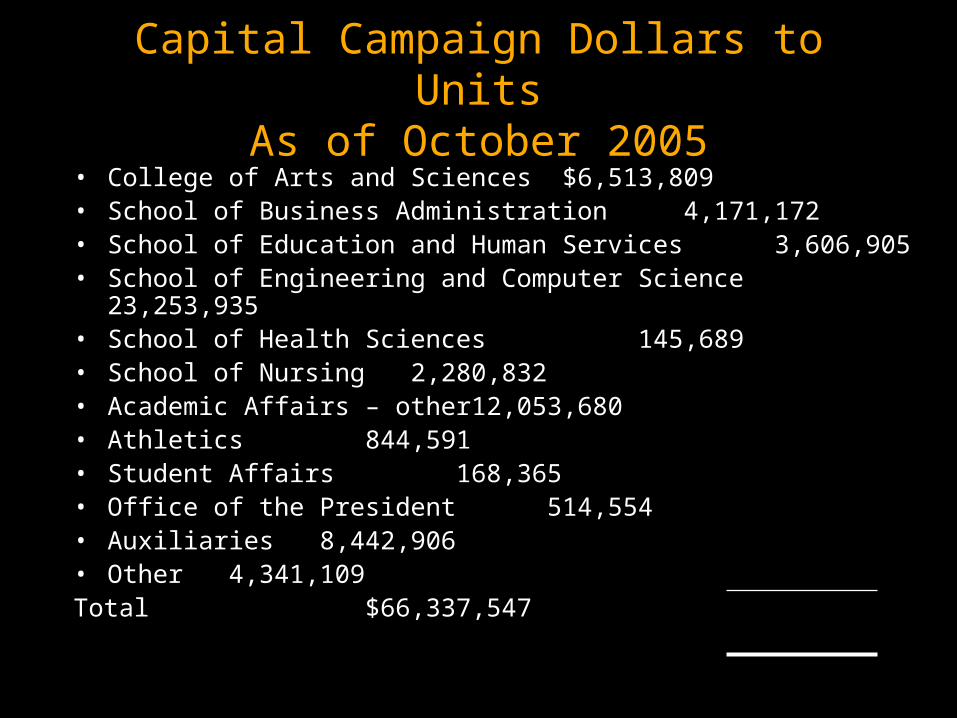
Capital Campaign Dollars to UnitsAs of October 2005
• College of Arts and Sciences $6,513,809• School of Business Administration 4,171,172• School of Education and Human Services 3,606,905• School of Engineering and Computer Science 23,253,935• School of Health Sciences 145,689• School of Nursing 2,280,832• Academic Affairs – other 12,053,680• Athletics 844,591• Student Affairs 168,365• Office of the President 514,554• Auxiliaries 8,442,906 • Other 4,341,109Total $66,337,547
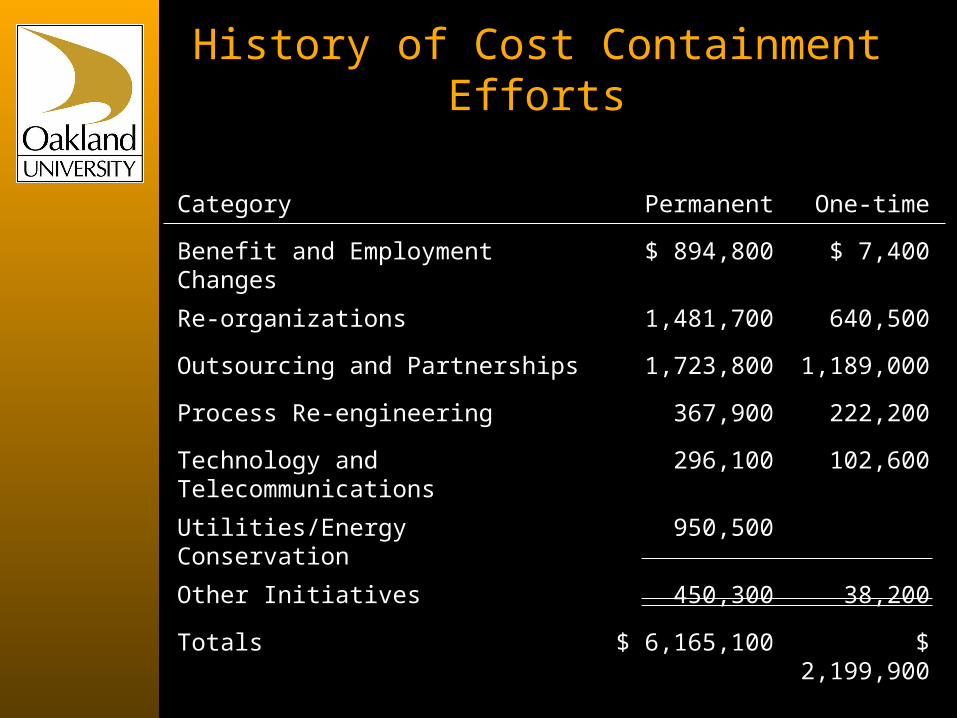
History of Cost Containment Efforts
Category Permanent One-time
Benefit and Employment Changes $ 894,800 $ 7,400
Re-organizations 1,481,700 640,500
Outsourcing and Partnerships 1,723,800 1,189,000
Process Re-engineering 367,900 222,200
Technology and Telecommunications 296,100 102,600
Utilities/Energy Conservation 950,500
Other Initiatives 450,300 38,200
Totals $ 6,165,100 $ 2,199,900