Embed Size (px)
Citation preview

OAK RIDGE NATIONAL LABORATORY
OPERATED BY UNION CARBIDE CORPORATION FOR THE UNITED STATES DEPARTMENT OF ENERGY
Analysis of the Performance of the Westinghouse Reactor
Vessel Level-Indicating System for Tests at Semiscale
J. E. Hardy G. N. Miller
Prepared for U.S. Nuclear Regulatory Commission
Office of Nuclear Regulatory Research Under Interagency Agreements DOE 40-551-75 and 40-552-75 /
DlSTRlBUflOll OF THIS DOCUMENT I8 UNUMm

DISCLAIMER
This report was prepared as an account of work sponsored by an agency of the United States Government. Neither the United States Government nor any agency Thereof, nor any of their employees, makes any warranty, express or implied, or assumes any legal liability or responsibility for the accuracy, completeness, or usefulness of any information, apparatus, product, or process disclosed, or represents that its use would not infringe privately owned rights. Reference herein to any specific commercial product, process, or service by trade name, trademark, manufacturer, or otherwise does not necessarily constitute or imply its endorsement, recommendation, or favoring by the United States Government or any agency thereof. The views and opinions of authors expressed herein do not necessarily state or reflect those of the United States Government or any agency thereof.

DISCLAIMER
Portions of this document may be illegible in electronic image products. Images are produced from the best available original document.

2
Printed in the United States of America. Available from National Technical lnformation Sewice
U.S. Department of Commerce 5285 Port Royal Road, Springfield, Virginia 22161
Available from
GPO Sales Program Division of Technical Information and Document Control
U.S. Nuclear Regulatory Commission Washington, D.C. 20555
This report was prepared as an account of work sponsored by an agency of the United StatesGovernment. Neither the U nit& StatesGovernment nor any agency thereof, nor any of their employees, makes any warranty, express or implied, or assumes any legal liability or responsibility for the accuracy, completeness, or usefulness of any information, apparatus, product, Or process d k . I d , nr repwrrtb tnet ~ t s use would not infringe privately owned rights. Reference herein to any specific commercial product, process, or service by trade name, trademark, manufacturer, or otherwise, does not necessarily constitute or imply its endorsement, recommendation, or favoring by the United States Government or any agency thereof. The v i m and opinions of authors expressed herein do not necessarily state or reflect those of the United States Government or any agency thereof.

NUREG/CR-2720 O R N L / T M - ~ ~ ~ ~ Distribution Category R2
Contract No. W-7405-eng-26 Instrumentation and Controls
ANALYSIS OF THE PERFORMANCE OF THE WESTINGHOUSE REACTOR VESSEL LEVEL-INDICATING SYSTEM FOR
TESTS AT SEMISCALE
J. E. Hardy G. N. Miller
__-__--__ __-__ __ -- I-- - I
DISCLAIMER
nor n~ersariiy mnsticvie or imply i l l enaorsmenl. remmmcndalion, or lovoring by the Uni ld Stst- Government or any agency therml. The and opinions of aulhorr exprered herein do not
ne~enarilv state or reflect rhoreof the United StatesGovernmeni or any * e r n thereof.
,L-_---p----. .
Manuscript Completed - August 1982
Date Published - October 1982
Prepared for U. S. Nuclear Regulatory Commission Office of Nuclear Regulatory Research
Under Interagency Agreements DOE 40-551-75 and 40-552-75
NRC Fin No. B0401
Prepared by Oak Ridge National Laboratory Oak Ridge, Tennessee 37830
operated by UNION CARBIDE CORPORATION
for the U . S . DEPARTMENT OF ENERGY
DISTRIBUTION OF THIS DOCUMENT IS UNLIMITED eR

THIS PAGE
WAS INTENTIONALLY
LEFT BLANK \

CONTENTS
ABSTRACT . . . . . . . . . . . . . . . . . . . . . . . . . . . . . v
I. INTRODUCTION . . . . . . . . . . . . . . . . . . . . . . . . 1
I1 . WESTINGHOUSE REACTOR VESSEL LEVEL INDICATING SYSTEM . . . . . . . . . . . . . . . . . . . . . . . . . (RVLIS) 3
1I .A. Descr ip t ion of Westinghouse Level I n d i c a t i n g . . . . . . . . . . . . . . . . . . . . . . System 3 1I .B. System Configurat ion Descr ip t ion . . . . . . . . . . 3 1I .C . Algorithm f o r Conversion of D i f f e r e n t i a l
Pressure Measurement t o Liquid Level . . . . . . . 9
111 SEMISCALE TEST FACILITY . . . . . . . . . . . . . . . . . . 11
. . . . . . . . . . . . I V . RVLIS PERFORMANCE AT SEMISCALE TESTS 17
1V.A. Test S-UT-3 . . . . . . . . . . . . . . . . . . . . . 17 1V.B. Tes t s SUT-6 and S-UT-7 . . . . . . . . . . . . . . . 25 1V.C. Analysis of SEMISCALE Natural C i r c u l a t i o n Tes t s . . . 28 . . . . . . . . . . . . . . . . . . . . . 1V.D. S-UT-8 Test 43 1V.E. S I B l T e s t . . . . . . . . . . . . . . . . . . . . . . 50 1V.F. SC-WSPT-20 (Frequency Response) Tes t . . . . . . . . 50
V . CONCLUSIONS . . . . . . . . . . . . . . . . . . . . . . . . 59
REFERENCES . . . . . . . . . . . . . . . . . . . . . . . . . . . . 6 1
iii - 1d

ABSTRACT
The Westinghouse Reactor Vessel Level Indicating System (RVLIS), a differential pressure level measurement system, was tested at SEMISCALE. This report contains the analyses of these tests and the conclusions of these analyses. The tests performed included small break and intermedi- ate break tests. Also, frequency response and natural circulation tests were run and analyzed. The RVLIS always indicated a level less than the two phase froth level. The RVLIS output in early small break tests indi- cated a level 200 cm greater than actual collapsed liquid level. This discrepancy was caused by structural differences between SEMISCALE and a Westinghouse reactor. Once modifications were made so that SEMISCALE better simulated a Westinghouse PWR, the maximum difference between RVLIS and SEMISCALE instrumentation was 30 cm or 3% which is less than the stated uncertainty of the Westinghouse RVLIS.

I. INTRODUCTION
The accident at Three Mile Island Unit 2, originating on March 28, 1979, has become one of the more intensely studied technological mis- haps in history. The Report of the Kemeny Commission presents a care- ful reconstruction of the events during the week of the accident, from a more human than technical point of view.' At least one result of the post-TMI-2 studies was a mandate by the Kemeny Commission to the NRC to 11 consider the need for additional instrumentation to aid in understand- ing of plant tat us."^ Through the efforts of the TMI-2 Lessons Learned Task Force, the NRC recommended the installation of additional instrumentation (if required) to "provide unambiguous, easy-to- interpret, indications of inadequate core cooling."3 The Advisory Committee on Reactor Safeguards stated:
"The Committee believes that it would be prudent to consider expeditiously the provision of instrumentation that will provide an unambiguous indication of the level of fluid in the reactor vessel. . . .The Committee believes that as a minimum, the level indication should range from the bottom of the hot leg piping to the reactor vessel flange area."4
With the publication of NUREG-0737, all operating licensees and. applicants for operating licenses were required to provide a descrip- tion of any additional instrumentation to indicate inadequate core cooling and a time table for its installation. 5
Westinghouse, a reactor vendor, responded with an Inadequate Core Cooling Instrumentation (ICCI) system which includes the Saturation Margin Monitor (SMM) and Core Exit Thermocouples (CETs) and a differen- tial pressure level measurement system. The latter is referred to as Reactor Vessel Level Indicating System (RVLIS). The differential pres- sure measurement system has been tested at Westinghouse we ore st Hills
- ~acilit~) and at the SEMISCALE facility at Idaho National Engineering .Laboratory (INEL). This report is an evaluation of the results of these tests at SEMISCALE.

11. WESTINGHOUSE REACTOR VESSEL LEVEL INDICATING SYSTEM (RVLIS)
1I.A. Description of Westinghouse Level Indicating System
The RVLIS provides coolant inventory information based on a differential pressure (dp) measurement. system and, along with the Saturation Margin Monitor and Core Exit Thermocouples, is a part of the complete ICCI system. A complete description of this system can be found in ref. 6. A brief description of the dp system is included here.
The dp system has two trains of three dp transmitters each. These dp transmitters are connected and used as follows (refer to Figs. 1 and 2) :
1.. Narrow range - This transmitter is connected between the bottom of the vessel and the top of the vessel to existing penetrations. (On the Upper Head Injection (UHI) plant, the top connection is to the hot legs.) With the vessel empty, the output is 0%, and with the vessel full and pumps off, the indication is 100%. With vessel full and pumps on, the indication is offscale (>loo%).
2. Wide range - This transmitter is connected in parallel with the narrow range unit. It indicates 0% with vessel empty and it indi- cates 33% (15% for a UHI plant) with vessel full and -pumps off. With vessel full and pumps on, the indication is 100% on a scale of 0% to 110%. This unit is to be calibrated during installation to indicate reactor vessel differential pressure from which one can infer void fracton with any combination of pumps on and off.
3. Upper range unit - This dp transmitter is connected from the hot legs to the top of the vessel. Westinghouse states that this unit is to be used only during head .venting. With vessel empty the indication is 0%, and with vessel full and pumps off, the indica- tion is 100%. With vessel full and pumps on and flow in the instrumented hot leg, the indication is offscale in the 0% direction.
These dp transmitters are located outside the containment wall and are connected to the vessel by armored capillary tubing (Fig. 3). There are two isolators in each impulse line - one close to the vessel connection point and one just inside the containment wall. These isolators have switch contacts to indicate excessive travel of the internal diaphragm (an indication of capillary fluid leakage). These capillary lines are evacuated and then filled with demineralized-deaerated water.
1I.B. System Configuration Description i
The Westinghouse reactor vessel level indicating system consists of the following components (ref. 7):

ORNL-DWG 8 2 - 1 0 1 8 1
NARROW RANGE
TRAIN A TRAIN B
Fig. i. Keactor vesse l l e v e l indicating system for non-UHI plant.

ORNL-DWG 8 2 - 1 0 1 82
TRAIN A - TRAIN B I ,.
Fig. 2. Reactor vessel level indicating system for UHI plant.

ORNL-DWG 8 2 - 1 0 1 8 3
HEAD
Fig. 30 Process connection schematic, Traln A, non-UHI p l a n t .
1. An ITT Barton Model 351 pressure sensor which has a single bellows and provides isolation from the process fluid. The system at SEMISCALE uses three of these and they displace 122.9 cm3 (7 112 ine3) of water per 2.54 cm (1 in.) of movement.
2. Sealed capillary tubing, 0.48 cm (3116 in.) OD x 0.12 cm (0.049 in.) wall thickness, filled with demineralized deaerated water. Various lengths of this tubing were used as follows: 60 m (200 ft) for the hot leg sensor, 45 m (150 ft) for the seal table sen- sor, and 75 m (250 ft) for the upper head sensor. These lengths are approximately the same as the lengths installed in a PWR plant.
3. An ITT Barton Model 289A hydraulic isolator (differential pressure indicating switch) which has a dual bellows and provides isolation between the tubing connected to the sensor and that connected to the differential pressure transmitter. The isolators are mounted just outside the containment wall. The hydraulic isolator - Yo vides an indication of displacement from -16.39 cm3 (-1 in. ) (into the reactor system) to 8.2 cm3 (112 inO3) (out of the reactor system into the differential pressure transmitter dia- phragm). The differential pressure required to drive the isolator to the 16.39 cm3 (1 ine3) position is about 25.4 cm (10 in.) of water. The hydraulic isolators at SEMISCALE were set up with a bias into the reactor system of 3.28 cm3 (0.2 ine3) to 4.92 cm3 (0.3 ine3) at atmospheric pressure. Then, the zero position occurred at 6.895 MPa (1000 psig) , and was displaced 3.28 cm3 (0.2 in.3) to 4.92 cm3 (0.3 ine3) out of the reactor system at 15.51 MPa (2250 psig).
4. An ITT Barton differential pressure transmitter which provides a 4 to 20 mA output that is proportional to the difference between the applied pressures. The total load resistance in the current loop is 1,053 9 which is composed of a 1000-9 load resistor, a 504, f0.5% current measuring resistor and 2.7-9 wire resistance. With the load resistance established, a 33-V supply voltage would be indicated, but on the advice of ITT Barton, due to more than average resistance in the loop, this voltage was increased to 38 V. The ranges of the three differential pressure transmitters are as follows :
DV*VESSEL 998 cm (393 in.) of water column with 4 mA output 0 cm (0 in.) of water column with 20 mA output
DV* DYNAMIC -998 cm (-393 in.) of water column with 4 mA output 1524 cm (+600 in.) of water column with 20 mA output
DV* UPHEAD 399 cm (157 in.) of water column with 4 mA output 0 cm (0 in.) of water column with 20 mA output
The static line pressure rating is 28.69 mFa (3000 gsig) with a line pressure sensitivity of +0.20% of maximum span per 6.895-mPa (1000 psig) change.

5. Hewlett-Packard power supply models 6205 B and 6206 B are used. In all three, the voltage is set at 38 V. These power supplies are very stable: 0.01% plus 4 mV. This is equivalent to a '7.8-mV total, change at 38 V. The power supply effect on the differential pressure transmitter is small ('0.025% of span per one V power supply change), and the total change is, therefore, 0.0002% of span.
6. A Taylor Model 1323 J three-pen recorder that has an input impedance greater than 1 IQ. The zero input is set for 0.2 V and the 100% input is set for 1.0 V, corresponding to an input of 4 mA and 20 mA, respectively. The input signal is derived from the voltage drop across the 50-i2 ('0.5%) current resistor. The slow chart speed is 15.2 cm (6 in.) .per h.
The s a w s l g ~ ~ l that goes t o thc Taylor rocordet goes through a patch panel and into the data acquisition system. The signal passes through a Model 7442 Bay Laboratories signal conditioner and into a Model 5204 Bay Laboratories amplifier. The amplifiers are set up with a gain of 10. The amplifiers have a differential input for isolation, and two outputs. One output is unfiltered and is used for channel monitoring with a digital voltmeter. The other output is filtered with a two-pole Bessel filter with a 50- Hz cutoff frequency. This filtered output is clamped so it will not exceed a magnitude of 10 V. The filtered output passes through a multiplexer into an analog-to-digital converter.
8. The multiplexer and analog-to-digital converter is a Data Technology Corporation Milliverter 11. The multiplexer uses solid state switches for multiplexing. The analog-to-digital converter operates with the successive approximation technique using 12 bits (11 bits plus a sign bit) to glve 4.9-V resolution. Thc epeci- fied accuracy is O.U2% of reading 22.5 mV. ¶le full-scale value is +1ov.
9. The digital output of the analog-to-digital converter enters a Model 2100 A Hewlett-Packard computer and is stored on a Model 531 Daconics disc. The data 3.0 retrieved from the disc a f t e r a teat, decommutated and transferred to digital magnetic tape for further processing. The process can take the form of plots from terminals or be transported to the Computer Science Center in Idaho Falls, Idaho, and entered into the Control Data-Cyber System.
The first four items were furnished by Westinghouse and the remainder by EGdG Idaho, Inc. The signal path is in the same order as listed in the above items.

I1.C. Algorithm for Conversion of Differential Pressure Measurement to Liquid Level
The collapsed liquid levels computed in this report were obtained using the following equation (ref. 7):
where
L is the liquid level in cm,.
H is the elevation between the upper and lower pressure taps in cm,
pr is the reference leg density in kg/m3,
p, is the steam leg density in kg/m3,
pg is the liquid leg density in kg/m3,
(Densities were computed from the ASME steam tables using pressure and temperature measurements from sensors in the steam and liquid regions of interest.)
APm is the measured differential pressure in kPa,
D, is the distance of the lower pressure tap above (+) or below (-) the rdference elevation (cold leg centerline).
Equation (1) is the metric system equivalent to the Westinghouse algorithm, with the term D added to reference the liquid levels to a common elevation (the cold leg centerline).

I11 SEMISCALE TEST FACILITY
The SEMISCALE system is a scaled model of the primary coolant system of a commercial four-loop PWR nuclear generating plant. Geomet- ric similarity has been maintained in vessel design, including a 25- rod, full-length electrically heated core. It also has a full-length upper head and upper plenum, thus maintaining the same component eleva- tions as in an upper head injection type PWR vessel. Equipment in the SEMISCALE vessel upper head has been designed with f1ow"areas scaled to the fluid flow paths found in a PWR equipped to inject emergency core coolant in the upper head. The modified voiume scaling principle util- ized in SEMISCALE is expected to produce vessel liquid level responses to small breaks similar to those of a PWR. The facility is highly instrumented. Vessel instrumentation includes several coolant density and differential pressure measurements capable of determining vessel coolant inventory to a high degree of spatial resolution. The SEMISCALE system, therefore, was one of the better test facilities available for evaluation of differential pressure liquid level measuring devices.
The SEMISCALE Mod-2A system configuration employed for Tests S-UT-3, S-UT-6, S-UT-7, and S-UT-8, is illustrated in Fig. 4. The Mod-2A configuration models a four-loop PWR plant equipped with upper head injection (UHI). For Test S-UT-3, S-UT-6, and S-UT-8 UHI was not used. The test configuration is divided into two loops. One loop represents a single loop of a four-loop PWR plant; this loop contains the break simulator and is called the broken loop. The other loop represents the remaining three loops and is called the intact loop. The system includes a pressure vessel with simulated PWR internals but with an external downcomer, active steam generators in both the intact and broken loops, and pumps in the intact and broken loops.
For SEMISCALE natural circulation tests NC-2, NC-3, and NC-8, only part of the Mod-2A system was used as shown in Fig. 5 . The broken loop was removed and the vessel/downcomer penetrations for the broken loop hot and cold legs were capped. Normally, the Mod-2A system includes an intact loop pump; however, this was removed and replaced with a special instrumented spool piece. This spo.01 piece contained an orifice to represent the scaled hydraulic resistance of a pressurized water reac- tor coolant pump in the locked rotor (stopped) configuration. The ves- sel was modified from the normal Mod-2A configuration for these tests by,removing the vessel upper head. This was necessary to ensure a uniform heatup of the entire system and to avoid condensation on upper head structures. The pressurizer was used only to establish the ini- tial conditions for the tests and was then isolated.
The Westinghouse liquid level indicating system was connected to the SEMISCALE vessel as shown in Fig. 6. This equipment was supplied by Westinghouse.
As shown in the figure, the tested Westinghouse RVLIS consisted of t h r e e di f fe ton . t ia1 . pressure measurements with connections beink made at

Fig. 4 . SEMISCALE MOD-2A system as configured for S-UT teat series.

P U M P - . SUCTION
ORNL-DWG 82-13127
c - ' I
VESSEL
TOP CAP
Fig. 5. SEMISCALE MOD-2A system configuration for separate effect natural circulation-isometric. L -

WEST PLEN
WESTINGHOUSE UPPER A P IDENTIFIER HEAD SENSOR 1 LV+160+421
2 LV-13A+421
Fig. 6 . Instrumentation of significance for the Westinghouse RVLIS tests at SEMISCALE.
3 D-Vl3A I1 +421
DENSITY VESSEL 7 7 CM RVXUH+339 -
UPPER HEAD
HEAD
RV UH+173+
- +I60 .
U M SENSOR -UPPER SUPPORT
- WESTINGHOUSE HOT LEG SENSOR
REF L lNE FOR COLD LEG $ ALL BUT CORE
AREA INSTRUMENTATION
- - -TOP o r ACTIVE CORE
'--RV*AB+332 BETWEEN HEATER ROD ROWS A a B
- BETWEEN HEATER ROD COL 2 A 3
-P3X23+113 T I-- CORE AREA
MEASUREMENT COORDINATE.^^^ C M - P2t23+13 ABOVE BOTTOM OF HEATED LENGTH
REF L lNE FOR CORE -PI t AB-6 AREA
INSTRUMENTATION 1 BOTTOM OF ACTIVE HEATERS)
\ \ 4 LV-578-13M - ~ ~ ~ u ~ ~ ~ ~ M p
5 LVD+29-170 6 LVD+29-578 7 DV+29-13A

the vessel top and bottom and on the hot leg pipe. The installation at SEMISCALE is intended to be typical of that in a PWR; thus, the three sensors, the hydraulic isolators, and the differential pressure transmitters were stated by Westinghouse to be functionally the same as standard RVLIS components and were installed and checked out by Westinghouse and SEMISCALE personnel in a manner typical of a PWR installation. The vessel and dynamic differential pressure transmit- ters are connected to the top of the upper head and the bottom of the lower plenum of the vessel in this configuration. The upper head transmitter is connected to the upper head and the intact loop hot leg. The differential pressure measurements were recorded on a three-pen strip chart recorder and also transmitted to the input to the SEMISCALE data acquisition system.
The resident SEMISCALE'instrumentation included several dp cells that spanned selected regions of the facility and numerous densitom- eters that measured the fluid density at various locations. The dp cells were denoted by AP1 through AP7 and the densitometers were labeled starting with RV (Fig. 6). The dp and densitometer readings were used to determine collapsed liquid level and two-phase froth level in the vessel, respectively. These level measurements were compared with values determined by the Westinghouse RVLIS. There are many other system measurements that were referred to. during this evaluation such as temperatures, flows, pump speeds, and pressures.
At this point, we need to define the terms collapsed liquid level, two phase froth level and coolant level. Collapsed liquid level is the level that would remain after all the bubbles or air were removed from a two-phase mixture. The two-phase froth level is used in this report to mean the level to which two-phase mixture still exists. This level also defines coolant level. The last two levels were iden- tified by a sharp transition in the vessel densitometer output that dropped to a steam-only value. This transition indicated that the froth level had passed this densitometer location.

IV. RVLIS PERFORMANCE AT SEMISCALE TESTS
The RVLIS was installed at SEMISCALE and tests were run in conjunction with several scheduled experiments including small break LOCA and natural circulation tests. RVLIS data were recorded so that system performance could be evaluated for each test. Table 1 identi- fies the tests for which data were taken. Also, this table identifies, in the reference column, the INEL reports that contain RVLIS data and SEMISCALE data. Further, the computer system at INEL was utilized (via phone line hookup) to run an INEL program called MAGNUM. This program was used.to analyze the test data stored on "data bank", an NRC- sponsored data storage facility for data from' LOCA experiments through- out the country, including SEMISCALE.
1V.A. Test S-UT-3
The detailed analysis of this test is given in ref. 8, and a summary of this analysis is given below.
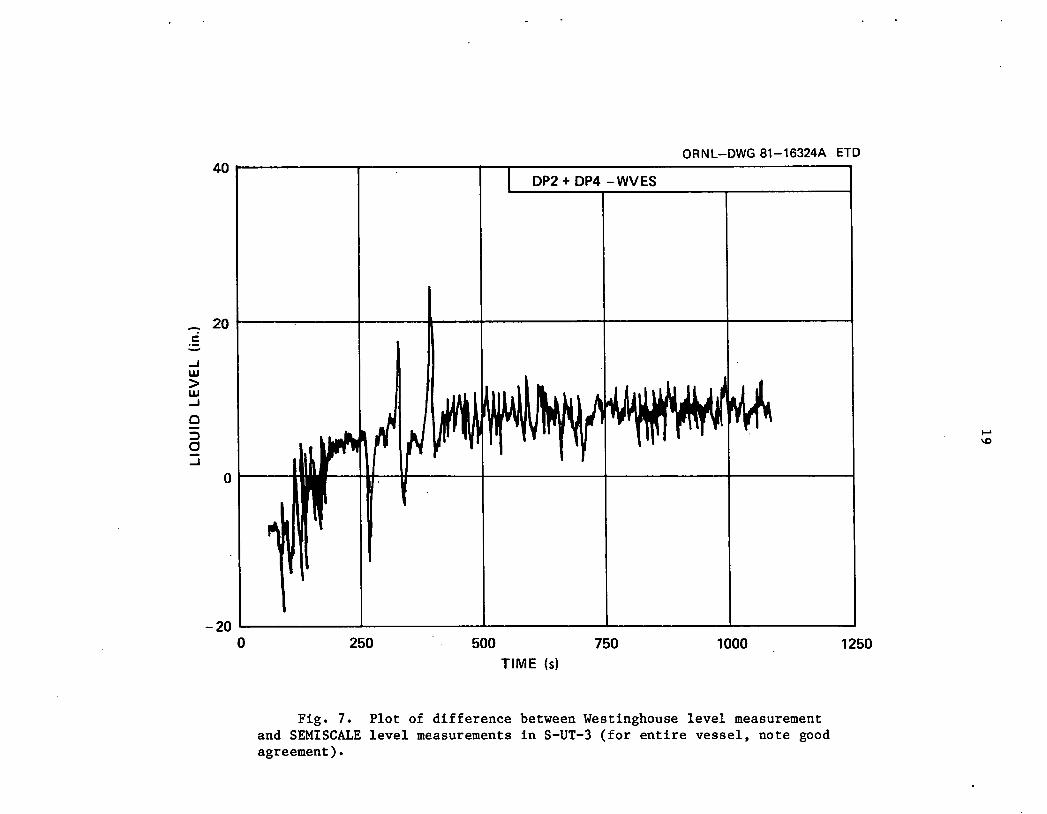
An analysis of the performance of the Westinghouse RVLIS showed that the RVLIS gave level readings comparable to the SEMISCALE level instrumentation over similar spans (see Fig. 7). In most cases, the Westinghouse RVLIS produced a level measurement that was approximately equal to the vessel collapsed liquid level (as measured by SEMISCALE dp cells) and that was lower than the two-phase froth level (Fig, 8 is a plot of the Westinghouse RVLIS compared to the froth level that was determined from SEMISCALE densitometers). An exception to this was found when either the Westinghouse or SEMISCALE system spanned the upper core support plate. Differences of up to 150 cm (60 in.) were observed between both these measurements and the SEMISCALE level meas- urements that did not span the upper core support plate. Figure 9 illustrates this condition and Fig. 10 is an expanded view of the same data. The apparent cause of the differences was a flow restriction in the guide tube structure between the upper head and upper plenum that caused an additional pressure drop. A discussion of these structural differences follows.
According to Westinghouse, the structural differences between SEMISCALE and Westinghouse reactors probably caused the large differ- ences illustrated in Fig. 10. Their schematic of SEMISCALE, illustrated in Fig. 11, shows that the solid guide tubes block flow communication between the upper plenum and the upper head resulting in a two-phase mixture being trapped between the water in the upper plenum and water in the upper head. A typical design of a Westinghouse reactor is illustrated in Fig. 12. These reactors have perforated guide tubes which allows good flow communication between upper plenum and the upper head. According to Westinghouse, the guide tube in SEMISCALE would have to be perforated before the SEMISCALE tests would accurately simulate the behavior of a Westinghouse reactor.

Table 1. SEMISCALE tests with Westinghouse RVLIS
Test No. Test Type References
S-UT-3 2 112% cold-leg break
S-UT-6 5% cold-leg break 9, 10, ll*
S-UT-7 5% cold-leg break with UHI 9, 10, 11*
S-NC-2B natural circulation, single-, 12" two-phase, and ref lux
S-NC-3 natural circulation two-phooc
S-NC-8 natural circulation, reflux * .
S-UT-8 repeat of S-UT-6 with modif ,ed 13* guide tube
100% cold-leg break, survival t test for RVLIS
SC-WSPT-20 Frequency Response Teat of RVLIS 14
A NOTE: Data for analysis was obtained from Data Bank via phone
line hookup.
I'1nformal transmission of data from W. W. Tingle (INEL) to C. N. Miller (ORWL).
ORNL-DWG 81-16324A ETD 40
500 750 1000 1250 TIME (s)
DP2 + DP4 - WVES
I
r a
Fig. 7. Plot of difference between Westinghouse level measurement and SEMISCALE level measurements in S-UT-3 (for entire vessel, note good agreement).
-

+a ORNL-DWG 81-16261 ETD
. .
- 125 0 1001 200 300 400 500 600 700 BOO 900
F, ig . 8. Comparison of Westinghouse vessel level measurement with coGlant level in SEMISCALE as determined by densitometsrs for S-UT-3. Wote: Verti'cal transition on this curve indicates passfng two-phase level by a densitometer;
1000
I I I 1 1 I 1 \ \
- \
TIME AFTER RUPTURE (s)
\ \ \
- COLD LEG \\
\ \ \
-
- / r = Oa6' - MINIMUM TWO-PHASE LEVEL
a = 0.69
-. \---- \
-
BY y -DENSITOMETERS
- i ' . -,---- - a = 0.83
- -
I 1 I I I I I 1 I
\- --- \ .
\ - .
( V a = 0.717 -
-
\ 7
-
-

ORNL-DWG 81-16321A ETD
0 250 500 750 1000 1250 . TIME (s) . 7 ,
Fig. 9. Westinghouse collapsed liquid level (upper head to lower plenum) compared with SEMISCALE collapsed liquid level (-13 cm to lower plenum) for S-UT-3.

I
AREA OF CONCER
-
- i5o.a
130 330 52 0 730 330
TIME (sec)
NOTE: CURVE 1 - I ( V L 13 M-578) - WVESLV I = DlFFERErJCE CURVE 2 - VL 13 M-578
ORN L-DWG 81-16322A ETD
200
Fig. 10. Collapsed liquid l eve l s i n SEMISCALE a s neasured by dP. 4 (VL13M-578) and WESLY. (Expanded plot of Fis. 9 with difference between two traces plc~xted.

ORNL-DWG 81-17871A ETD
INLET NOZZLE
Fig. 11. SEMISCALE s luu la t loa of a FWRI

ORNL-DWG 81-17870A ET-D
Fig. 12. Westinghouse reactor vessel configuration (PWR).

Evalua t ion of guide tube e f f e c t
The guide tube i n t he upper plenum a t SEMISCALE con ta in s s l o t s on ly near t h e bottom. The s l o t s permit flow communication between t h e upper plenum and upper head. S ince t he s l o t s a r e r e l a t i v e l y low i n t h e upper plenum, Westinghouse a n a l y s i s of t he S-UT-3 t e s t r e s u l t s and the SEMISCALE conf igu ra t i on showed t h a t a two-phase mixture may be t rapped i n t h e guide tube when t h e r e is a f r o t h around t h e lower end of t h e tube. This t rapped mixture adds t o t he l e v e l measured by t h e Westinghouse RVLIS system, but not t h e SEMISCALE dp measurement from -13 t o -578 s i n c e t h i s measurement does not span t h e upper co re support p l a t e . To eva lua t e t h i s explana t ion f o r t h e d i f f e r e n c e between these two dp measurements, t h e fol lowing c a l c u l a t i o n s were made.
The t o p of t h e f i r s t s l o t i s -36 cm below the cold l e g and t h e bottom of t h e fou r th s l o t is a t -91 cm. The guide tube is approxi- mately 437 cm long. The "added" l e v e l due t o t h e two-phase mixture i n t h e guide tube can be c a l c u l a t e d by
"Added" l e v e l = ( 1 - a) H, ( 2 )
where i s t h e void f r a c t i o n i n t h e guide 'tube and H is t h e guide tube he igh t .
These d i s c r epanc i e s between Westinghouse and SEMISCALE co l l apsed l i q u i d l e v e l s were w i th in t h e range of t h e c o r r e c t i o n s c a l c u l a t e d from t h e va lues assumed f o r t h e he igh t of t h e mix ture i n t h e guide tube . Thus, t h e guide tube e f f e c t appeared t o be a p l a u s i b l e explana t ion f o r t h e d i f f e r e n c e s between Westinghouse and SEMISCALE dP measurements.
1V.B. T e s t s S-UT-6 and S-UT-7
De ta i l ed a n a l y s i s of S-UT-6 and S-UT-7 i s g iven i n r e f . 11; a summary of t h a t a n a l y s i s is contained i n t h i s s e c t i o n . The r e s u l t s of the two t e s t s , S-UT-6 and S-UT-7, were s i m i l a r t o those found i n test S-UT-3. The Westinghouse RVLIS provided an e s t i m a t e of t he co l lapsed l i q u i d l e v e l which was, i n gene ra l , l e s s than the a c t u a l two-phase f r o t h l e v e l as measured by t h e SEMISCALE dens i tometers . I n S-UT-6, t h e l e v e l s measured by t h e Westinghouse RVLIS were g r e a t e r than the l e v e l s measured by the SEMISCALE dp ins t rumenta t ion by up t o 200 cm. This is shown i n F ig . 13. In - S-UT-7, t h e RVLIS was used only between t h e h o t l e g and bottom of t h e v e s s e l (UHI p l an t con f igu ra t i on ) . This e l imi- nated t he reg ion of suspected f r i c t i o n l o s s e s i n t h e upper suppor t p l a t e a r e a , and the agreement with t he SEMISCALE ins t rumenta t ion was q u i t e good, w i th in 10 cm ( s e e Fig. 14) .
A s a r e s u l t of t he d i f f e r e n c e s between the v e s s e l co l l apsed l i q u i d l e v e l and Westinghouse ins t rumenta t ion ou tpu t , and s i n c e Westinghouse claimed t h a t t h e s e d i s c r epanc i e s were due t o s t r u c t u r a l d i f f e r e n c e s between SEMISCALE and Westinghouse PWRs, i t was decided t h a t new o r repent t e s t s should be run w i t h the i n t e r n a l guide tube

ORNL-DWG 81-20108 E
0 WVESLV D VL13M-570
WVESLV
TIME AFTER RUPTURE (s)
in.
Fig. 13. Westinghouse vessel level measurement compared to SEMISCALE VL13M-578 for S-UT-6.

ORNL-DWG 81-20107 ETD
600
6 VL13M-578
COLD LEG CENTERLINE
-200 0 200 400 600 800
TIME AFTER RUPTURE (s)
Fig. 14. Comparison of Westinghouse vessel level measurement to SEMISCALE VL13M-578 for S-UT-7.

modified to improve SEMISCALE'S simulation of a Westinghouse PWR. A test, S-UT-8, was added for this purpose; details of this test are contained later in this report.
1V.C. Analysis of SEMISCALE Natural Circulation Tests
A series of natural circulatton tests were conducted in which the RVLIS was employed. For these experiments the upper head was removed, thus the upper tap position for the Westinghouse dp cells was 184 cm and the SEMISCALE upper tap elevation was 140 cm. The next three sections of this report contain the analysis of the performance of the RVLIS far tests WC-2D, WC-3, and NC-0.
Analysis of NC-2B
The Westinghouse upper head measurement, WUPHLV, covers a span from +I84 cm to +21.6 cm (the hot leg centerline) in the SEMISCALE vessel. The SEMISCALE dp cell that spans approximately the same dis- tance as WUPHLV covers +I40 to -13 cm, AP2. The Westinghouse upper head level measurement is shown in Fig. 15. The measurement indicates that the liquid level drops quickly in the upper plenum which empties by 50 s. Three refills and drains were sensed by WUPHLV at 95 s, 280 s, and 480 s, respectively. In the latter two, the upper plenum was completely filled. The level inferred from a SEMISCALE dp cell, VL140-13M, followed a similar pattern to WUPHLV as depicted in Fig. 16. The upper plenum initially drained in 50 s and refilled and drained three times at 95 s, 280 s, and 480 s. Within limits of the spans covered by the SEMISCALE and Westinghouse measurements, the two agreed within '10 cm.
The collapsed level in the entire vessel was monitored by WVESLV and in t'he core 'by SEMISCALE dp cell, VL13M-578. The liquid levels inferred in the vessel from these two instruments are plotted as func- tions of time in Fig. 17 and Fig. 18, respectively. These two plots can only be compared when WVESLV in Fig. 17 reads below -13 cm because the two measurements cover different spans.. Both level measurements indicated !he same overall trend with an initial decrease and two su'b- sequent refills and drains. The Westinghouse system gave a liquid level value approximately 40-50 cm (15-20 in.) higher than VL13M-578 during most of the test. During the two refills (280 s-and 480 s) WVESLV showed a level of nearly +200 cm (vessel full of water)' whereas VL13M-5/8 was not at its upper tap, indicating some voids. Further investigation showed, however, that the densitometer readings were at water-only values throughout the vessel at 280 s and 480 s. It appears that dp 4 (VL13M-578) may have an offset error or slight inaccuracies in its temperature-density corrections for this test, thus causing the level to be -40 cm instead of at its upper tap (-13 cm). This offset could explain why the WVESLV reading is -40-50 cm higher than VL13-578.


ORNL-DWG 82-13129
TIME I s ]
Fig. 16. Upper plenum collapsed liquid level by SEMISCALE VLL411-13M for MC-2B. I


ORNL-DWG 82-13131
F i g . 18. SEMISCALE dP l e v e l measurement from t-ae upper plenum t o th? bottom of the v e s s e l (VL13M-578) f o r NC-25.
i

Density measurements from vessel densitometers showed the froth level to be above -11 cm for the first 600 s after rupture except for one brief 20 s period (420-440 s). This dip in froth level is indi- cated by densitometer readings as low as -313 (RV*23+183) for two periods of -2-3 s each. The vessel level measured by the Westinghouse RVLIS was lower than the froth (coolant) level for the entire 600 s. At the dip at 420-430 s, WVESLV read -370 cm; which was less than the froth level by 60 cm.
From the comparisons with SEMISCALE instrumentation (dp cells and vessel densitometers) the Westinghouse RVLIS measured and trended the vessel coolant level. The RVLIS provided estimates of coolant level which were 40-50 cm (15-20 in.) less than the collapsed liquid level value obtained with the SEMISCALE instrumentation. The collapsed liquid level indication was higher than SEMISCALE measurements but the 40-50 cm'is within the uncertainties of either SEMISCALE or Westinghouse measurement systems and may be caused by an offset in the SEMISCALE dp cell;
Analysis of NC-3
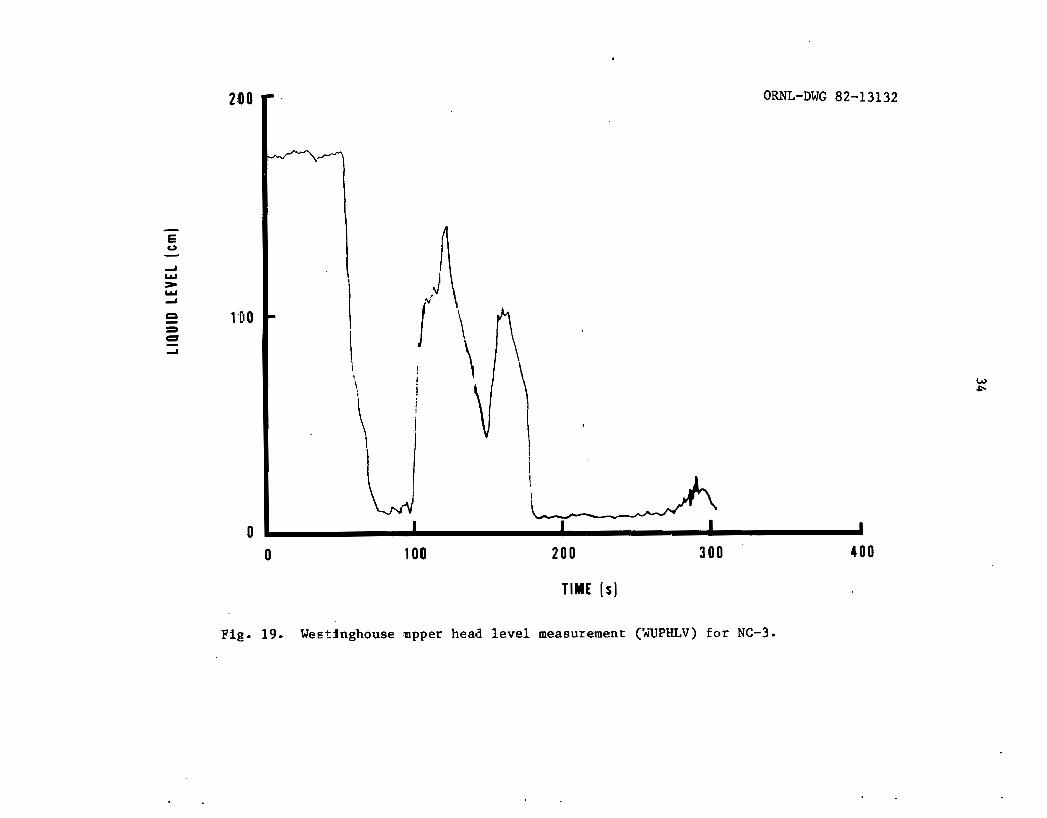
The collapsed liquid level in the upper plenum was monitored by Westinghouse dp cell, WUPHLV, and SEMISCALE dp.cel1, VL140-13M. The span for WUPHLV was +I84 to +21.6 cm. The two dp measurements agreed with each other to within '10 cm ( 2 4 in.). The only apparent disagree- ment was caused by the collapsed level being above or below the dp taps of one of the systems. For example, if the two-phase froth zone spanned the upper tap of a dp transmitter, the output would be the equivalent of the collapsed liquid level of only the froth between the taps. The froth level above the upper tap would not be measured because it is a common mode signal for the dp cell. For example, at 10 s the WUPHLV was reading +I75 cm (Fig. 19) and the SEMISCALE dp measurement (Fig. 20) showed a level of +I40 cm but this was at its upper tap location, the. maximum value for the SEMISCALE dp measurement (+I40 to -13 cm).
The collapsed liquid level for the entire vessel was inferred from WVESLV (Fig. 21) and VL140-578 (Fig. 22). WVESLV indicated a vessel full of water for the first 50 s after rupture which agreed with WUPHLV and VL140-13M, Fig. 19 and Fig. 20, respectively. The SEMISCALE dp cell, however, did not indicate a full vessel; but a collapsed level at +I10 cm, 30 cm below its upper tap. The reason-for this discrepancy is unknown, but it appears to be an offset in the SEMISCALE dp system. At 80 s, the We~tinghouse dp measurement showed an approximate level of 30 cm. Both upper head measurement systems indicated a collapsed liqnid level of -20 cm. The SEMISCALE measurement, VL140-578, showed a level of 0 cm; once again a different value than the Westinghouse and the two upper head readings of 20-30 cm. Throughout the remainder of the test, the indicated SEMISCALE level was 30-50 cm lower than Westinghouse value, WVESLV. Both vessel level systems tracked each other very well as functions of time; they indicated peaks and valleys in the vessel level within a few seconds of each other.
2 0 0 3 0 0
TIME 1s)
ORNL-DWG 82-13132
Fig. 19. Weerlnghouse apper head level measurement (hXPHLV) for NC-3.


ORNL-DWG 82-13135
* TIME [s]
L Fig. 22. SEMISCALE dP level measurement for the entire vessel ' . (VL140-578) for NC-3.
R , . , 4,. r
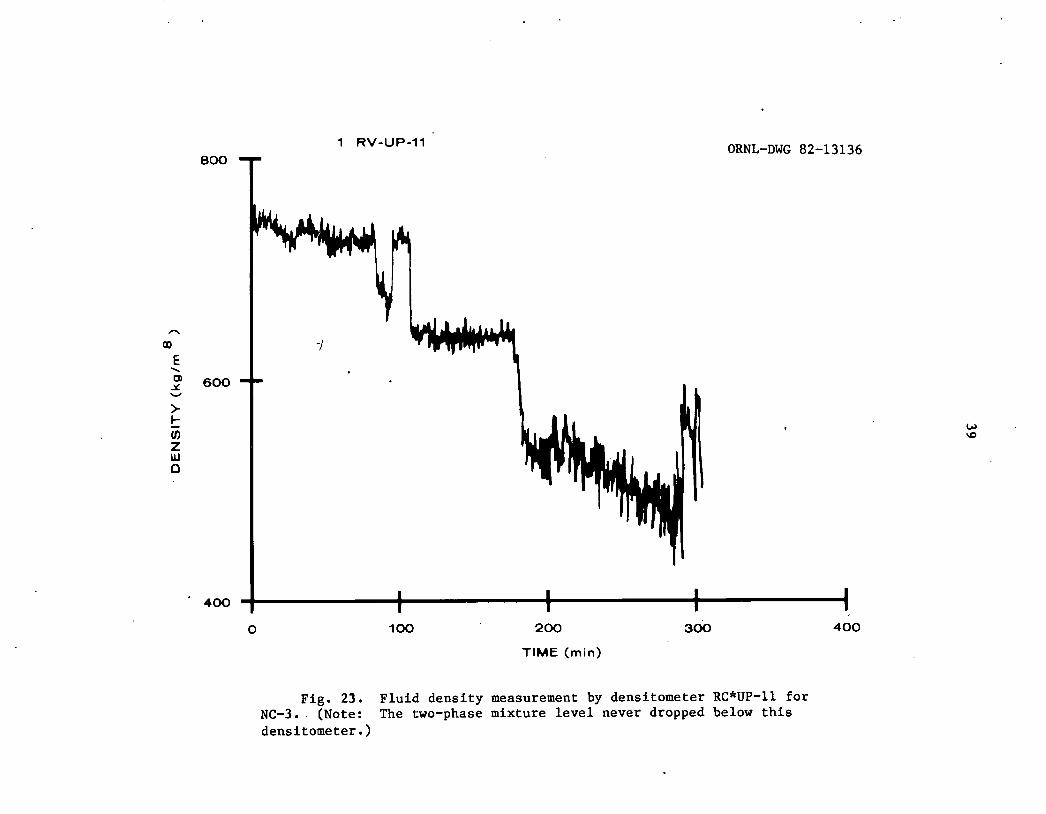
The in-vessel froth level remained at least as high as -11 cm for the duration of the test (indicated by vessel densitometer RV*UP-11, Fig. 23) and for most of the test the level indicated by WVESLV was above -11 cm. No higher elevation densitometer measurements were taken; thus, further comparisons between vessel froth level by densi- tometers and the Westinghouse vessel level are not possible.
The Westinghouse RVLIS (both WUPHLV and WVESLV) compared very well with SEMISCALE dp measurements. The two level systems, SEMISCALE and Westinghouse, indicated similar level phenomena such as vessel drains and refills at similar times. Despite an apparent offset in the SEMISCALE vessel level system (VL140-578), the Westinghouse and SEMISCALE collapsed liquid levels were within 50 cm (20 in.) of each other. This is within the expected uncertainty of the Westinghouse RVLIS which is 60 cm (24 in.).
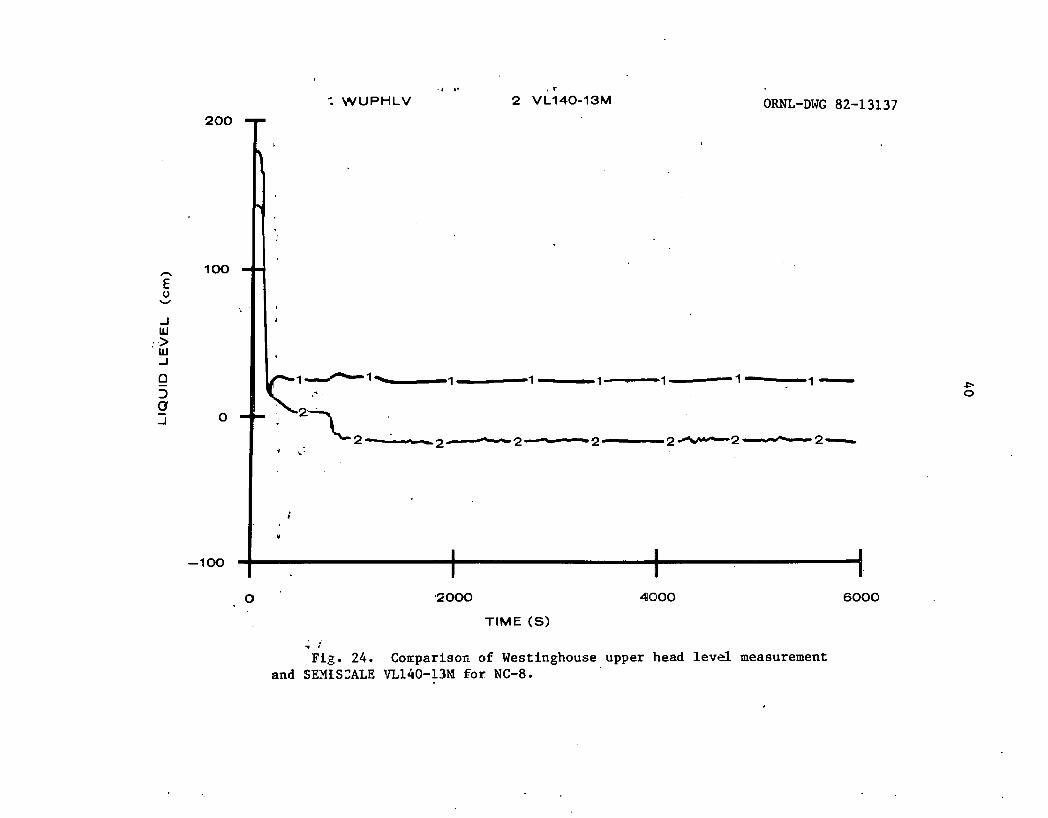
Analysis of NC-8
The collapsed liquid level in the upper plenum was monitored by part of the Westinghouse RVLIS, WUPHLV (taps at +I84 and +21.6 cm) and by the SEMISCALE dp cell spanning +I40 to -13 cm (VL140-13M). In Fig. 24, both systems showed a rapid draining of the upper plenum; WUPHLV showed a level at its lower tap (+21.6 cm) by 140 s. The SEMISCALE dp measurement. indicated a level at its bottom tap (-13 cm) by 900 s but it reached +20 cm at 140 s. Both measurements indicated a vessel full of water at test start, WUPHLV at +I84 cm and VL140-13M at 140 cm.
The Westinghouse vessel level, WVESLV. and the SEMISCALE dp cell which spanned the entire vessel, VL140-578, are plotted in Fig. 25. The two measurements tracked each other very well, both in time and in indicated level. The level measurements agreed to within '10 cm (4 in.) for 6000 s. Both vessel level indications were similar to the upper plenum dp readings until the water level dropped below the lower tap of the upper plenum dp cells. The range of vessel levels, in this test, was from a full vessel, +I84 cm, to -400 cm' (equivalent to nearly 3/4 of the core being uncovered).
A possible point that may cause confusion in analyzing the data from this test is illustrated in Fig. 26. The indicated level at 400 s by a SEMISCALE dp cell spanning +I40 to -105 was -20 cm. An apparent discrepancy was found when noting that the level given by WESLV was -100 cm. However, upon further investigation one finds that the dp cell from +I40 to -105 was really indicating the collapsed liquid level between its taps, not the vessel collapsed liquid level. A dp cell that does not span the entire vessel will give the correct vessel level only under the special circumstances: (1) when the top of the two- phase froth level is between the two taps, and (2) when there is water- only below its lower tap. For this test, a two-phase mixture existed in almost the entire vessel at 400 s; thus, the above two criteria were
ORNL-DWG 82-13136
200
TIME (min)
Fig. 23. Fluid density measurement by densitometer RC*UP-11 for NC-3. (Note: The two-phase mixture level never dropped below this densitometer.)
. I *. 2 WUPHLV ORNL-DWG 82-13137
TIME ( S )
. r Fig. 24. Couparison of Westinghouse upper head level measurement
and SEMESZALE VLl4O-13M 50r NC-8.

\
1 WVESLV
ORNL-DWG 82-13138
. 0 2000 4000 6000 4
.. . TIME ( s ) ) .
' - . . . ~ i ~ ; '25. Comparison of WVESLV and SEMISCALZ ~ ~ 1 4 0 - 5 7 8 for NC-8
(both measurements span the entire vessel).

ORNL-DWG 82-13139
- 2 0 0 0 0 2 0 0 0 4 0 0 0 6 0 0 0 8 0 0 0 TIME I s ]
Fig. 26- Collapsed l i q u i d l e v e l between 140 cm and -105 cm by SE3ISCALE dP measurement (VLl50-105) f o r NC-8.

not met and dp cell 140-105 did not indicate vessel level, only the collapsed liquid level between its taps.
A comparison between two-phase froth level, as determined by ves- sel densitometer measurements, and WVESLV is shown in Fig. 27. The collapsed liquid level determined by WVESLV followed the two-phase level very closely, '20 cm (8 in.). The dashed-line is the minimum two-phase level; the actual froth level may be somewhat higher. The WVESLV level value, collapsed liquid level, is much closer to the froth level elevation for this test than for either S-UT-6 or S-UT-7. In S-UT-6 and S-UT-7, the WVESLV measurement was 70-200 cm helow the froth level as compared to 20 cm.in NC-8.
Another method for locating the coolant level (two-phase froth level) is by monitoring the temperature excursions of the heater rods. When inadequate cooling occurs in a heated core, there is a sharp increase in heater rod temperature in the regions not cooled. This method can provide a check on the level estimates from the SEMISCALE and Westinghouse dp systems. The lowest temperature excursion noted was at -366 cm; which occurred at 2000 s. At this time, the vessel collapsed level by WVESLY was at -390' cm and vessel densitometers indi- cated a minimum froth level of -383 cm (Fig. 27). At 4000 s, a sudden increase in heater rod temperatures occurred as low as -313 cm (+I83 in the core). The WVESLV was indicating -365 cm while vessel densitometer information yielded a froth level of -383 cm. For both cases, the location of the heater rod temperature excursions followed the trend of two-phase froth level. In addition, the Westinghouse vessel level measurements were lower than the locations of the temperature excursion on the heater rods.
In summary, the Westinghouse RVLIS provided vessel level informa- tion that was below the coolant (froth) level. Both the WUPHLV and WVESLV compared very favorably with SEMISCALE dp cells covering similar spans. The agreement between collapsed liquid levels from the Westinghouse and comparable SEMISCALE dp instrumentation was within '10 cm (4 in.).
S-NC-2B, S-NC-3 and S-NC-8 Conclusions
For the three natural circulation tests examined in this report, the Westinghouse RVLIS provided unambiguous information as to vessel coolant levels by giving collapsed liquid level estimates that were always lower than the two-phase froth level as determined by vessel densitometers. These RVLIS liquid level estimates compared favorably with SEMISCALE dp instrumentation with simllar vessel tap locations.
1V.D. S-UT-8 Test
Test S-UT-8 was a 5% cold leg break LOCA simulation and a repeat of Test S-UT-6 with some exceptions. The exception that most directly concerns the performance nf the RVLIS consisted of modifications made

ORNL-DWG 82-13140
P MINIMUM TWO-PHASE
TOP OF
ACTIVE CORE
LOCATION AND DIRECTION
I
I
I I I I I -
L - 4 5 0 0 1 0 0 0 2 0 0 0 3 0 0 0 . 4 0 0 0 5 0 0 0 6 0 0 0
TIME [s]
F i g . 27. Comparison of vessel level by WVESLV to minimum two-phase froth level by densitometers for NC-8.

in the fluid flow paths between the upper plenum and upper head. 'These modifications were made in an attempt to have SEMISCALE more closely simulate the hydraulic resistance and flow paths of a Westinghouse PWR.
The modifications to the SEMISCALE facility that are noted in Fig. 28 included:
1. Support columns were plugged so that all flow must go through the guide tube (note this modification was not implemented properly as will be discussed later)
2. Upper head-downcomer bypass line resistance was increased to limit flow to 2.3% of total coolant flow. -
3. UHI tube was removed
4. Guide tube resistance was reduced to 9.3% of bypass line resistance
5. Eight 7.57-mm-diam holes were drilled in the guide tube to permit flow and reduce fluid levels trapped in the guide tube.
Additional instrumentation added to the vessel is shown in Fig. 29. These additions made it possible to rompare flow rates and pressure dropA ratios from SEMISCALE with those from a Westinghouse PWR.
Unfortunately, Test S-UT-8 did not go as planned. Instrument ports in the support column in the upper head region were inadvertently left open and flow passed through these ports from the upper head to the upper plenum. As a result, the upper regions of the vessel drained very quickly and reduced the period available for comparison of Westinghouse and SEMISCALE collapsed liquid level measurements.
The guide tube effect was to be reduced by the holes added to the guide tube. The previous argument presented by Westinghouse was that fluid in the region surrounding the bottom slots in the guide tube would be drawn into the tube and trapped, thus addidg eo che Westinghouse vessel level measurement and causing an erroneously high value. The bottom slots range in elevations from -36 to -91 cm. In S-UT-6, the two-phase froth level surrounded the bottom slots until -500 s (Fig. 30). In S-UT-8 the froth level dropped below the bottom slot (at -91 cm) by -150 s (Fig. 31). After 150 s, in S-UT-8, only steam surrounds the bottom guide tube slots, thus only steam could have been drawn into the guide tube. Level measurement errors due to steam trapped in the guide tube would be insignificant. Therefore, only data recorded before 150 s should be used in evaluating the guide tube effect and guide tube modifications.
Further inspection showed that the broken and intact loop pumps coasted down to low levels by 85 s. Differential-pressure data from rupture until 85 s will include flow-induced and density-head terms. After 85 s the differential pressure will be dominated by the density
46
ORNL-DWG 82-13141
X M o D I F l C A T I O N S MADE TO BETTER S IMULATE WESTINGHOUSE STD PLANT
UPPER HEAD/UPPER P L E N U M FLOW PATHS AND HYDRAULIC RESISTANCES.
- X REMOVE U H I TUBE AND CAP OPENING
SUPPORT COLUMNS PLUGGED RESISTANCE
BU 'THAT A L L F L O W MUST 00 REDl lCFn TO 9.3x
THRU GUIDE T U B E OF BYPASS L l N E RESISTANCE
x BYPASS L INE RESISTANCE INCREASED TO L I M I T BYPASS SUPPORT PLATE FLOW TO 2.3% OF TOTAL FLQW- X 8 HOLES 7.57 M M
D I A TO PERMIT STEAM F L O W A T
TURBINE METER HIGH L I O U I D
G U I D E TUBE
BYPASS L INE SUPPORT COLUMNS
UPPER PLENUM
UPPER CORE
HEATER ROD
GROUND H U B
Fig. 28. Upper-head upper-plenum schematic drawing showing modifications completed for S-UT-8.

ORNL-DWG 82-13142
PRESSURE TAP ELEVATIONS
STANDPIPE
C O L U M N PLUG
G U I D E TUBE
TFVX U P + 79
UPPER CORE PLATE
I1 II I1 I I 11 II GROUND H U B
Fig. 29. Required upper-head upper-plenum instrumentation for S-UT-8.

Fig. 30. Collapsed liquid l eve l in the upper plenm by SEMISCALE VL13M-105 for S-UT-5.

ORNL-DWG 82-13143 -
I
m
.
I
I
i I 1 I 1 I 1 I
MAGNUM 1 . 3 0 9 . 2 4 . 5 1 0 2 / 0 2 / 8 2 0 1 0 0 2 0 0 , 3 0 0 , 4 0 0 5 0 0 6 0 0 7 0 0 8 0 0
TIME ( s ]
TEST SUT8
Fig. 31. Vessel collapsed liquid l eve l between -13 and -105 cm by SEMISCALE dP VLl3M-105 for S-UT-8.

term. Thus, the available region for data comparisons to evaluate the guide tube effect is approximately 85 to 150 s. A plot of the RVLIS output compared to SEMISCALE output is in Fig. 32 and Fig. 33 is an expansion of this plot.
A comparison of collapsed liquid level data from WVESLV and SEMISCALE dp cell covering +I35 to -578 cm is shown in Table 2 and Fig. 34. The two instruments agree to within f30 cm for the range of interest. A comparison for similar instruments in S-UT-6 yielded dif- ferences of up to 200 cm. At least for the short time interval for which "valid" data is available, the agreement between Westinghouse and SEMISCALE dp measurement of collapsed liquid level was much improved over the S-UT-6 test.
The ratio of pressure drops between the downcnmor and upper head and upper head and upper plenum were on the order nf 8-20 to 1. According to Westinghouse the ratio should be -15 to 1 for a Westinghouse PWR. Thus, we conclude that hydraulic resistances were matched reasonably well in S-UT-8.
Summarizing, the results of S-UT-8 tend to validate Westinghouse's assertions that the guide tube at SEMISCALE caused the discrepancies in collapsed liquid levels for the S-UT-3 and S-UT-6 tests. Marked improvement was noted in comparing liquid levels in S-UT-8 and hydraulic resistances seemed to match values in a Westinghouse PWR.
1V.E. SIB1 Test
This test was a 100% cold leg break and the purpose of recording the Westinghouse RVLIS indication was to assess its survivability and Lo deLeruln@ if I t trended coolant love1 upon vcasel recovery. Flgvse 35 Is a plor of the Westinghouse narrow range dp transmitter output. Also, plotted on this figure are passage points of the two-phase froth level indicated by SEMISCALE densitometers. The RVLIS output always indicated a lower level than the two phase froth level. The Westinghouse RVLIS did survive and it did trend the coolant level during the partial recovery.
1V.F. SC-WSPT-20 (Frequency Response) Test
Because the dp transmitters in the RVLIS system are located remotely at different distances from the measurement points (45, 60, and 75 m for the three tap points), there was a concern that the system time response would be too slow. Time response can be calculated from system frequency response. The frequency response of the RVLIS system as installed in SEMISCALE and to be installed in reactor vessels was calculated using the equation from ref. 15:

ORNL-DWG 82-13144
MAGNUM 1 .3 0 5 . 4 5 . 5 9 0 3 / 0 4 / 8 2
TIME [ S ]
Fig. 32. Comparison of WVESLV [curve (I)] and SEMISCALE VL135-578 [curve (2)J for S-UT-8.

2 2 0 . 0 1 0 0 . 0 1 4 0 . 0 '160.0 2 6 0 . 0 3 0 0 . 0
TIME IS] I . ,
:Fig. 33. Conpariaon of WVESLV [curve (I)] 2nd PL135-578 [curve (2)], expanded version of Fig. 28 between 100-300 s, for S-UT-8. 1
I
Table 2. Comparison of collapsed liquid level data for WVESLV and SEMISCALE VL135-578 for S-UT-8
Time after
rupture WVESLV VL135-578 ( s ) (cm) . (cm)

ORNL-DWG 82-13146
Fig. 34. D i f f e r a c e i n measured l e v e l between WIESLV and VL135-578 as a function of time a f t e r rupture f o r S-UT-8.

ORNL-DWG 82-13147
T IME I S ]
TEST SIB1
Fig. 35. Plot of Westinghouse narrow range unit (WVESLV) vs time for test S-IB-1 (* and t indicate passage of two phase froth level).

where
f = the three db frequency response in Hz, 4.22 = constant in the equation to take care of unit conversion,
- D = inside diameter of the tube in inches, L = length of the tube in feet
dp/dv = compliance of the dp transmitter ITT Barton Model 752,
supplied by vendor to be 1000 in. of water
0.2 inW3 ,
2 units are in lb/in. .
in. 3
Calculating the frequency response of the Westinghouse level moni- toring system from equation (3) yields:
Rise time is 2.2(l/f) = 2.2 1/0.81 = 2.73 s. This time constant compares favorably with the SEMISCALE test data that are shown below.
Further, the SC-WSPT-20 test was conducted to measure the frequency response. The test was run by pressurizing the system (3EMISCALE) to about 7.1 ml?a and inducing a otcp changc down to (oommon mode pressure change) about 2.1 mPa. The pressure step was created by opening and closing a drain valve. Data were taken and the time response was measured. Figure 36 illustrated the narrow range dp response to this change which was begun at 2 s. It can be seen that the output is st its final value after about '10 s or an 8 s response time. The normal response of system to within 10% of final value is 2.3 time constants and with the calculated time constant of 2.73 s, the calculated response is 6.28 s. The test data in Fig. 36 indicated that the output is within 10% of the final value at about 8.5 s which is a difference of 6 .5 s. The comparison of calculated to measured'tiae responac ohowcd c~rccllcnr agrccmcnt:
2.3 time constant response of the RVLIS = 6.28 s calculated and 6.55 s measured. 0.22 s difference
The other data curves from this test 'showed comparable results, and were not included since they contained no new information. There is good correlation between estimated and measured time response, and this time response is within the required time response of a vessel level measurement system.

ORNL-DWG 82-13148

V . CONCLUSIONS
The c o n c l u s i o n s of o u r a n a l y s i s a r e :
1 . I n S-UT-3 and S-UT-6 t e s t s t h e RVLIS i n d i c a t e d a lower l e v e l t h a n t h e two-phase f r o t h l e v e l . [The f r o t h l e v e l can o n l y be i d e n t i f i e d when i t p a s s e s a p a r t i c u l a r ( f rom two phase t o s team, o r v i c e v e r s a ) d e n s i t o m e t e r a t some p o i n t i n t ime . T h e r e f o r e , t h e f r o t h l e v e l is known on ly a t some d i s c r e t e p o i n t i n t ime (when a d e n s i t y t r a n s i t i o n o c c u r s a t a p a r t i c u - l a r d e n s i t o m e t e r ) . Because t h e f r o t h l e v e l is known a t o n l y d i s c r e t e p o i n t s i n t ime , maximum o r minimum e r r o r s o r d i f f e r - ences a r e h a r d t o d e f i n e . ] Dur ing t h e s e t e s t s t h e RVLIS i n d i - c a t e d a h i g h e r l e v e l t h a n t h e v e s s e l c o l l a p s e d l i q u i d l e v e l by a s much a s 200 cm. T h i s was caused by d i f f e r e n c e s i n t h e upper i n t e r n a l s of SEMI'SCALE; s e e below f o r c o n c l u s i o n s reached a s a r e s u l t of t h e r e p e a t t e s t , S-UT-8.
2 . I n t h e S-UT-7 t e s t t h e RVLIS showed good c o r r e l a t i o n w i t h t h e v e s s e l c o l l a p s e d l i q u i d l e v e l and t h e RVLIS i n d i c a t i o n was w e l l below t h e f r o t h l e v e l . Th i s was a U H I t e s t .
3 . I n t h e S-NC-2B, S-NC-3 and S-NC-8 t e s t s t h e r e was good c o r r e l a t i o n between t h e c o l l a p s e d l i q u i d l e v e l and t h e RVLIS o u t p u t . The RVLIS i n d i c a t i o n s were l e s s t h a n t h e two-phase c o o l a n t l e v e l .
4 . I n t h e S-UT-8 ( a r e p e a t o f S-UT-6) t e s t t h e RVLIS showed good c o r r e l a t i o n t o t h e c o l l a p s e d l i q u i d l e v e l ; t h e d i f f e r e n c e was l e s s t h a n 3% throughout t.he t e s t , T h i s t e s t conf i rmed t h e Westinghouse g u i d e tube e f f e c t d i s c u s s e d i n S e c t . 1 V . A .
5. The t ime response t e s t conf i rmed Westinghouse c a l c u l a t i o n s o f t h e RVLIS r e s p o n s e t ime (one t ime c o n s t a n t of 2.7 s ) .
6 . The Westinghouse RVLIS s u r v i v e d a n i n t e r m e d i a t e b reak S-IB-1 ( a 100% c o l d l e g b reak) and was a b l e t o prov ide t r e n d i n g i n f o r m a t i o n a f t e r t h e blowdown.
For t h e r e a d e r ' s i n f o r m a t i o n , Westinghouse h a s a l s o ana lyzed t h e t e s t d a t a t h a t was e v a l u a t e d i n t h i s r e p o r t and t h e i r a n a l y s e s a r e documented i n r e f s . 16 and 17.

REFERENCES
1. "Report of the president's Commission on The Accident at Three Mile Island," Washington, D.C., 1979, pp. 81-141.
2. Ibid., p. 63 (see also p. 72).
"TMI-Related Requirements for New Operating Licenses," NUREG-0694, Office of Nuclear Reactor Regulation, U.S. Nuclear Regulatory Commission, 1980.
Interim Report No. 3 on TMI-2, Advisory Committee on Reactor Safeguards, May 16, 1979.
"Clarification of TMI Action Plan Requirements," NUREG-0737, U.S. Nuclear Regulatory Commission, 1980.
"Summary Report - Westinghouse Reactor Vessel Level Instrumentation System for Monitor.ing Inadequate Core Cooling (7300 System)," December 1980.
W. W. Tingle and R. W. Golden, Installation and Initial Test Data Report: Westinghouse Reactor Vessel Level Indicating System Performance During SEMISCALE Test S-UT-3, EGG-SEMI-5494, June 1981.
J. E. Hardy, G. N. Miller, S. C. Rogers, and W. L. Zabriskie, "Advanced Two-Phase Flow Instrumentation Program, Quarterly Progress Report for July-September 1981," NUREGICR-2204, Vol. 3, ORNLITM-8162, Oak Ridge National Laboratory, Oak Ridge, Tennessee, January 1982.
W. W. Tingle, "Test Data Report on Westinghouse Reactor Vessel Level Indicating System Performane During SEMISCALE Tests S-UT-6 and S-UT-7," EGG-SEMI-5551, August 1981.
Ronald A. Larson and L. Bruce Clegg "Experiment Data Report for SEMISCALE Mod-2A Small Break Test Series (~ests S-UT-6 and S-UT-71," NUREGICR-2355, EGG-2132, November 1981.
J. E. Hardy, G. N. Miller, S. C. Rogers and W. L. Zabriskie, "Advanced Two-Phase Flow Instrumentation Program ~uarterl~ Progress Report for October-December- 1981," NUREGICR-2204., Vol. 4, ORNLITM-8231.
Thomas M. O'Connell, "Experiment Data Report for SEMISCALE Mod-2A Natural Circulation Tests S-NC-2B, S-NC-3 'and S-NC-4B," NUREGICR- 2454, EGG-2141, December 198.1.
W. W. Tingle, "SEMISCALE Mod-2A 5% Break Experiment S-UT-8, Experiment Operating Specification," EGG-SEMI-5685, December 1981.

14. R. W. Golden and W. W. Tingle, "Westinghouse Special Pressure Test, SC-WSPT-20" including informal data received from INEL, January 1982.
15. G. N. Miller, W. L. Zabriskie, and K. G. Turnage, "Frequency Response and Heat Transfer in a dp Measurement System with Long Sensing Lines," Proc. 26th Intern. Instrumentation Symp., Seattle, Washington, May 1980, Instrumentation Society of America, pp. 451-464.
16. "Westinghouse Evaluation of RVLIS Performance at. the SEMISCALE Test Facilty for Test S-UT-8," January 1982, Westinghouse Electric Corp., Nuclear Energy Systems, P.O. Box 355, Pittsburgh, Pennsylvania.
17. "Westinghouse Evaluation of RVLIS .Performance at the SEMISCALE Test ~ a c i l i t ~ , I i December 1981, westinghouse ~lectric Corp., Nuclear Energy Systems, P.O. Box 355, Pittsburgh, Pennsylvania.

NUREG/CR-~~~O ORNLITM-8336 D i s t . Category R2
Anderson Anderson Craddi ck Hardy Ho f f man Johnson Kress L o t t s Mi l l e r Mossman Mynat t
T. W. Robinson, Jr. S. C: Rogers J. A. Stevens D. G. Thomas H. E. Trammel1 W. L. Zabr i sk ie ORNL Pa ten t Sec t ion Cen t r a l Research L ib ra ry Document Reference Sec t ion Laboratory Records Department Laboratory Records (RC)
'Externa l D i s t r i b u t i o n
W. W. T ingle , Jr., EG&G Idaho, P.O. Box 1625, Idaho F a l l s , I D 83415 C. W. Connell, Jr., Babcock & Wilcox, Nuclear Power Generation Div is ion , Lynchburg, VA 24505 R. E. Bryan, Combustion Engineering, 1000 Prospect H i l l Road, Windsor, CT 06095 W. G. Lyman, Westinghouse E l e c t r i c Company, Monroeville Nuclear Center , P.O. Box 355, P i t t s b u r g h , PA 15230 Direc tor , Div is ion of Reactor S a f e t y Research, Nuclear Regulatory Commission, Washington, D.C. 20555 Di rec to r , Reactnr Divis ion DOE, ORO, Oak Ridge, TN 37830 Off i c e of Ass i s t an t Manager f o r Energy Research and Development, DOE, ORO, Oak Ridge, TN 37830 Di rec to r , Reactor Safe ty Research Coordinat ion Of f i ce , DOE, Washington, D.C. 20555 H. D. W i l l s , General E l e c t r i c , 175 Curtner S t . , MC 214, San Jose , CA 94303 P. G. Bai ley, E l e c t r i c Power Research I n s t i t u t e , P.O. Box 10412, Pa lo Alto, CA 94303 Technical Information Center , DOE, Oak Ridge, TN 37830 Given d i s t r i b u t i o n a s shown i n ca tegory R2 (10-NTIS) Spec ia l NRC Externa l D i s t r i b u t i o n
aU.S. GOVERNMENT PRINTING OFFICE: 1982-546-067/163