Embed Size (px)
Citation preview
O V E R B E R G W A T E R

1. AREAS AND MUNICIPALITIES SERVED, ACHIEVEMENTS AND CHALLENGES Relationship with Municipalities Non-Financial Performance Audit Report Income Statement Balance Sheet Financial Indicators & -Ratios Bulk Water Sales & Revenue Bulk Water Tariffs Expenditure (Bulk Provision) Reserve
2. THE TARIFFS PROPOSED BY THE DEPARTMENT ON BULK WATER
Graphic presentation of tariffs Principles of tariff structure Process
2
3

4
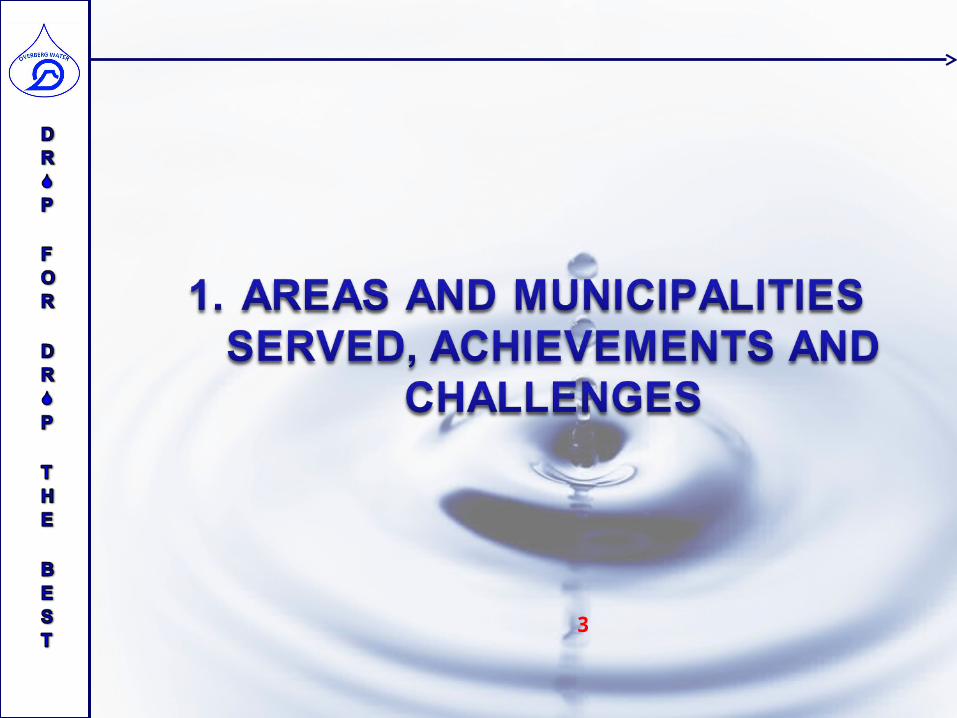
Serious work injuries → zero
Absenteeism → 2,7%
Staff turnover → 9%
Labour unrest → zero
Water quality → Class 1 (SANS 241, 2006)
Water loss → 4,8%
5
Unqualified Audit
Positive report on systems & procedures
Relevant legislation adhered to
6

Consolidated Income Statement
Income from and expenses financed through
Bulk Water Sales Retail Water Sales (as secondary activity) Other Secondary Activities Reserve
7
Operating79%
Admin Fees4%
Investments8% TWK
8%
Other1%
Total Income: R25 017 Total Expenses: R22 613
Direct Labour45%
Energy10%
Maintenance7%
Raw Water2%
Chemicals8%
Depreciation8%
other20%
R’000
8
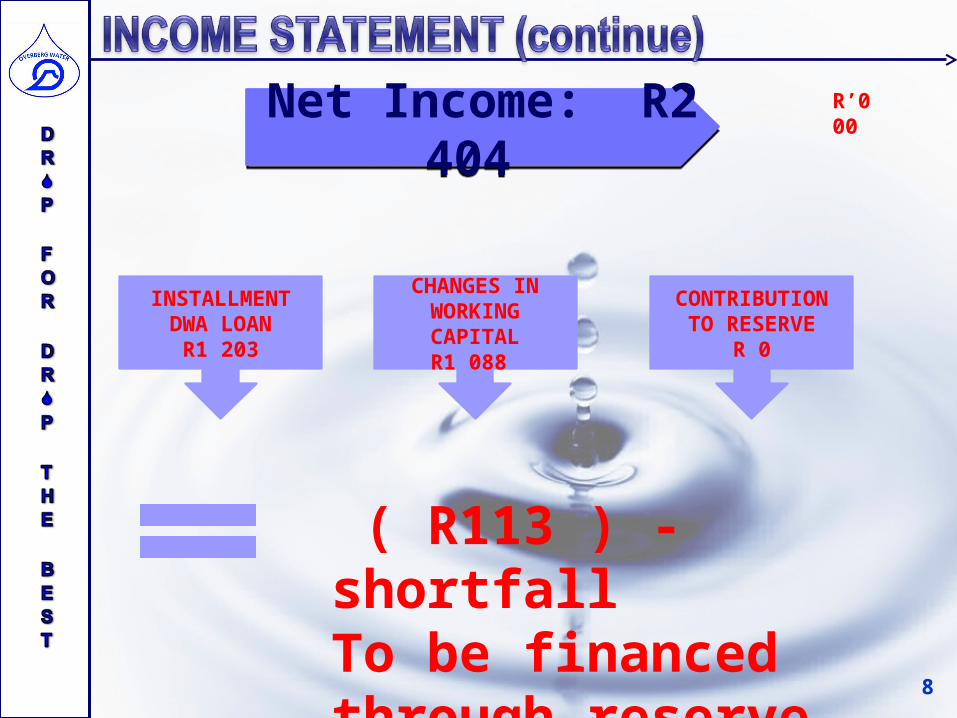
Net Income: R2 404 Net Income: R2 404
INSTALLMENTDWA LOAN
R1 203
CONTRIBUTION TO RESERVE
R 0
( R113 ) - shortfall To be financed through reserve
R’000
CHANGES IN WORKING CAPITAL
R1 088
9
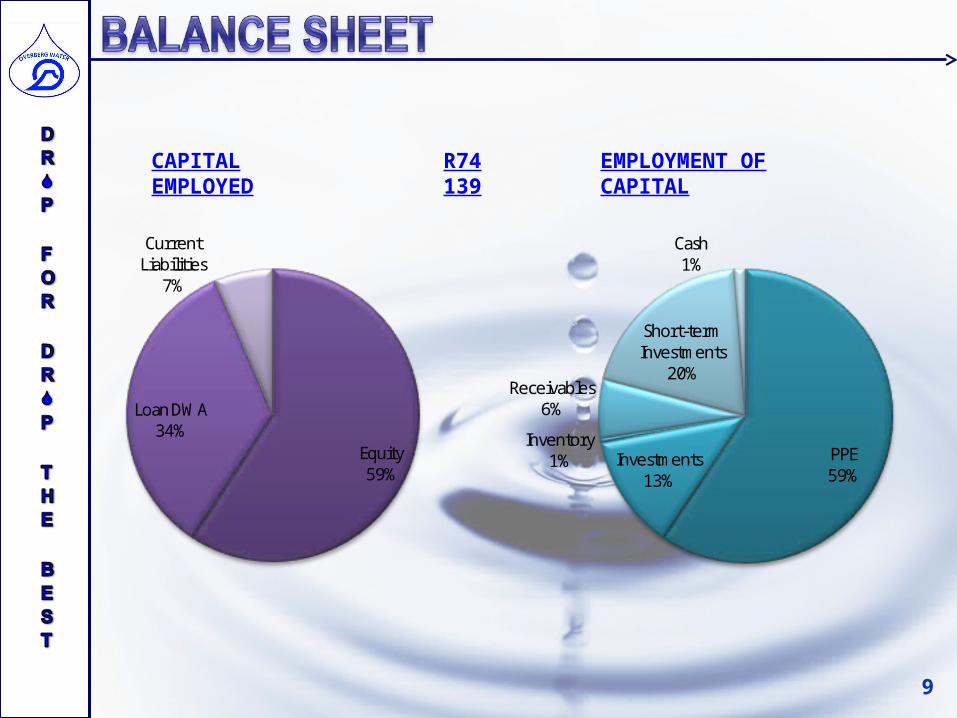
EMPLOYMENT OF CAPITALCAPITAL EMPLOYED
Equity59%
Loan DWA34%
Current Liabilities
7%
PPE59%
Investments13%
Inventory1%
Receivables6%
Short-term Investments
20%
Cash1%
R74 139

10
Indicator / Ratio 2008/09 2007/08
Net Profit %(Net Profit ÷ Sales x 100)
12,07% 13,18%
Return on Assets(Net Income ÷ Total Assets x 100)
3,24% 3,55%
Return on Equity(Net Income ÷ Equity x 100)
5,47% 6,16%
Current Ratio(Current Assets ÷ Current Liabilities)
4,32 6,18
Debtors Days (Water Consumers)(Debtors ÷ Sales x 365)
73 days 65 days
Debt to Assets(Total Debt ÷ Total Assets x 100)
41% 42%
Cost of Capital(Interest paid ÷ Total Debt x 100)
0% 0%
Debt to Equity(Total Debt ÷ Total Equity)
69% 74%
Asset turnover (times / year)(Sales ÷ Total Assets)
0,27 x 0,27 x
CAPEX R4 mil R3,6 mil

11
BULK WATER SALES : VOLUME
BULK WATER SALES : R
2,082,309 2,004,958 2,013,499
2,177,237 2,166,872 2,135,262
2006/2007 2007/2008 2008/2009
m3
Mun Farmers5,143,866 5,273,040 5,661,264
5,377,775 5,698,873 6,085,497
2006/2007 2007/2008 2008/2009
m3
Mun Farmers
4 259 546 4 171 830 4 148 761
10 971 91310 521 64111 746 761
(2,1%) (0,6%)
4,3% 7,1%

2008/2009
R 2,83
2007/2008
2006/2007
R 2,63
R 2,476,5%
7,7%
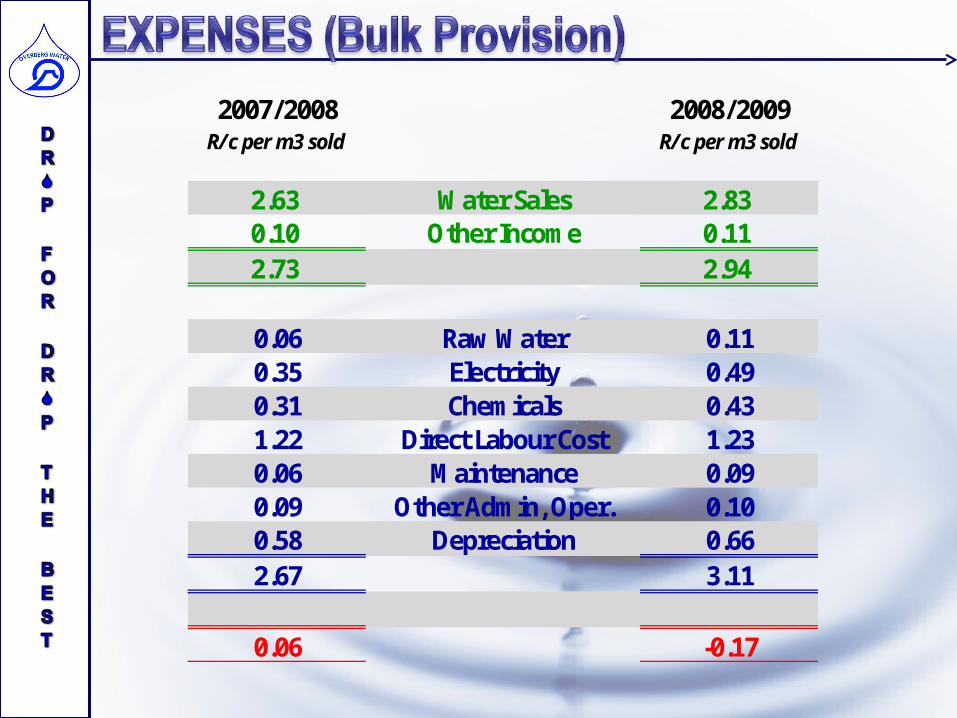
2007/2008 2008/2009R/c per m3 sold R/c per m3 sold
2.63 Water Sales 2.830.10 Other Income 0.112.73 2.94
0.06 Raw Water 0.110.35 Electricity 0.490.31 Chemicals 0.431.22 Direct Labour Cost 1.230.06 Maintenance 0.090.09 Other Admin, Oper. 0.100.58 Depreciation 0.662.67 3.11
0.06 -0.17

Operating Capital, 3 672
HR & Pensionars,
344
Furniture, Equipment & Vehicles,
1 929
Infrastructure, 18 883
TOTAL: R 24 906
R’000
RESERVE FOR INFRASTRUCTURE REFURBISHMENT : R18,8 MILLION
5 YEAR INFRASTRUCTURE REFURBISHMENT PROGRAMME R45 MILLION
15

Graphic presentation of tariffs
Principles of tariff structure
Process
16

17
Availability Fee: Caledon – R136 920 / per monthVAT excluded Heidelberg/Slangrivier – R47 220 / per month
Witsand – R13 475 / per month
PER HOUSEHOLD PER MONTH (VAT excluded)

Availability fee of 30% of allocation.
Sliding scale tariff – the higher the water use, the higher the unit cost of the tariff.
The use on the sliding scale is based on the number of households as supplied by and agreed with the municipality.
The tariff structure supports WC/DU.
• A too high choice of allocation by the Municipality will result in a higher unit cost if the consumption is low.
• The lower the consumption, the lower the unit cost.
The effective cost of water and the water tariff is therefore in the hands of the Municipality – it requires careful and sound planning and management from their side.
At the same time Overberg Water has much more clarity and lower risk.
18

Prescribed Process
Consultation Process
Response from National Treasury & Salga
Viability as result of tariff proposal
Impact on end users
19