Embed Size (px)
Citation preview
7
MPEG-Video Sources in ATM-Systems A new approach for the dimensioning of policing functions
o. Rose, M. Ritter
University of Wiirzburg, Institute of Computer Science Am Hubland, D - 97074 Wiirzburg, Germany Tel: +49931 8885507, Fax: +49931 8884601 e-mail: [email protected]
Abstract
The ATM transport concept of B-ISDN allows for an efficient and flexible use of network resources for variable bit rate services with high transmission rates. One major traffic source which will make use of this capability will be video and multimedia applications. The changes in the cell rate of such sources are caused by the compression of the digitized video frames. The MPEG (ISO Moving Picture Expert Group) coding scheme is expected to be the major compression algorithm for the first ATM video applications. Thus there is a need to find source traffic descriptors of MPEG video sources which can be used efficiently for connection admission control and usage parameter control for these sources. Besides the peak cell rate, the sustainable cell rate might be used for these purposes. Both the ITU-T and the ATM Forum propose the Generic Cell Rate Algorithm (GCRA) for policing these two cell rates. In this paper we develop a novel model for the cell stream of an MPEG video coder output and present a cell loss analysis for a GCRA monitoring its sustainable cell rate. A variety of ATM link capacities and sustainable cell rate parameters are studied to show the accuracy of the analysis and to test the appropriateness of the sustainable cell rate as traffic descriptor of MPEG video sources.
Keywords
Asynchronous Transfer Mode, Cell Rate Monitoring, Discrete-Time Analysis, Generic Cell Rate Algorithm, MPEG, Multi-Media, Video
T. Hasegawa et al. (eds.), Local and Metropolitan Communication Systems© Springer Science+Business Media Dordrecht 1995
MPEG-video sources in ATM-systems 109
1 Introduction
The Asynchronous Transfer Mode (ATM) has been proposed by the ITU-T as the transport mechanism for the future Broadband Integrated Services Digital Network (B-ISDN). In ATM networks, information is transferred in small packets of fixed size, called cells. Each cell consists of a payload field of 48 Byte and a 5 Byte header. The concept of small cells and the asynchronous transfer technology allows for an efficient and flexible use of network resources for Constant Bit Rate (CBR) and Variable Bit Rate (VBR) services as well as high transmission rates. The transmission rate of an ATM link depends on the medium used. Typical values are 150 Mbps and 600 Mbps.
Video and LAN-to-LAN traffic are said to be the major traffic source in the first implementation phase of ATM networks. These traffic sources are generally VBR sources and have a bandwidth demand ranging from some hundred kbps to a few Mbps. Due to the asynchronous resource sharing technology, statistical multiplexing between different VBR sources can be performed and therefore peak bit rate allocation is not necessary. This results in a lower total bandwidth requirement than in case of the traditional Synchronous Transfer Mode (STM). On the other hand, different traffic streams can now interfere with each other contrary to common STM networks. This interference leads to Cell Delay Variation (CDV) and may also cause cell losses in overload situations.
Besides of Call Admission Control (CAC), priority control and additional congestion control functions, the Usage Parameter Control (UPC) is one control function defined by the lTU-T. UPC is defined as the set of actions performed by the network to monitor and control traffic at the user access. Its aim is to prevent the malicious or unintentional excessive usage of network resources which would lead to Quality of Service (QoS) degradation.
At connection setup, a traffic contract is negotiated between the user and the network provider. The user specifies his bandwidth requirements by a number of parameters and the network commits to meet the negotiated QoS parameters as long as the user complies with its traffic contract. Mandatory source parameters are the Peak Cell Rate (PCR) and the CDV tolerance. In addition, the Sustainable Cell Rate (SCR) and the Burst Tolerance (BT) can be specified optionally; if used, they must be specified together. One possible QoS parameter which the network commits to meet is the cell loss ratio.
For video sources, the MPEG standard [8] is until now one of the most promising coding schemes which allows for a remarkable data reduction. However, a high degree of correlation on several time scales can be observed for MPEG coded sequences. Because of this, the dimensioning of UPC algorithms is a crucial task if a cell rate lower than the PCR should be policed. In [16] several UPC algorithms have been compared for a number of video sequences. However, the results are mainly based on simulation and the video data which was used was produced by non-standard experimental coders.
In this paper we focus on the policing of real MPEG video traffic and present a new analytical approach for the dimensioning of the Generic Cell Rate Algorithm (GCRA)
110 Part Two ATM Traffic Characterization
which is suggested by the ITU-T and the ATM Forum for cell stream monitoring in ATM networks. In Section 2 we describe the GCRA. A brief introduction to video sources is given in Section 3 and a new MPEG video model is developed. The dimensioning problem of source parameters for MPEG video sources is addressed in Section 4. In Section 5 we present an analysis to estimate the cell loss probability if MPEG video sources are monitored by the GCRA. The algorithm is based on a discrete-time analysis technique developed in [20]. Numerical results to show the accuracy of the derived algorithm are discussed in Section 6 where we also look at some scaling effects occurring when MPEG video sources are policed. The paper ends with some concluding remarks.
2 Usage parameter control in ATM environments
Until now, the only source parameter which is specified in all known standards is the PCR of a connection. The PCR of an ATM connection is defined as the inverse of the minimum time between the generation instants of two cells from this connection. At the moment, there are discussions about the introduction of a second source parameter for VBR traffic, the SCR. It is thought as an upper bound of the average cell rate of a connection and when used, it must be specified together the BT. Using a second source parameter like the SCR, the network operator may allocate less resources to a connection than if only the PCR is specified, while meeting the required QoS. PCR and SCR are defined at the Physical Layer Service Access Point (PHY SAP) and the conformance of cell streams according to them is monitored at the UNI.
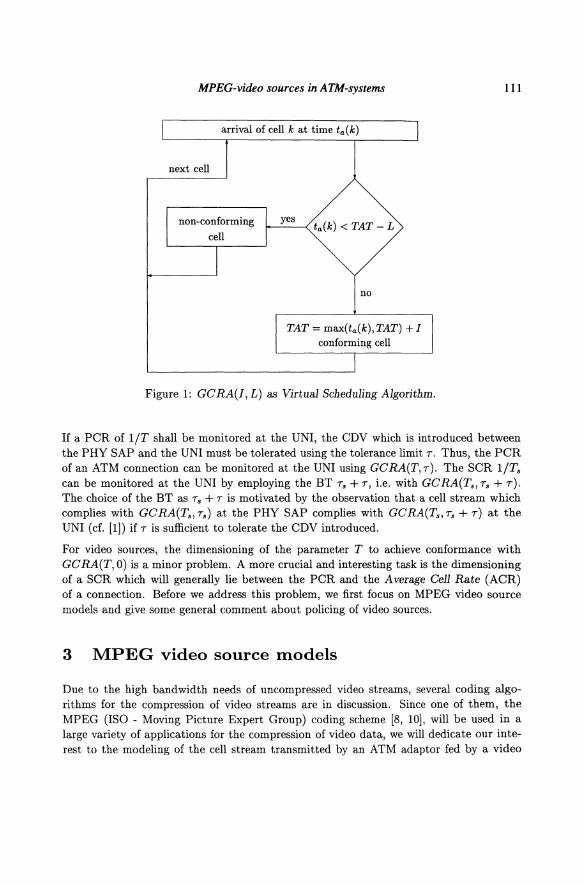
For PCRISCR monitoring, the GCRA was proposed by the ATM Forum [1]. There are two versions of the GCRA, namely the Virtual Scheduling Algorithm and the ContinuousState Leaky Bucket Algorithm, which are equivalent in that sense that both versions declare the same cells of a cell stream as conforming or non-conforming. We refer in this paper to the Virtual Scheduling Algorithm which is depicted in Figure 1. This algorithm was proposed first by the ITU-T Draft Recommendation 1.371 [9] to monitor the PCR.
In general, the GCRA uses a Theoretical Arrival Time (TAT) for the earliest time instant the next cell is expected to arrive. The TAT is initialized with the arrival time of the first cell of the connection ta(I). For PCR enforcement, cells should be spaced by I (the increment of the GCRA), but due to CDV a tolerance with limit L is employed. If cell number k arrives later than expected, the TAT for the next cell is given by the actual arrival time plus the increment. If cell number k arrives before its TAT but not before TAT - L, then the TAT for the next cell is derived by incrementing the TAT for cell number k by I. Contrary, the TAT is not changed and the cell is declared as non-conforming if it arrives earlier than TAT - L. For the enforcement of the SCR, the increment parameter I is set to Ts for a SCR of liT., and the limit parameter L = Ts
corresponds to the maximum size of a burst that can be transmitted at PCR (cf. [1]). Cells which are identified as non-conforming can either be discarded or optionally be tagged to be discarded in case of network congestion. Here, we assume cell discarding.
MPEG-video sources in ATM-systems
next cell
arrival of cell k at time ta (k)
no
TAT = max(ta(k), TAT) + I conforming cell
Figure 1: GCRA(I, L) as Virtual Scheduling Algorithm.
111
If a PCR of liT shall be monitored at the UNI, the CDV which is introduced between the PHY SAP and the UNI must be tolerated using the tolerance limit T. Thus, the PCR of an ATM connection can be monitored at the UNI using GCRA(T,T). The SCR liT. can be monitored at the UNI by employing the BT T. + T, i.e. with GCRA(T .. T. + T). The choice of the BT as T. + T is motivated by the observation that a cell stream which complies with GCRA(T., Ts) at the PHY SAP complies with GCRA(T., T8 + T) at the UNI (cf. [1]) if T is sufficient to tolerate the CDV introduced.
For video sources, the dimensioning of the parameter T to achieve conformance with GCRA(T,O) is a minor problem. A more crucial and interesting task is the dimensioning of a SCR which will generally lie between the PCR and the Average Cell Rate (ACR) of a connection. Before we address this problem, we first focus on MPEG video source models and give some general comment about policing of video sources.
3 MPEG video source models
Due to the high bandwidth needs of uncompressed video streams, several coding algorithms for the compression of video streams are in discussion. Since one of them, the MPEG (ISO - Moving Picture Expert Group) coding scheme [8, 10], will be used in a large variety of applications for the compression of video data, we will dedicate our interest to the modeling of the cell stream transmitted by an ATM adaptor fed by a video
112 Part Two ATM Traffic Characterization
coder using this coding scheme.
A video sequence consists of a series of frames, each containing a two-dimensional array of pixels. The number of frames per second as well as the number of lines per frame and pixels per line depend on national standards. For each pixel, both luminance and chrominance information is stored. The compression algorithm is used to reduce the data rate before transmitting the video stream over communication networks.
In MPEG coded streams, there are three types of frames, each using a slightly different coding scheme:
I-frames use only intra-frame coding, based on the discrete cosine transform and entropy codingj
P-frames use a similar coding algorithm to I-frames, but with the addition of motion compensation with respect to the previous 1- or P-framej
B-frames are similar to P-frames, except that the motion compensation can be with respect to the previous 1- or P-frame, the next 1- or P-frame, or an interpolation between them.
Typically, I-frames require more bits than P-frames. B-frames have the lowest bandwidth requirement. The different ways in coding frames result in different statistical properties of each frame type.
After coding, the frames are arranged in a deterministic periodic seqnence, e.g. "IBBPBB" or "IBBPBBPBBPBB", which is called Group of Pictures (GOP) throughout the rest of the paper. These frames are packetized into ATM cells. We assume a payload of 48 Bytes per cell. All frame sizes mentioned in this paper are measured in cells.
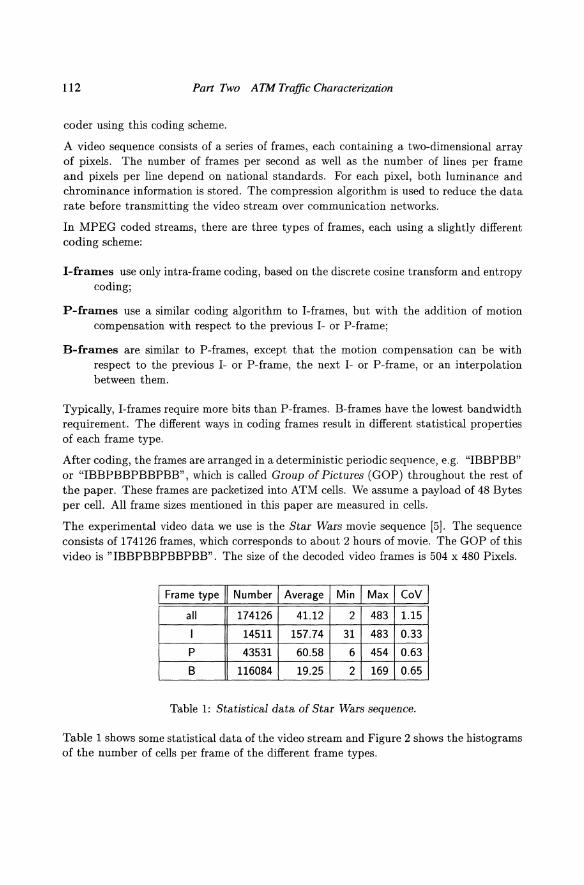
The experimental video data we use is the Star Wars movie sequence [5]. The sequence consists of 174126 frames, which corresponds to about 2 hours of movie. The GOP of this video is "IBBPBBPBBPBB". The size of the decoded video frames is 504 x 480 Pixels.
I Frame type II Number I Average I Min I Max I CoV I all 174126 41.12 2 483 1.15
I 14511 157.74 31 483 0.33
P 43531 60.58 6 454 0.63
B 116084 19.25 2 169 0.65
Table 1: Statistical data of Star Wars sequence.
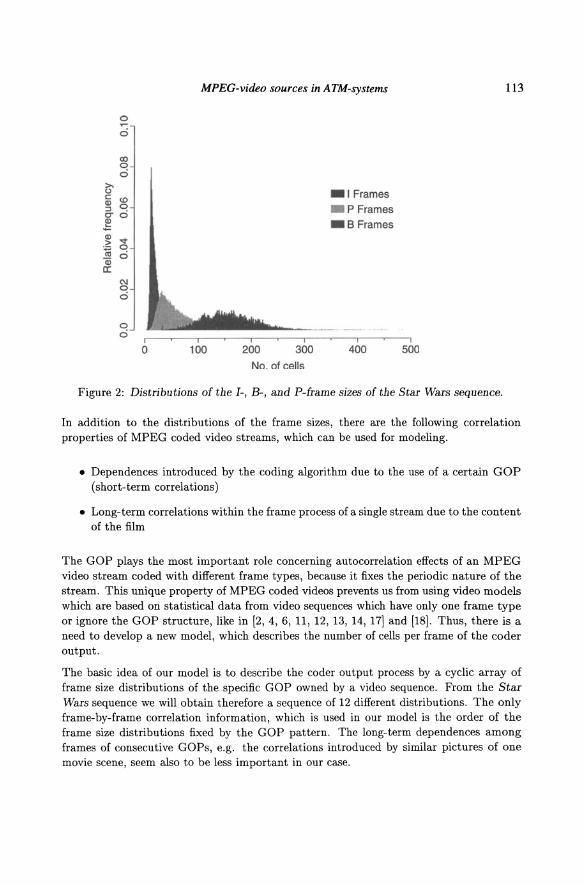
Table 1 shows some statistical data of the video stream and Figure 2 shows the histograms of the number of cells per frame of the different frame types.
0
0
to 0 0
>-(,) c: <0 Q) ::l 0 C- O ~ Q)
V > ~ 0
ai 0
II: C\I 0 0
0 0
I
0
MPEG-video sources in ATM-systems
I
300 No. of cells
_I Frames _ P Frames _S Frames
I
400 I
500
Figure 2: Distributions of the 1-, B-, and P-frame sizes of the Star Wars sequence.
113
In addition to the distributions of the frame sizes, there are the following correlation properties of MPEG coded video streams, which can be used for modeling .
• Dependences introduced by the coding algorithm due to the use of a certain GOP (short-term correlations)
• Long-term correlations within the frame process of a single stream due to the content of the film
The GOP plays the most important role concerning autocorrelation effects of an MPEG video stream coded with different frame types, because it fixes the periodic nature of the stream. This unique property of MPEG coded videos prevents us from using video models which are based on statistical data from video sequences which have only one frame type or ignore the GOP structure, like in [2, 4, 6, 11 , 12, 13, 14, 17] and [18] . Thus, there is a need to develop a new model, which describes the number of cells per frame of the coder output.
The basic idea of our model is to describe the coder output process by a cyclic array of frame size distributions of the specific GOP owned by a video sequence. From the Star Wars sequence we will obtain therefore a sequence of 12 different distributions. The only frame-by-frame correlation information, which is used in our model is the order of the frame size distributions fixed by the GOP pattern. The long-term dependences among frames of consecutive Gaps, e.g. the correlations introduced by similar pictures of one movie scene, seem also to be less important in our case.
114 Part Two ATM Traffic Characterization
To sum up, the GOP is the only correlation information which is used for our model. To describe the cell stream produced by the ATM adaptor of the MPEG coder, the following is assumed:
• a single-layer coder is used
• the ATM adaptor uses AAL type 5 to access the medium
• the ATM adaptor and the transmission link have the same capacity
This means that one frame at a time will arrive at the ATM layer, the packetization takes place, and the ATM cells are transmitted back-to-back with the maximum rate of the adaptor. In our opinion, this way of transmission might not be optimal with respect to cell loss due to cell discarding at the UPC, but it seems to be a realistic assumption.
The modeled cell stream can be described by the following parameters:
• frame duration D, which is measured in cells and can be calculated by D = ~ , where C denotes the maximum output rate of the ATM adaptor in cells! sec and F denotes the frame rate of the video sequence in frames! sec. Of course, the maximum frame size of the encoded video sequence has to be always smaller than D.
• frame size distributions al (i) , .. . , ac( i) for a sequence with a GOP of G frames, which ani sampled from real MPEG-coded video data. apic(i) denotes the probability that frame number Pic of a GOP has a length of i cells.
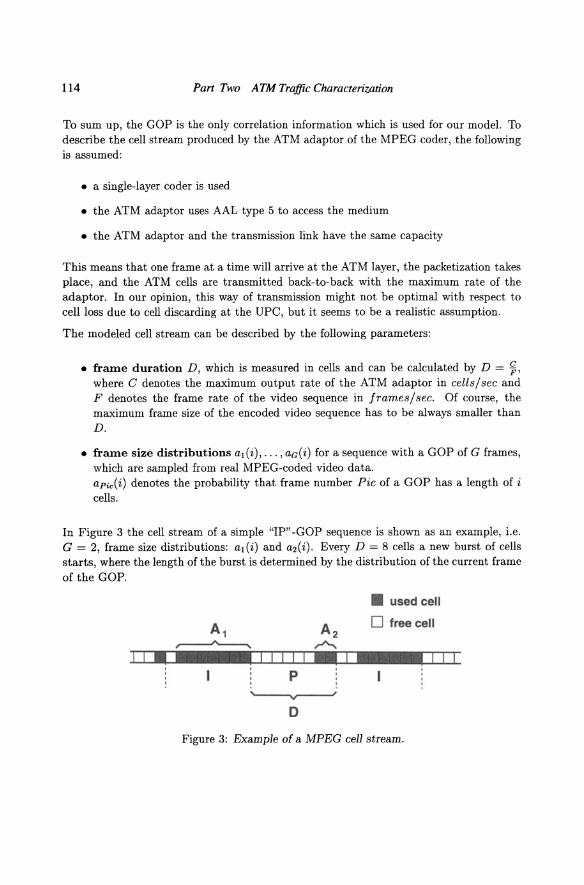
In Figure 3 the cell stream of a simple "IP" -GOP sequence is shown as an example, i.e. G = 2, frame size distributions: al(i) and a2(i). Every D = 8 cells a new burst of cells starts, where the length of the burst is determined by the distribution of the current frame of the GOP.
• used cell
o free cell
•• • •••••••• • ••
Figure 3: Example of a MPEG cell stream.

MPEG-video sources inATM-systems 115
4 Policing of MPEG video sources
As with other services, a video connection which was accepted by the CAC mechanism has to be monitored by the UPC to check whether it fulfills the traffic contract negotiated with the network or not.
Unlike with other services, for video services it is hard to determine the key traffic parameters. The only parameter which is available without difficulties is the PCR of the coder adaptor to the ATM network, i.e. the transmission capacity of the ATM adaptor. If a more detailed description of the cell stream of the video connection is needed, one has to know the video sequence in advance, but this will only be the case for movie broadcast services or video data base retrievals. Video connections which consist of live video transmission, like broadcasts of sports events, will suffer from a lack of information about the cell stream.
One possibility to overcome this problem is the definition of video categories with different safety bandwidth requirements, for example categories with respect to the frequency of scene changes or the set of tolerated camera actions. But even if we would be able to compute a variety of parameters of the video cell stream in advance, we have to decide which of these parameters will be used for CAC and UPC.
At the moment, only the PCR is already standardized as source traffic descriptor [9]. The ACR, which would be a nice traffic descriptor for CAC, is however useless, since it can not be policed efficiently by any UPC function due to the burstiness of video traffic. Studies concerning ACR policing can be found in e.g. [19] and [3]. Therefore, the introduction of a SCR as source traffic descriptor is discussed in the standardization bodies. In this paper, we investigate whether it is advantageous to use the SCR as control parameter of video cell streams and how to dimension the required parameters.
Originally, standard coding schemes like MPEG-I, H.261, and MPEG-II/H.262 are not designed for the compression of videos which are transmitted on a medium where a loss of data, e.g. cells in ATM systems, is possible. Therefore they have no built-in mechanisms to classify parts of the coder output stream as important and less important, i.e. there is no possibility to have priority classes with respect to cell loss of the packetized coder cell stream. This leads to the disadvantage that any UPC function can only carry out blind cell discarding actions, and cells which are important for decoding the video are discarded even if there were cells in the UPC buffer, which are less important.
This UPC behavior can only be changed, if new coding schemes are developed, which allow the packetizing algorithm of the ATM layer to produce cells with priorities or the establishment of two VCs with different cell loss requirements. Until now, such coders are in development and will not be available in the near future. Therefore, it is very likely that the MPEG coding scheme will be used for the first video applications in ATM networks. In the next section we present a new analytical approach for the dimensioning of the UPC function in ATM networks if MPEG video sources are considered.

116 Part Two ATM Traffic Characterization
5 Cell loss analysis
The algorithm we present here is of iterative nature and based on the discrete-time analysis of the G I[X] / D /1 - S queueing model presented in [20], which was used in [7] to analyze the GCRA with a renewal process used as input traffic. In [19], an extension of this analysis to deal with ON/OFF input traffic was presented. Based on this, we describe an algorithm to deal with the cyclic occurrence of frames of different types in MPEG coded video sequences due to the coding in GOPs.
The actual state of the GCRA(T.,7.) is described by a discrete-time random variable Z(t), which represents the remaining time until the next cell is expected to arrive [7]. A cell arriving at time to seeing the GCRA in state Z(to) = i is considered to be conforming for i :S 7., otherwise non-conforming.
Since we have to deal with different frame types in the GOP and the length of a frame is upper bounded by D, we use the following notation:
Apic discrete random variable for the size of frame number Pic in the GOP
Z"tic,k Z(t) just after the beginning of the k-th slot in frame number Pic in the GOP
ZPic,k Z(t) just before the beginning of the k-th slot in frame number Pic in the GOP.
For the distributions of Z"tic k and ZPic k we use the terms z"tic k( i) and zpic k( i), respectively. The frame sizes A pic' are assum~d to follow renewal pr~cesses with distributions apic(i). For the sake of simplicity the indices denoting the iteration steps are omitted.
Let us consider a particular frame in the GOP, say frame number Pic. If we assume cell arrivals in every slot k, i.e. a frame size equal to D, then Z"tic,k is determined out of ZPic,k by
ZPic,k > 7.
ZPic,k :S 7.
for k = 0, ... ,D-1.
Accordingly, the corresponding distributions can be obtained by
o ZPic,k(i)
ZPic,k(i) + ZPic,k(i - T.)
o :S i :S 7.
7. < i < T.
T. :S i :S T. + 7.
(1)
(2)
MPEG-video sources in ATM-systems
if 75 < T. and otherwise by
O:5:i<T5
T. :5: i :5: 7.
75 < i :5: T5 + 7.
117
(3)
The computation of ZPic,k+1 is driven by the decrease of Z(t) by one each slot until it reaches zero and thus we get
ZPic,k+1 = max{O, Ztic,k - I} for k=O, ... ,D-I,
for the random variable, and its distributions are determined by
i=O
0< i < Ts +75
i = T5 + 7s
(4)
(5)
The actual state of the GCRA(T., 7 s ) at the beginning of the next frame boundary is given by
(6)
where (Pic + 1) is computed modulo G. To obtain ZPic+1,o(i), we have to multiply the system state distributions just before the frame boundary Z;'ic,k(i), which are dependent on the size of the current frame, by the probabilities of observing a frame of size k for the frame type Pic. This leads to the following equation:
D
zPic+1,o(i) = L apic(k) . Z;'ic,k(i). (7) k=l
Since we computed ZPic,k assuming a frame size equal to D cells, we have now to take into account the different possible frame sizes. The state of the GCRA(T., 7 5 ) just before the frame boundary in dependence of the size k of the current frame is given by
Z;'ic,k = max{O, ZPic,k - (D - k)} for k = I, ... ,D, (8)
since there are no cell arrivals in the last (D - k) slots and we get the corresponding distributions by
D-k
L ZPic,k(j) j=O
ZPic,k(i + (D - k))
o
i=O
0< i :5: T5 + 75 - (D - k) (9)
Ts + 7s - (D - k) < i :5: Ts + 75
118 Part Two ATM Traffic Characterization
Now, the distributions in equilibrium can be derived by applying iteratively the equations presented above with respect to the GOP used and the current slot in each frame.
Using the equilibrium system state distributions just before the cell arrivals, the probability PPic(k) to observe a non-conforming cell at slot k (k = 0, ... , D - 1) in a frame of type Pic is
Ts+'T/iI
ppic(k) = L zPic,k(i) for Pic = 1, ... ,G. (10) i=rs+l
To derive the probability PPic to observe a non-conforming cell in a given frame in the GOP, the PPic(k)'s must be multiplied with the complementary cumulative probability distribution a'j,ic(i) of the frame size distribution apic(i) and the result has to be normalized, i.e.:
for Pic = 1, ... ,G. (11)
The overall cell loss probability can now easily be obtained by
G
L PPic' E[Apic] R - ~P~ic==~l~ ______ __
loss - G (12) L E[Apic]
Pic=l
6 Numerical results
6.1 Parameters and configuration
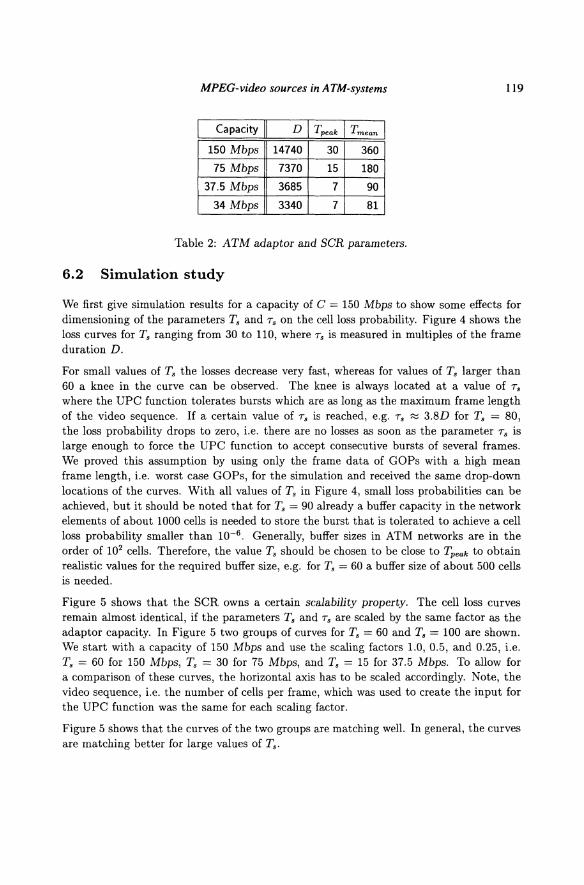
In this section we present numerical results based on simulation and analysis to show the effectiveness of SCR monitoring of video cell streams and point out some interesting properties for dimensioning the UPC function. We focus on four ATM adaptor capacities: 150 Mbps, 75 Mbps, 37.5 Mbps, and 34 Mbps. For the considered Star Wars sequence, this leads to the frame durations and minimum (Tpeak ) and maximum values (Tmean) for the SCR parameter T. shown in Table 2.
It is important to point out that all simulation results of this paper were produced using directly the sequence of the frame sizes of the Star Wars movie and not by means of the coder output model.
MPEG-video sources in ATM-systems 119
Capacity II D I Tpeak I Tmean I 150 Mbps 14740 30 360
75 Mbps 7370 15 180
37.5 Mbps 3685 7 90
34 Mbps 3340 7 81
Table 2: ATM adaptor and SCR parameters.
6.2 Simulation study
We first give simulation results for a capacity of C = 150 Mbps to show some effects for dimensioning of the parameters Ts and Ts on the cell loss probability. Figure 4 shows the loss curves for Ts ranging from 30 to 110, where Ts is measured in multiples of the frame duration D.
For small values of Ts the losses decrease very fast, whereas for values of Ts larger than 60 a knee in the curve can be observed. The knee is always located at a value of Ts where the UPC function tolerates bursts which are as long as the maximum frame length of the video sequence. If a certain value of Ts is reached, e.g. Ts ~ 3.8D for T. = 80, the loss probability drops to zero, i.e. there are no losses as soon as the parameter Ts is large enough to force the UPC function to accept consecutive bursts of several frames. We proved this assumption by using only the frame data of GOPs with a high mean frame length, i.e. worst case GOPs, for the simulation and received the same drop-down locations of the curves. With all values of T. in Figure 4, small loss probabilities can be achieved, but it should be noted that for T. = 90 already a buffer capacity in the network elements of about 1000 cells is needed to store the burst that is tolerated to achieve a cell loss probability smaller than 10-6 . Generally, buffer sizes in ATM networks are in the order of 102 cells. Therefore, the value T. should be chosen to be close to Tpeak to obtain realistic values for the required buffer size, e.g. for T. = 60 a buffer size of about 500 cells is needed.
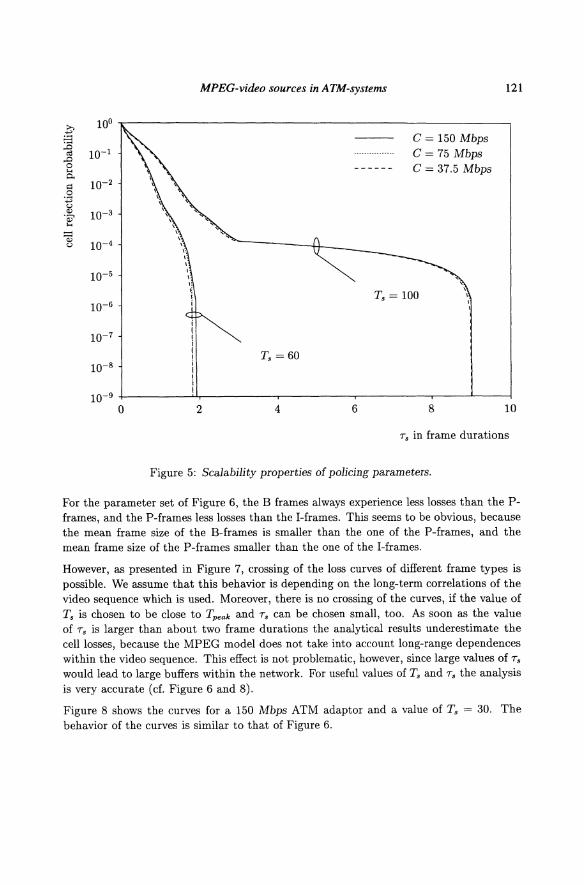
Figure 5 shows that the SCR owns a certain scalability property. The cell loss curves remain almost identical, if the parameters T. and Ts are scaled by the same factor as the adaptor capacity. In Figure 5 two groups of curves for Ts = 60 and T. = 100 are shown. We start with a capacity of 150 Mbps and use the scaling factors 1.0, 0.5, and 0.25, i.e. T. = 60 for 150 Mbps, T. = 30 for 75 Mbps, and T. = 15 for 37.5 Mbps. To allow for a comparison of these curves, the horizontal axis has to be scaled accordingly. Note, the video sequence, i.e. the number of cells per frame, which was used to create the input for the UPC function was the same for each scaling factor.
Figure 5 shows that the curves of the two groups are matching well. In general, the curves are matching better for large values of T •.

120 Part Two ATM Traffic Characterizatlon
..Q 10° ;.:::l ;E
10-1 '" .D 0 ..... 0.. ~ 10-2
.9 .fJ u '" 10-3 .Q)' .....
~ 10-4 u
10-5
10-6
10-7 T. = 30 60 80 90 100 110
10-8
10-9 +---~~.-----~-------r~----.---~--.-----~------~
o 2 4 6 8 10 12 14
T. in frame durations
Figure 4: Dependence of cell rejection probability on T. (C = 150 Mbps).
By means of this scalability property the SCR parameters for a large variety of adaptor capacities can be calculated easily by multiplying a constant, if the parameters for a single capacity is known.
6.3 Analytical results
In this subsection we investigate the accuracy of the analysis presented in Section 5. Generally, the results are of exact nature if the frame sizes in the GOP follow renewal processes. In reality however, correlations can be observed.
All figures in this subsection show four cell loss curves: for I, P, B frames only, and for all frames. The accuracy is verified by simulation results.
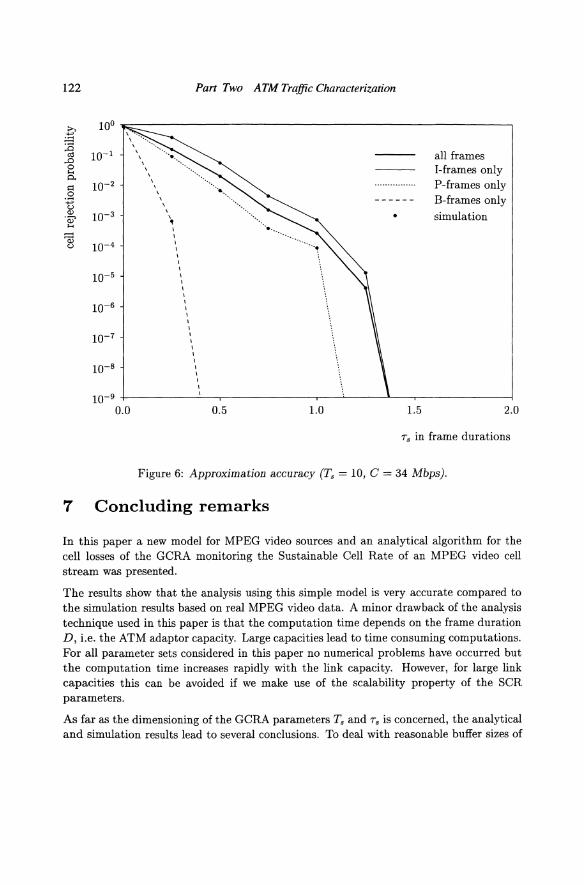
In Figure 6 the results for an adaptor capacity of 34 Mbps and a SCR with T. = 10 are presented. The relative difference of the analytical and simulation values is always smaller than 1 %. This leads to the conclusion, that our simple video coder output model is appropriate for the estimation of the cell losses for this type of UPC function.
>, 10° .,., ;.:::: :B
10-1 cd ..0 0 .... 0. ~ 10-2
.9 .,., u Q.l 10-3 .~
.... ~ 10-4 u
10-5
10-6
10-7
10-8
10-9
0
MPEG-video sources in ATM-systems
Ts = 60
2 4 6
C = 150 Mbps C = 75 Mbps C = 37.5 Mbps
Ts = 100
8
, \
121
10
Ts in frame durations
Figure 5: Scalability properties of policing parameters.
For the parameter set of Figure 6, the B frames always experience less losses than the Pframes, and the P-frames less losses than the I-frames. This seems to be obvious, because the mean frame size of the B-frames is smaller than the one of the P-frames, and the mean frame size of the P-frames smaller than the one of the I-frames.
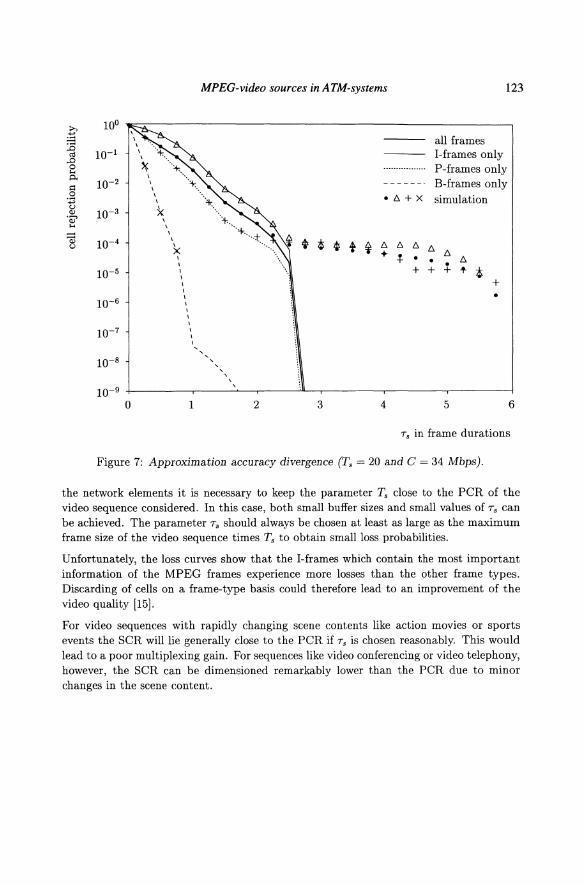
However, as presented in Figure 7, crossing of the loss curves of different frame types is possible. We assume that this behavior is depending on the long-term correlations of the video sequence which is used. Moreover, there is no crossing of the curves, if the value of Ts is chosen to be close to Tpeak and Ts can be chosen small, too. As soon as the value of Ts is larger than about two frame durations the analytical results underestimate the cell losses, because the MPEG model does not take into account long-range dependences within the video sequence. This effect is not problematic, however, since large values of Ts
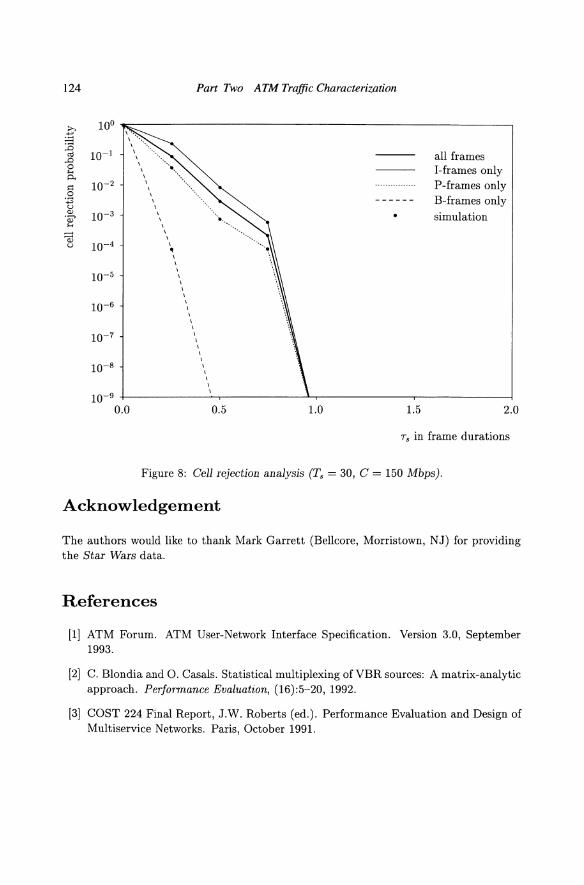
would lead to large buffers within the network. For useful values of Ts and Ts the analysis is very accurate (d. Figure 6 and 8).
Figure 8 shows the curves for a 150 Mbps ATM adaptor and a value of Ts = 30. The behavior of the curves is similar to that of Figure 6.
122
>, 10° ....-;..::: :..a
10-1 oj ,.0 0 ..... P. ~ 10-2
.9 ....-U (J) 10-3 .W' .....
~ 10-4 u
10-5
10-6
10-7
10-8
10-9
0.0
, , , , , , , \
\
Part Two ATM Traffic Characterization
\ ,
0.5 1.0 1.5
all frames I-frames only P-frames only B-frames only simulation
2.0
Ts in frame durations
Figure 6: Approximation accuracy (Ts = 10, C = 34 Mbps).
7 Concluding remarks
In this paper a new model for MPEG video sources and an analytical algorithm for the cell losses of the GCRA monitoring the Sustainable Cell Rate of an MPEG video cell stream was presented.
The results show that the analysis using this simple model is very accurate compared to the simulation results based on real MPEG video data. A minor drawback of the analysis technique used in this paper is that the computation time depends on the frame duration D, i.e. the ATM adaptor capacity. Large capacities lead to time consuming computations. For all parameter sets considered in this paper no numerical problems have occurred but the computation time increases rapidly with the link capacity. However, for large link capacities this can be avoided if we make use of the scalability property of the SCR parameters.
As far as the dimensioning of the GCRA parameters Ts and Ts is concerned, the analytical and simulation results lead to several conclusions. To deal with reasonable buffer sizes of
MPEG-video sources in ATM-systems 123
>, 10° +" ;.=:: all frames ;B 0: 10-1 I-frames only
,D 0 ------.- ......... P-frames only .... p.. \
0 10-2 \ +. ------- B-frames only \
.S \ ·~+x simulation +" \ .",
U X Q) 10-3 .Q)' \ '+-. .... \
.+ ..... * ~ \
oJ 10-4 \
t ~ t u \ + ~ ~ ~ ~ ~ X .. ~ .f. • • ~
10-5 + + + .,. t
+ 10-6
\
10-7 \ \ \ , ,
10-8 , , , , , ,
10-9 ,
0 1 2 3 4 5 6
Ts in frame durations
Figure 7: Approximation accuracy divergence (Ts = 20 and C = 34 Mbps).
the network elements it is necessary to keep the parameter Ts close to the PCR of the video sequence considered. In this case, both small buffer sizes and small values of Ts can be achieved. The parameter Ts should always be chosen at least as large as the maximum frame size of the video sequence times Ts to obtain small loss probabilities.
Unfortunately, the loss curves show that the I-frames which contain the most important information of the MPEG frames experience more losses than the other frame types. Discarding of cells on a frame-type basis could therefore lead to an improvement of the video quality [15].
For video sequences with rapidly changing scene contents like action movies or sports events the SCR will lie generally close to the PCR if Ts is chosen reasonably. This would lead to a poor multiplexing gain. For sequences like video conferencing or video telephony, however, the SCR can be dimensioned remarkably lower than the peR due to minor changes in the scene content.
124
.0 ~ ;a
cO .D 0 .... Po. I=i 0 :p '-' Q) . W' .... ~ '-'
10°
10-1
10-2
10-3
10-4
10-5
10-6
10-7
10-8
Part Two ATM Traffic Characterization
', ..... \ .... \ ...... .
\ .... \ .. \ .... , '"
\ ..•.... \ ", \ .... \ ", \ .•................
\ • \ \ \ \ \ \ \ \ \ \ \ \ \ \ \ \ \ \ \ \ \
all frames I-frames only P-frames only B-frames only simulation
10-9 +-------------\-r------------~--------------._----------~ 0.0 0.5 1.0 1.5 2.0
Ts in frame durations
Figure 8: Cell rejection analysis (Ts = 30, C = 150 Mbps).
Acknowledgement
The authors would like to thank Mark Garrett (Bellcore, Morristown, NJ) for providing the Star Wars data.
References
[1] ATM Forum. ATM User-Network Interface Specification. Version 3.0, September 1993.
[2] C. Blondia and O. Casals. Statistical multiplexing of VBR sources: A matrix-analytic approach. Performance Evaluation, (16):5-20, 1992.
[3] COST 224 Final Report, J.W. Roberts (ed.). Performance Evaluation and Design of Multiservice Networks. Paris, October 1991.
MPEG-video sources in ATM-systems 125
[4J M. R. Frater, P. Tan, and J. F. Arnold. Modelling of variable bit rate video traffic in the broadband ISDN. In Proc. Australian Broadband Switching and Services Symposium, Wollongong NSW, July 1993.
[5J M. W. Garrett. Contributions toward real-time services on packet switched networks. PhD thesis, Columbia University, 1993.
[6J D. P. Heyman, A. Tabatabai, and T. V. Lakshman. Statistical analysis and simulation study of video teleconference traffic in ATM networks. IEEE Transactions on Circuits and Systems for Video Technology, 2(1):49-59, March 1992.
[7J F. Hubner. Dimensioning of a Peak Cell Rate Monitor Algorithm Using DiscreteTime Analysis. In Proceedings of ITC-14, pages 1415-1424, Antibes, France, June 1994.
[8J Generic Coding of Moving Pictures and Associated Audio. ISO/IECjJTC/1/SC29/ WG11, MPEG-2 Working Draft, March 1993.
[9J ITU-TSS Study Group 13. Recommendation I.371: Traffic control and congestion control in B-ISDN. (frozen issue) Geneva, March 1994.
[10J D. Le Gall. MPEG: A video compression standard for multimedia applications. Communications of the ACM, 34(4):46-58, April 1991.
[l1J B. Maglaris, D. Anast-assion, P. Sen, G. Karlsson, and J. D. Robbins. Performance models of statistical multiplexing in packet video communications. IEEE Transactions on Communications, 36(7):834-844, July 1988.
[12J B. Melamed and B. Sengupta. TES modeling of video traffic. IEICE Transactions on Communications, (12):1292-1300, December 1992.
[13J P. Pancha and M. E. Zarki. Bandwidth requirements of variable bit rate MPEG sources in ATM networks. In Proceedings of the Conference on Modelling and Performance Evaluation of ATM Technology, Martinique, pages 5.2.1-25, January 1993.
[14J G. Ramamurthy and B. Sengupta. Modelling and analysis of a variable bit rate video multiplexer. In Proceedings of the IEEE Infocom '92, pages 6C.l.l-11, 1992.
[15J S. Ramanathan, P.V. Rangan, and H.M. Yin. Frame-induced packet discarding: An efficient strategy for video networking. In Proceedings of the 4th International Workshop on Network and Operatin9 Systems Support for Digital Audio and Video, Lancaster, England, November 1993.
[16J E.P. Rathgeb. Policing of Realistic VBR Video Traffic in an ATM Network. In International Journal of Digital and Analog Communication Systems, Vol. 6, pages 213-226, 1993.
126 Part Two ATM Traffic Characterization
[17] P. Sen, B. Maglaris, N.-E. Rikli, and D. Anastassiou. Models for packet switching of variable-bit-rate video sources. IEEE Journal on Selected Areas in Communications, 7(5):865-869, June 1989.
[18] P. Skelly, M. Schwartz, and S. Dixit. A histogram-based model for video traffic behavior in an ATM mUltiplexer. IEEE/ACM Transactions on Networking, Vol. 1, pages 446-459, August 1993.
[19] M. Ritter and P. Tran-Gia. Performance Analysis of Cell Rate Monitoring Mechanisms in ATM Systems. In Proceedings of the International Conference on Local and Metropolitan Communication Systems, Kyoto, December 1994.
[20] P. Tran-Gia, H. Ahmadi. Analysis of a Discrete-Time G[x] / D /1- S Queueing System with Applications in Packet-Switching Systems. In Proceedings of the IEEE Infocom '88, pages 861-870, 1988.
Biography
Oliver Rose is Ph. D. student at the Faculty of Mathematics and Computer Sciences at the University ofWiirzburg in Germany. He received the Diploma degree in Mathematics from the University of Wiirzburg in 1992. Current areas of interest are modeling of multi-media traffic and performance analysis of broadband B-ISDNs.
Michael Ritter is Ph. D. student at the Faculty of Mathematics and Computer Sciences at the University of Wiirzburg in Germany. He received the Diploma degree in Information and Computer Science from the University of Wiirzburg in 1993. Current areas of interest are performance modeling of telecommunication systems and include evaluation and analysis of B-ISDNs.


![1350 ritter[1]](https://img.pdfslide.us/doc/110x75/558a55ded8b42a88468b458c/1350-ritter1.jpg)