Embed Size (px)
Citation preview

ON-LINE PRECONCENTRATION OF VAPOR FORMING ELEMENTS ON RESISTIVELY HEATED W-COIL PRIOR TO THEIR
DETERMINATION BY ATOMIC ABSORPTION SPECTROMETRY
A THESIS SUBMITTED TO THE GRADUATE SCHOOL OF NATURAL AND APPLIED SCIENCES
OF MIDDLE EAST TECHNICAL UNIVERSITY
BY
OKTAY CANKUR
IN PARTIAL FULFILLMENT OF THE REQUIREMENTS FOR THE DEGREE OF
DOCTOR OF PHILOSOPHY
IN
CHEMISTRY
MAY 2004

Approval of the Graduate School of Natural and Applied Sciences
___________________
Prof. Dr. Canan Özgen
Director
I certify that this thesis satisfies all the requirements as a thesis for the degree of
Doctor of Philosophy.
___________________
Prof. Dr. Hüseyin çi
Head of Department
This is to certify that we have read this thesis and that in our opinion it is fully
adequate, in scope and quality, as a thesis for the degree of Doctor of Philosophy.
_________________
Prof. Dr. O. Yavuz Ataman
Supervisor
Examining Committee Members
Prof.Dr. Mehmet DOAN (Hacettepe University) _____________________
Prof. Dr. O. Yavuz ATAMAN (CHEM, METU) _____________________
Prof. Dr. Mürvet VOLKAN (CHEM, METU) _____________________
Prof. Dr. nci G. GÖKMEN (CHEM, METU) _____________________
Asst. Prof. Dr. Nusret ERTA (Gazi University) _____________________

I hereby declare that all information in this document has been obtained and
presented in accordance with academic rules and ethical conduct. I also declare
that, as required by these rules and conduct, I have fully cited and referenced
all material and results that are not original to this work.
Name, Last name : Oktay CANKUR
Signature :

iv
ABSTRACT
ON-LINE PRECONCENTRATION OF VAPOR FORMING ELEMENTS
ON RESISTIVELY HEATED W-COIL PRIOR TO THEIR
DETERMINATION BY ATOMIC ABSORPTION SPECTROMETRY
Cankur, Oktay
Ph.D., Department of Chemistry
Supervisor: Prof. Dr. O. Yavuz Ataman
May 2004, 159 Pages
Vapor generation in atomic spectrometry is a well established technique for the
determination of elements that can be volatilized by chemical reactions. In-situ
trapping in graphite furnaces is nowadays one of the most popular methods to
increase the sensitivity. In this study, resistively heated W-coil was used as an on-
line trap for preconcentration and revolatilization of volatile species of Bi, Cd and
Pb. The collected analyte species were revolatilized rapidly and sent to a quartz T-
tube atomizer for AAS measurement. Although the nature of revolatilized species
of Bi and Pb are not clear, they are probably molecular since they can be
transported at least 45 cm without any significant decrease in the peak height
values. However, cadmium is revolatilized from the trap surface as atoms.

v
The experimental parameters were optimized for the highest vapor generation,
trapping and revolatilization efficiencies. The concentration limits of detection
calculated by the 3 of blank solution were found to be 0.0027, 0.0040 and 0.015
ng/mL for Bi (18 mL), Cd (4.2 mL) and Pb (2 mL), respectively; enhancement
factors in the sensitivity were 130, 31 and 20, respectively. These values are
comparable with those obtained by in-situ trapping in graphite furnaces or even
ICP-MS found in the literature or better. Sensitivity can be improved further for Bi
and Cd using larger sample volumes, but purification of blank is required for Pb.
Certified standard reference materials were analyzed for the assessment of
accuracy of developed method.
Keywords: Atomic Absorption Spectrometry, Vapor Generation, On-line
Preconcentration, W Trap, Bi, Cd, Pb.

vi
ÖZ
BUHAR OLUTURAN ELEMENTLERN
ATOMK ABSORPSYON SPEKTROMETR LE TAYNNDEN ÖNCE
ELEKTRK AKIMI LE ISITILAN W-SARMAL ÜZERNDE
HAT ÜSTÜ ÖNZENGNLETRLMES
Cankur, Oktay
Ph.D., Kimya Bölümü
Tez danımanı: Prof. Dr. O. Yavuz Ataman
Mayıs 2004, 159 Sayfa
Atomik spektrometride buhar oluturma, kimyasal tepkimelerle buhar haline
getirilebilen elementlerin tayininde oldukça yerlemi ve kabul edilen bir tekniktir.
Grafit fırın içerisinde yerinde tuzaklama, duyarlılık artıı salamak için
günümüzde gözde yöntemlerden biridir. Bu çalımada, elektrik akımı ile ısıtılan
W-sarmal, Bi, Cd ve Pb’nin uçucu bileiklerinin önzenginletirilmesi ve tekrar
buharlatırılması için hat üstü tuzak olarak kullanılmıtır. Toplanan analit türleri
hızlı bir ekilde buharlatırılmı ve AAS ölçümü için kuvars T-tüpe gönderilmitir.
Tekrar buharlatırılan Bi ve Pb bileiklerinin doası bilinmemekle birlikte, sinyal
alanlarında anlamlı bir düme olmadan en az 45 cm taınabildiklerinden
muhtemelen moleküler yapıdadırlar. Bunlardan farklı olarak Cd tuzak üzerinden
atom olarak buharlamaktadır.

vii
Deneysel parametreler en yüksek verimlilikte buhar oluturma, tuzaklama ve
yeniden buharlatırma için optimize edilmitir. Kör çözeltisinin 3 deeri baz
alınarak hesaplanan gözlenebilirlik sınırları Bi (18 mL), Cd (4.2 mL) ve Pb (2.0
mL) için sırasıyla 0.0027, 0.0040 ve 0.015 ng/mL olarak hesaplanmıtır;
duyarlılıktaki artı katsayıları sırasıyla 130, 31 ve 20’dir. Bu deerler, literatürde
bulunan grafit fırında yerinde tuzaklama ve hatta ICP-MS ile elde edilenlerle
karılatırılabilir veya daha iyidir. Bi ve Cd için verilen duyarlılıklar daha fazla
örnek hacmi kullanılarak daha da gelitirilebilir, fakat Pb için kör deerlerinin
düürülmesi gereklidir. Gelitirilen yöntemin doruluunun deerlendirilmesi için
sertifikalandırılmı standart referans maddeleri analiz edilmitir.
Anahtar Kelimeler: Atomik Absorpsiyon Spektrometri, Buhar Oluturma, Hat
Üstü Önzenginletirme, W Tuzak, Bi, Cd, Pb.

viii
To my son, Sarp Eren

ix
ACKNOWLEDGEMENTS
I am deeply grateful to Prof. Dr. O Yavuz Ataman for his invaluable and
professional guidance. He always supported me by giving valuable suggestions
throughout all stages of this thesis. Without our inspiring discussions, this thesis
would not have been what it is today.
I would like to acknowledge Asst. Prof. Dr. Nusret Erta for his expert advice and
constructive comments. He asked me questions that made me think in more depth.
I truly appreciate the members of examination committee for their time and advice.
I am also deeply grateful to my wife, Dilek Cankur, for her unwavering support
during the many long days which went into this endeavor. She provided
continuous understanding, patience and love.
Sincere thanks are to my friends, Dr. Deniz Korkmaz, Süleyman Z. Can and Dr.
Eftade Gaga for sharing the joys and worries in the laboratories. They always
encouraged and helped in various ways. I would like to express my special thanks
to Dr. Gülay Yılmaz for her unforgettable moral supports, helps and guidance.
I would like to express heartfelt thanks to my parents for financial and infinite
moral supports during the studies. I would also extend my thanks to my father-in-
law and mother-in-law for their patience and endurance.

x
This work was financially supported by Middle East Technical University
Research Fund through grant BAP 2002-07-02-00-41.
xi
TABLE OF CONTENTS
ABSTRACT ….…………………………………………………………........... iv
ÖZ ..……………………………………………………………………….......... vi
DEDICATION……………………………………………………………......... viii
ACKNOWLEDGEMENTS………………………………………………......... ix
TABLE OF CONTENTS ………………………………………………............ xi
LIST OF TABLES ...………………………………………………………....... xvii
LIST OF FIGURES …………………………………………………………..... xix
LIST OF ABBREVIATIONS ………………………………………………..... xxiv
CHAPTER
1. INTRODUCTION ……………………………………………………….. 1
1.1 Atomic Absorption Spectrometry ………………………………........ 2
1.1.1 Flame AAS …………………………………………………....... 2
1.1.2 Vapor Generation AAS (VGAAS) …………………………....... 3
1.1.2.1 Hydride Generation (HG)……………………………......... 5
1.1.2.2 Mechanism of Hydride Generation ….……………...…..... 7
1.1.2.3 Methods of Hydride Generation AAS …………………...... 9
1.1.2.4 Hydride Forming Elements ……………………………...... 11
1.1.2.5 Hydride Generation Efficiency …………………………..... 12

xii
1.1.2.6 Atomization in HGAAS …………...…………………........ 14
1.1.2.6.1 Atomizers used in HGAAS ………………...………... 14
1.1.2.6.2 Atomization Mechanism …………………………....... 15
1.1.2.7 Interferences in HGAAS .………………………………..... 17
1.1.3 Electrothermal AAS …..……………………………….……...... 18
1.1.3.1 Graphite Atomizer ETAAS .……………………..…….. .... 19
1.1.3.2 Metal Atomizer ETAAS ..…………………………………. 20
1.2 Preconcentration Methods ……………...…………………………… 21
1.3 In-situ trapping techniques …………………………………………... 23
1.4 ETV Techniques …………………………………………...………... 25
1.4.1 ETV with Graphite Vaporizers ..……………………...………... 26
1.4.2 ETV with Metal Vaporizers ………………………….………… 28
1.5 Individual Elements …………………………………………..……... 30
1.5.1 Bismuth ……………………………………………………........ 30
1.5.1.1 Importance of Bi ...……………………....………………… 30
1.5.1.2 Determination of Bi ……………………...………………... 31
1.5.1.3 Determination of Bi by Hydride Generation …………........ 32
1.5.2 Cadmium ………………...……………………………………... 33
1.5.2.1 Importance of Cd ……...……...…………….……………... 33
1.5.2.2 Determination of Cd ……………......……………………... 34
1.5.2.3 Determination of Cd by Hydride Generation ……....……... 35
1.5.3 Lead ………………………………………………………...…... 37
1.5.3.1 Importance of Pb ....………………………………………... 37
1.5.3.2 Determination of Pb ……………………………………..… 38

xiii
1.5.3.3 Determination of Pb by Hydride Generation …………........ 40
1.6 The Aim of the Study …………………………………………..……. 43
2. EXPERIMENTAL ………………………………………………….......... 44
2.1 Instrumentation …………………………………………………........ 44
2.2 Hydride Generation System …………………………………………. 45
2.2.1 Apparatus ………………………………………………..……... 45
2.2.2 Atomizer and Atom Cell ………………………………...……... 49
2.3 Trap System ………………………………………………..………... 50
2.4 Reagents …………………………………………………...………… 55
2.5 Procedure ……………………………………………………..……... 56
2.5.1 Bismuth ………………………………………………………… 58
2.5.2 Cadmium ……………………………………………...………... 58
2.5.3 Lead ………………………………………………………...…... 61
2.6 Digestion of Standard Reference Materials …………………………. 62
3. RESULTS AND DISCUSSION …………………………………...…….. 67
3.1 Selection of Trap ………………………………………………...…... 67
3.2 Heating System of W-trap and Temperature Measurements ...…….... 68
3.3 Composition of Carrier Gas ..………………………………………... 70
3.4 Conditioning and Life Time of W-Trap ……………………………... 71
3.5 Bismuth ………………………………………………...……………. 71
3.5.1 Optimization of Hydride Generation Parameters ………………. 71
3.5.2 Optimization of Trapping Conditions ……..…………………... 73
3.5.2.1 Collection and Revolatilization Temperatures ……...…….. 73
3.5.2.2 Carrier Gas Flow Rates …………………………………… 77

xiv
3.5.2.2.1 Argon Flow Rate ……………………………………... 77
3.5.2.2.2 Hydrogen Flow Rate …………………………………. 79
3.5.2.3 Stability of Collected Species on the W-Trap …………….. 80
3.5.2.4 Effect of Cooling Time after Releasing Stage …………….. 80
3.5.2.5 Length of Transport Tubing between W-Trap and
Atomizer……………………………………………………………
80
3.5.3 Relation between Collection Volume and Analytical Signal …... 82
3.5.4 Analytical Signal and Reproducibility ………...……………….. 84
3.5.5 Calibration Plot ……...……………………………….………… 86
3.5.6 The Analytical Figures of Merit …...…………………………… 87
3.5.7 Accuracy of the Method ………………………..………………. 89
3.6 Cadmium …………………………………………………………….. 91
3.6.1 Atom Cell ………………………………………………………. 91
3.6.2 Optimization of Vapor Generation Parameters ………………… 92
3.6.2.1 General Considerations in the Vapor Generation of Cd by
Tetrahydroborate Reduction ..………………………..…………….
92
3.6.2.2 Concentration of HCl in Sample and Carrier Solution ……. 93
3.6.2.3 Concentrations of NaBH4 and NaOH in Reductant Solution ... 96
3.6.2.4 Reaction and Stripping Coil Lengths ……………............... 99
3.6.2.5 Reaction Temperature ………………………………….…. 100
3.6.3 Optimization of Trapping Conditions ………………………….. 101
3.6.3.1 Placement of W-coil Trap ………………………………… 101
3.6.3.2 Collection and Revolatilization Temperatures ………...….. 102
3.6.3.3 Carrier Gas Flow Rate ……….……………………….…… 103

xv
3.6.3.4 Coating with Pt and Ir ………………………….………….. 105
3.6.3.5 Distance between Tip of Transport Capillary and W-trap .... 106
3.6.3.6 Stability of Collected Species on the W-Trap ………...…... 107
3.6.3.7 Effect of Cooling Time after Releasing Stage ...................... 108
3.6.3.8 Length of Transport Tubing between GLS and W-Trap ….. 109
3.6.3.9 Distance between W-Trap and Atomizer …………………. 111
3.6.4 Relation between Collection Volume and Analytical Signal ....... 112
3.6.5 Analytical Signal and Reproducibility ……………...………….. 113
3.6.6 Calibration Plot ……………………….………………………… 114
3.6.7 The Analytical Figures of Merit ………………………………... 116
3.6.8 Accuracy of the Method …………...…………………………… 118
3.7 Lead ………………………...…………………...………………........ 119
3.7.1 Optimization of Hydride Generation Parameters ………………. 119
3.7.1.1 Concentrations of HCl and NaBH4 ………………………... 119
3.7.1.2 Concentration of Oxidizing Reagent in the Reaction
Medium ………………………………….…………………………
121
3.7.2 Optimization of Trapping Conditions .…….…………………... 124
3.7.2.1 Collection and Revolatilization Temperatures ……………. 124
3.7.2.2 Carrier Gas Flow Rate .……………………………………. 126
3.7.2.3 Coating with Pd, Pt and Ir ………………………………… 128
3.7.2.4 Distance between W-Trap and Atomizer …………………. 130
3.7.2.5 Tandem W-trap Arrangement ………………….………….. 131
3.7.3 Relation between Collection Volume and Analytical Signal …... 131
3.7.4 Analytical Signal and Reproducibility …………………………. 132

xvi
3.7.5 Calibration Plot ……………………………………………….... 133
3.7.6 The Analytical Figures of Merit ……………………………….. 134
3.7.7 Accuracy of the Method ………………………………………... 137
4. CONCLUSIONS ……………………………………………………........ 139
REFERENCES ………………………………………………………………… 142
VITA …………………………………………………………………………... 159

xvii
LIST OF TABLES
TABLES
2.1 Instrumental parameters used in the measurements ……………………….. 45
2.2 Hydride generation, trapping and revolatilization conditions for Bi, Cd and Pb in CF mode for W-trap HGAAS …………………………………………….
57
2.3 The standard reference materials used for the accuracy check of the methods developed for Bi, Cd and Pb and the concentrations of elements …….
63
2.4 The temperature program used for the decomposition of standard reference material and applied power values ……………………………………………...
63
3.1 Analytical figures of merit and enhancement factors for Bi calculated by using peak height of analytical signal …………………………………………..
87
3.2 Comparison of the limit of detection and the sample volume of the method with those of others in literature ………………………………………………...
88
3.3 Results of the analysis of standard reference materials and their certified values (n=3 for each measurement) ……………………………………………..
89
3.4 Analytical figures of merit and enhancement factors for Cd calculated by using peak height of analytical signal …………………………………………..
117
3.5 Comparison of the limit of detection and the sample volume of the method with those of others in literature ………………………………………………...
117
3.6 Results of the analysis of standard reference materials and their certified values (n=3 for each measurement) ……………………………………………..
118
3.7 Analytical figures of merit and enhancement factors for Pb calculated by using peak height of analytical signal …………………………………………...
136
xviii
3.8 Comparison of the limit of detection and the sample volume of the method with those of others in literature ………………………………………………...
137
3.9 Results of the analysis of standard reference materials and their certified values (n=3 for each measurement) ……………………………………………..
138

xix
LIST OF FIGURES
FIGURES 1.1 Classification of hydride generation methods …………………………….... 10
2.1 Gas liquid separators used in the experiments: (a) Cylindrical GLS used for Cd; (b) U-type GLS used for Bi and Pb ………………………………………...
47
2.2 The experimental set up used for generation of Bi and Pb hydrides ……….. 48
2.3 The experimental set up used for generation of volatile Cd atoms ……….... 49
2.4 Quartz T-tube atomizer used in the experiments ………………………….... 50
2.5 The dimensions of W-coil traps extracted from bulbs and made in the laboratory ………..……………………………………………………………...
51
2.6 The W-coil placed in the inlet arm of quartz T-tube used for Bi and Pb …... 52
2.7 The W-coil placed in the inlet arm of quartz T-tube used for Cd ………….. 52
2.8 Tandem arrangement of W-coil trap system ……………………………….. 54
3.1 Voltage versus temperature of W-coil at different gas flow rates ………….. 69
3.2 The effect of oxidation of W-coil on QTA when H2 was not used in the carrier gas ...……………………………………………………………………..
71
3.3 Optimization of HCl concentration for BiH3 generation. Concentration of Bi was 20 ng/mL and the volume of sample loop was 0.500 mL ………………
72
3.4 Optimization of NaBH4 concentration for BiH3 generation. Concentration of Bi was 20 ng/mL and the volume of sample loop was 0.500 mL …………...
73
3.5 The effect of collection and release temperatures on analytical signal for 5.0 ng Bi. During the variations of collection and release temperatures, a constant release temperature of 1200 ˚C and a constant collection temperature of 270 ˚C, respectively, were employed ………………………………………...
75

xx
3.6 Effect of H2 flow rate on collection temperature for 5.0 ng Bi. During the variations of collection, a constant release temperature of 1200 ˚C was employed ………………………………………………………………………..
76
3.7 Effect of collection Ar flow rate on the peak height of analytical signal for 0.500 mL of 10 ng/mL Bi ...……………………………………………………..
78
3.8 Effect of release Ar flow rate on the peak height of analytical signal for 0.500 mL of 10 ng/mL Bi ……......……………………………………………...
78
3.9 Effect of H2 flow rate in the carrier gas on the analytical signal of 0.500 mL of 10 ng/mL Bi …………………………...……………………………...….......
79
3.10 Analytical signal versus trap-atomizer distance for 0.500 mL of 10 ng/mL Bi (5.0 ng Bi) ……………………………………………………………………
82
3.11 Analytical signal versus collection volume for 0.100 ng/mL Bi in 1.0 mol/L HCl; collection temperature, 270 ˚C; release temperature, 1200 ˚C …….
83
3.12 The analytical signals for Bi. Collection at 270 ˚C and releasing at 1200 ˚C. a) 36 mL of 0.100 ng/mL Bi (3.6 ng Bi), b) 36 mL of 0.020 ng/mL Bi (0.72 ng Bi) ……………………………………………………………………………
85
3.13. The calibration plot drawn by using peak height and peak area for 18 mL of aqueous standard solutions of Bi under optimum conditions ………………..
86
3.14 Effect of HCl concentration in sample and carrier solutions on the analytical signal of Cd obtained by conventional FI-HGAAS. Carrier solution and sample solution acidities were 0.25 mol/L and 0.15 mol/L HCl, respectively, as the other parameter was varied. 0.500 mL of 1.0 ng/mL Cd was used in the experiments ………………………. ………….…………………….
94
3.15 Effect of HCl concentration in the sample solution on the analytical signal of Cd obtained from W-trap system in CF mode. The signals were obtained by collecting 0.7 mL of 10.0 ng/mL Cd, a total of 7.0 ng Cd...…………….............
95
3.16 Effect of NaBH4 concentration on the analytical signal of Cd obtained in conventional FI-HGAAS. The concentrations of HCl were 0.15 and 0.25 mol/L in sample and carrier solutions, respectively. 0.500 mL of 1.0 ng/mL Cd was injected ………………... ………………………………………………………..
97
3.17 Effect of NaBH4 concentration on the analytical signal of Cd obtained from CF-W-trap system. The signals were obtained by collecting 0.7 mL of 5 ng/mL Cd, a total of 3.5 ng Cd ……………………………………………...…..
97

xxi
3.18 Effect of NaOH concentration in reductant solution on the analytical signal of Cd obtained in conventional FI-HGAAS. The signals were obtained by collecting 0.500 mL of 1.0 ng/mL Cd in 0.15 mol/L HCl. Carrier acidity was 0.25 mol/L HCl ………………….…………...……………………………..
98
3.19 Effects of reaction and stripping coil lengths on the analytical signal of Cd obtained in conventional FI-HGAAS. Lengths of reaction and stripping coils were 60 and 15 cm, respectively, as the other parameter was varied. The signals were obtained using 0.100 mL of 5.0 ng/mL Cd in 0.15 mol/L HCl. Carrier was 0.25 mol/L HCl ……....…...……………………………...………...
99
3.20 Effect of reaction coil temperature on the analytical signal of Cd obtained in CF-W-trap-HGAAS. The signals were obtained by collecting 0.7 mL of 5.0 ng/mL Cd in 0.2 mol/L HCl ………………..…………………………………...
101
3.21 The effect of collection and release temperatures on analytical signal for Cd. During the variations of collection and release temperatures, a constant release temperature of 1000 ˚C and a constant collection temperature of 150 ˚C, respectively, were employed. The signals were obtained by collecting 0.7 mL of 5.0 ng/mL Cd in 0.2 mol/L HCl ...……………………………………………
102
3.22 The effect of collection Ar flow rate in the carrier gas on the signal of W-trap HGAAS; H2 flow rate was kept at 150 mL/min. The signals were obtained by collecting 0.7 mL of 5.0 ng/mL Cd in 0.2 mol/L HCl ..……………………...
103
3.23 Effect of carrier Ar flow rate on the peak height of analytical signal of Cd in conventional FI-HGAAS. The signals were obtained using 0.100 mL of 5.0ng/mL Cd in 0.15 mol/L HCl. Carrier acidity was 0.25 mol/L HCl …......……..
104
3.24 The effect of argon flow rate in the carrier gas on the trapping efficiency during collection; H2 flow rate was kept at 150 mL/min. The signals were obtained by collecting 0.7 mL of 5.0 ng/mL Cd in 0.2 mol/L HCl ……………..
105
3.25 Effect of distance between capillary tip and the W-trap on analytical signal. The signals were obtained by collecting 0.7 mL of 5.0 ng/mL Cd in 0.2 mol/L HCl. Collection and release temperatures were 150 ˚C and 1000 ˚C, respectively …………...…………………………………………………………
107
3.26 Effect of time between collection and release stage on the trap signal of Cd. The signals were obtained by collecting 0.7 mL of 5.0 ng/mL Cd in 0.2 mol/L HCl. Collection and release temperatures were 150 ˚C and 1000 ˚C, respectively …...…………………………………………………………………
108
3.27 Effect of cooling time after each revolatilization stage for Cd. The signals were obtained by collecting 0.7 mL of 5.0 ng/mL Cd in 0.2 mol/L HCl. Collection and release temperatures were 150 ˚C and 1000 ˚C, respectively ….
109

xxii
3.28 The effect of length of PTFE transport tubing between GLS and W-trap. The signals were obtained by collecting 0.7 mL of 5.0 ng/mL Cd in 0.2 mol/L HCl. Collection and release temperatures were 150 ˚C and 1000 ˚C, respectively……………………………………………………………………..
110
3.29 The effect of distance between the trap and atomizer on the normalized peak height and peak area signals of Cd ………………………………………...
112
3.30 Relationship between the collection volume and the analytical signal for both peak area and peak height using 0.50 ng/mL Cd solution under optimized conditions; the flow rate was 2.1 mL/min for both sample and the reductant .....
113
3.31 The analytical signals for 4.2 mL of 0.025 ng/mL Cd in 0.2 mol/L HCl. Collection at 150 ˚C and releasing at 1000 ˚C. 1.5% (w/v) NaBH4 was used ….
114
3.32 The calibration plot of Cd for both peak height and peak area of the analytical signal obtained by W-coil HGAAS. The collection volume was 4.2 mL and aqueous standard solutions were employed; the flow rate was 2.1 mL/min for both sample and reductant ….. ……………………………………..
115
3.33 Effect of sample acidity on Pb signal in conventional FI-HGAAS. The signals were obtained using 0.500 mL of 10.0 ng/mL Pb in 0.5% (w/v) K3Fe(CN)6. NaBH4 concentration was 1.0% (w/v) …………...………………...
120
3.34 Effect of NaBH4 concentration on Pb signal in conventional FI-HGAAS. The signals were obtained using 0.500 mL of 10.0 ng/mL Pb in 0.06 mol/L HCl and 0.5% (w/v) K3Fe(CN)6 .………………………………………………..
121
3.35 Effect of concentration of K3Fe(CN)6 on analytical signal in conventional FI-HGAAS. The signals were obtained using 0.500 mL of 10.0 ng/mL Pb in 0.06 mol/L HCl ………….……………………………………………………....
123
3.36 Effect of nitroso-R salt concentration on analytical signal in conventional FI-HGAAS. The signals were obtained using 0.500 mL of 10.0 ng/mL Pb in 0.06 mol/L HCl …..……………………………………………………………...
124
3.37 The effect of collection and release temperatures on analytical signal for 5.0 ng Pb. During the variations of collection and release temperatures, a constant release temperature of 1300 ˚C and a constant collection temperature of 350 ˚C, respectively, were employed …...………………………………........
125
3.38 Effect of collection Ar flow rate on the analytical signal obtained by W-coil HGAAS; H2 flow rate was 100 mL/min, release Ar flow rate was 210mL/min; 0.500 mL of 10 ng/mL Pb was used ….……………………………….
127

xxiii
3.39 Effect of release Ar flow rate on the analytical signal obtained by W-coil HGAAS; H2 flow rate was 100 mL/min, release Ar flow rate was 210 mL/min; 0.500 mL of 10 ng/mL Pb was used ...…..………………………………………
127
3.40 The dependence of analytical signal on the collection temperature of Pt coated W-coil for 5.0 ng Pb. During the variations of collection temperature, a constant release temperature of 1300 ˚C was employed ………………………..
129
3.41 The effect of distance between the trap and atomizer on both peak height and peak area signals of Pb. 0.500 mL of 5.0 ng/mL Pb was used ……………..
130
3.42 Analytical signal versus collection volume obtained by using reagent blank solutions: 0.5% (w/v) K3Fe(CN)6 in 0.06 mol/L HCl and 1.0% NaBH4
(w/v) (reagent blanks gave a signal equal to that obtained from 0.2 ng/mL Pb, and no Pb was added); collection temperature, 350 ˚C; release temperature, 1300 ˚C ……………………………………………………………...…………..
132
3.43 The analytical signals for 2.0 mL of 5.0 ng/mL Pb; Collection at 350 ˚Cand releasing at 1300 ˚C …..………………………………………………….…
133
3.44 The calibration plot drawn by using peak height for 2.0 mL of aqueous standard solutions of Pb in 0.5% (w/v) K3Fe(CN)6 under optimum conditions (No blank correction was made) ………………………………………………...
134

xxiv
LIST OF ABBREVIATIONS
AAS …………. Atomic Absorption Spectrometry
AES ………...... Atomic Emission Spectrometry
CF …………… Continuous Flow
CV …………… Cold Vapor
CVG………….. Chemical Vapor Generation
CVAAS ……… Cold Vapor Atomic Absorption Spectrometry
EcHG ………... Electrochemical Hydride Generation
ETAAS ……… Electrothermal Atomic Absorption Spectrometry
ETV …………. Electrothermal Vaporizer
FAAS ………... Flame Atomic Absorption Spectrometry
FEP ………….. Fluorinated Ethylene-Propylene
FI ….…………. Flow Injection
GLS ………….. Gas Liquid Separator
HG …………... Hydride Generation
HGAAS ……... Hydride Generation Atomic Absorption Spectrometry
i.d. …………… Inner Diameter
ICP ..……….... Inductively Coupled Plasma
LOD ..………... Limit of Detection
MS …………... Mass Spectrometry
o.d. …………... Outer Diameter
OES ………….. Optical Emission Spectrometry
QTA …………. Quartz T-tube Atomizer
RSD …………. Relative Standard Deviation
VGAAS ……... Vapor Generation Atomic Absorption Spectrometry

1
CHAPTER I
INTRODUCTION
The metals and their compounds have important physiological and toxic effects in
living systems. While some of them are essential for the biological activities in
living systems, the necessity and essentiality of others have not been proven yet.
Some heavy metals including Hg, Cd and Pb show toxic effects even at very low
concentrations. They have the potential of adverse effects in the biological
systems. In addition to environmental and biological considerations, the presence
of metals even at trace concentrations may alter the physical characteristics of
alloys. Therefore, the determination of traces and ultra-traces of such elements in
environmental, biological and metallurgical samples is very important. Since the
desired detection levels in such determinations are very low, highly sensitive and
precise techniques are needed. In addition the technique must be fast and easy to
apply. Atomic absorption spectrometry (AAS) is a well established and
extensively used technique for the determination of metals and metalloids in
environmental and biological samples for many years. In the last two decades,
inductively coupled plasma optical emission spectrometry (ICP-OES) and mass
spectrometry (ICP-MS) have become very popular. However, AAS is still the
most widely used method since it is relatively inexpensive and easy to apply, and
also accessible in most analytical chemistry laboratories.

2
1.1 Atomic Absorption Spectrometry
Atomic absorption spectrometry is one of the most popular techniques for the
determination of trace elements. Due to its high specificity and selectivity as well
as relatively simple operation, AAS has preserved its place alongside ICP-OES
and ICP-MS. The actual birth of modern AAS was in 1955. Although the
publications by Alkemade and Milatz in Netherlands, and Alan Walsh in Australia
appeared in the same year, Alan Walsh is generally recognized as the father of
modern AAS [1]. About 60 elements can be determined by AAS.
The technique is based on the measurement of selective absorption of light by free
atoms created in an atomizer. The main components of an AA spectrometer are:
(1) a lamp which emits a beam of light at suitable wavelength to be absorbed
selectively by analyte atoms, (2) an atomizer that converts analyte species into
gaseous atoms (3) a wavelength selector which selects a bandwidth of desired
wavelength (4) a detector that measures the intensity of light. AAS techniques can
be classified into several categories depending on the atomization and/or sample
introduction procedures followed in order to obtain analytical signal. According to
a recent publication, where the characteristics of each are summarized, these are
flame AAS (FAAS), electrothermal AAS (ETAAS), vapor generation AAS
(VGAAS), and hyphenated AAS techniques where one or more techniques are
combined [2]. Usually the sample is dissolved / decomposed in acids or other
chemical reagents and then introduced to the atomizer as solutions. In addition,
some methods of AAS allow solid and slurry sampling.
1.1.1 Flame AAS
Flame AAS, where flame is used for the atomization of the analyte, is relatively
easy to use, accessible and low cost technique; whenever possible it is preferred

3
over others. The temperature of the flame and thus the atomization efficiency
depends on types of fuel and oxidant as well as fuel to oxidant ratio. The analyte
must be taken into usually aqueous phase and then introduced to the flame via a
nebulizer at a flow rate of 5-10 mL/min. The function of nebulizer is to convert
liquid phase into a mist composed of small droplets, called aerosol, by a
pressurized gas flow. The larger droplets are not allowed to reach to the flame
since they alter the temperature and thus atomization efficiency. The nebulization
efficiencies of nebulizers commonly employed in FAAS instruments does not
exceed 10%; only this amount of the aspirated solution is converted to aerosol and
reaches to the flame. The low efficiency of nebulizers is one of the most important
drawbacks of FAAS. High efficiency nebulizers are also available, but the solution
flow rates are low, µL/min, which are suitable for highly sensitive techniques such
as ICP-MS [3, 4]. The atomization of analyte takes place in the flame as a result of
temperature and chemical reactions. The analytical beam of photons to be
absorbed by the atoms is forwarded through the flame and the absorption occurs
therein. The absorption by the analyte atoms is a function of their concentration in
the flame. The need for large sample volume is another limitation of FAAS. In
case of limited sample volume micro-injection can be employed but the sensitivity
is decreased. The dilution of the analyte species in the flame due to the high
velocity of flame gasses, 10-30 L/min, is usually considered as a disadvantage, but
if there is no limit of detection problem, it appears to be an advantage when the
heavy sample matrix has a significant depression effect on the analytical signal.
FAAS often lacks sensitivity at analyte concentrations below 0.1 and 10 µg/g in
liquid and solid samples, respectively.
1.1.2 Vapor Generation AAS (VGAAS)
In vapor generation AAS the analyte is converted to its volatile species by
chemical or electrolytic means and then introduced to the atomizer in the gas
phase. As a sample introduction method, it offers significant advantages over

4
conventional nebulization. It is a simple and low cost method providing high
sensitivity and low LODs because of high chemical yields and high transport
efficiency to the atomizer. It provides analyte separation from the matrix which
may become a serious problem during atomization. It enables enrichment of
analyte and speciation as well as automation in flow injection (FI) and continuous
flow (CF) modes. In some cases, it has fairly high sample throughput rates,
typically 40-100 /hour [5, 6].
Hydride generation AAS is currently the most popular vapor generation method
which can be applied to the determination of elements which form relatively stable
and volatile hydrides [5]. Cold vapor AAS (CVAAS), another method of vapor
generation where the analyte is converted to atomic vapor at ambient temperatures,
can be applied to determination of Hg and more recently Cd; in fact Cd is first
converted to unstable hydride that quickly decomposes to atomic vapor and
hydrogen [7]. Investigations were also made on other ways to selectively vaporize
analytes. In 1975, Skogerboe et al. [8] vaporized Bi, Cd, Ge, Mo, Pb, Sn, Tl and
Zn as their chlorides which are subsequently forwarded to a microwave induced
plasma (MIP). Volatilization of Ni as its volatile carbonyl compound had never
been exploited for analytical purposes until 1980, when an AAS determination
method was described [9]. Brueggemeyer and Caruso [10] determined trace
amounts of lead by quartz furnace AAS after converting to its tetramethyl
compound. Speciation of lead and methylead ions by chromatographic separation
and AAS detection after ethylation with sodium tetraethylborate was described in
1986 [11]. Sturgeon et al. [12] used sodium tetraethylborate for vapor generation
and subsequent sequestration of volatile lead species in graphite furnace followed
by atomization there. Elements have also been volatilized as their oxides, and
chelates such as -diketonates, dithiocarbamates and trifluoroacetylacetonates [1,
6].

5
1.1.2.1 Hydride Generation (HG)
Method of hydride generation involves the conversion of analyte in the solution
phase to its volatile hydride by chemical or electrochemical reactions. It has been
used over 100 years for the determination of arsenic in methods known as Marsh
reaction or Gutzeit test [1, 5]. Hydride generation as a method of sample
introduction to AAS was used for the first time by Holak in 1969 [13] for the
determination of As. In this study, after collecting the generated arsine in a U tube
that was immersed in liquid nitrogen, the U tube was brought to room temperature.
The evaporated hydride is sent to flame via spray chamber. HGAAS is currently
the most popular method for the determination of trace amounts of elements which
form volatile covalent hydrides. Although Cd can be determined by CVAAS, it
can also be included into the list of hydride forming elements since the acidified
solution of Cd reacts with tetrahydroborate to form volatile Cd species,
presumably hydride with a very unstable nature.
The complex on-line chemistry involved in the hydride generation process is one
of the limitations of HGAAS. Since the oxidation state and the form of the element
effects the efficiency of hydride generation, specific sample pretreatment may be
required. The chemical interference is sometimes a serious problem during hydride
release or atomization. Due to the large number of parameters to be optimized, the
possibility of multielement determination is low. Foaming and aerosol formation
due to the vigorous reaction between sample and the reductant solution may be a
serious problem for the transportation of vapor species to the atomizer due to
condensation in the transfer tubings. Dilution of vapor species by the carrier gas
can be considered as another disadvantage [5, 6].
For analytical purposes, two different chemical vapor generation methods have
been used to generate volatile hydrides. The first one that was used in the earlier
stages of HGAAS was metal/acid (usually Zn/HCl) system. Zinc metal in the
6
forms of granules, tablet, dust or slurry was added to acidified sample solution.
Reaction vessels were most frequently flasks equipped with a dosing fitting for the
introduction of metal [14, 15]. The metallic zinc reacts with hydronium ion and
this is followed by the formation of volatile hydride. The reaction can also be
achieved by a flow of acidified sample solution through a Zn column [16]. Other
metal acid reactions involved in HG include mixtures of Mg-TiCl3 reacted with
HCl and H2SO4 to produce arsine, hydrogen selenide, stibine and bismuthine.
Aqueous slurry of Al was also reacted with HCl to generate arsine, hydrogen
selenide, stibine [17]. Because of the slow rate of these reactions which results in
band broadening in signal shape, a balloon system which functioned to collect
reaction products with subsequent rapid expulsion to the atom reservoir was
described and frequently used in the early stages of HGAAS [18].
The second type of chemical reaction used in AAS utilizes tetrahydroborate/acid
reduction system. The reaction between tetrahydroborate and hydronium ion is a
fast reaction. If it is carried under solutions with a pH of less then 1, the
tetrahydroborate decomposition is complete within a few microseconds [5, 19].
Although tetrahydroborate reduction to form elemental hydrides had been used for
synthetic purposes, the technique was introduced to the atomic spectroscopy in
1972. In the early years, the sodium tetrahydroborate was used in solid form and
pellets of it were added to the reaction chamber. Use of tetrahydroborate as
aqueous solutions was suggested by Braman et al. [20]. Since then, use of
tetrahydroborate dramatically increased in popularity since it offers advantages
over metal/acid system. Currently the most commonly sodium, rarely potassium
salts of tetrahydroborate are almost exclusively used for hydride generation. Since
the reductant dissolved in water is not very stable in the solution phase, usually
stabilization is required by increasing the pH of solution by the addition of 0.05-
2% sodium or potassium hydroxide [5]. Recently use of aminoboranes and
cyanotrihydroborate reagents in HGAAS was investigated and their reactivity
towards Hg and hydride forming elements were reported [21].

7
Currently, in most of the studies, the HG reaction is carried out by merging the
acidified sample solution with aqueous tetrahydroborate solution. However, rarely
the reaction has also been carried out by other means such as employing solid
tetrahydroborate. Tian et al. [22] developed a system called movable reduction bed
HG in which analyte solution, without acidification, was injected onto a tape on
which a premixed potassium tetrahydroborate and a solid organic acid was
deposited. Maleki et al. [23] have also used solid sodium tetrahydroborate
reductant premixed with tartaric acid for the determination of Pb using sodium
peroxodisulfate.
Hydride generation can also be achieved via electrolytic reactions employing an
electrochemical cell; which is called electrochemical hydride generation (EcHG).
The volatile species are formed on the cathode surface. The most important
advantage of EcHG based on the reduction of tetrahydroborate consumption is that
analyte concentration in reagent blanks is very low when compared to chemical
means. Thus, excellent limit of detection values can be obtained by EcHG [5].
Ding and Sturgeon [24] studied the electrochemical hydride generation and in-situ
preconcentration of As and Se on Ir-Pd coated graphite tubes and reached the
detection limit of over ng/L ranges.
1.1.2.2 Mechanism of Hydride Generation
The mechanism of the hydride generation is still a matter of debate after more than
30 years from its introduction to AAS. The hypotheses on the hydride generation
are classified into two classes. The first and widely accepted one is based on the
assumption that the effective species in the mechanism is the atomic hydrogen or
“nascent hydrogen”. The second class mechanisms are those which are not
included in the nascent hydrogen hypothesis. This second class has been termed
“non-nascent hydrogen” mechanism [25].

8
Nascent hydrogen mechanism was firstly suggested by Robbins and Caruso [17]
who postulated that when Zn metal or tetrahydroborate reacts with hydronium ion,
nascent hydrogen, that is reactive and responsible for the formation of hydride, is
formed according the following reactions, respectively:
Zn + 2 H3O+ → Zn2+ + 2 H2O + 2 H
BH4¯ + H3O+ +2 H2O → H3BO3 + 8 H
where H is nascent hydrogen. Then the nascent hydrogen reacts with the analyte
for the generation of hydride as follows:
Am+ + (m + n) H → AHn + m H+
Recently, Laborda et al. [26] strongly criticized the nascent hydrogen mechanism
on the base of thermodynamic consideration that neither tetrahydroborate nor Zn
would be able to perform the reduction of protons to atomic hydrogen. They
concluded that in both chemical and electrochemical hydride generation, no
nascent hydrogen has to be involved and the generation of the hydrides can be
considered as hydrogenation process. They proposed the following generalized
mechanism for the formation of hydride of analyte ion Am+;
Am+ + (m+n)/8 BH4- + 3 (m+n)/8 H2O → AHn + (m+n)/8 H3BO3 + (7m-n)/8 H+
where m and n represent the oxidation state of analyte and coordination number of
hydride, respectively.
More recently, D’Ulivo and coworkers studied the generation mechanism to verify
the validity of nascent hydrogen mechanism. However, it was concluded that Sn,
Sb and Bi hydrides could be generated by the direct action of borane complexes
without the need of their decomposition. It was shown that nascent hydrogen

9
mechanism failed to explain the generation of hydrides in different experimental
conditions in a pH range between 4.3 and 12.7 [25].
The electrochemical generation mechanism is considered to take place in at least
two sequential events [26]:
1) reduction and deposition of the analyte onto the surface of cathode
Am+ + me- → A(o)
2) formation of the hydride from the deposited metal or metalloid
A(o) + nH → AHn
Where H represents a hydrogen atom from an unspecified source (adsorbed H
atom, reduced from H3O+ or reduced from H2O).
1.1.2.3 Methods of Hydride Generation AAS
The classification of hydride generation AAS is given in Figure 1. There are two
basic hydride generation methods which are direct transfer mode and collection
mode. In the former the generated hydride of the analyte released from the solution
was directly transported to the atomizer. The direct method is divided into three,
namely continuous flow (CF), flow injection (FI) and batch mode. Continuous
flow hydride generation method uses the continuous delivery of reductant and
acidified sample solution with the help of a constant flow pump and they combine
in the reaction coil. Then the released volatile hydride is separated from the liquid
phase via a gas liquid separator and sent to the atomizer using a carrier gas.
Usually, a stripping coil is employed for the introduction of carrier gas before gas
liquid separator in order to achieve efficient separation of vapor species of analyte
from the solution phase. This is vital in case of hydrides whose stabilities are low

10
and solubilities are high in reaction media, or in case of possible interferents
present in the solution [5].
Figure 1.1. Classification of hydride generation methods [5].
In FI mode, which is similar to CF but instead of continuous delivery of analyte
solution, a defined volume of sample is injected into a stream of carrier solution
that is usually blank. The plug of sample is carried by the carrier and subsequently
merged with reductant. In batch mode, a definite amount of reductant solution is
added to acidified sample solution rapidly, or vice versa, and the evolved hydride
is transported to atomizer by a flow of purge gas.
In the collection before transfer to atomizer, first the generated hydride is trapped
in a collection device until the release is complete and then they are sent to the
atomizer all at once. The evolved hydride can be trapped in an absorbing media or
in a cryogenic trap cooled in liquid nitrogen. Cryogenic trapping is applicable to
hydrides which are stable during both trapping and revolatilization. However, all
hydrides are not stable for revolatilization after collection. Another way is to
collect the evolved hydride under pressure. This method is used much more
frequently in the early years since the reduction carried out by Zn/acid systems is
slow [18]. Cryogenic trapping is also used today since the analyte vapor is
preconcentrated before measurement. Methods employing in-situ trapping where
Hydride Generation (HG)
Direct transfer to atomizer Collection before transfer to atomizer
1) Continuous flow HG (CF-HG) 2) Flow injection HG (FI-HG) 3) Batch type HG
1) Cryogenic trapping 2) Adsorbing media 3) Under pressure

11
the analyte is trapped in the atomizer are not classified among the collection
modes since the hydride leaves the generator uncollected and it is considered as
the first stage of atomization [5]. In addition, in the in-situ trapping techniques, the
hydride is decomposed during collection and thus it is no longer hydride.
1.1.2.4 Hydride Forming Elements
The elements which form volatile hydrides and are usually determined by HGAAS
are As, Bi, Ge, Pb, Sb, Se, In, Sn, Te and Tl [5]. Cadmium can also be included in
the hydride forming elements since it is converted to volatile species when reacted
with sodium tetrahydroborate [27] although the species are not stable [7, 28]. In
1996, it has been shown that volatile species of Cu can be obtained when acidified
Cu solution is reacted with sodium tetrahydroborate but not proven to be hydride.
[29]. Guo and Guo studied the generation of volatile species of Zn via
tetrahydroborate reduction and Sun et al. determined by atomic fluorescence
spectrometry (AFS) after hydride generation from surfactant based organized
media [30]. The generation of volatile Ni species by the reaction of acidified
solution with tetrahydroborate for the first time was reported by Guo and
coworkers [31]. More recently, although the nature of volatile species is not
known, Ag, Au, Co, Ir, Mn, Pd, Pt, Rh, and Ti were added to the list of elements
which form volatile species when reacted with sodium tetrahydroborate [32-36].
The nature of species is thought to be molecular and probably hydride, but remains
unknown. It is reported that generated species of transition and noble metals are
relatively unstable in solution and are quickly lost during their generation and
subsequent transport [36]. For efficient detection, rapid phase separation is
necessary [36]. However, it is also proposed for Ag, Cu and Pd that the initially
formed species by the reaction with tetrahydroborate are atomic, since the atomic
signal with a narrow absorption bandwidth is achieved in the solution phase, and
followed by a rapid cluster formation with other atoms [37].

12
Most of the hydrides detected by HGAAS have very low boiling points and
present in the gas phase at ambient temperature. The boiling points of As, Bi, Pb,
Sb, Se and Sn hydrides are -62.4, +16.8, -13, +18.4, -41.3 and +52.5 ˚C,
respectively [5]. However, the hydrides of some transition metals are not volatile
and present in the solid phase under normal temperature and pressure [38, 39]. The
stabilities of volatile hydrides are crucial if collection methods are to be used since
revolatilization is necessary. Fujita and Takada [40] studied the stabilities of As,
Sb, and Bi and found that although As and Sb hydrides are stable, Bi hydride is not
stable even at room temperature. They also calculated the rate constants for the
decomposition of gaseous bismuthine and found that its half lives at 0 ˚C and 40 ˚C
are 14.7 and 2.4 min, respectively. Their results supported the findings of
Fernandez [41] who observed that prolonging the collection time for bismuthine in
a balloon system resulted in a much poorer limit of detection.
1.1.2.5 Hydride Generation Efficiency
Hydride generation can be considered as a sequential processes including
conversion of analyte to its hydride, transfer of volatile hydride to the gas phase in
the generator and transportation of released hydride to the atomizer/ionizer. The
obtained analytical signal depends on the efficiency of each process. Total hydride
generation efficiency is the fraction of analyte transported to the atomizer in the
form of hydride [5]:
g=No/Co*Vs
Where No is the total number analyte atoms transported to the atomizer in the form
of hydride, Co is the concentration in the sample, and Vs is the volume of sample
used in the generation process. Since the total process is combination of sequential

13
steps, the above formula can be written for each step. The hydride release
efficiency (r) is the fraction of released analyte atoms (Nreleased) in the form of
hydride to the total number of analyte atoms in the solution as follows
r=Nreleased/Co*Vs
In a similar way, hydride transport efficiency (t) is the total number of released
atoms reaching to the atomizer in the form of hydride to the number of released
atoms as hydride:
t=No/Nreleased
If a collection method is not employed, the total efficiency is the multiplication of
efficiencies of individual steps, Otherwise collection and revolatilization
efficiencies must be taken into account.
g=r*t
Hydride release efficiency depends on the amount of tetrahydroborate,
concentration of acid, design of generator, mixing process of reductant with
analyte temperature and the kinetics of reaction mechanisms. It is also affected by
the purge gas flow rate which is used for stripping of the solution for efficient
separation of volatile species from the liquid phase [5]. There are also other
parameters affecting release efficiency such as addition of catalytic reagents or
creating microenvironments in the solution as in the cases of hydride generation of
lead and cadmium, respectively.
Generated hydride is transported to the atomizer by a flow of purge gas. Hydride
transport efficiency is critical for the evaluation of total efficiency. Losses of
hydride during transportation on the surfaces of generator and transport lines can
be a serious problem. Such losses are probably due to decomposition or sorption.

14
The hydride may be dissolved in water droplets usually present in the gas liquid
separator and / or in the condensed water on the surfaces of transfer tubings. The
physical properties of the material making up the generator and the transfer lines,
such as size, diameter and volume, and also chemical properties may have
significant influence on the transport efficiency. An efficient way of minimizing
such losses are the silanization of glass surfaces to make it hydrophobic, using the
transfer tubings as short as possible, minimizing the surface area that hydride
come in contact by using tubings of smaller diameter and relatively small gas
liquid separator. In order to minimize the condensation of water vapor, various
desiccants have been suggested to remove moisture in gas phase stream. However,
they must be used carefully since some hydrides may be trapped on such
desiccants. Another way of removing water vapor is to use hygroscopic
membranes such as nafion [5].
1.1.2.6 Atomization in HGAAS
1.1.2.6.1 Atomizers used in HGAAS
In the early years of HGAAS, the classical burners were used as atomizers and
generated hydride was introduced via nebulizer. Due to strong absorbance of
air/acetylene flame especially at short wavelengths, N2- or Ar- hydrogen entrained
flames were used. Later on the use of open ended Vycor glass (95-96% SiO2) as an
absorption tube which was heated externally by a resistance wire was introduced
by Chu et al. 1972 [14]. This was the first study where a T-tube was used as
atomizer. Later on different quartz T-tube designs were developed.

15
Today, there are three types of atomizers commonly employed for the atomization
of hydride [5]:
1) inert gas hydrogen diffusion flame,
2) quartz tube atomizer
3) graphite furnace
The most commonly employed atomizers in HGAAS are flameless or flame-in-
tube quartz T-tube atomizers (QTA) which can be heated externally by air
acetylene flame or electrically. Graphite atomizers have also been used in hydride
atomization but not extensively used in continuous flow or flow injection systems
because of difficulties of coupling HG system to ETAAS. In addition, moderately
heated graphite ends are capable of trapping hydride if it is introduced through
purge gas. They are used in in-situ preconcentration methods and will be discussed
later.
1.1.2.6.2 Atomization Mechanism
The temperature achieved by QTA does not exceed 1300 ˚C which is not sufficient
for complete atomization of hydride forming elements. Ddina and Rubeska have
made serious effort to elucidate the mechanism involved in the atomization of
hydrogen selenide using flame in tube atomizer. They found evidence that the
atomization of selenium hydride proceeded via collision with free hydrogen
radicals [5]. The proposed mechanism for the formation of hydrogen radicals in
flame in tube atomizer is as follows:
H + O2 → OH + O
O + H2 → OH + H
OH + H2 → H2O + H

16
According to their hypothesis, the atomization proceeds most probably via the
interaction of hydride with H radicals as exemplified by selenium hydride as
follows:
SeH2 + H → SeH + H2
SeH + H → Se + H2
Ddina have shown that the atomization in flame-in-tube atomizers and externally
heated atomizers are identical. The only difference is the formation of hydrogen
radicals [42]. Later, investigations were focused on the atomization of mainly
hydrides of Se, As and Sb. Although radicalic mechanism has not been proven, the
results of experiments have been interpreted without problems using that theory
[43].
Welz and Melcher [44] investigated the effect of O2 on atomization of arsine and
some other hydrides and reported that hydrogen is essential for the atomization of
arsine. The atomization of gaseous hydrides in a heated quartz cell is caused by
collision with H radicals which are generated by a reaction with O2 at elevated
temperatures. The effect of temperature is more if the O2 concentration is very
low. In the absence of H2 although arsine is decomposed in a quartz cell it is not
atomized. They have also demonstrated that the surface characteristics also play
important role in atomization via generation of H radicals by unsaturated oxygen
atoms at the surface. They generalized the atomization mechanism as follows:
MHn + H → MHn-1 + H2
MHn-1 + H → MHn-2 + H2
:
MH + H → M + H2

17
In 1997, Johansson et al. [45] investigated the spatial distribution of lead atoms
along the cross-section of QTA to elucidate the mechanism of alkyllead. They
found that the diameter of the quartz atom cell is important for the distribution of
atoms. Furthermore, H2 and CO are found to be equally efficient in promoting the
atom process. Therefore it has been suggested that in reducing environment,
hydrogen radicals are not essential for atomization of alkyllead and the
atomization is a thermal process.
In 1999, a direct method for the detection of hydrogen radicals in an analytical
H2/O2 flame was developed and the decline and consumption of hydrogen radicals
by As species introduced into the flame were monitored by electron spin resonance
(ESR). It was the first study for the observation of H radicals in the flame and the
experimental results supported the atomization mechanism by H radicals [46].
1.1.2.7 Interferences in HGAAS
The separation of analyte from matrix by hydride generation provides spectral
interference free measurements. Although some molecular emissions may be
observed, these are few, no line interferences occur at all [5]. Non-spectral
interferences may appear in solution phase or in gaseous phase. Liquid phase
interferences are caused by the interfering species in the sample solution.
Interferent may affect the rate of hydride generation or decrease the release
efficiency. If the interferent is volatilized together with analyte, it may affect the
analytical signal during transportation or in the atomizer. The most frequently
encountered and extensively studied interference is matrix interferences due to
inorganic compounds. The basic mechanisms of these interferences are
categorized by Ddina and Tsalev [5]. The ionic analyte may react with the ionic
interferent or the newly formed compound by the reaction of interferent and
reductant. Another possibility is that, the generated hydride may be captured by

18
the ionic interferent or the compound by the reaction of interferent and reductant.
The last way of interference in the liquid phase is the consumption of reductant by
the interferent so much that the remaining reductant would not be sufficient for the
effective reduction of analyte.
Significant interferences are observed in the presence of strong oxidants, transition
and noble metals and the other hydride forming elements. The interferences by the
transition and noble metals are the mostly pronounced and thus extensively studied
ones. Dilution of sample solution partly minimizes the interference but the
sensitivity is degraded [5]. The interferent ion may be separated from the solution
using appropriate methods [47, 48]. Masking agents, which bind interferent to a
non-reactive form, are effective to remove both hydride-ion and hydride-product
interferences [49].
1.1.3 Electrothermal AAS
Electrothermal AAS, due to its high sensitivity and specificity, is one of the most
promising methods for the determination of trace elements. In this technique,
usually the graphite tube and rarely metal atomizers which are heated electrically
to high temperatures, serve as atomizers. Metals such as W, Mo and Ta, have also
been used as atomizers for many years but not been widely commercialized yet.
Since ETAAS allows gas, solution, slurry or solid sample introduction, it is widely
used in the analysis of environmental and biological samples. After the sample is
dried, an ashing procedure is applied to remove matrix for interference-free
atomization, the temperature increased rapidly by applying a high voltage to both
ends of the sample cuvette and the atomization is achieved.

19
1.1.3.1 Graphite Atomizer ETAAS
L’vov was the first person who used an electrically heated furnace for the
atomization and published his works in 1959 [1]. The temperature can be
increased up to 2900 ˚C at a rate of 2-4 ˚C/ms. Since the nebulization is eliminated
and residence time of the atoms in the graphite tube are longer than FAAS, the
sensitivity is usually about 2-3 orders of magnitude higher than that obtained by
FAAS.
Matrix interferences are usually the main problem encountered in GFAAS due to
small dilution of sample matrix during atomization. Thus the ashing step is one of
the most critical steps in ETAAS. The purpose of ashing is to remove most of the
constituents injected without loosing analyte; i.e. to leave the analyte at the
atomization step with a minimum of matrix elements. Another important
consideration is isoformation; all the analyte species in the sample must be turned
into the same form before atomization. During the determination of volatile
elements, chemical interferences often occur in graphite furnaces due to co-
volatilization of the analyte with matrix constituents in the ashing step. In those
cases, usually matrix modification by the addition of chemical modifiers such as
MgNO3, Ni(NO3)2, Ir, platinum group metals (PGM) and carbide forming
elements such as W, Zr is required [1]. The purposes of matrix modification are 1)
to decrease analyte volatility to prevent losses of analyte during pyrolysis, 2) to
volatilize matrix elements to prevent interferences during atomization, 3)
transformation of all chemical forms of analyte into one form to atomize them at
once (isoformation) [50]. High cost of instrument when compared to FAAS is the
other disadvantage of this technique since it requires a complex and powerful
heating system. Consumables such as graphite tubes are also cost effective. The
technique has rather poor speciation capability and low sample throughput. When
compared to metal atomizers, GF-ETAAS has the disadvantage of requirement of
an external cooling system after each atomization. In last two decades, ETAAS

20
systems have been used as ETV devices for the sample introduction systems prior
to other determination techniques such as ICP-AES and ICP-MS.
1.1.3.2 Metal Atomizer ETAAS
Although the most common atomizer in ETAAS is graphite tube, the limitations
such as need for a high power supply and difficulties in the determination of
elements that form refractory oxides and carbides, have led to the development of
many metal atomizers [51]. Among the metal atomizers, tungsten has been the
predominant atomizer. In recent years, tungsten coils or tubes have been used as
an alternative atomizer to the graphite tube in the determination of elements by
ETAAS [52, 53]. Their use has been extended to ETAES, ETA-LEAFS as
atomizer and ICP-AES as vaporizer [54, 55]. The W devices used in atomic
spectrometry as atomizers or vaporizers are summarized in a recent review [51].
The other metals used as atomizer in ETAAS are tantalum [56], molybdenum [57]
and platinum [58].
Tungsten has the highest melting point (3410 ± 20 ˚C) among the elements in the
periodic table [59]. In addition, it has good electrical conductivity and may be
formed into different shapes reproducibly. Tungsten atomizers or vaporizers are
designed in different shapes including wire, ribbon, boat, foil, tube or coil. Among
them tungsten coil and tube are the most commonly used form of the metal. The
metal is relatively inexpensive and commonly used as filaments in ordinary
electrical bulbs. Beside these, tungsten is relatively inert, stable in air and water,
and resistant to high concentrations of common acids such as hydrochloric,
sulfuric and nitric acids under normal temperature and pressure [51].
The main advantages of W coil atomizer over graphite atomizer is that it needs a
relatively simple power supply compared to rather complicated and bulky power

21
system used to heat high mass graphite rapidly [51]. Besides, it enables the
determination of elements that form refractory oxides and carbides [1]. In addition,
the rate of heating for W-coil (30 K/ms) is about 10 times faster than that of
graphite tubes (2-4 K/ms) [60]. Another advantage is the adaptability to portable
instrumentation [61]. It does not need an extra cooling system that is a requirement
for GF ETAAS, the cooling by purge gas is enough. These properties provide an
advantage of alternative atomizer to graphite atomizers or vaporizers in ETAAS.
However, at high temperatures, tungsten is easily oxidized in the presence of O2
and a reducing environment is required. In order to prevent oxidation, the metal is
purged with a mixture of hydrogen and argon during the atomization or
vaporization of analyte [51].
A temperature of 3300 ˚C, which is high enough for the efficient atomization of
most of elements, can be reached by a simple commercial W coil by applying a
current of 10 A. Tungsten atomizers can be used for the determination of all the
elements that have been determined by GFAAS except Mo which can present as
impurity in the W metal [51]. Recently, W coil atomizer has been employed for
the atomization of hydrides. Ribeiro et al. utilized W coil atomizer placed in quartz
T-tube for the atomization of Bi and As that were introduced as their hydrides [62,
63].
1.2 Preconcentration Methods
The detection of ultra-trace amounts of analyte in samples requires high sensitivity
and low limits of detection which can not be attained by using ordinary techniques.
The analyses of samples where the analyte concentration is low and the matrix
have a depression effect on analytical signal require preconcentration and / or
matrix separation methods. In preconcentration methods the analyte in a defined
volume of sample was concentrated before the achievement of analytical signal.

22
The preconcentration can be applied directly to the sample prior to determination
step or just before achievement of analytical during the determination. The most
popular preconcentration methods from liquid phase are evaporation of solvent,
liquid phase extraction, solid phase extraction and ion exchange; these can be
applied on line or off line. In these classical methods, the analyte in large volumes
of sample are collected on an adsorbing media or extracted to another phase and
then dissolved or back-extracted into a small volume of solvent. The
preconcentration factor is simply the ratio of volume being collected to final
volume if the recovery is 100%.
The electrodeposition on high melting point metals has also been used for both
preconcentration and then atomization in a number of investigations. The use of W
wire for electrochemical deposition and then ETAAS determination was proposed
by Lund and Larsen for the first time [64] and applied for the determination of Cd
in sea water [65]. Then they replaced W wire with Pt wire for the determination of
Cd in urine samples [66]. In these methods metal wires served as the atomizer.
Czobik and Matoušek [67] used W wire for the electrodeposition and subsequently
placed in graphite furnace atomizer for the determination of Ag, Cd, Cu, Pb and
Zn. Wolff et al. [68] reached a detection limit of pg/g level for Cd, Cu, Pb and Zn
using a tungsten wire for electrodeposition and subsequent atomization in graphite
rod atomizer. Recently, Barbosa et al. [69] developed a method of in-situ and on-
line electrochemical preconcentration on W-coil for the determination of Pb by
ETAAS. In another study, a Mg-W cell was used for the electrochemical
deposition of Bi on W wire and the atomization from the electrode surface inserted
into graphite furnace [70].
Cryogenic trapping is widely used for preconcentration of gaseous analyte species
and have been used extensively in HGAAS studies. Nowadays the most popular
preconcentration method for volatile hydrides is in-situ trapping in atomizers. In
recent years this method has appeared to be a powerful preconcentration method

23
since it provides significant enhancement in relative detection power and the
sensitivity. In addition to atomizers, the volatile species have also been collected
on ETV devices for subsequent detection by other detection systems than AAS.
1.3 In-situ Trapping Techniques
In-situ trapping are nowadays one of the most popular preconcentration methods
for the determination of elements that can be volatilized by vapor generation
methods. The most common one is the preconcentration graphite tubes. The
graphite tube is used for the thermal decomposition of volatile hydride and
trapping analyte species in the tube thereby affecting a clean separation from the
matrix before atomization as well as preconcentration [71]. In this technique, the
advantages of both vapor generation and graphite furnace ETAAS are combined
[6]. The analyte is separated from the matrix by vapor generation and detected by
a powerful ETAAS. The advantages provide enhancement in the relative detection
power over conventional batch or continuous HGAAS. The effectiveness of the
method depends on the hydride generation, transportation and the collection
efficiency. There is large number of reports on the successful application of this
method for the determination hydride forming elements [71].
The method of collection of vaporized analyte species in atomizer and the
subsequent atomization was described first described by Drasch et al. [5]. He used
commercial graphite furnaces as a trapping medium and also as the atomization
cell. Lee was the first to utilize this technique in the form as practiced today on
carbon rod atomizer [72]. He showed that 72 % of the generated Bi was captured
in the graphite rod atomizer; 85% of which is collected on the supporting
electrode; only 15% of the collected amount is in the carbon rod cell. Sturgeon et
al. found that the generated stibine is trapped on partially scrapped pyrolytic
graphite tube, with an efficiency of 84 % [73].

24
In-situ trapping in graphite tubes suffer from a number of disadvantages including
need for a well developed porous graphite structure, high deposition temperatures
for some elements (As, Sn) and little chance of multielement detection due to
different hydride generation and collection conditions. The trapping efficiency of
graphite tube can be increased by coating the graphite surface by carbide forming
elements [74] or platinum group elements (PGM) [75] since the analytes are
trapped on those surfaces by chemical interactions. The coating material can be
applied as a mixture as well as alone. Usually the trapping on such coated surfaces
requires lower trapping temperatures. Use of coating material may also enables
multi-element determination; using appropriate coating material, more than one
element can be collected under the same conditions.
Sturgeon et al. compared the stabilization effects of platinum group metals (PGM)
for As Sb Se Bi and Sn, and mentioned that the effect of PGMs is catalytic
decomposition due to their affinity for H2 and Pd has the most stabilizing effect
over others [75]. Li et al. also stated that coating with Pd significantly increases
the trapping efficiency and reduces the trapping temperature for As Sb, Se [76]
and Bi, Ge and Te [77]. However Pd as a coating material is not permanent and
must be injected before each collection atomization cycle.
In contrast to Pd coating which must be repeated before each trapping, Ir coating is
stable if the temperature does not exceed 2300 ˚C. Carbide forming elements such
as tungsten and zirconium also increase the trapping efficiency in the graphite
furnace. Liao and Haug studied the trapping efficiency of graphite tubes coated
with carbide forming elements (Zr, Nb, Ta, W) and noble metals (Ir, Ir/Mg, Pd/Ir)
for Se, Te [78], and As, Sb and Bi [79]. They showed that Ir/Mg coated tubes traps
Se and Te better than Ir coated tubes. Because of high sensitivity and better long
term stability, Zr-coated graphite tubes are recommended for the trapping and
concentration of As, Se and Bi. Tsalev et al. [74] evaluated the performance

25
characteristics of Ir-Zr- and Ir-W- treated platforms in an automated FI-HG-
ETAAS system and found that Ir-Zr treated platforms are more suitable than those
treated with Ir-W for trapping hydrides. Beside increase in trapping efficiency and
higher sensitivity, the use of modifiers provide simultaneous multielement
determination with a multichannel spectrometer. Garbo et al. [80] developed a
method for the determination of As and Se by trapping their hydrides and
detection with a multichannel AAS simultaneously; resulted in doubled sample
throughput. Murphy et al. [81] used Ir coating for the simultaneous determination
of Bi and Se after preconcentration on Ir coated graphite tube.
Although there are many reports on in-situ trapping in graphite tubes, use of W
atomizer for in-situ trapping of volatile analyte species have appeared in limited
number of studies. In a recent work, Doekal and Marek [82] studied the trapping
hydrides of Se and As in a tungsten tube atomizer and showed that when coated
with Pt, Ir or Re, the trapping efficiency of tungsten atomizer increases
significantly. The most efficient trapping approaching to 100% was observed at
trapping temperatures of 100-200 ˚C when the W tube was treated with Pt. The
collection temperature on Ir and Re coated tubes was as high as 700-900 °C and
the trapping efficiency was only 10%. In another study, Rh coated W coil atomizer
was also used for in-situ trapping of selenium hydride [83].
1.4 ETV Techniques
Scientists have been interested in developing better sample introduction methods
for spectroscopic techniques in order to achieve highest efficiency. Various
methods have been used as sample introduction techniques to the atomization or
ionization sources. The most common method is pneumatic nebulization. Different
designs of nebulizers have been discussed and each type presents different
advantages and limitations [3, 4]. In addition, hydride generation and liquid

26
chromatography have also been used as sample introduction methods for ICP-OES
and ICP-MS as well as AAS. Although transport efficiency of hydride generation
approaches to 100%, it can be applied to a limited number of elements that form
volatile hydride. Laser ablation (LA) has also been employed for the introduction
of solid materials to high temperature ionization sources.
In recent years, ETV has became an important tool for the sample introduction to
independent detection systems especially for ICP-AES or ICP-MS. In ETV the
sample was introduced to the measurement unit by vaporization in ETV device. It
provides effective matrix removal and high transport efficiency. Its main concern
is in plasma spectrometry since matrix problems appeared commonly in plasma
spectrometry such as change in plasma conditions and isobaric interferences due to
the plasma gas and concomitant elements. The advantages of ETV making it an
attractive tool for sample introduction method to the ICP-OES or ICP-MS are
summarized in ref [84, 85]. The sample introduction efficiencies are increased and
thus required sample volume is minimized. Matrix and isobaric interferences due to
the elements are reduced by applying appropriate sample pretreatment procedures.
The rate of sample introduction can be achieved by varying the heating rate of ETV
device. In addition, solid or slurry sampling is possible with ETV. The direct
production of an analytical signal from a solid sample offers a number of important
advantages resulting from the elimination of dissolution step; short analysis time, less
contamination risk, enhanced sensitivity and limit of detection smaller amount of
sample and no need to use hazardous chemicals [86]. The most widely used one is
the graphite tubes. Metal atomizers have also been employed in ETV methods.
1.4.1 ETV with Graphite Vaporizers
Graphite furnaces used in GF-ETAAS are the predominant types of ETV devices
[87]. Electrothermal vaporization on GF as a sample introduction method have

27
been studied and used for more than 20 years. The main disadvantage of this
method is the losses of analyte during transportation to the detection system by a
carrier gas. It was clear even early stages that the mass transport is not quantitative
and significant fraction of analyte did not reach to the measurement system [88].
The appearance of nonlinear calibration curves obtained was an indication of
losses during transportation. Schäffer and Krivan showed that the majority of
analyte losses occurred due to condensation on the colder ends of the graphite tube,
end cones and the interface between ETV and detection system. [89].
Kantor first used the theoretical prediction of analyte vapor from the ETV to the
plasma [90]. The efficiency is dependent on the formation of stable nuclei of size
exceeding critical diameter. For higher analyte masses the critical diameter
decreased and the transport efficiency increased. It is assumed that the presence of
particles acting as condensation and adsorption nuclei can enhance the transport
efficiency.
Studies on the improvement of transport efficiency have been focused on the use
of carriers. In order to increase transport efficiency, various modifiers were added
to the sample in the graphite tube and the transport efficiencies increased when
nanograms of samples are co-vaporized with micrograms of added modifiers. The
suggested modifiers include palladium, carbon, sodium chloride and magnesium
nitrate [91]. The use of halogenation by halocarbons added to the sample matrix
has also been investigated and found to be effective to assist the vaporization of
low volatility analytes. However they have the adverse affects of low atomization
efficiency in low temperature sources and isobaric interferences in ICP-MS [87].
ETV devices can also be used as a trap device for hydride preconcentration.
Uggerud and Lund [92] used ETV-ICP-MS following in-situ trapping of the
hydrides of Sb and As on Ir and Pd modified graphite furnaces. Matusiewicz and
Kopras applied ETV-MIP-OES method for the simultaneous determination of

28
hydride forming elements and Hg after in-situ trapping on modified graphite tubes
[93]. Chang and Jiang developed a method for the determination of Bi by ETV-
ICP-MS after preconcentration of its hydride on platinum coated graphite tube
[94]. Matoušek et al. investigated the mechanism of trapping and desorption of
volatile hydrides and mercury in modified graphite furnace and detection by ICP-
MS [95]. It has been found that the adsorption of arsine on Pd-Ir was interpreted in
terms of initial physisorption followed by chemisorption.
1.4.2 ETV with Metal Vaporizers
Besides the graphite furnace, tungsten vaporizers commonly in the form of boat
and coil have been used as ETV devices for liquid, solid and slurry sampling for
the sample introduction to independent sources as reviewed in a recent paper [51].
Two main advantages of W over graphite in the area of ETV-ICP-MS are the
elimination of isobaric interferences due to the presence of carbon in the plasma
e.g. 52Cr and 40Ar12C, and restrictions to vaporization temperatures below 2600 ˚C
[51]. In 1988 some rare earth elements were determined by W-coil ETV-ICP-OES
and it was found that the sampling efficiency and thus the detection power were
improved by two orders of magnitude when compared to nebulization ICP-OES
[96]. Barth et al. determined 15 trace elements in silicon carbide, silicon dioxide
and silicon nitride using W-coil ETV-ICP-OES [55]. They coated the W coil with
W-carbide to reduce the ablation of tungsten during vaporization and reported the
transport losses of the elements that ranged between 7% for La and 54% for Cu.
Levine and Wagner determined 10 elements in peach leaves and oyster tissue
samples using an ETV-ICP system employing a CCD detector. Their LOD values
are at picogram levels [97]. Shibata et al. used liquid sampling W furnace ETV-
ICP-MS for the determination of 14 rare earth elements; obtained limit of
detection values are at lower femtogram ranges for 20 µl sampling amounts
corresponding 0.1-0.6 ng/L in solution [98]. Hauptkorn et al. used slurry sampling

29
ETV-ICP-MS for the detection of 14 elements in high purity quartz and reached a
detection limit of 2 ng/g levels for Li and U [99].
It has been shown that by applying a temperature program for W-coil ETV device
some spectral interferences may be eliminated and low resolution miniature CCD
spectrometer can be used to achieve similar LODs compared to those by
traditional large monochromator ICP-AES [54].
Okamoto et al. developed a method of W boat-ETV-ICP-MS and applied
successfully for the determination of Pb in biological and rock samples [100, 101].
The use of W coil as an ETV for the sample introduction to AAS is rather rare
when compared to ICP-MS detection. Bruhn used the method for the detection of
elements with low atomization temperatures. The attained LODs were 100, 6, 80,
50 and 2 pg for Bi, Cd, Pb, Tl and Zn respectively [102].
The use of metal vaporizers for the preconcentration of hydrides is relatively new
and few studies appeared in recent years. Osama [103] used Pt coil for the
sequestration of volatile Cd species. Then the collected species were vaporized by
heating Pt coil and transported to unheated quartz T-tube atomizer for AAS
detection; high sensitivity and low limit of detection close to ETAAS values were
obtained. The use of W coil as an ETV for trapping hydrides and then
transportation to AAS, that is a part of this thesis, was described for the first time
and published in 2002 [104]. Very recently, Doekal et al. used Mo foil strip for
trapping As and Se hydrides and subsequent electrothermal volatilization to flame
for AAS detection [105]. They reported that the trapping temperature for the
analytes are significantly higher than that of reported for W coil atomizer. Guo and
Gou [106] used gold wire placed in the inlet arm of a quartz T-tube as a trapping
medium for selenium hydride. In addition to Au, some other metals in the form of
wire, foil or strip were also tested but these attempts were not successful except Ta

30
which is not preferred since it became very cracky due to the reaction with H2 used
for the transportation of volatile species. In this study, differing from the others,
the trapping material was heated externally with a Ni-Cr wire so that the transient
signal was completed in about 12 s.
1.5 Individual Elements
1.5.1 Bismuth
1.5.1.1 Importance of Bi
In recent years, Bi became an important element due to its chemical and physical
properties. The earliest use of Bi compounds in medicine appears to have been in
the middle ages. In 1786, it was administrated first for the treatment of dyspepsia.
In 1889, it was discovered that Bi might be useful as an antisyphilitic agent [107].
In modern pharmacy, it has been used for clinical and medical purposes for about
70 years for the treatment of syphilis. Since then, its pharmaceutical uses expanded
to antiacids, peptic ulcer treatments and topical dermatological creams [1, 108].
Recently, the effectiveness of Bi has been attributed to its antibactericidal action
against helicobacter pylori which was discovered in 1983 and may well initiate the
ulcer formation by excreting acid [109].
Bismuth has also been used in metallurgy, iron casting, electrochemistry, plastics
and pigments, lubricants and cartridges [110]. The presence of trace amounts of Bi
may influence several characteristics of different metallurgical materials affecting
physical, mechanical and magnetic properties depending on its concentration and
the composition of the material [62]. The presence of the metal in alloys even at
31
very low concentrations changes the characteristics of the metal. Bismuth promotes
iron carbide stabilization during the solidification process when added to steels.
On the other hand, even small amounts of this element may produce a decrease in
hot ductility, workability and cause the rupture of alloys and steels [111].
A number of toxic effects in human and animal have been attributed to Bi
compounds such as osteoarthropathy, hepatitis and neuropathology [70],
encepholopathy and nephrotoxicity [112]. In a recent study, it has been shown that
oral dosing with Bi compound is followed by Bi entering the nervous system of
mice with a particular predilection for motor neurons and it has been suggested
that Bi needs to be included in the list of potential toxins that enter motor neurons
[113].
Due to low abundance of Bi in the Earth’s crust, about 0.00002% and limited
absorption and its poor solubility compounds, the determination of Bi in
environmental and biological matrices require sensitive techniques. Furthermore,
since the usual level of Bi in biological and geological materials are µg/g or
ng/mL, usually the separation and preconcentration methods are required.
1.5.1.2 Determination of Bi
The techniques mostly used among the applications for trace Bi determination are
ICP-MS, ICP-AES and ETAAS. Schramel et al. determined Bi in urine with a
LOD of 5 ng/L [114]. Li et al. described a sensitive method of determination by
direct injection nebulization ICP-MS [115]. Moyano et al. used FI-ICP-AES with
ultrasonic nebulization for the determination of bismuth in urine samples after
column preconcentration [116]. Burguera et al. [108] and da Silva et al. [117] used
on-line separation and preconcentration methods for bismuth and then determined
by ETAAS.

32
1.5.1.3 Determination of Bi by Hydride Generation
Hydride generation method combined with AAS is currently one of the best
methods for the determination of Bi in different matrices. The application HGAAS
method goes back to early 70’s. In 1973, Pollock and West developed a method of
metal reduction procedure using TeCl3 / Mg for the determination of Bi and
obtained a LOD of 3.2 ng for 15 mL sample volume; first the hydride was
collected in a pressure chamber and then send to flame via auxiliary air channel
[118]. In the same year, Fernandez employed solid NaBH4 pellets for the reduction
of Bi using both collection in a balloon reservoir and achieved LODs of 5 ng for
20 mL sample volume, respectively [41]. Fleming and Ide [119] applied the
method of HG using solid NaBH4 and obtained an LOD of 1 µg Bi/g in steel. They
investigated the interferences of some elements and reported that although Ni, Mo,
Cu and Co did interfere in the absence of iron, the presence of iron eliminated the
interference. Bedard and Kerbyson [120] used pressure concentration method for
the determination of bismuth by hydride generation by eliminating the Cu
interference by lanthanum hydroxide coprecipitation and reported that the
collection time should not be very long due to the unstable nature of bismuthine at
room temperature. Vanloo et al. [121] showed that Bi can be determined in steel
and cast iron at µg/g level accurately by HGAAS using aqueous sodium
tetrahydroborate as reductant and heated QTA as atomizer. In 1982 Aöstrom [122]
developed an FIA system with a quartz atomizer where the analyte solution of
0.700 mL was injected into a continuous flowing stream of HCl solution. Under
the best conditions, a limit of detection of 0.08 ng/mL was obtained. Cadore and
Baccan suggested use of thiourea-KI for the minimization of interference from
some trace elements [111]. Moyano et al. [123] used an on line column
preconcentration and hydride generation ICP-AES method for the determination in
urine.

33
Atomic fluorescence and plasma atomic emission spectrometries have also been
employed for the detection of volatilized Bi species. Feng and Fu [48] determined
Bi and 4 more hydride forming elements in nickel metal by HGAFS after
coprecipitation with lanthanum hydroxide. They reported that five elements can be
coprecipitated quantitatively and separated from nickel matrix.
In recent years the studies have been focused on the development of in-situ
preconcentration methods for the determination of Bi. Matusiewicz et al. [124]
obtained a detection limit of 0.020 ng/mL Bi for a sample volume of 5 mL by
using HG-ETAAS with in-situ preconcentration in graphite tube. Murphy et al.
[125] developed a multielement detection method for the hydride forming
elements including Bi after in-situ collection on Ir treated graphite tubes. A limit
of detection of 40 ng Bi/L was achieved for 0.500 mL sample volume. Chang and
Jiang [94] used vapor generation graphite furnace ETV-ICP-MS for the
determination of Bi and obtained a detection limit of 0.003 ng/mL Bi for 2 mL
sample volume.
1.5.2 Cadmium
1.5.2.1 Importance of Cd
Cadmium occurs as a constituent of lead and zinc ores, from which it can be
extracted as a byproduct [126]. It is one of the rarer metals which makes up about
0.00005% of the Earth’s crust. It is distributed on the land as a consequence of
emissions from industrial and waste incineration plants, and coal fired power
plants. Concentrations of Cd as high as 500 mg/kg have been reported in soils near
mines and smelters. About one third of the cadmium production is used in

34
manufacture of batteries, paints, plastics, and in metal plating processes. It is also
used as an anticorrosive element for some metals [1, 127].
The toxic nature of Cd was revealed in 1900 and its compounds are also known to
be toxic. The essentiality has not been proved yet for the adult human body which
contains about 30 mg of Cd. It is a highly cumulative poisonous metal with an
estimated biological half life of 20-30 years in humans. About half of body burden
of Cd is found in the liver and kidney. It affects several enzymes in the body [126].
Cadmium can cause high blood pressure, kidney damage and sterility among
males. Long term exposure can cause bones to become brittle. It was reported that
in the 1950’s, about 100 people died in Japan due to Cd poisoning caused by the
consumption of rice grown on the Cd contaminated soil. Since carcinogenical
potential is expected, Cd and a number of its compounds are included the list of
elements whose concentration must be controlled at the workplace [1, 127].
1.5.2.2 Determination of Cd
Cadmium can be easily determined by air/acetylene flame with a characteristic
concentration of 0.02 mg/L [1]. Because of high toxicity of this element at low
concentrations, more sensitive techniques are required at trace and ultra-trace
determinations in environmental and biological samples.
ETAAS is one of the most powerful methods for the determination of Cd at sub
ng/mL level. The greatest difficulty in the determination by GFAAS is the high
volatility of Cd. Use of modifiers such as Pd, Ir, Mg and some ammonium salts
have been suggested to provide efficient removal of matrix prior to atomization.
Lücker et al. used solid sampling ETAAS for the determination of Cd in kidney
[128]. ETAAS with W coil atomizers have also been employed for the
determination of Cd in mussels [129], in hair and blood [130]. Hirano et al.
35
developed an FI on-line preconcentration GF-ETAAS method for Cd by collecting
on a imminodiacetate type resin and reached a detection limit of 0.2 ng/L using 12
mL sample volume [131].
1.5.2.3 Determination of Cd by Hydride Generation
The first report on the preparation of very unstable cadmium hydride appeared in
1951; cadmium hydride was synthesized in an organic medium at -78.5 ˚C at
which no evidence was observed for the decomposition [39]. In 1989, D’Ulivo and
Chen [132] demonstrated that Cd can be determined by AAS after vapor
generation in aqueous solution by using sodium tetraethylborate. In the same year,
the determination of Cd using HGAAS and heated QTA was reported for the first
time by Cacho et al. [27]. The volatile species, probably hydride, were generated
in an organic media. The rate of hydride generation can be increased by the
addition of diethyldithiocarbamate (DDTC) and increasing temperature. After 4
years, Valdés-Hevia et al. [133] proposed a method for the hydride generation with
sodium tetrahydroborate and ICP-AES detection; limit of detection attained was 1
ng/mL. Ebdon et al. [134] used atomic fluorescence spectrometry for ultra-trace
detection of volatile Cd species generated by the reaction with tetraethylborate.
In 1995, two independent groups showed that the generated volatile species by the
reaction with sodium tetrahydroborate are unstable and decomposes quickly at
room temperature [7, 28]. Decomposition yields free atomic Cd vapor which can
be determined by using an unheated atomizer similar to the one used for the
determination of Hg by CVAAS [7, 28]. The sensitivity of cold vapor system is
found to be higher than that of heated QTA since the residence time of the atomic
species in the atomizer is less in heated QTA due to thermal expansion [7].

36
Literature data reveal much inconsistency and contradictory statements for hydride
generation conditions of Cd, probably because of the inherent instability of its
hydride and difficulties with generation, stripping off solution and transportation
of volatile species to the atom cell. The generation process, efficiency of hydride
release and the transport processes are highly sensitive. Usually high
concentrations of NaBH4 are required and the concentration of HCl is very critical
[135]. The design of GLS is also critical and the sensitivity is much more effected
when compared to other hydride forming elements (HFEs). It is reported that even
no signal was obtained using conventional U type GLS. [136]. Feng et al.
investigated the effect of surface of GLS and showed that when Ryton (a sulfur
containing polymer) GLS was used, the atomic Cd species are adsorbed by S
containing groups and no signal was obtained when the atomizer was at room
temperature [137].
Guo and Guo [138] investigated the effect of some organic reagents, mainly
nitrogen and sulfur containing ones on the hydride generation efficiency and found
that the addition of 1% (w/v) thiourea and 1 µg/mL Co results in a significant
enhancement in the fluorescence signal in the HGAFS determination of Cd. The
enhancement in the signal was explained by the catalytic effect of these species in
the hydride generation reaction. Hwang and Jiang [139] used VG-ICP-MS for the
determination of Cd and found increased sensitivity when thiourea and cobalt were
added as catalysts and supported findings of Guo and Guo. It was suggested that
use of didodecyldimethylammonium bromide (DDAB) vesicles improve hydride
generation efficiency for Cd and a 5 fold decrease was obtained in the LOD by
ICP-AES [133]. In another study, 10 µg/mL Ni when added together with 1 %
thiourea increased signal and reduced some metal interferences [136].
In recent years, the studies are focused on the in-situ trapping of volatile Cd
species in graphite tubes and successful applications were carried out. Infante et al.
showed that the Pd is an efficient coating material and increases the trapping

37
efficiency for the volatile species generated in vesicular media created by DDAB
[140]. The same group compared the trapping efficiency of uncoated and Zr-, W-
and Pd-coated graphite tubes and found that the Pd coating is superior to others
offering enhanced LOD and precision [141].
Bermajo-Barrera et al. investigated the effects of different metals on the generation
of volatile species and found that Ga, Si and Co increase the analytical signal.
They also mentioned that by using Ir coated tubes and Ga as the catalyst, a
characteristic mass of 3 pg and a limit of detection of 4 ng/L can be obtained [142].
In a more recent study by Lampugnani et al. [135], it is reported that none of the
above mentioned catalytic species did enhance the analytical signal. Furthermore,
it is noted that the addition of DDAB brought entailed problems with system
washing between runs. It was also demonstrated that permanent coating with Zr-Ir
and W-Ir was effective and straightforward for in-situ trapping in graphite tubes.
1.5.3 Lead
1.5.3.1 Importance of Pb
Lead is one of the rarer elements whose abundance in the Earth’s crust is only
0.0018% [1]. Because of its low melting point and malleable properties, Pb is one
of the metals used widely in early ages. Its use goes back to ancient Egyptians.
Lead ranks fifth behind iron, copper, aluminum and zinc in industrial production
of metals. About half of the lead is used for the manufacture of lead storage
batteries. A quarter is used for chemicals such as tetraethyl lead and other
organolead compounds. Other uses include solders, bearings, cable covers,

38
ammunition, plumbing, pigments and caulking [1, 126]. Lead compounds are also
widely used as anti-knocking additives in gasoline. Lead chromate is a strong
yellow pigment extensively used in yellow paints for road markers and as
ingredient in many green paint and colored plastics [1].
Lead is a common atmospheric pollutant though much less so now since the use of
leaded gasoline is being reduced. Antropogenic emissions such as those from
combustion of fossil fuels, waste incinerators and industrial emissions cause
higher levels of metal pollutants including lead in the urban environment [143].
The absorption through the respiratory track is the most common route of human
exposure. The greatest danger of pulmonary exposure comes from inhalation of
very small particles of lead oxide and lead carbonates, halides, phosphates and
sulfates. Lead can also enter into body by ingestion and resorption through the
skin. Children are more sensitive to toxic effects of lead because they absorb more
from soil and dust than adults absorb. Acute lead poisoning results in dysfunction
in the kidneys, reproductive systems, liver, brain and central nervous system,
resulting sickness or death [144, 145]. Of all the compounds, the trialkylated forms
have the strongest neurotoxic effect for mammals. The recommended clinical test
for assessment of exposure is the determination of lead in blood [1].
1.5.3.2 Determination of Pb
AAS is the most frequently used method for the determination of lead. It can be
determined in the air acetylene flame largely free of interferences. Since it is
highly toxic and often be determined in very low concentrations, limit of detection
of 0.01 mg/L that can be achievable by FAAS is often inadequate. More sensitive
methods are required [1].

39
Graphite furnace ETAAS is one of the most powerful and widely used techniques
for direct determination of lead in blood [146]. Interferences that are partly
dependent on the high volatility of Pb and on the influence of concomitants are
eliminated with proper use of stabilized temperature platform furnace (STPF) [1].
The Pd-Mg modifier was found to be the best one which allows a pyrolysis
temperature of 1200-1400 ˚C. However addition of modifier also increases the
atomization temperature [1]. Correira et al. [147] obtained a detection limit of 9.3
pg using NH4H2PO4 + Mg(NO3)2 mixed modifier allowing an ash temperature of
750 ˚C in the determination of lead in foodstuffs.
Tungsten coil ETAAS was also employed for the determination of Pb. Parsons et
al. determined Pb in blood by using a W filament atomizer [148]. Rhodium was
investigated as a permanent modifier for the atomization of Pb from biological
fluids by W filament ETAAS. It has been found that Rh not only stabilizes Pb but
also extends the life time of W coil from 60-70 to over 300 firings [149]. Wagner
et al. [52] developed a method for the multielement determination employing an
ETAAS with W coil atomizer. Four elements could be determined simultaneously
by a CCD spectrometer using near line background correction. In another study
the tungsten boat was used as boat digestion vessel and electrothermal vaporizer,
and then the detection was carried out by ICP-MS; achieved a detection limit of
5.2 pg of Pb corresponding to 10.2 ng/g in solid sample [100].
Czobik and Matoušek [67] used a preconcentration method of electrodeposition of
lead from aqueous solution on W wire. Then they inserted the W-coil into graphite
furnace and obtained the analytical signal. The characteristic concentration of lead
was 0.15 µg/L for 5 min electrodeposition. Barbosa et al. used electrochemical on-
line preconcentration method. However in their system the W coil served as both
trapping medium and atomizer [69].

40
1.5.3.3 Determination of Pb by Hydride Generation
Lead can be determined by HGAAS but has some difficulties with the hydride
formation. Lead hydride PbH4 is unstable at room temperature and has a boiling
point of approximately -13˚C [5]. Thompson and Thomerson published the first
report on lead hydride generation for analytical purposes by the reaction of
acidified sample solution with sodium tetrahydroborate, but the efficiency was
poor [150].
The generation efficiency of plumbane by direct reaction of acidified solution with
tetrahydroborate is very low presumably because of the very low redox potential
of the Pb2+ / PbH4 pair. Use of oxidizing agents such as dichromate or hydrogen
peroxide increased the generation efficiency presumably by the formation of meta-
stable Pb(IV) whose reduction is thought to be easier than that of +2 valance state
[5]. A linear relationship was observed between the logarithm of absorbance and
the redox potential of oxidants [5]. A variety of oxidizing agents were tried in
order to increase efficiency. In 1976, Fleming and Ide [119] reported that use of
K2Cr2O7-tartaric acid reaction medium increases the generation efficiency
significantly. They also noted that more K2Cr2O7 is required in the presence of
iron and it must be added to the analyte solution just before the measurement. Use
of H2O2 in nitric or perchloric acid was suggested by Vijan and Wood [151]. Jin
and Taga [47] compared hydride generation efficiencies and the selectivity of
three different media, and found that peroxodisulfate-nitric acid was the most
efficient medium for PbH4 generation among K2Cr2O7-malic acid, HNO3-H2O2
and (NH4)2S2O8-HNO3 but it gave high blank values and poor selectivity; more
effected by concomitant elements. In 1985, Thao and Zhou proposed a method of
plumbane generation using K3Fe(CN)6-HCl medium and achieved a detection limit
of 0.37 µg/L in food samples [152]. Li et al. [153] obtained the most sensitive
hydride generation in 0.3% w/v oxalic acid and 3% w/v (NH4)2Ce(NO3)6 among

41
other media however the concentration of tetrahydroborate as potassium salt
needed was very high, 8% (w/v).
Use of nitroso-R salt (1-nitroso-2-napthol-3,6-disulfonic acid, disodium salt) was
suggested by Zhang et al. [154]. They found improved sensitivity compared to
those obtained using peroxodisulphate, dichromate or hydrogen peroxide as
oxidants. It was proposed that the mechanism of reaction involved the oxidation of
lead(II) to lead (IV) while chelated with nitroso-R salt. Chen et al. investigated a
series of 22 organic chelating reagents including nitroso-R salt. 1-(2-pyridylazo)-
2-naphthol-6-sulfonic acid (PAN-S) was also found to be as effective as nitroso-R
salt although it is not an oxidizing agent [155]. The increase in the efficiency was
explained by the formation of a chelate between Pb(II) and PAN-S rather than the
formation of metastable Pb(IV) formation. The use of persulfate as oxidizing agent
in FI HG of Pb was reported by Samanta and Chakraborti [156].
Although potassium hexacyanoferrate(III) is a mild oxidizing agent (E˚ =0.36 V)
when compared to other reagents H2O2 (E˚ = 1.78 V), potassium dichromate (E˚ =
1.33 V) and (NH4)2S2O8 (E˚ = 2.01 V) it is found to be more effective in the
hydride generation of lead [157-159]. Therefore, the efficacy of hexacyanoferrate
suggests that a mechanism other than oxidation is occurring to generate plumbane
generation similar to the case of PAN-S.
The HG technique has also been coupled with plasma spectrometry for the
determination of lead. In 1981, Ikeda et al. [160] used HCl- H2O2 medium for the
generation of plumbane and than detected by ICP-OES. High blank signal
equivalent to that of 2 ng/mL Pb was observed. Li et al. [161] determined Pb by
HG-ICP-MS using oxalic acid-ammonium cerium nitrate-sodium tetrahydroborate
system having a detection limit of 7 ng/L. They mentioned that some interferences
were minimized with the help of masking effect of oxalic acid. Chen et al. [162]

42
who also reported the masking effect of oxalic acid against the interferences
employed potassium hexacyanoferrate (III) medium and ICP-MS detection system.
In-situ trapping techniques were successfully applied for the determination of lead
after hydride generation. Bermejo-Barrera et al. [163] investigated the effect of Ir,
Zr, and W as coating materials for graphite tube and found that Ir is better when
compared to others and effective trapping was achieved at room temperature, 20 ˚C.
They used HCl/H2O2 medium for HG and obtained a detection limit of 60 ng/L
with 0.500 mL sample volume. Tyson et al. [159] used hexacyanoferrate and
obtained a detection limit of 0.03 µg/L with purified hexacyanoferrate after in-situ
trapping on Ir coated L’vov platform at 300 ˚C.
According to research results obtained in our laboratory, silica is also capable of
trapping hydrides when heated to moderate temperatures. It has been shown that
the silica surface can be used as a trapping medium for the determination of Pb and
thus significant enhancement in the sensitivity and detection limit was achieved
[164].
Besides hydride generation, ethylation was also used for the generation of volatile
Pb species. Rapsomanikis et al. [11] described the speciation of dimethyl and
alkyllead species using chromatographic separation and then detection by AAS
after ethylation with sodium tetraethylborate. Sturgeon et al. [12] used sodium
tetraethylborate for the generation of tetraethyl lead and then determined using
ETAAS after preconcentration in graphite tube heated to 400 ˚C. They reached a
detection limit of 1 ng/L.

43
1.6 The Aim of the Study
The determination of metals at trace and ultra-trace levels is important in
environmental, biological and metallurgical samples because of their toxic effects
or critical concentration ranges. The sensitivity that is attainable by FAAS,
conventional HGAAS and even ETAAS sometimes may not be enough for such
analyses. Although ICP-MS systems offer high sensitivity and very low detection
limits, they suffer from interferences due to high solid contents. Furthermore these
instruments are not accessible in all laboratories due to high costs and also high
expense of its consumables. Therefore alternative methods which are accessible,
easy to use, providing high sensitivity and low limits of detection with a minimal
cost of both instrumentation and consumables are needed.
Hydride generation combined with atomic absorption or emission spectrometry is
a powerful method for the determination methods for hydride forming elements.
The sequestration of hydride forming elements on heated graphite surfaces is a
widely used technique for common hydride forming elements. In recent years,
metal atomizers, mostly coiled W, has gained its importance against the graphite
atomizer.
The purpose of this study is to develop on-line preconcentration methods for the
determination of hydride forming elements. The method involves the separation of
analytes, Bi, Pb and Cd from sample matrix as their volatile species by chemical
vapor generation. Volatile species are preconcentrated on heated W-coil followed
by revolatilization and transportation to quartz T-tube. The developed method is
simple to apply. Due to its low cost, it can be applied in any instrumental analysis
laboratory having a simple FAAS instrument.

44
CHAPTER II
EXPERIMENTAL
2.1 Instrumentation
A Philips Pye Unicam (Cambridge, UK) PU9200 atomic absorption spectrometer
equipped with deuterium background correction system was used for absorbance
measurements. The instrumental parameters for the elements investigated are given
in Table 2.1. The hood of spectrometer was connected to an Elicent AXC 315/A
(maximum suction rate is 1300 m3/h) channel fan equipped with an Elicent
(Lonato, Italy) speed regulator. Quartz T-tube either heated by stoichiometric
air/acetylene flame for Bi and Pb or kept at room temperature for Cd was used as
atomizer or atom cell, respectively, in the measurements.
For the decomposition of standard reference materials, a Milestone Ethos Plus
microwave oven was used. The digestion programs were based on temperature
control according to the recommendations of manufacturer with some adaptations.
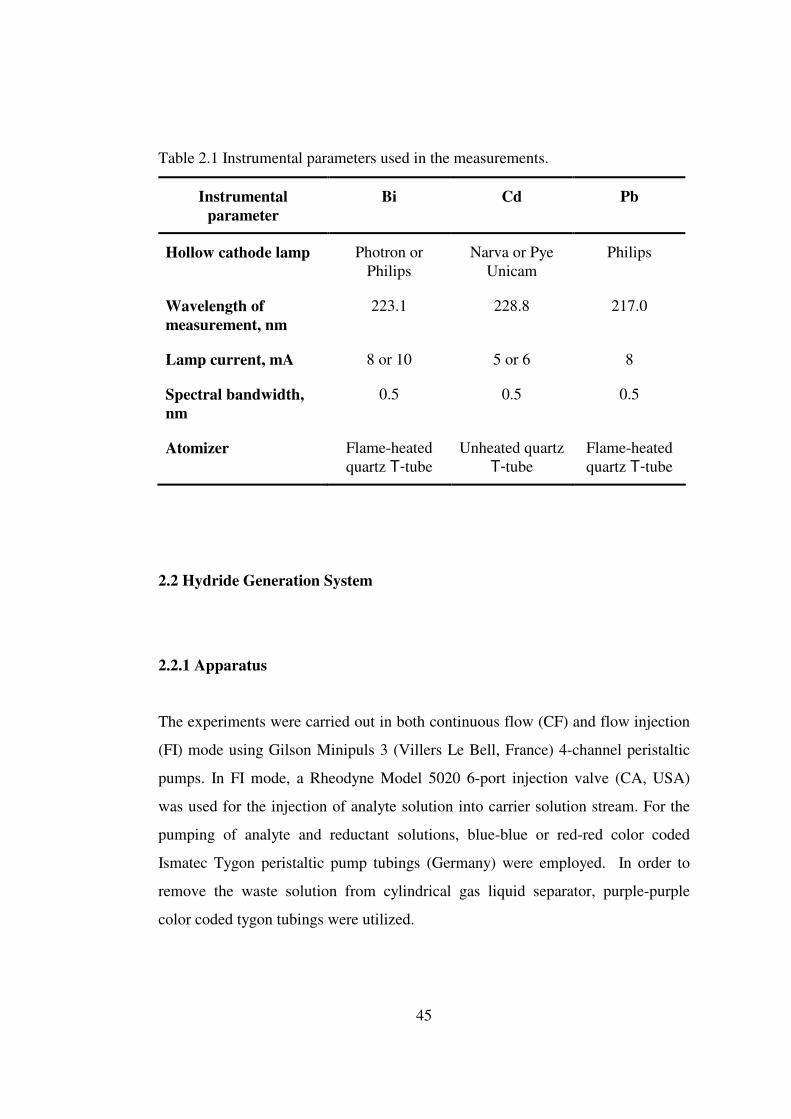
45
Table 2.1 Instrumental parameters used in the measurements.
Instrumental parameter
Bi Cd Pb
Hollow cathode lamp Photron or Philips
Narva or Pye Unicam
Philips
Wavelength of measurement, nm
223.1 228.8 217.0
Lamp current, mA 8 or 10 5 or 6 8
Spectral bandwidth, nm
0.5 0.5 0.5
Atomizer Flame-heated quartz T-tube
Unheated quartz T-tube
Flame-heated quartz T-tube
2.2 Hydride Generation System
2.2.1 Apparatus
The experiments were carried out in both continuous flow (CF) and flow injection
(FI) mode using Gilson Minipuls 3 (Villers Le Bell, France) 4-channel peristaltic
pumps. In FI mode, a Rheodyne Model 5020 6-port injection valve (CA, USA)
was used for the injection of analyte solution into carrier solution stream. For the
pumping of analyte and reductant solutions, blue-blue or red-red color coded
Ismatec Tygon peristaltic pump tubings (Germany) were employed. In order to
remove the waste solution from cylindrical gas liquid separator, purple-purple
color coded tygon tubings were utilized.

46
Tubings that were made of polytetrafluoroethylene (PTFE) (0.8 mm i.d. and 1.4
mm o.d.) and supplied from Cole Parmer (USA) were used for the transportation
of solutions. The reaction and stripping coils were also made from the same PTFE
tubing in different lengths. The 3-way or 4-way connectors used for merging of the
analyte, reductant and carrier gas streams were all made of PTFE and supplied
from Cole Parmer.
The carrier gas which was used for stripping of solutions and transportation of
volatile species to trap and to atomizer was Ar (99.95%) that was supplied from
Oksan (Ankara). During the trap studies, where W-coil was used as trap, H2
(Oksan) was added to the carrier gas. The flow rates of Ar and H2 in the carrier gas
were measured and controlled by two separate rotameters obtained from Cole
Parmer.
For the separation of gaseous analyte species from the liquid phase, a gas liquid
separator (GLS) was used. Two different GLS designs, whose schematic diagrams
and dimensions were given in Figure 2.1, were employed in the measurements; a
home-made U-type GLS for Bi and Pb and a cylindrical GLS with a smaller inner
volume similar to that proposed by Matoušek et al. [165] for Cd. The inner
volumes of them were approximately 20 mL and 3 mL, respectively. In U-type
GLS, the liquid part of the reaction products was forced to waste by gravity. In
cylindrical type GLS, waste solution was removed by a second peristaltic pump
and the solution level inside was kept at minimum.

47
Figure 2.1 Gas liquid separators used in the experiments: (a) Cylindrical GLS used
for Cd; (b) U-type GLS used for Bi and Pb.
The generated volatile species of Bi and Pb were transported from gas liquid
separator to the atomizer by using Tygon tubing (3.1 mm i.d., Cole Parmer
Instrument Co., USA). For volatile Cd species, the transport tubing was made of
PTFE (0.8 mm i.d., 1.4 mm o.d.) between GLS and the atom cell. The transport
tubings were kept as short as possible in order to prevent losses of volatile species
during transportation. In the experiments, where cylindrical GLS was used, the tip
of PTFE capillary was inserted into inlet arm and the tubing was kept as close as
possible to the junction point of horizontal arm of quartz T-tube. In trap
experiments, it was directed onto the W-trap through a distance of 0.5 cm.
In the trap experiments where the trap was separated from quartz T-tube, the
released species were transported through tygon tubing (3.1 mm i.d.). For Cd,
PTFE (4 mm i.d.) and fluorinated ethylene propylene (FEP) coated tygon tubings
(6 mm i.d.) were also utilized.

48
The experimental set up for hydride generation of Bi and Pb was slightly different
than that of Cd. Their respective schematic diagrams are given in Figure 2.2 and
2.3. In CF mode, the analyte and the reductant solutions were pumped
continuously by the peristaltic pump. In FI mode, instead of analyte solution, only
a carrier solution was pumped but the analyte solution was injected into carrier
stream. A reaction coil was needed for all the elements. The lengths of reaction
coils employed for the generation of bismuthine and plumbane were 15 and 30 cm,
respectively. For Bi and Pb, no stripping coil was used other than a 2 cm length of
glass connection where the carrier was introduced into flowing stream at the
entrance of U-type GLS. For Cd the length of reaction coil was 60 cm and this
figure strongly depended on the length of stripping coil. The length of stripping
coil was 15 cm for Cd; however, the same sensitivity was obtained when the length
was 120 cm without a reaction coil. In some experiments instead of employing a
reaction coil, this configuration was also used.
Figure 2.2 The experimental set up used for generation of Bi and Pb hydrides.

49
Figure 2.3 The experimental set up used for generation of volatile Cd species.
2.2.2 Atomizer and Atom Cell
A quartz T-tube atomizer commonly used as atomizer in hydride generation
methods was either heated externally on a stoichiometric air acetylene flame for Bi
and Pb or kept at room temperature for Cd served as the atomizer and atom cell,
respectively; its dimensions are indicated in Figure 2.4. The ends of quartz T-tube
used at room temperature for Cd were not covered with any windows.

50
Figure 2.4 Quartz T-tube atomizer used in the experiments.
2.3 Trap System
In the preliminary studies, the trap was made up from commercially available
nickel-chromium and tungsten wires. About 15 cm of wire was coiled into a
conical shape such that it would supply maximum cross-sectional and thus
trapping surface area, and could be heated without breakage. Then, W-coil
filament extracted form a 15 V, 150 W projector bulb (Halogen Photo Optic Lamp
Xenophot, Osram, Germany) was used as trap. The dimensions of both home-made
and commercially handled W-coil traps are given in Figure 2.5. This type of
commercially available W-coil has been commonly employed in ETAAS with
metal atomizers. It is easily handled and inexpensive. In addition, it supplies larger
surface area for the trapping when compared to that was designed in the laboratory.
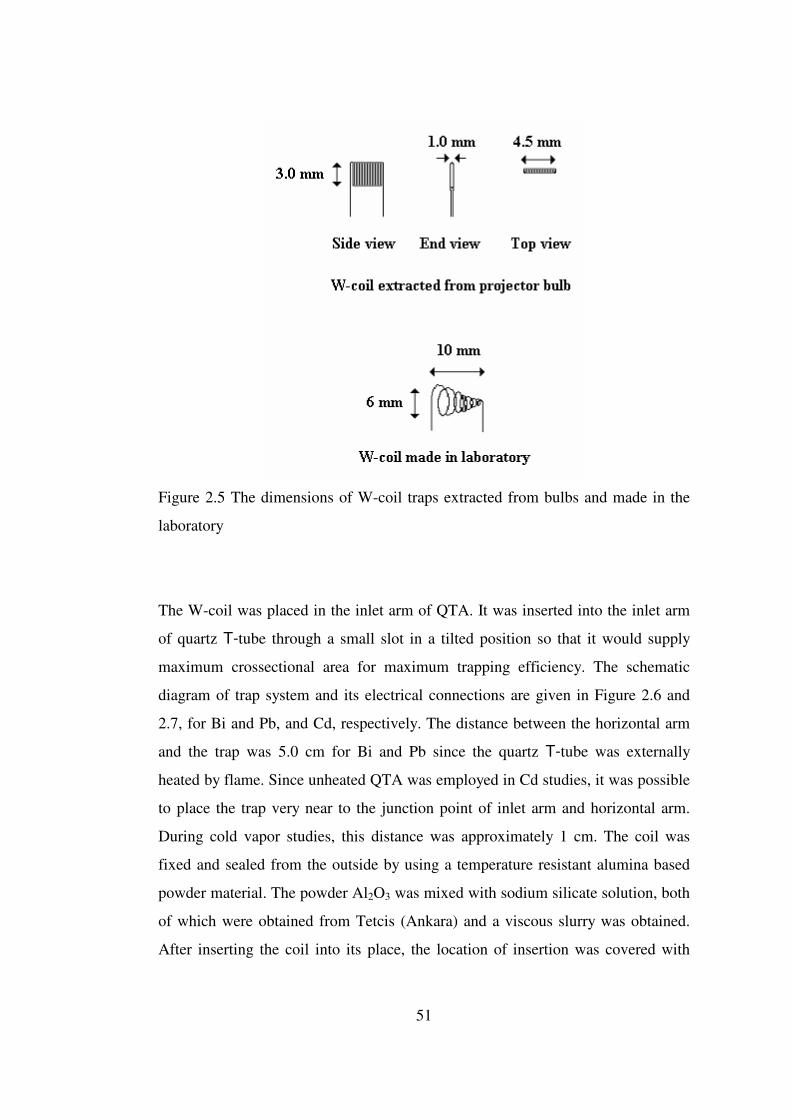
51
Figure 2.5 The dimensions of W-coil traps extracted from bulbs and made in the
laboratory
The W-coil was placed in the inlet arm of QTA. It was inserted into the inlet arm
of quartz T-tube through a small slot in a tilted position so that it would supply
maximum crossectional area for maximum trapping efficiency. The schematic
diagram of trap system and its electrical connections are given in Figure 2.6 and
2.7, for Bi and Pb, and Cd, respectively. The distance between the horizontal arm
and the trap was 5.0 cm for Bi and Pb since the quartz T-tube was externally
heated by flame. Since unheated QTA was employed in Cd studies, it was possible
to place the trap very near to the junction point of inlet arm and horizontal arm.
During cold vapor studies, this distance was approximately 1 cm. The coil was
fixed and sealed from the outside by using a temperature resistant alumina based
powder material. The powder Al2O3 was mixed with sodium silicate solution, both
of which were obtained from Tetcis (Ankara) and a viscous slurry was obtained.
After inserting the coil into its place, the location of insertion was covered with

52
this slurry and dried at room temperature for at least 2 days. The isolation of W-
coil was important in order to prevent oxygen entering to the system which caused
deterioration of the W-coil by oxidation and also affected the trapping-
revolatilization performance.
Figure 2.6 The W-coil placed in the inlet arm of quartz T-tube used for Bi and Pb.
Figure 2.7 The W-coil placed in the inlet arm of quartz T-tube used for Cd.

53
The resistive heating of W-coil was achieved by applying an alternating voltage by
using a transformer and a power supply which was connected to wall electricity
(220 V a.c.) through a power switch as shown in Figures 2.6 and 2.7. The
electrodes of coil were connected to 0-8 V output of transformer (available input
voltages were 110 and 220; and output voltages were 5, 8, 12 and 18 V) which was
connected to the wall electricity through a variable voltage power supply (input
voltage 220; output voltage, adjustable between 0-220). The voltage was varied by
the variable potential power supply. Therefore with this system, a potential
between 0 and 8 V could be applied to the coil. If higher temperatures was to be
used, the connections of the coil was altered to the 0-12 V output voltage of the
transformer. The applied voltage and its accuracy was checked by using a ampere-
volt-ohm meter which was connected to power cables at the junction point of W-
coil as shown in the figures.
For the measurement of W-coil temperature, a Ni-Cr thermocouple which was
capable of measuring temperatures up to 1200 ˚C was used. The central part of
coil was heated more than the ends. The temperature measurements were carried
out by contacting the tip of the thermocouple to the center of the coil, at different
gas composition and flow rates. The approximate release temperatures that can
not be measured by the thermocouple were estimated by the extrapolation of the
graph between applied voltage and measured temperature, as long as it was not
very high; since the relationship between applied voltage and the temperature
was nearly linear between the applied voltages of 4 V and 6 V [166].
In order to investigate the distance that the released species could be transported,
the trap was removed from the quartz T-tube and placed in a piece of quartz tube
that has the same inner diameter with the inlet arm of T-tube. The distance
between trap and the inlet arm of atomizer or atom cell was varied using Tygon
tubing. In these experiments both the peak height and the peak area values were

54
recorded. This would also give an idea about the released species whether they are
atomic or molecular.
In order to investigate the trapping efficiency, a tandem arrangement of two W-coil
traps was used; one of them was in QTA and the other was a separate one. This
arrangement, shown in Figure 2.8 was also used for the investigation of nature of
released species from the trap. The temperature of each W-coil was controlled
independently. By this arrangement untrapped species passing through the first coil
could be trapped on the second one, while both the first and second traps were in
collection mode. In addition, while the first trap was used in releasing mode and
the second one was in collection mode, the revolatilized species from the first coil
could be trapped on the second coil.
Figure 2.8 Tandem arrangement of W-coil trap system.

55
2.4 Reagents
All the reagents used were at least analytical reagent grade. Dilutions were made
using 18 MΩ·cm deionized water obtained from a Millipore (Molsheim, France)
Milli-Q water purification system which was fed by Millipore Elix 5
electrodeionization system.
The working solutions of Bi, Cd and Pb were prepared by making necessary
dilutions from their standard stock solutions; 10000 mg/L Bi (Titrisol, Merck),
1010 mg/L Pb (Aldrich), 100 mg/L Cd, (Leeman Labs Inc. Plasma-Pure, USA) and
1000 mg/L Cd (Ultra Scientific).
For the acidification of analyte solutions, analytical grade 37% (w/w) HCl (Merck)
was used. Reductant solutions were prepared daily from powder sodium
tetrahydroborate(III) (Merck, min. 96% purity). For the stabilization of NaBH4
solution, NaOH (Carlo Erba, Milano, Italy) was used. Analytical grade 65% (w/w)
HNO3 (Carlo Erba, Italy), 37% (w/w) HCl and 38-40% (w/w) HF (Merck) were
used for the decomposition and digestion of geological reference materials.
Solutions of 0.5% (w/w) potassium hexacyanoferrate (III), K3Fe(CN)6 was
prepared from analytical grade salt with a minimum purity of 99% (w/w) (Merck).
Due to its low stability in the aqueous phase, the solutions were prepared daily.
Nitroso-R salt (Aldrich) and 35% (w/w) H2O2 (Merck) was also used as the
reaction medium for the generation of lead hydride.
The coating of W-coil was achieved by injecting aliquots of Pd, Ir, and Pt from
their corresponding 1000 mg/L solutions (BDH, UK). Injections were made by
using an adjustable volume micropipette (Transferpette).

56
2.5 Procedure
The hydride generation conditions were carried out in conventional FI mode by
injecting a definite amount of analyte solution into the carrier solution stream.
However, the optimized values were also verified in the trap mode where mostly a
CF sampling was employed. In CF mode the solutions of sample and reductant
were pumped at a constant flow rate by the peristaltic pump. The generated volatile
species of analyte were transported to W-coil which was previously heated to
collection temperature. After the hydride evolution and preconcentration was
complete, all the collected analyte species were revolatilized at once by increasing
the trap temperature rapidly to revolatilization temperature. The collection volume
and thus time was determined by the element and its concentration in the sample
solution. The optimum hydride generation, trapping and releasing conditions were
summarized in Table 2.2.
The details of procedure for each element are given in the following sections. Since
the trap signals are transient and very sharp, the integrated absorbance values were
highly affected by the lamp noise and the very slight drifts in the base line caused
large errors in peak area values. In most cases the peak height values are the basis
of the measurements. In some experiments where the lamp noise was low, peak
area values have also been used by keeping the integration time as short as 2-3 s.
Therefore, in most cases the optimizations were based on the measurement of peak
height and the integrated absorbance values were rarely taken into account. The
residence time of the atoms were highly affected by the release gas flow rate which
was optimized with respect to peak height. The signal obtained by each release was
the basis for optimization of collection and release temperatures. During the
collection temperature optimizations, the continuous signal created by untrapped
species during collection was also followed. All the experimental parameters were
optimized by changing one variable at a time. While optimizing one parameter, the
others were kept at their optimum value. Multi-cycling method was employed.

57
Table 2.2 Hydride generation, trapping and revolatilization conditions for Bi, Cd
and Pb in CF mode for W-trap HGAAS.
Parameter Bi Cd Pb
Concentration of HCl in sample solution, mol/L
1.0 0.2 0.06
Concentration of NaBH4 in reductant solution, % (w/v)
0.5 1.5 1.0
Concentration of NaOH in reductant solution, %(w/v)
0.2 0.15 0.2
Flow rate of sample and reductant, mL/min
6.0 2.1 6.0
Length of reaction coil, cm 15 60 30
Length of stripping coil, cm 2 15 2
Gas liquid separator U-type Cylindrical type
U-type
Collection Ar flow rate, mL/min 75 270 210
Collection H2 flow rate, mL/min 70 150 100
Release Ar flow rate, mL/min 500 270 210
Release H2 flow rate, mL/min 70 150 100
Collection trap temperature, ˚C 270 150 350
Release trap temperature, ˚C 1200 1000 1300

58
2.5.1 Bismuth
In FI mode 1.0 mol/L HCl was used as carrier. The optimum HCl and NaBH4
concentrations were determined in conventional FI mode by using 0.500 mL
sample loop and 10.0 ng/mL Bi in 1.0 mol/L HCl solution without the W-coil trap.
During this studies the carrier gas was only Ar and no H2 was added. The reductant
and the carrier (analyte in CF) solutions were pumped at a flow rate of 6.0 mL/min.
The trapping and release temperatures were optimized using FI mode by injecting
0.500 mL of 10.0 ng/mL Bi in 1.0 mol/L HCl. The bismuthine generated was
transferred to quartz T-tube through a tygon tubing using a carrier gas mixture
composed of H2 and Ar at flow rates of 70 and 75 mL/min, respectively. The
transferred bismuthine was trapped on W-coil placed in the inlet arm of the quartz
T-tube; the W-coil was previously heated to 270 ˚C. After on-line preconcentration
on the W-coil, the Ar flow rate in the carrier gas was increased to 500 mL/min, the
H2 flow rate was kept at 70 mL/min, and then the analyte was released by
increasing the trap temperature rapidly to 1200 ˚C. The residence-time of analyte
species on the light-path was very short and the transient signal was obtained in
less than 0.5 s.
The effect of distance between trap and atomizer was investigated by varying the
length of the transfer tubing between 10 cm and 200 cm. Tygon tubing (3.1 mm
i.d.) was used for the transportation of released species from the surface.
2.5.2 Cadmium
In all the experiments including conventional HG and preconcentration on W-coil,
the flame was turned off and the measurements were conducted using the quartz T-
tube at room temperature. The ends of atom cell were not covered with windows.

59
Use of an atom cell with quartz windows commonly used for CV Hg studies was
also investigated. In addition to atom cell that was different for Bi and Pb, a
cylindrical GLS was used for Cd and the waste was removed by a second
peristaltic pump. Furthermore the volatile species of Cd were transported to the
atomizer or to trap through a PTFE tubing (0.8 mm i.d.) that was inserted into the
inlet arm of QTA and thus minimization of possible losses on the inner walls of
quartz inlet arm was assured. The distance between the tip of PTFE transport
tubing and the W-coil was 0.5 cm in order to prevent damaging of the tip at the
release stage.
The careful optimization of experimental parameters was required in order to
obtain reproducible analytical signals. Conventional FI-HGAAS method was used
for these optimizations. However, the sample acidity was also investigated for CF
mode using W-trap HGAAS. The optimization of sodium tetrahydroborate was
carried out in FI mode using both conventional and W-trap system. The
concentration of NaOH in NaBH4 solution was also investigated by conventional
FI-HGAAS.
The reaction and stripping coils lengths were optimized in FI mode by injecting a
definite volume of Cd solution without the W-coil trap. The lengths of reaction and
stripping coils were found to be dependent on each other. In some experiments the
reaction coil was removed and a relatively longer stripping coil, 120 cm, was used
since the same sensitivity was obtained in this case.
Optimum trap and release temperatures were determined in CF mode by
introducing the solutions for a period of time. The optimizations were based on the
signal obtained after each release. The trapping was carried out at 150 ˚C. After
vapor generation was complete, the trap temperature was increased to 1000 ˚C and
the transient signal was obtained in less than 1 s. The peak height of the analytical
signal was taken into account for these optimizations. The optimum gas flow rates

60
for collection and release steps were found to be the same with each other. Thus,
similar to Pb experiments, gas flow rates were kept constant and not varied
between collection and revolatilization stages.
The effect of distances between GLS and W-trap, tip of transfer tubing and W-coil,
and also trap and atom cell was investigated by varying the length of tubings. The
stability of the trapped species was investigated by varying the time interval
between collection and release stages. The effect of cooling time after each release
step was also investigated.
The effect of reaction temperature on the analytical signal was investigated by
immersing the reaction coil in a water bath placed on a hot plate whose
temperature was varied between 0 ˚C and 98 ˚C. Cooling was achieved by putting
ice pieces into water bath. The temperature of water bath was measured using a
thermocouple and a thermometer inserted into water. These experiments were
carried out in both conventional FI-HGAAS and W-trap-HGAAS. Since the
evaporation of water was high as the temperature of reaction coil increased, inner
surfaces of GLS, transfer tubings and quartz T-tube was dried by passing Ar at a
flow rate of 1 L/min between the injections until the water drops on the surfaces
were removed completely.
The effects of coating with Ir and Pt on the collection efficiency were investigated
by coating the W-coil separately with 100 µg of each element by subsequent
injections of 25 µL from their 1000 mg/L stock solution. The injection was
repeated 4 times by applying a drying step under H2 environment between each
injection. At the end, the coil temperature was increased to 1300 ˚C to reduce the
coatings into metallic form. The optimization of collection and release
temperatures were investigated for coated traps.

61
The tandem arrangement of consecutively coupled W-coil traps was used for the
investigation of trapping efficiency and the nature of the released species from the
trap surface. The volatile species that were not trapped on the first coil were tried
to be trapped on the second one by injecting the analyte into the system by keeping
both of the coils at collection temperature. The nature of released species from the
first trap was investigated by trying to collect them on the second trap; during the
releasing stage for the first trap, the second trap was kept at collection temperature.
2.5.3 Lead
The working Pb solutions were prepared in potassium hexacyanoferrate(III)
K3Fe(CN)6. The optimum concentrations of HCl, NaBH4 and K3Fe(CN)6 were
determined in conventional FI mode utilizing a 0.500 mL sample loop and 10
ng/mL Pb solution. In these experiments the carrier gas was Ar and the carrier
solution was 0.5% (w/w) K3Fe(CN)6 prepared in 0.06 mol/L HCl. The effects of
nitroso-R salt and H2O2 on the generation of plumbane were also investigated
under the same conditions by preparing the analyte solution in these reagents.
Optimum collection and release temperatures for lead were determined in CF
mode using 10.0 ng/mL Pb solution in 0.06 mol/L HCl and 0.5% (w/w)
K3Fe(CN)6. The sample and the carrier solutions were pumped at a constant flow
rate for 20 s and the generated plumbane was collected on the trap. The
optimizations were based on the signal obtained for each release. The trapping
temperature was 350 ˚C. After vapor generation was completed, the trap
temperature was rapidly increased to 1300 ˚C and a transient signal was obtained.
The optimum gas flow of collection step was the same as that of release step. Thus,
there was no need to change the carrier gas flow rate between collection and
revolatilization stages.

62
The effects of coating with Ir, Pd and Pt on the collection efficiency were
investigated by coating the W-coil with 100 µg of each element separately by
subsequent injections of 25 µL from their 1000 mg/L stock solution. The injection
was repeated 4 times applying a drying step, under H2 environment between each
injection. At the end, the coil temperature was increased to 1300 ˚C to reduce the
coatings into metallic form (under H2 environment).
The effect of distance between the trap and the atomizer was investigated by
varying the length of the transfer tubing between 10 cm and 45 cm.
The consecutively coupled W-coil traps were used for the investigation of trapping
efficiency and the nature of the released species from the trap surface. The volatile
species that were not trapped on the first coil was tried to be trapped on the second
one by injecting the analyte into the system by keeping both of the coils at
collection temperature. The nature of released species from the first trap was
investigated by trying to keep them on the second trap; during the releasing stage
for the first trap, the second trap was kept at collection temperature.
2.6 Digestion of Standard Reference Materials
The accuracy of the methods developed for Bi, Cd and Pb was checked by the
analysis of various environmental certified standard reference materials (SRM) that
have different matrices. The SRMs and the concentration of elements in them were
summarized in Table 2.3. Microwave digestion program employed for the
decomposition and digestion of solid standard reference materials was given in
Table 2.4. The program was based on the temperature control.
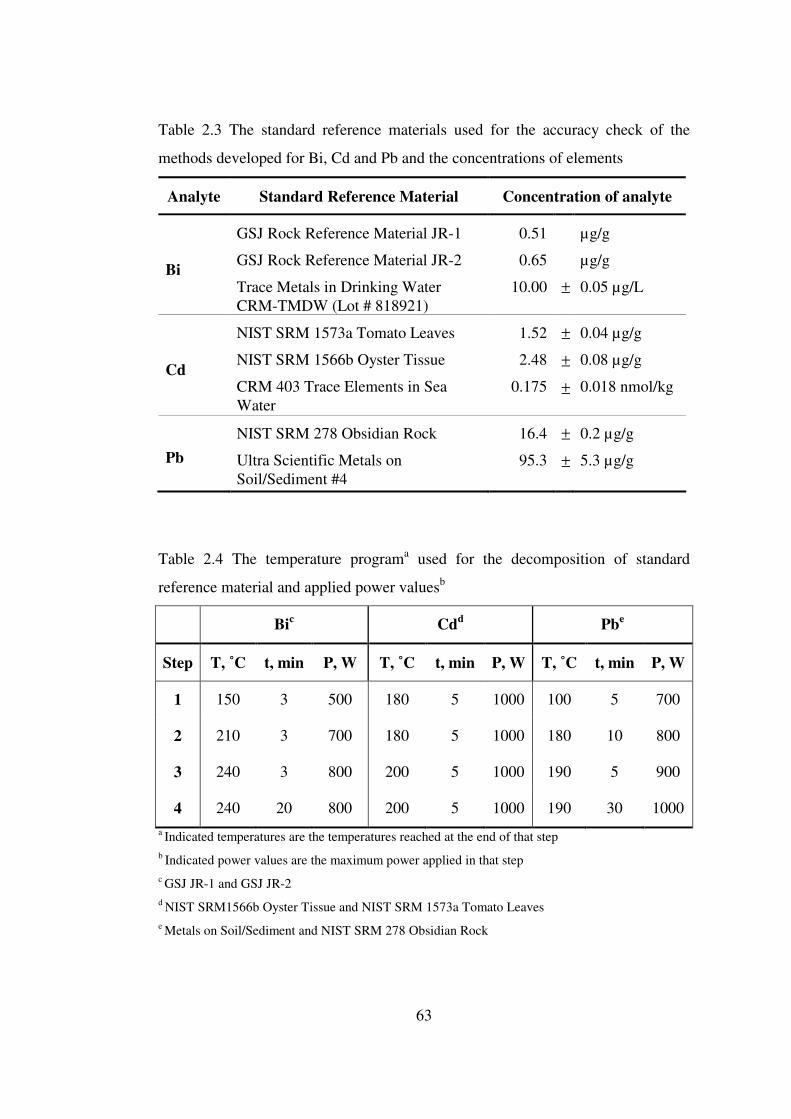
63
Table 2.3 The standard reference materials used for the accuracy check of the
methods developed for Bi, Cd and Pb and the concentrations of elements
Analyte Standard Reference Material Concentration of analyte
Bi
GSJ Rock Reference Material JR-1
GSJ Rock Reference Material JR-2
Trace Metals in Drinking Water CRM-TMDW (Lot # 818921)
0.51
0.65
10.00
±
µg/g
µg/g
0.05 µg/L
Cd
NIST SRM 1573a Tomato Leaves
NIST SRM 1566b Oyster Tissue
CRM 403 Trace Elements in Sea Water
1.52
2.48
0.175
±
±
±
0.04 µg/g
0.08 µg/g
0.018 nmol/kg
Pb NIST SRM 278 Obsidian Rock
Ultra Scientific Metals on Soil/Sediment #4
16.4
95.3
±
±
0.2 µg/g
5.3 µg/g
Table 2.4 The temperature programa used for the decomposition of standard
reference material and applied power valuesb
Bic Cdd Pbe
Step T, ˚C t, min P, W T, ˚C t, min P, W T, ˚C t, min P, W
1 150 3 500 180 5 1000 100 5 700
2 210 3 700 180 5 1000 180 10 800
3 240 3 800 200 5 1000 190 5 900
4 240 20 800 200 5 1000 190 30 1000 a Indicated temperatures are the temperatures reached at the end of that step b Indicated power values are the maximum power applied in that step c GSJ JR-1 and GSJ JR-2 d NIST SRM1566b Oyster Tissue and NIST SRM 1573a Tomato Leaves e Metals on Soil/Sediment and NIST SRM 278 Obsidian Rock

64
For Bi two geological reference materials GSJ JR-1 and GSJ JR-2 supplied from
Geological Survey of Japan were digested in microwave oven. Each geological
standard reference material was analyzed in three parallel replicates, which were
prepared by decomposing approximately 0.150 - 0.200 g of solid material using an
acid mixture of 3.0 mL of 40% (w/w) HF and 5.0 mL of 65% (w/w) HNO3. The
microwave program applied was given in Table 2.4. After complete
decomposition, the clear solutions were transferred to polyethylene volumetric
flasks and diluted to 50 mL with 1.0 mol/L HCl. Two different procedures were
applied for the measurements. In the first one (P1), 2.0 mL from the diluted
solution was injected to the system through injection valve using 2.0 mL sample
loop. In the second one (P2), first the solution was further diluted 10 times with 1.0
mol/L HCl and 18 mL of resulting solution was pumped to the reaction coil in CF
mode. In addition to geological SRM, Trace Metals in Drinking Water CRM-
TMDW supplied from High Purity Standards (Charleston, USA) was also
analyzed. For this purpose, 1.0 mL of water sample was diluted to 100 mL with 1.0
mol/L HCl and the resulting solution was analyzed directly. For the analysis of
water reference material, a sampling volume of 36 mL was used for the
measurements.
For the verification of method for Cd three different certified reference materials
were used. NIST SRM 1566b Oyster Tissue and NIST SRM 1573a Tomato Leaves
were decomposed and digested in microwave oven by using the program given in
Table 2.4. The analyses were conducted by using three replicates for each certified
reference materials. In the decomposition of oyster tissue, 5 mL of 65% (w/w)
HNO3 were added onto 0.250 g portion of oyster tissue. For tomato leaves in
addition to 5 mL (w/w) HNO3, 0.5 mL of 40% (w/w) HF was added onto 0.250 g
of tomato leaves. After the material was decomposed by applying the microwave
oven program given in Table 2.4, clear solutions were diluted to 50.0 mL with
deionized water using volumetric flasks made of glass and polyethylene for oyster
tissue and tomato leaves, respectively, and transferred to polyethylene bottles. Due

65
to strong matrix interferences, standard addition method was applied for the
determination of Cd in tomato leaves; a 25 fold dilution was made for the
minimization of matrix interferences by diluting them with 0.2 mol/L HCl. An
aliquot of 2.1 mL (corresponds to 1.0 min collection time) of diluted solution was
pumped to the generation system in CF mode and the generated volatile Cd species
were collected on the trap. Spiked solutions were also injected in the same manner.
In the analysis of oyster tissue SRM, the digests were further diluted 200 times
with 0.2 mol/L HCl which allowed the use of direct calibration method with a
collection period of 2.0 min that corresponds to a collection volume of 4.2 mL.
The analysis of CRM 403 Trace Elements in Sea Water was carried out without
any digestion procedure. Water sample was acidified with HCl and injected into
HG system in CF mode. The collection volume was 4.2 mL and the direct
calibration method was applied for the analysis of sea water SRM.
The accuracy of the method developed for Pb was demonstrated by analyzing two
different standard reference materials, Metals on Soil/Sediment #4 (Ultra
Scientific) and NIST SRM 278 Obsidian Rock standard reference materials. The
SRMs were decomposed in microwave oven employing the temperature program
given in Table 2.4. A 0.100 g portion of soil/sediment was decomposed using 4.0
mL of 65% (w/w) HNO3, 2.5 mL of 37% (w/w) HCl and 0.75 mL of 40% (w/w)
HF. For the decomposition of obsidian rock material 5.0 mL of 65% (w/w) HNO3,
5.0 mL of 37% (w/w) HF and 2.0 mL of deionized water were added onto
accurately weighed sample. The SRMs were analyzed in three replicates. After
their complete decomposition, they were transferred to PTFE beakers and
evaporated to dryness. The residue was dissolved and diluted to 100 mL using 0.06
mol/L HCl. Then they were transferred to polyethylene bottles for the
measurements. During the measurements, the digests of soil/sediment SRM were
diluted 100 times with 0.5% (w/w) potassium hexacyanoferrate(III) in 0.06 mol/L
HCl solution. In the analysis of obsidian rock digests, the solutions were further
diluted 25 times; the final solution was 0.5% (w/w) potassium hexacyanoferrate

66
and 0.06 mol/L in HCl. The samples were analyzed by FI-W-coil-HGAAS using
0.5 mL sample loop. In these experiments the carrier solution was 0.06 mol/L HCl.
No interferences were observed from the matrix elements. Both analyses were
carried out by direct calibration method.

67
CHAPTER III
RESULTS AND DISCUSSION
3.1 Selection of Trap
In the preliminary experiments Pt, W and Ni-Cr wires were tested as trap material.
These materials were selected such that all can be heated resistively and thus the
trapped species would be revolatilized rapidly. At the beginning of experiments,
traps were made in the laboratory by coiling them in such a shape that could be
placed in the inlet arm of quartz T-tube and supply maximum cross-sectional area.
Although Pt is soft metal for making it in different shapes easily, its melting point
is relatively low, 1769 ˚C [59], and becomes soft at about 1400-1500 ˚C. Therefore
it is not convenient for the elements that require higher temperatures for
volatilization. Ni-Cr wire can also be heated up to similar temperatures as Pt.
Regarding the temperatures that can be reached, W has the advantage of having
the highest melting point, 3410 ± 20 ˚C [59], among the elements in the periodic
table. It can be heated up to temperatures as high as 3200 ˚C which is high enough
to vaporize and even atomize most of the analyte compounds [51]. Another
advantage is its inertness to most of acids and chemical reagents. Tungsten also
has the disadvantage of being hard and that it can be easily broken during coiling
process. The experiments showed that it is also capable of trapping volatile species
of Bi, Cd and Pb when heated to moderate temperatures.
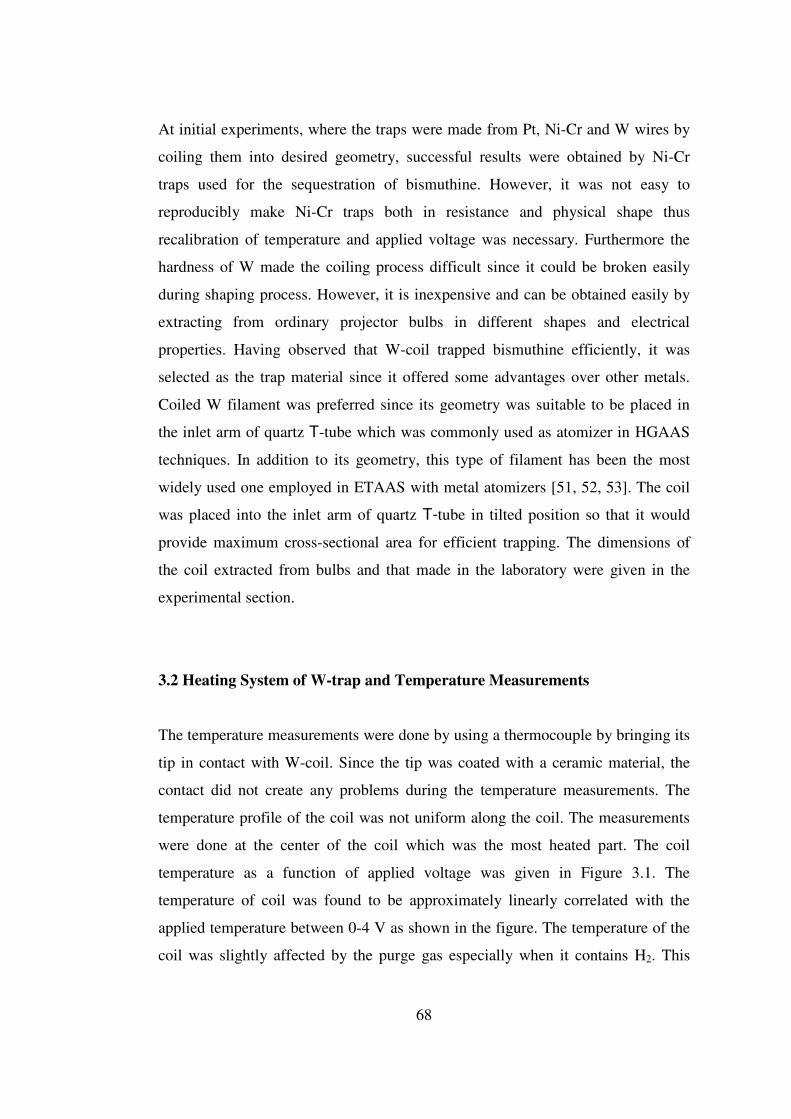
68
At initial experiments, where the traps were made from Pt, Ni-Cr and W wires by
coiling them into desired geometry, successful results were obtained by Ni-Cr
traps used for the sequestration of bismuthine. However, it was not easy to
reproducibly make Ni-Cr traps both in resistance and physical shape thus
recalibration of temperature and applied voltage was necessary. Furthermore the
hardness of W made the coiling process difficult since it could be broken easily
during shaping process. However, it is inexpensive and can be obtained easily by
extracting from ordinary projector bulbs in different shapes and electrical
properties. Having observed that W-coil trapped bismuthine efficiently, it was
selected as the trap material since it offered some advantages over other metals.
Coiled W filament was preferred since its geometry was suitable to be placed in
the inlet arm of quartz T-tube which was commonly used as atomizer in HGAAS
techniques. In addition to its geometry, this type of filament has been the most
widely used one employed in ETAAS with metal atomizers [51, 52, 53]. The coil
was placed into the inlet arm of quartz T-tube in tilted position so that it would
provide maximum cross-sectional area for efficient trapping. The dimensions of
the coil extracted from bulbs and that made in the laboratory were given in the
experimental section.
3.2 Heating System of W-trap and Temperature Measurements
The temperature measurements were done by using a thermocouple by bringing its
tip in contact with W-coil. Since the tip was coated with a ceramic material, the
contact did not create any problems during the temperature measurements. The
temperature profile of the coil was not uniform along the coil. The measurements
were done at the center of the coil which was the most heated part. The coil
temperature as a function of applied voltage was given in Figure 3.1. The
temperature of coil was found to be approximately linearly correlated with the
applied temperature between 0-4 V as shown in the figure. The temperature of the
coil was slightly affected by the purge gas especially when it contains H2. This

69
cooling effect was due to higher thermal conductivity of H2, 446 ⋅ 10-6
(cal/s⋅cm)(˚C/cm) at 26.7 ˚C, which is approximately 10 times higher than that of
Ar, 43⋅10-6 (cal/s⋅cm)(˚C/cm) [59]. The cooling effect of H2 was clear especially at
higher temperatures. During the experiments, the temperature of the coil was
controlled by the voltage applied by a transformer and a variable potential power
supply. By the aging, if inadequate H2 was supplied or O2 entered to the system,
the central part of the coil that was the most heated and oxidized region became
thinner and thus electrical and thermal characteristics changed. In this case, the
temperature was recalibrated against voltage.
The peak height was strongly dependent on rate of heating at releasing step for the
coil; higher heating rates caused sharper signals. Thus the coil must have been
heated as fast as possible at the releasing stage in order to obtain sharp and
reproducible signals. For this purpose a power switch was connected in front of
variable potential power supply. At the releasing stage, first the power switch was
kept in off position and the potential was adjusted to the desired release voltage on
variable potential power supply and then the power switch was turned on. Thus the
heating was very fast since the voltage was applied at once.
0
200
400
600
800
1000
1200
1400
0 1 2 3 4 5Applied voltage, V
Tem
pera
ture
, o C
300 mL/min Ar, 100 mL/min hydrogen500 mL/min Ar, 100 mL/min hydrogen75 mL/min Ar, 150 mL/min hydrogen
Figure 3.1 Voltage versus temperature of W-coil at different gas flow rates.

70
3.3 Composition of Carrier Gas
In the conventional HGAAS studies the carrier gas was only pure Ar. However
since W was easily oxidized when heated to the higher temperatures in the
presence of traces of O2, it was necessary to create a reducing environment in
order to minimize its oxidation. In the preliminary stages of trap experiments, only
Ar gas was used as the carrier gas; in this case the horizontal arm of quartz T-tube
as well as the inlet arm was gradually but definitely covered with a blue to brown
opaque layer as shown in Figure 3.2. These colored layers possibly indicated the
formation of WO2 (brown), W2O5 (blue) and W4O11 (blue) [59]; the last two
compounds with higher oxygen content were deposited further away from the T-
junction of quartz atomizer, where the O2 diffusion was higher. The addition of H2
into the carrier gas eliminated the background absorption; this was accompanied
by significant reduction in colored oxide formation. Although H2 was formed
during HG process, the amount produced was not sufficient to prevent the W-coil
from being oxidized during collection. The formation of such oxides depended on
the reagent flow rate, collection time (sample volume) and the strength of HG
reaction determined by the concentrations of HCl and NaBH4. The higher the flow
rate and the concentrations of reductant and HCl, the more vigorous the reaction
was; thus higher amount of aerosol and water vapor reached to trap. This was
resulted in an increase in the oxidation. The sampling time was also found to be
correlated with the oxidation of coil. For example sampling volumes higher than
40 mL (for Bi) resulted in an increase in the background signal due to oxidation of
W-coil; however, the signal magnitude was not affected significantly.
Nevertheless, the increase in background should be interpreted as a sign of W-coil
being oxidized; in this case, an increase in the percentage of H2 in carrier gas
eliminated the background signal, protecting the W-coil from being oxidized. The
oxidation definitely reduces the life time of W-coil. Therefore, choice of H2 flow
rate depended on these factors and it was selected such that the oxidation was kept
as minimum.

71
Figure 3.2 The effect of oxidation of W-coil on QTA when H2 was not used in the
carrier gas
3.4 Conditioning and Life Time of W-Trap
The total efficiency of a fresh W-coil was relatively low and at the beginning an
initial conditioning period with 10-30 firings was required to have a stable
analytical signal. The requirement of the conditioning may be explained by the
impurities present on the coil or the surface characteristics of new coil. As
mentioned in the previous section, the life time of the coil was determined by the
oxidation of W-coil. For prolonged use, the coil life was inversely proportional to
working volume; the larger volumes causes the oxidation of W-coil more and this
resulted in the shortening of the W-coil life. Each coil can be used for at least 2000
firings but the life time strongly depended on the factors that caused oxidation.
3.5 Bismuth
3.5.1 Optimization of Hydride Generation Parameters
The acidified solution of bismuth reacts with tetrahydroborate conveniently to
form bismuthine, BiH3. Since it is relatively stable and the boiling point is low (17
˚C) [5], it can be separated from the solution efficiently using a U-type GLS. The
W4O11
W2O5
WO2

72
reaction coil was selected as 15 cm. The length of stripping coil was 2 cm. The
optimum values of concentrations of HCl and NaBH4 were determined by
conventional flow injection method (no W-coil on the way) by injecting 0.500 mL
of 20 ng/mL Bi. During the optimization of sample acidity, the carrier Ar flow rate
was 500 mL/min and the flow rates of solutions were 6 mL/min. The effect of HCl
concentration in the analyte solution was given in Figure 3.3. In these experiments
1.0 mol/L HCl was used as the carrier solution. A sharp increase in the analytical
signal was observed between 0 and 0.10 mol/L. Between 0.10 and 1.0 mol/L the
signal increased slightly and reached a plateau. Thus, optimum HCl concentration
in the sample solution was selected as 1.0 mol/L.
0.00
0.02
0.04
0.06
0.08
0.10
0.12
0 1 2 3 4HCl concentration in sample solution, mol/L
Abs
orba
nce
Figure 3.3 Optimization of HCl concentration for BiH3 generation. Concentration
of Bi was 20 ng/mL and the volume of sample loop was 0.500 mL.
The optimization of NaBH4 concentration was also performed under the same
conditions that were used in the optimization of HCl. For the stabilization, the
solutions of NaBH4 were prepared in 0.2% (w/v) NaOH whose concentration was
not examined. The optimization plot of analytical signal versus reductant

73
concentration is given in Figure 3.4. The analytical signal increased gradually up
to a concentration of 0.5% (w/v) NaBH4. A further increase in the concentration
was resulted in a decrease in the analytical signal probably due to the dilution of
analyte species in the gas stream by the H2 generated in excess. Therefore a
concentration of 0.5% (w/v) was found to be the optimum concentration of NaBH4
for bismuthine generation.
0.00
0.03
0.06
0.09
0.12
0.15
0 1 2 3 4
Concentration of NaBH4 in reductant solution, % (w/v)
Abs
orba
nce
Figure 3.4 Optimization of NaBH4 concentration for BiH3 generation.
Concentration of Bi was 20 ng/mL and the volume of sample loop was 0.500 mL.
3.5.2 Optimization of Trapping Conditions
3.5.2.1 Collection and Revolatilization Temperatures
The decrease in the analytical signal was an indication of trapping when the W-
coil, placed between hydride generator and the atomizer, was being heated

74
gradually. The estimation of the trapping temperature was made by observing the
degree of decrease in the continuous signal. However it was not possible to decide
about the collection temperature just by observing the continuous signal since the
decrease might also be due to loss of analyte on the heated parts other than the trap
itself. Later on, it was observed that quartz was also capable of trapping
bismuthine when heated to moderate temperatures by W-coil. Therefore, in order
to estimate the temperature at which maximum trapping was achieved by W-coil
traps, always the signals obtained after each revolatilization were taken into
account. The dependence of analytical signal on collection temperature together
with release temperature was given in Figure 3.5. The optimum collection
temperature range for bismuthine was rather narrow and reaches to maximum at
270 ˚C; for higher temperature values, a sharp decrease was observed in the
trapping efficiency due to loss of analyte during collection stage. The distance
between the trap and the flame was only 5 cm and the trap was unavoidably heated
slightly by the flame. Although all of the trapped Bi species can be revolatilized
from the surface at 350 ˚C without any memory effect in the next run, a
temperature of 1200 ˚C was necessary for rapid revolatilization so that the use of
peak height in signals was justified. The peak height of analytical signal obtained
by a release temperature of 350 ˚C was low due to slower rate of revolatilization
and thus the broadening of the analytical signal was observed. Until 900 ˚C the
signal increased slowly by an increase in the release temperature and a plateau was
reached at 1000 ˚C. A release temperature of 1200 ˚C was selected since no
significant increase was obtained in the analytical signal at higher temperatures.

75
0.00
0.05
0.10
0.15
0.20
0.25
0.30
0 200 400 600 800 1000 1200 1400
Temperature, oC
Abs
orba
nce
Collection Release
Figure 3.5 The effect of collection and release temperatures on analytical signal for
5.0 ng Bi. During the variations of collection and release temperatures, a constant
release temperature of 1200 ˚C and a constant collection temperature of 270 ˚C,
respectively, were employed.
It has been reported [164] that quartz alone can also be used as a trap for
volatilized Pb species; therefore, the rapid electrical heating of W-coil for a short
time (1-2 s) in our case was an advantage to assure only the signal from tungsten
moiety was analytically measured. Any interference from the collection and
releasing of volatile Bi species on the quartz surface may be a problem especially
if the heating were affected by external means. It was also observed that if higher
collection temperature was used so that the quartz was also heated, the bismuthine
was also trapped on the walls of quartz around W-coil. In those cases, if a higher
release temperature was used, a second peak next to the analytical signal was
appeared. In our case, no such interference was observed as electrical heating of
W-coil was used which provide fast heating in a short time.
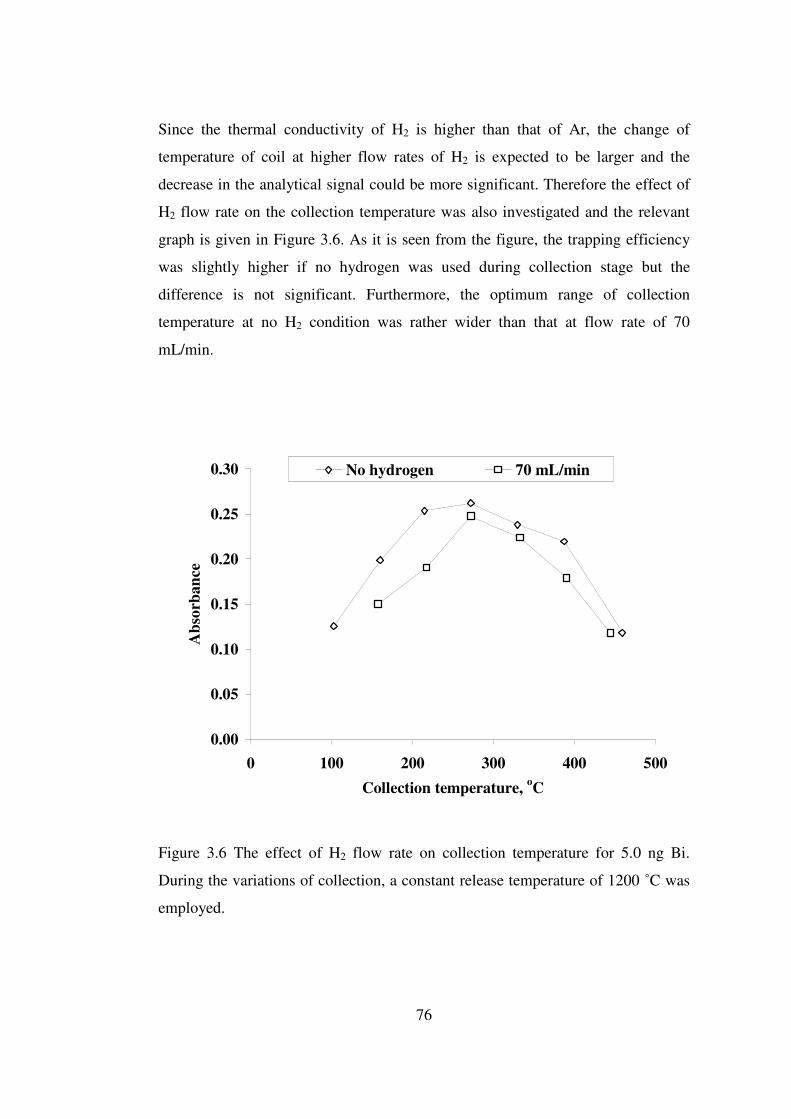
76
Since the thermal conductivity of H2 is higher than that of Ar, the change of
temperature of coil at higher flow rates of H2 is expected to be larger and the
decrease in the analytical signal could be more significant. Therefore the effect of
H2 flow rate on the collection temperature was also investigated and the relevant
graph is given in Figure 3.6. As it is seen from the figure, the trapping efficiency
was slightly higher if no hydrogen was used during collection stage but the
difference is not significant. Furthermore, the optimum range of collection
temperature at no H2 condition was rather wider than that at flow rate of 70
mL/min.
0.00
0.05
0.10
0.15
0.20
0.25
0.30
0 100 200 300 400 500Collection temperature, oC
Abs
orba
nce
No hydrogen 70 mL/min
Figure 3.6 The effect of H2 flow rate on collection temperature for 5.0 ng Bi.
During the variations of collection, a constant release temperature of 1200 ˚C was
employed.

77
3.5.2.2 Carrier Gas Flow Rates
3.5.2.2.1 Argon Flow Rate
The optimum Ar flow rates for collection and release stages were determined in FI
mode and optimization graphs were given in Figure 3.7 and 3.8, respectively.
During these measurements, only Ar flow rate was varied for the determination of
optimum carrier gas flow rate for collection and release steps while H2 flow rate
was kept constant at a flow rate of 70 mL/min for both collection and release steps;
the lower flow rates of H2 caused the oxidation of W-coil and resulted in relatively
higher background absorption as discussed in previous section. It was clear that the
efficiency of collection increased at lower flow rates of Ar. When the Ar flow rate
was decreased from 75 mL/min to 50 mL/min, the trapping efficiency increased by
only 5%. Although the trapping efficiency could be increased by using lower
carrier flow rates, the optimum Ar flow rate at collection stage was chosen as 75
mL/min in order not to increase the percentage of H2 in the carrier gas mixture for
safety reasons. Hydrogen flow rate could not be decreased at the same rate as Ar
flow rate since the lower flow rates resulted increased oxidation of W-coil.
For the releasing stage, the optimum Ar flow rate was selected as 500 mL/min.
The slower Ar flow rates for releasing stage caused peak broadening and decrease
in the peak height of analytical signal. The decrease in the peak height was more
pronounced when the release Ar flow rate was decreased as compared to an
increase in the Ar flow rate. At the releasing stage, Ar flow rates higher than 500
mL/min did not cause any significant change in signal shape up to 1000 mL/min.
However the peak height decreased approximately 10% at 1000 mL/min. It can be
concluded that the revolatilization of Bi species form the W-coil was a rapid
process and could be achieved when the target temperature of coil is 1200 ˚C. At
extreme release Ar flow rates the analytical signal become smaller due to reduced
residence time and dilution of analyte species in the horizontal arm.

78
0.00
0.05
0.10
0.15
0.20
0.25
0.30
0 100 200 300 400 500 600 700
Ar flow rate, mL/min
Abs
orba
nce
Figure 3.7 Effect of collection Ar flow rate on the peak height of analytical signal
for 0.500 mL of 10 ng/mL Bi.
0.00
0.05
0.10
0.15
0.20
0.25
0.30
0 500 1000 1500 2000Argon flow rate, mL/min
Abs
orba
nce
Figure 3.8 Effect of release Ar flow rate on the peak height of analytical signal for
0.500 mL of 10 ng/mL Bi.

79
3.5.2.2.2 Hydrogen Flow Rate
The effect of H2 on the collection efficiency was investigated by varying its flow
rate during collection while keeping the Ar flow rate constant. The plot of
analytical signal versus H2 flow rate was given in Figure 3.9. It was observed that
H2 which was introduced in the carrier gas did not affect the trapping mechanism
as expected since there was generated H2 already by hydride generation reaction.
The slight decrease in the analytical signal at higher flow rates was considered to
be the consequence of carrier or cooling effect of hydrogen since the temperature
was also effected by the hydrogen flow rate and the trapping temperature was
critical for Bi. The effect was also seemed to be not significant during release stage
where its flow could not be decreased as for collection since the coil was oxidized
and background absorption increased significantly.
0.00
0.05
0.10
0.15
0.20
0.25
0.30
0 20 40 60 80 100 120
Flow rate of H2 during collection stage, mL/min
Abs
orba
nce
Figure 3.9 Effect of H2 flow rate in the carrier gas on the analytical signal of 0.500
mL of 10 ng/mL Bi.

80
3.5.2.3 Stability of Collected Species on the W-Trap
The stability of the trapped species of Bi was investigated by varying the time
interval between collection and release stages; the trap was kept unheated in this
interval and the carrier gas at its optimum value for releasing step was passed
through the HG system. When the time interval between collection and
revolatilization stages was varied from 0.5 to 15 minutes, no significant change
was observed in the peak height of analytical signal. The trapped Bi species were
stable on the coil for at least 15 minutes if the coil was kept unheated.
3.5.2.4 Effect of Cooling Time after Releasing Stage
The effect of cooling time was investigated to see whether there was a need of
cooling after each release or there should be an activation stage for the next
collection. One of the main advantages of W-coil over graphite cuvette in ETAAS
is that it does not need an external cooling system and the coil can be effectively
cooled down by the purge gas as its size is small. In the developed methodology,
the coil was cooled only by the carrier gas at the flow rates used for transportation
of revolatilized species. The results also show that there was no need to wait for
cooling and also activation of the surface of W-coil for the next collection. Once
the collected species were released from the surface of W-coil, next collection
process could be started immediately. Therefore the total analysis period was
reduced significantly and was determined mostly by the collection time since the
releasing step was completed in a few seconds.
3.5.2.5 Length of Transport Tubing between W-Trap and Atomizer
Although the nature of species released from the W-coil surface was unidentified,
it is believed that they were mostly molecular. While volatile species are being

81
trapped in graphite tubes, first the hydride is decomposed and than analyte species
was trapped [71]. Revolatilized analyte species might be atomic or molecular other
than hydride. It was expected that if they were atomic, they could not be
transported to long distances without being adsorbed on the surface of transport
tubings and there should be a decrease in the analytical signal. For the
investigation of nature of revolatilized species, they were transported to QTA held
at room temperature. In addition, the length of transport tubing between trap and
the heated QTA was varied.
When they were sent to an unheated quartz T-tube at a distance of 5 cm, no atomic
signal was obtained when 1200 ˚C was employed for releasing process; the analyte
concentration was at ng/mL range. Thus, the revolatilized species were probably
not atomic or initially atomic but immediately converted to molecular species after
volatilization.
When the distance between W-coil and the junction point of quartz T-tube
atomizer heated by the flame was 2-3 cm, the temperature of coil was elevated to
350-400 ˚C by the flame. At this temperature, the trapped species were not stable
on the coil surface and thus sensitivity and reproducibility was degraded. The W-
trap was placed further away from the quartz T-tube after separating it in order to
investigate the transport ability of released Bi species to long distances. The W-
coil trap was separated from quartz T-tube and placed into a piece of quartz tube
identical in size to the inlet arm of quartz T-tube atomizer. The length of tygon
transport tubing between the trap and atomizer was varied between 10 cm and 200
cm. The change in both peak height and peak area of the analytical signal was
given in Figure 3.10. When the transport length was increased to 200 cm, peak
height signal was decreased to 28% of its value obtained at 10 cm. If the peak area
was considered, the analytical signal was decreased to 76 % of that obtained at 10
cm, which indicates significant peak broadening. The decrease in the analytical
signal was mostly due to dilution of volatile analyte species during transportation
since the peak height was much more affected than peak area. Furthermore, it was

82
also observed that as the length of transport tubing was increased from 10 cm to
200 cm, the analytical signal was tailed and the base-width of the signal increased
from 0.4 s to 0.8 s. Rather efficient transport properties of the released species
indicate that they are probably molecular and the W-coil trap can be used as an
ETV device for sample introduction for the determination of Bi by ICP-OES or
ICP-MS, as well as by quartz T-tube atomizer.
0.000
0.050
0.100
0.150
0.200
0.250
0.300
0.350
0 50 100 150 200
Trap-atomizer distance, cm
Ana
lytic
al si
gnal
, A o
r A
.s Peak Height Peak Area
Figure 3.10 Analytical signal versus trap-atomizer distance for 0.500 mL of 10
ng/mL Bi (5.0 ng Bi).
3.5.3 Relation between Collection Volume and Analytical Signal
The relation between the analytical signal and the collection volume was
investigated using a 0.100 ng/mL Bi solution in CF mode; the results were
displayed in Figure 3.11. The analytical signal increased linearly with collection
volume and the linearity was verified between 6.0 and 60 mL with a squared
correlation coefficient of 0.998. Under the experimental condition, it took 10
minutes to collect 60 mL of sample. Since the analysis time increased, the

83
collection volume was not increased further. The linearity of the plot showing
sample volume versus analytical signal was also demonstrated for smaller sample
volumes (not shown here), ranging in 0.500 to 6.5 mL for 0.50 ng/mL of analyte
solution in FI mode with a better correlation coefficient; the equation of the best
line was y = 0.0372x + 0.0034 (R2 = 0.999).
y = 0.00406x + 0.01304R2 = 0.998
0.00
0.05
0.10
0.15
0.20
0.25
0.30
0 10 20 30 40 50 60 70
Collection volume, mL
Abs
orba
nce
Figure 3.11 Analytical signal versus collection volume for 0.100 ng/mL Bi in 1.0
mol/L HCl; collection temperature, 270 ˚C; release temperature, 1200 ˚C.
The blank signal started to become significant when the injection volume was
increased to 25 ml. The concentration of Bi in the reagent blank was found to be
0.0056 ng/mL. In this study, no purification process was applied to reagents. If the
reagents blank values are reduced, the sample collection volume can be increased
up to at least 60 mL since the linearity is conserved. The option of high sampling
volume is advantageous in case of strong interferences in the sample, since the
dilution of sample is a way of decreasing chemical interference in the hydride
generation [5]. Higher collection volumes can be employed after diluting the

84
sample solution; instead of injecting 1 mL of sample solution, a volume of 10 mL
could be injected after diluting it 10 times with blank solution. This was not shown
for Bi since there was no such interference but proven for Cd in the analysis of
SRMs for the accuracy check.
The choice of collection volume was determined by the concentration of analyte in
the sample solution and by the matrix interferences encountered. The sampling
rate was also depended on the collection volume. It is better to choose appropriate
sampling volume by considering these factors. The collection volume was 18 mL
(3 min collection) for the analysis of geological SRMs and 36 mL (6 min
collection) for drinking water SRM.
3.5.4 Analytical Signal and Reproducibility
The analytical signal obtained from 36 mL of 0.100 ng/mL Bi (3.6 ng Bi) and that
obtained from 36 mL of 0.020 ng/mL Bi (0.72 ng Bi) were shown in Figure 3.12,
respectively. An increase of five-fold in concentration results in approximately
five times increase in the analytical signal. The base-width of analytical signal is
almost the same for both 6.5 mL of 0.500 ng/mL Bi (not shown here) and 36 mL
of 0.020 ng/mL and does not depend on the analyte concentration or sample
volume.
The replicate measurements of 0.010 ng/mL gave 5.8% and 3.2% RSD (based on
peak height) for 18 mL (n=13) and 36 mL (n=7), respectively. The overall
reproducibility of the peak height signal obtained in the linear range varied
between 2-6% for RSD values. On the other hand, since the residence time of the
analyte species was very short on the light path, the low integrated absorbance
values were affected significantly by the lamp noise. Although the integration time
was chosen as 1.5 s in order to minimize the effect of lamp noise on peak area
values, the integrated absorbance values obtained from 0.010 ng/mL gave 27% and

85
13% RSD for 18 mL (n=13) and 36 mL (n=7), respectively; therefore use of peak
height was preferred. However the peak area was also found to be well correlated
with the concentration.
Figure 3.12 The analytical signals for Bi. Collection at 270 ˚C and releasing at
1200 ˚C. a) 36 mL of 0.100 ng/mL Bi (3.6 ng Bi), b) 36 mL of 0.020 ng/mL Bi
(0.72 ng Bi)

86
3.5.5 Calibration Plot
The calibration plot drawn by using peak height and peak area for 18 mL of
aqueous standard solutions was given in Figure 3.12. It was found that the plot was
linear between the concentrations of 0.030 ng/mL and 0.500 ng/mL Bi when
drawn for peak height of the analytical signal with a collection volume of 18 mL
sample volume (3 min collection). Above this concentration, a slight deviation
from the linearity was observed. The peak area was also found to be linearly
correlated with the concentration, but the precision of the measurements was poor.
The calibration plot for 6.5 mL and 36 mL collection volume was also linear
between 0.5 and 2 ng/mL (y = 0.2917x + 0.0327 and R2 = 0.988) and 0.020 ng/mL
and 0.500 ng/mL (y = 1.4213x + 0.0116 and R2 = 0.998), respectively.
y = 0.8875x + 0.0268R2 = 0.994
y = 0.2033x + 0.0104R2 = 0.993
0.000.050.100.150.200.250.300.350.400.450.50
0 0.1 0.2 0.3 0.4 0.5 0.6
Concentration of Bi, ng/mL
Ana
lytic
al S
igna
l, A
or
A.s
Peak Height Peak Area
Figure 3.13 The calibration plot drawn by using peak height and peak area for 18
mL of aqueous standard solutions of Bi under optimum conditions.

87
3.5.6 The Analytical Figures of Merit
The analytical figures of merit of the method, which were calculated by using the
peak height values of analytical signal, were given in Table 3.1. The enhancement
factor in limit of detection (3σ) which was calculated by using 0.0156 ng/mL
(including blank value which contains 0.0056 ng/mL Bi) is found to be 150 for 18
mL collection volume (for 36 mL it is 270) when compared to conventional FI-
HGAAS. The characteristic concentration for 18 mL sample volume is calculated
as 0.0023 ng/mL (per 0.00436 absorbance unit corresponding to 1% absorption)
which was 130 times lower as compared to conventional FI-HGAAS. When peak
area was used for these parameters the results were not as satisfactory as peak
height values since obtained signals were so sharp that integrated absorbance
values were numerically small and were affected by the lamp noise thus the %RSD
values increased. The reagent blank value was another limitation for further
improvement in the analytical figures of merit for the new technique. No
purification method was applied in order to reduce blank values.
The total efficiency of W trap for collection and revolatilization of Bi species were
calculated using the peak area values obtained under the same carrier gas flow
rates. During these calculations the total efficiency of conventional HGAAS was
assumed to be 100%. The total efficiency of W-trap was found to be 23%.
Table 3.1 Analytical figures of merit and enhancement factors for Bi calculated by
using peak height of analytical signal.
FI-HGAASa W-Trap HGAASb
Enhancement Factor
Limit of detection, ng/mL 0.410 0.0027 150
Characteristic concentration, ng/mL
0.290 0.0023 130
a The parameters were calculated by 10 replicate measurements of 0.500 mL of 1.0 ng/mL Bi solution. b The parameters were calculated by 10 replicate measurements of 18 mL of 0.010 ng/mL Bi solution.

88
The limit of detection of the developed method is compared with the literature
values in Table 3.2. As seen on the table, the concentration limit of detection value
is comparable with the others or better. Although absolute limits of detection of
MS systems are better than that of the method presented here, their use is
prohibited by high cost and they are not available in most laboratories. The main
advantage of W-coil HGAAS is that it can be applied inexpensively in all
laboratories having a simple AAS instrument. The time required for the analysis
depends on the collection time. When Bi concentration in the sample solution is in
the low ng/mL range, approximately 30 s was enough for both collection and the
measurement of analytical signal. If the concentration is in the pg/mL range, 3-5
minutes are enough for both collection and measurement of analytical signal. No
memory effect was encountered in the experiments.
Table 3.2 Comparison of the limit of detection and the sample volume of the
method with those of others in literature.
Method
Concentration LOD, ng/mL
Absolute LOD, pg
Sample Volume,
mL
Reference Number
W-Trap HGAAS 0.0027 49 18 This study
Precipitation ETAAS
0.016 8 0.5 108
Electrodeposition ETAAS
0.0078 78 10 70
Direct Injection Nebulization ICP-MS
0.0097 0.19 0.020 115
Microcolumn Preconcentration FI-ICP-AES
0.030 3000 100 116
In-situ trapping HG-ETAAS
0.020 100 5 124
In-situ trapping ETV-ICP-MS
0.003 6 2 94

89
3.5.7 Accuracy of the Method
The accuracy of the method was tested using a certified reference material CRM,
Trace Metals in Drinking Water (Cat No CRM-TMDW Lot # 818921) supplied
from High Purity Standards (Charleston, USA) and geological standard reference
materials of GSJ (Geological Survey of Japan) JR-1 and JR-2. Determination in
CRM-TMDW was carried out by diluting 1.0 mL of CRM to 100 mL with 1.0
mol/L HCl, resulting in a solution of approximately 0.1 ng/ mL in Bi. For the
analysis of water reference material the sampling volume was selected as 36 mL
for both standards and sample. The analysis was performed by direct calibration
method.
The geological standard reference materials were analyzed by two different
procedures; by direct injection of digested solutions (P1) and the analysis of
solutions after further dilution (P2). In both cases no adverse effect was observed
in any glass or quartz part of the system because of the presence of unconsumed
HF remaining from the dissolution procedure. The results (n=3 for each analysis)
given in Table 3.3 were in good agreement with the certified values. The t-test was
applied to results assuming the certified values are the true values. The results
passed the t-test at 95% confidence level. Aqueous standard solutions were used
for the calibration plots; standard addition method was not needed or used.
Table 3.3 Results of the analysis of standard reference materials and their certified
values (n=3 for each measurement)
SRM P 1a P 2b Certified Value
GSJ JR-1 (µg/g) 0.51 ± 0.02 0.53 ± 0.03 0.51
GSJ JR-2 (µg/g) 0.62 ± 0.02 0.64 ± 0.01 0.65
CRM-TMDW (µg/L) - 10.3 ± 1.5 10
a Sample solution was analyzed directly without further dilution b Sample solution was diluted and then analyzed; for GSJ reference materials, the solutions were further diluted 10 times with 1.0 mol/L HCl; for TMDW, the solution was diluted 100 times with 1.0 mol/L HCl

90
In hydride generation studies the transition metals interferes with the analyte and
usually negatively. These metals also react with sodium tetrahydroborate and
reduced to their hydrides or metallic forms. If there are high amounts of transition
metal in the analyte solution, inside of GLS, reaction and stripping coil and also
the transfer tubing between GLS and atomizer become dark gray which is due to
the formation of metallic particulates. The interferences expected from the
transition metals were not investigated. The effect is usually measured as the
interferent/analyte ratio. However, regardless of the interferent/analyte ratio, the
concentration of interferent is also important. In other words, although the ratio is
same in two solutions, the interference may not be observed in solution where both
analyte and interferent concentration is low. The preconcentration method offer
advantage of dilution of analyte solution if the interferent concentration is high.
Only the interference effect of copper that is one of the most interfering elements
was investigated by preparing the analyte in solution containing different
concentrations of Cu. The interference was observed when the concentration of Cu
in the analyte solution exceeds 2 µg/mL and the Bi concentration was 10 ng/mL
(interferent/analyte ratio was 200).
The interferences expected from the transition metals were not investigated.
However analyzed solutions from P1 for geological reference materials contained
high amounts of Si (106 times Bi), Al (105 times Bi), Fe (104 times Bi), Ti (103
times Bi), Ca (104 times Bi), Mn (103 times Bi) and Mg (103 times Bi), which did
not cause any matrix interference; the values in the parenthesis are the ratios by
weight . The water standard reference material contained high amounts of Ca, Mg,
Na, K, Sr, Al, Fe, As and Zn whose concentrations (by mass of species) are 3500,
900, 600, 250, 25, 12, 10, 8 and 7 times higher than the Bi concentration,
respectively. The fact that there was no need for standard additions to obtain
accurate results strongly supports the absence of interferences.

91
It should be noted that high sensitivity of our method is an advantage regarding
interferences. For example, although the mass ratio of interferent to analyte was
1000 in both our work (for the geological reference materials GSJ JR-1 and GSJ
JR-2) and elsewhere [167] for Mn, we observed no interference while a signal
decrease of 15% was reported by Burns et al. [167]. However, it should also be
noted that in our case Bi concentration in final sample solutions was about 0.20
ng/mL, while the same value was reported as 500 ng/mL by Burns et al. [167];
therefore corresponding interferent mass in our case is much lower although
interferent/analyte ratio was same in both studies. The similar trend was also
reported in another study [70] where although the same ratio was 10000 and no
interference was observed; the concentration of Bi was reported as 0.5 ng/mL. It is
also well known that Cu is an interferent in HGAAS determination of Bi. During
the determination of Bi in geological SRM samples, Cu/Bi mass ratio was only 3;
no interference effect was observed. Elsewhere, a signal reduction of 37% [70]
was reported when the same mass ratio was 10000; 77% and 100% signal
reduction were reported for Cu/Bi mass ratio values of 20 and 200, respectively
[167]. Therefore in case of high Cu concentrations interference should be
expected.
3.6 Cadmium
3.6.1 Atom Cell
Since the generated volatile species, presumably cadmium hydride, are unstable
and quickly decompose to the atomic Cd vapor and H2 [7], there was no need for
externally heated quartz T-tube atomizer. Therefore unheated quartz T-tube could
be used as atom cell for Cd throughout the experiments. Furthermore, heating the
QTA resulted in a decrease in the analytical signal due to the lowered residence

92
time of Cd atoms in the cell because of thermal expansion of gases at elevated
temperatures. When the QTA was heated by air/acetylene flame, the analytical
signal was decreased approximately by one half. This observation was consistent
with the findings of Sanz-Medel et al. [7]. Therefore, during Cd studies the quartz
T-tube was not heated and kept at room temperature. The ends of T-tube were not
covered with quartz plates as in the case of Hg in CV. When both ends were
covered, the analytical signal decreased slightly. This reduction was probably due
to the absorption of stable Cd atoms outside the quartz T-tube when they left the
horizontal arm at both ends. When the ends were covered, the pathlength was
reduced as compared to the case with no windows. The change in the signal
magnitude was also related with the exhaustion hood flow rate and the movements
of air around the cell [168].
3.6.2 Optimization of Vapor Generation Parameters
3.6.2.1 General Considerations in the Vapor Generation of Cd by
Tetrahydroborate Reduction
In the literature there are different conditions of vapor generation which are not
consistent with each other [135]. When compared to other hydride forming
elements, the generation of volatile species of Cd by the reduction with NaBH4 is
rather problematic mostly due to unstability of cadmium hydride. The unstability
of CdH2 was explained by substantial differences in the electronegativities of Cd
and H atoms and less pronounced covalent character of the bond [135]. The rather
less covalent character makes the VG reaction incomplete and there remains ionic
Cd species in the GLS which may subsequently be converted to its hydride in next
runs. Therefore, it was mentioned in the same report that there should be more
than one set of optimum conditions for Cd for efficient VG. It requires careful
control of acidity of both analyte and the carrier solutions since the concentrations

93
are very critical and the optimum ranges are very narrow. For common hydride
forming elements, such as As and Se, the acidities of sample and the carrier
solutions are not very critical and usually they are the same. However, this is not
valid for Cd for which the optimum HCl concentration in sample solution is
usually different from that in the carrier solution.
It was observed that the presence of O2 in the carrier gas (Ar) strongly decreases
the analytical signal. The presence of 1% O2 in the stripping gas decreased the
analytical signal to about one third of the original signal. This may be attributed to
inefficient hydride generation: probably in the presence of O2 some of the Cd
could not be converted to hydride but instead its oxide is produced which is not
volatile and quickly decomposes in the reaction medium. Use of H2 alone as the
carrier gas did not change the analytical signal.
Lampugnani et al. [135] summarized the literature data on the vapor generation of
Cd by tetrahydroborate reduction. The optimum conditions showed significant
variations from one study to another. Usually high concentrations of
tetrahydroborate were utilized (3-5% (w/v) as Na or K salts). The concentration of
HCl was usually in between 0.2-0.5 mol/L in CF or FI mode [135].
3.6.2.2 Concentration of HCl in Sample and Carrier Solution
The optimum acid concentration in the sample and the carrier solution was
determined by FI-HGAAS and were interrelated; depending on the former, the
optimum value of latter changes. When using univariate approach, multi-cycling
was necessary to find the optimum value. The optimization plots of sample and the
carrier acidity for FI-HGAAS were shown in Figure 3.14.

94
0.00
0.02
0.04
0.06
0.08
0.10
0 0.2 0.4 0.6 0.8 1HCl Concentration, mol/L
Abs
orba
nce
In Carrier In Sample
Figure 3.14 Effect of HCl concentration in sample and carrier solutions on the
analytical signal of Cd obtained by conventional FI-HGAAS. Carrier solution and
sample solution acidities were 0.25 mol/L and 0.15 mol/L HCl, respectively, as the
other parameter was varied. 0.500 mL of 1.0 ng/mL Cd was used in the
experiments.
The optimum concentration of HCl in the carrier solution was investigated by
keeping the HCl concentration in analyte solution at 0.15 mol/L. As it is seen, the
analytical signal did not change significantly when the concentration of HCl in the
carrier was in between 0.15 and 0.35 mol/L. However, since the signal obtained
with 0.25 mol/L HCl was slightly higher and located at the midpoint of the
plateau, this value was selected as the optimum HCl concentration in carrier
solution in FI studies. The optimization of sample acidity was carried out by
keeping the carrier concentration at its optimum value, 0.25 mol/L. The sample
acidity was found to be more critical and slight variations resulted in a significant
change in the analytical signal. Therefore a concentration of 0.15 mol/L was found
to be optimum HCl concentration in sample solution. Almost no signal could be
obtained when the concentration of HCl in either solution exceeds 0.8 mol/L.

95
Therefore, in FI-HGAAS the concentration of HCl in both solutions, especially in
sample solution must be carefully controlled.
The effect of sample acidity was also investigated in CF mode, since the trapping
experiments were conducted in this mode. These experiments were conducted
under trapping conditions. First, the generated species were trapped and then
released from the trap. The optimization graph was given in Figure 3.15 for both
peak height and peak area. The acidity of sample solution was again found to be
critical. Maximum signal was achieved when the concentration was 0.2 mol/L.
Therefore the solutions of Cd were prepared in 0.2 mol/L HCl in CF W-trap
HGAAS experiments.
0.00
0.10
0.20
0.30
0.40
0.50
0.60
0.70
0.80
0 0.1 0.2 0.3 0.4 0.5 0.6
Concentration of HCl, mol/L
Ana
lytic
al si
gnal
, A o
r A
.s
Peak Height Peak Area
Figure 3.15 Effect of HCl concentration in the sample solution on the analytical
signal of Cd obtained from W-trap system in CF mode. The signals were obtained
by collecting 0.7 mL of 10.0 ng/mL Cd, a total of 7.0 ng Cd.

96
3.6.2.3 Concentrations of NaBH4 and NaOH in Reductant Solution
The effect of reductant concentration was investigated both in FI mode using
conventional HG, and in CF using trap system. The change in the analytical signal
with respect to reductant concentration for FI-HGAAS (without trap) was given in
Figure 3.16. It was observed that the signal increases up to a concentration of 1.2%
(w/v) and then decreased. The decrease can be explained by the dilution effect
since more H2 was generated at higher concentrations of reductant. In CF-W-trap-
HGAAS, such decline was not observed since the analytical signal was obtained
after preconcentration. The relevant graph was given in Figure 3.17. The signal
increased with increasing reductant concentration and stayed almost constant after
1.5% (w/v) up to 3% (w/v). A slight increase in the signal was not found to be
significant and 1.5% (w/v) was selected as the optimum value. When compared to
literature values, 3-5% (w/v) [135], the optimum concentration of tetrahydroborate
was significantly lower. This may be attributed to the use of small volume GLS
and lower flow rates of solutions. In the preliminary studies, U-type GLS was used
and the optimum concentration of reductant was found to be higher than that found
here; the analytical signal increased up to a concentration of 3% (w/v) NaBH4.

97
0.000.010.020.030.040.050.060.070.080.090.10
0 0.5 1 1.5 2 2.5 3
Concentration of NaBH4, % (w/v)
Abs
orba
nce
Figure 3.16 Effect of NaBH4 concentration on the analytical signal of Cd obtained
in conventional FI-HGAAS. The concentrations of HCl were 0.15 and 0.25 mol/L
in sample and carrier solutions, respectively. 0.500 mL of 1.0 ng/mL Cd was
injected.
0.00
0.05
0.10
0.15
0.20
0.25
0.30
0 0.5 1 1.5 2 2.5 3 3.5Concentration of NaBH4, % (w/v)
Abs
orba
nce
Figure 3.17 Effect of NaBH4 concentration on the analytical signal of Cd obtained
from CF-W-trap system. The signals were obtained by collecting 0.7 mL of 5
ng/mL Cd, a total of 3.5 ng Cd.
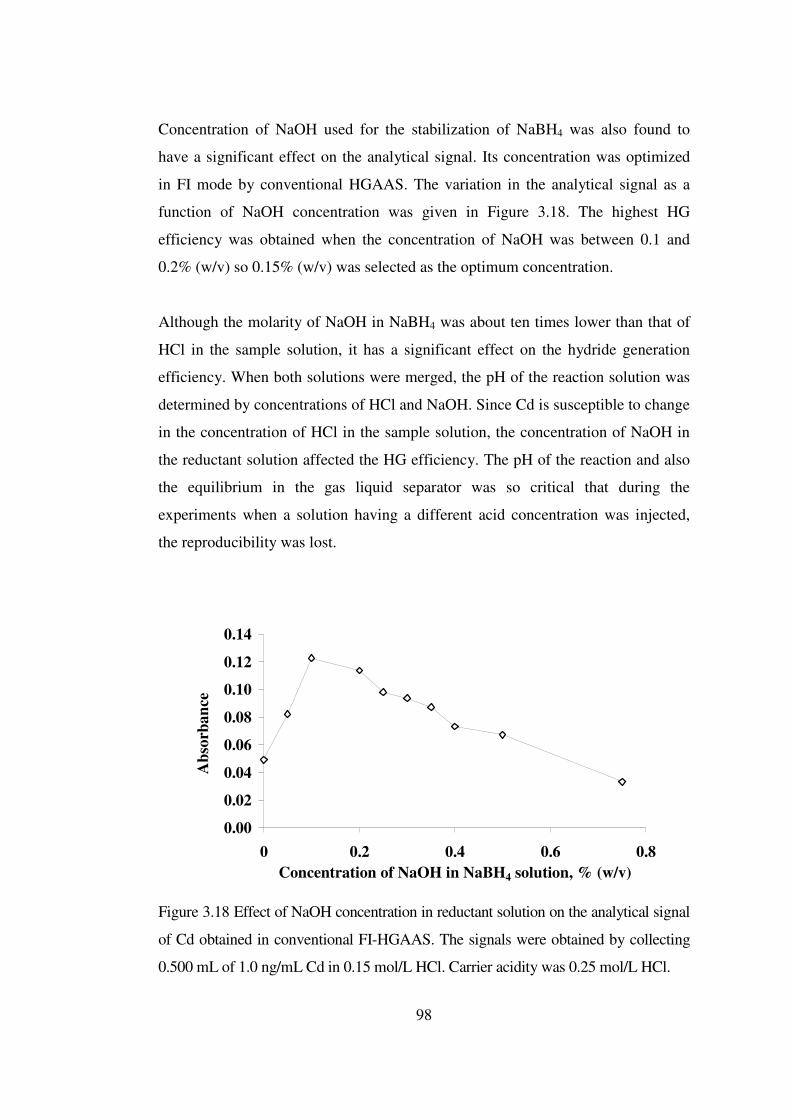
98
Concentration of NaOH used for the stabilization of NaBH4 was also found to
have a significant effect on the analytical signal. Its concentration was optimized
in FI mode by conventional HGAAS. The variation in the analytical signal as a
function of NaOH concentration was given in Figure 3.18. The highest HG
efficiency was obtained when the concentration of NaOH was between 0.1 and
0.2% (w/v) so 0.15% (w/v) was selected as the optimum concentration.
Although the molarity of NaOH in NaBH4 was about ten times lower than that of
HCl in the sample solution, it has a significant effect on the hydride generation
efficiency. When both solutions were merged, the pH of the reaction solution was
determined by concentrations of HCl and NaOH. Since Cd is susceptible to change
in the concentration of HCl in the sample solution, the concentration of NaOH in
the reductant solution affected the HG efficiency. The pH of the reaction and also
the equilibrium in the gas liquid separator was so critical that during the
experiments when a solution having a different acid concentration was injected,
the reproducibility was lost.
0.00
0.02
0.04
0.06
0.08
0.10
0.12
0.14
0 0.2 0.4 0.6 0.8Concentration of NaOH in NaBH4 solution, % (w/v)
Abs
orba
nce
Figure 3.18 Effect of NaOH concentration in reductant solution on the analytical signal
of Cd obtained in conventional FI-HGAAS. The signals were obtained by collecting
0.500 mL of 1.0 ng/mL Cd in 0.15 mol/L HCl. Carrier acidity was 0.25 mol/L HCl.

99
3.6.2.4 Reaction and Stripping Coil Lengths
These two parameters were found to be so dependent on each other that even one
could be even eliminated by increasing the length of the other. The experiments
were carried out in both conventional FI mode, and W-trap HGAAS in CF mode.
The optimization plots for reaction and stripping coils were given in Figure 3.19.
The optimum reaction coil length was found to be 60 cm when a 15 cm stripping
coil was used. Although shorter stripping coil seems to be predominating, the
minimum length of stripping coil was 15 cm due to the physical limitations.
However, when no reaction coil was used, a length of 120 cm for stripping coil
was found to give the same sensitivity with that was obtained by optimum length
of reaction and stripping coils. Therefore, the experiments were carried out by
employing either a 60 cm reaction coil and a 15 cm stripping coil or no reaction
coil and a 120 cm stripping coil; sample, reductant and carrier gas were merged in
a 4-way PTFE connector and the generated to GLS through stripping coil.
0.00
0.10
0.20
0.30
0.40
0.50
0 50 100 150 200 250 300 350Coil length, cm
Abs
orba
nce
Reaction Stripping
Figure 3.19 Effects of reaction and stripping coil lengths on the analytical signal of Cd
obtained in conventional FI-HGAAS. Lengths of reaction and stripping coils were 60
and 15 cm, respectively, as the other parameter was varied. The signals were obtained
using 0.100 mL of 5.0 ng/mL Cd in 0.15 mol/L HCl. Carrier was 0.25 mol/L HCl.

100
3.6.2.5 Reaction Temperature
The effect of reaction temperature on VG of Cd was investigated by using both
conventional HGAAS and W-trap system. In order to increase the temperature of
reaction coil, it was inserted into a water bath and the temperature was varied by
heating water on a hot plate or addition of ice into the bath. Therefore, the effect of
temperature was investigated between 0 ˚C and 98 ˚C. The plots of reaction coil
temperature versus analytical signals of both peak height and peak area obtained
from W-trap system are given in Figure 3.20. It was observed that when the
temperature of the coil increased, the VG or separation efficiency increased. In the
literature there are contradictory statements. Cacho et al. [27] stated the HG
efficiency increased with an increase in reaction temperature. However, Sanz-
Medel et al. [7] reported that the temperature of reaction has an inverse effect on
hydride generation; the lower the temperature, the higher the analytical signal was.
The latter group used a cooled system for efficient vapor generation of volatile Cd
species. Here, a linear correlation was found between the temperature and the
hydride generation efficiency. The analytical signal obtained at 98 ˚C was about
three times higher than that obtained at 25 ˚C for W-coil HGAAS. Such an
increase was also verified by conventional HGAAS in CF mode; the same increase
was obtained when the reaction coil was heated. Since the vaporization of water
increased at elevated temperatures of reaction solution, the condensation of water
on the inner surfaces of GLS, transfer tubings and unheated QTA was increased
when the reaction coil temperature was increased. In order to remove the
condensed water, the inner surfaces were dried between injections by allowing a
flow of Ar at a flow rate of 1 L/min. Although the signal could be increased by
increasing the reaction temperature, the experiments were carried out at room
temperature, because application is easier since no heating was required.
Furthermore, the analysis time was increased due to drying step needed between
runs.

101
0
0.1
0.2
0.3
0.4
0.5
0.6
0.7
0.8
0 20 40 60 80 100Reaction coil temperature, oC
Ana
lytic
al si
gnal
, A o
r A
.sPeak Height Peak Area
Figure 3.20 Effect of reaction coil temperature on the analytical signal of Cd
obtained in CF-W-trap-HGAAS. The signals were obtained by collecting 0.7 mL
of 5.0 ng/mL Cd in 0.2 mol/L HCl.
3.6.3 Optimization of Trapping Conditions
3.6.3.1 Placement of W-coil Trap
Since the QTA was not heated by flame and used at room temperature, it was
possible to place W-coil as close as possible to the junction point of inlet arm and
the horizontal arm. The distance between the trap and the measurement cell was 1
cm which was the minimum attainable distance. The volatile species generated by
the HG reaction was trapped on the W-coil and then released as Cd atoms since
there was no need to use atomizer as in the cases of Bi and Pb. Therefore, in these
studies the W-coil trap was used for both vaporization and atomization of Cd
species trapped.

102
3.6.3.2 Collection and Revolatilization Temperatures
The atomic species of Cd was trapped on the surface of W-coil at relatively lower
temperatures when compared to Bi and Pb. The variations in the analytical signal
as a function of trapping and releasing temperatures were given in Figure 3.21.
The collection temperature range for Cd was relatively wider than that for Bi or
Pb. The optimum temperature for collection was found to be between 100 ˚C and
160 ˚C. Temperatures higher than 190 ˚C resulted in a decrease in the signal due to
the partial release of trapped species. The trapped species could be revolatilized
from the surface at 300 ˚C completely but the rate of revolatilization was slow.
Use of a release temperature less than 750 ˚C resulted in less reproducible peak
heights of analytical signals. A temperature of 1000 ˚C was used for rapid
volatilization that provided more reproducible peak heights.
0.00
0.05
0.10
0.15
0.20
0.25
0.30
0.35
0 200 400 600 800 1000 1200Temperature of W-coil, oC
Abs
orba
nce
Collection Release
Figure 3.21 The effect of collection and release temperatures on analytical signal
for Cd. During the variations of collection and release temperatures, a constant
release temperature of 1000 ˚C and a constant collection temperature of 150 ˚C,
respectively, were employed. The signals were obtained by collecting 0.7 mL of
5.0 ng/mL Cd in 0.2 mol/L HCl.
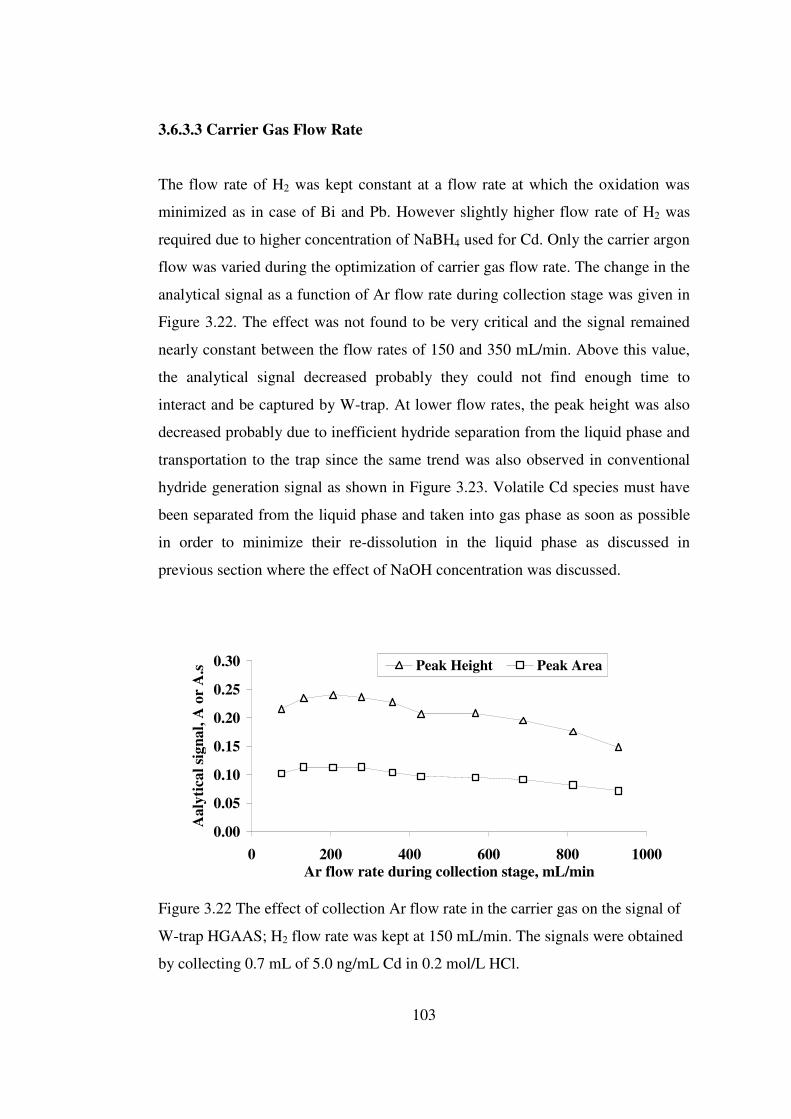
103
3.6.3.3 Carrier Gas Flow Rate
The flow rate of H2 was kept constant at a flow rate at which the oxidation was
minimized as in case of Bi and Pb. However slightly higher flow rate of H2 was
required due to higher concentration of NaBH4 used for Cd. Only the carrier argon
flow was varied during the optimization of carrier gas flow rate. The change in the
analytical signal as a function of Ar flow rate during collection stage was given in
Figure 3.22. The effect was not found to be very critical and the signal remained
nearly constant between the flow rates of 150 and 350 mL/min. Above this value,
the analytical signal decreased probably they could not find enough time to
interact and be captured by W-trap. At lower flow rates, the peak height was also
decreased probably due to inefficient hydride separation from the liquid phase and
transportation to the trap since the same trend was also observed in conventional
hydride generation signal as shown in Figure 3.23. Volatile Cd species must have
been separated from the liquid phase and taken into gas phase as soon as possible
in order to minimize their re-dissolution in the liquid phase as discussed in
previous section where the effect of NaOH concentration was discussed.
0.00
0.05
0.10
0.15
0.20
0.25
0.30
0 200 400 600 800 1000Ar flow rate during collection stage, mL/min
Aal
ytic
al si
gnal
, A o
r A
.s Peak Height Peak Area
Figure 3.22 The effect of collection Ar flow rate in the carrier gas on the signal of
W-trap HGAAS; H2 flow rate was kept at 150 mL/min. The signals were obtained
by collecting 0.7 mL of 5.0 ng/mL Cd in 0.2 mol/L HCl.

104
0.00
0.10
0.20
0.30
0 200 400 600 800 1000 1200
Ar flow rate, mL/min
Abs
orba
nce
Figure 3.23 Effect of carrier Ar flow rate on the peak height of analytical signal of
Cd in conventional FI-HGAAS. The signals were obtained using 0.100 mL of 5.0
ng/mL Cd in 0.15 mol/L HCl. Carrier acidity was 0.25 mol/L HCl.
The effect of Ar flow rate during release stage was not found to be critical for Cd
and the relevant graph was given in Figure 3.24. The peak height of analytical
signal remained almost constant over a wide range of Ar flow rates between 150
and 800 mL/min. This indicates fast revolatilization of Cd atoms from W-trap at
1000 ˚C. However, the peak area decreased at high Ar flow rates because of short
residence time of the atom plug in the QTA. If peak area values are to be used in
the experiments, the carrier gas flow rate should be selected less that 200 mL/min.
Since peak height values were used, a flow of 270 mL/min was selected as carrier
flow rate during both collection and release stages. Therefore similar to Pb, the
carrier gas flow rates was the same for both collection and release stages.

105
0.00
0.05
0.10
0.15
0.20
0.25
0 200 400 600 800 1000
Ar Flow rate during release stage, mL/min
Ana
lytic
al si
gnal
, A o
r A
.s
Peak Height Peak Area
Figure 3.24 The effect of argon flow rate in the carrier gas on the trapping
efficiency during collection; H2 flow rate was kept at 150 mL/min. The signals
were obtained by collecting 0.7 mL of 5.0 ng/mL Cd in 0.2 mol/L HCl.
The effect of H2 on the collection and release processes was also investigated by
changing only the H2 flow rate. In these experiments no reaction coil was used and
a 120 cm stripping coil was employed. Hydrogen was introduced at a point
between GLS and W-coil; it was not involved in the analyte stripping off the
solution. No significant effect of H2 during collection and release stages were
observed.
3.6.3.4 Coating with Pt and Ir
When the W-trap was coated either by Ir or Pt, the collection efficiency did not
improve. However, the trapping temperature range extended to lower
temperatures: the Cd species trapped efficiently at even room temperature when

106
the coil was coated with 100 µg of Ir. The highest limit of optimum collecting
temperature did not improve and above a collection temperature of 190 ˚C the
analytical signal decreased which meant that Ir did not stabilize Cd species at
higher temperatures but increased trapping efficiency at lower temperatures. When
W-coil was coated with Pt, the stabilization effect was not significant as for Ir.
Iridium as a coating material showed higher stabilization effect at lower
temperatures. However, use of these coating materials increased the
revolatilization temperatures to above 1300 ˚C and 1500 ˚C, for Pt and Ir,
respectively.
3.6.3.5 Distance between Tip of Transport Capillary and W-trap
Use of PTFE tubing (0.8 mm i.d.) for the transportation of volatile species of Cd to
the W-trap allowed to be inserted into inlet arm of quartz T-tube. Therefore, the
interaction of Cd species with the inlet arm of quartz T-tube atomizer was
minimized. This configuration prevented the possible losses of Cd species on the
surface of inlet arm before being collected by W-trap. Since the outer diameter of
capillary by which the volatile species were transported to W-trap was smaller
than the inner diameter of inlet arm, the capillary was directed into the center of
W-coil by using a cladding formed by PTFE tape so that it was fixed at the center
of inlet arm. The effect of this distance on the analytical signal was shown in
Figure 3.25. It was observed that as the distance between tip of capillary and the
W-trap increased, the analytical signal decreased probably due to loss of analyte
species on the inner surface of inlet arm. The trapping efficiency was at maximum
when the distance was 0.5 cm; shorter distances resulted in degradation of tip
made of PTFE since this part was heated to high temperatures at the releasing
stage. Therefore during the experiments the distance was kept at its optimum
value. When it was varied between release and collection stages, the
reproducibility became poorer.

107
0.00
0.05
0.10
0.15
0.20
0.25
0.30
0.35
0.40
0 1 2 3 4 5Distance between capillary tip and W-trap, cm
Ana
lytic
al si
gnal
, A o
r A
.sPeak Height Peak Area
Figure 3.25 Effect of distance between capillary tip and the W-trap on analytical
signal. The signals were obtained by collecting 0.7 mL of 5.0 ng/mL Cd in 0.2
mol/L HCl. Collection and release temperatures were 150 ˚C and 1000 ˚C,
respectively.
3.6.3.6 Stability of Collected Species on the W-Trap
In order to investigate the stability of collected species on the W-coil, the trapped
species were released after a period of time. The effect of this time interval
between end of the collection step and release step on the analytical signal was
given in Figure 3.26. It can be concluded from the figure that the trapped species
were stable for at least 12 min. During this period of time, the W-coil was kept at
room temperature and the carrier gas passed through the trap. A slight increase
was observed when the collected species were released after waiting for a period
of 60 seconds. During collection, the inlet arm between W-coil and horizontal arm
was heated slightly by the trap and this might decrease the signal by trapping
released Cd atoms on quartz surface. When the revolatilization was done

108
immediately after the collection, signal is reduced. However, this decrease was not
significant and the analysis time was increased if a cooling period was used.
Therefore no such cooling period was applied during the experiments.
0.00
0.05
0.10
0.15
0.20
0.25
0.30
0.35
0.40
0 200 400 600 800 1000
Time between collection and release stages, s
Ana
lytic
al si
gnal
, A o
r A
.s
Peak Height Peak Area
Figure 3.26 Effect of time between collection and release stage on the trap signal
of Cd. The signals were obtained by collecting 0.7 mL of 5.0 ng/mL Cd in 0.2
mol/L HCl. Collection and release temperatures were 150 ˚C and 1000 ˚C,
respectively.
3.6.3.7 Effect of Cooling Time after Releasing Stage
One of the main advantages of W-coil used in the ETAAS systems is its fast
cooling rate after each atomization or vaporization cycle. The flow of purge gas
was sufficiently high for effective cooling. The length of cooling period after each
releasing stage was investigated to observe whether there was a need for cooling
between runs or there was a need for activation of W-coil before each collection
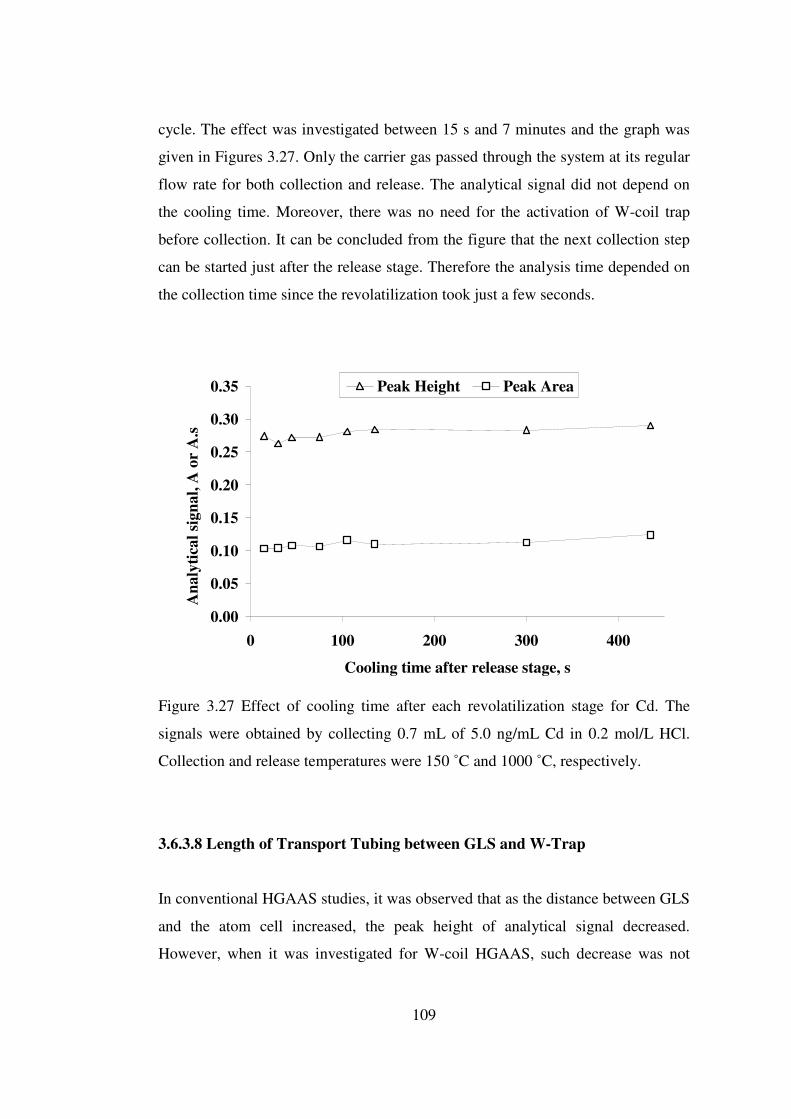
109
cycle. The effect was investigated between 15 s and 7 minutes and the graph was
given in Figures 3.27. Only the carrier gas passed through the system at its regular
flow rate for both collection and release. The analytical signal did not depend on
the cooling time. Moreover, there was no need for the activation of W-coil trap
before collection. It can be concluded from the figure that the next collection step
can be started just after the release stage. Therefore the analysis time depended on
the collection time since the revolatilization took just a few seconds.
0.00
0.05
0.10
0.15
0.20
0.25
0.30
0.35
0 100 200 300 400
Cooling time after release stage, s
Ana
lytic
al si
gnal
, A o
r A
.s
Peak Height Peak Area
Figure 3.27 Effect of cooling time after each revolatilization stage for Cd. The
signals were obtained by collecting 0.7 mL of 5.0 ng/mL Cd in 0.2 mol/L HCl.
Collection and release temperatures were 150 ˚C and 1000 ˚C, respectively.
3.6.3.8 Length of Transport Tubing between GLS and W-Trap
In conventional HGAAS studies, it was observed that as the distance between GLS
and the atom cell increased, the peak height of analytical signal decreased.
However, when it was investigated for W-coil HGAAS, such decrease was not

110
observed. The variations in the analytical signal for peak height and peak area
measurements are given in Figure 3.28. The generated Cd species by the reaction
with tetrahydroborate could be transported at a distance of at least 70 cm without
any significant decrease in the analytical signal by W-coil HGAAS. Thus, the
decrease in the peak height of analytical signal obtained by conventional FI-
HGAAS (no trap) can be explained by dilution of analyte species but not the loss
on the surfaces. But it must be noted that the analyte species were transported
through the PTFE tubing (0.8 mm i.d.). If it were transported through a glass
tubing, loss on the surfaces was expected; when the distance between capillary tip
and W-coil was increased the analytical signal decreased since analyte species
came in contact with quartz surface.
0.00
0.05
0.10
0.15
0.20
0.25
0.30
0.35
0 20 40 60 80Length of transport tubing between GLS and W-trap, cm
Ana
lytic
al si
gnal
, A o
r A
.s
Peak Height Peak Area
Figure 3.28 The effect of length of PTFE transport tubing between GLS and W-
trap. The signals were obtained by collecting 0.7 mL of 5.0 ng/mL Cd in 0.2 mol/L
HCl. Collection and release temperatures were 150 ˚C and 1000 ˚C, respectively.

111
3.6.3.9 Distance between W-Trap and Atomizer
The length of transfer tubing between the trap and the atom cell was varied
between 10 cm and 110 cm and the analytical signal was recorded. The variation
in the analytical signal as a function of distance was given in Figure 3.29. Both
peak height and peak area of the analytical signal decreased by 70% when the
distance was increased to 50 cm and remained nearly the same up to 110 cm when
tygon tubing (3.1 mm i.d.) was used for transportation of released species from the
trap. However, if tygon was replaced with a PTFE tubing (4.0 mm i.d.), decrease
in the peak area of analytical signal was only 20% at a distance of 110 cm.
Although the inner diameters were different for an exact comparison, the tubing
with a larger inner diameter was prone to adsorb more than that with a smaller
diameter. Therefore, it was clear that Cd atoms were lost on the inner surface of
tygon tubing. In order to investigate further, the transfer tubing was replaced with
FEP coated tygon tubing with larger inner diameter (6 mm i.d.). In the case of FEP
coated tygon tubing the decrease was 30% at 110 cm. Therefore, the Cd species
could be transported to long distances but a significant decrease was observed in
both peak height and peak area of the analytical signal, especially when a tygon
tubing was used. The decrease was less in case of PTFE. For Bi and Pb the
decrease in the peak height was more pronounced than that in peak area. However
in case of Cd, both in peak area and the peak height decreased together. This may
be attributed to the atomic nature of Cd species released from the surface of W-
coil.

112
0.0
0.2
0.4
0.6
0.8
1.0
0 20 40 60 80 100Length of transport tubing
between W-trap and quartz T-tube, cm
Nor
mai
lzed
sign
al
Tygon (A) Tygon (A.s) PTFE (A) PTFE (A.s)
Figure 3.29 The effect of distance between the trap and atomizer on the
normalized peak height and peak area signals of Cd.
3.6.4 Relation between Collection Volume and Analytical Signal
The relationship between the collection volume and the analytical signal for both
peak height and peak area of analytical signal is given in Figure 3.30. The figure
was drawn by injecting 0.5 ng/mL Cd solution in CF mode under optimum
conditions with a sample flow rate of 2.1 mL/min. Therefore, it took 2 minutes to
collect 4.2 mL sample. The figure shows that both peak area and peak height of the
analytical signal was highly correlated with the collection volume up to 4.2 mL
with high correlation coefficients. Above this volume a slight negative deviation
from the linearity was observed. The analytical signal increased significantly but it
was less than expected.. A volume of 6 mL can be selected as the sampling volume
for further increments in the concentration sensitivity and the detection power of
the method. As mentioned before, the selection of collection volume depends on
the desired analytical figures of merit. Reagent blank values were not seemed to be
significant up to a collection volume of 6.3 mL. Therefore a volume of 4.2 mL can
be selected without any reagent blank problems.

113
y = 0.089x + 0.022R2 = 0.996
y = 0.031x + 0.009R2 = 0.996
0.00
0.10
0.20
0.30
0.40
0 1 2 3 4 5
Collection volume, mL
Ana
lytic
al si
gnal
, A o
r A
.s
Peak Height Peak Area
Figure 3.30 Relationship between the collection volume and the analytical signal
for both peak area and peak height using 0.50 ng/mL Cd solution under optimized
conditions; the flow rate was 2.1 mL/min for both sample and the reductant.
3.6.5 Analytical Signal and Reproducibility
The analytical signal obtained by injection of 4.2 mL of 0.025 ng/mL Cd was
given in Figure 3.31. The reproducibility of the measurements was 5.4% RSD for
2 min collection of 0.025 ng/mL Cd solution and better at higher concentrations
when the peak height was used. The use of peak area resulted in higher %RSD
values (10-15% at this concentration level) as the integrated absorbance values
were numerically small due to sharp transient signals as discussed earlier for Bi.
Moreover, slight drift in the baseline was also responsible for such poor
reproducibility value. The full width at half maximum of analytical signal was
around 0.4 s. Although 2.0 s was selected as the integration time, the peak area of

114
the analytical signal was affected by the lamp noise which resulted in poorer
reproducibility.
Figure 3.31 The analytical signals for 4.2 mL of 0.025 ng/mL Cd in 0.2 mol/L
HCl. Collection at 150 ˚C and releasing at 1000 ˚C. 1.5% (w/v) NaBH4 was used.
Aging of W-coil resulted in an increase in the collection efficiency; the efficiency
was found to increase by 20-30% after 600-800 runs when compared to that
obtained by new coil. This may be explained by the change of surface
characteristics such as porosity. As the surface becomes more porous, the surface
area increases and collection efficiency increases.
3.6.6 Calibration Plot
The calibration plot for 2 min collection time which corresponds to a collection
volume of 4.2 mL was given in Figure 3.32. Both peak area and peak height of the

115
analytical signal were found to be linear between the concentrations of 0.025
ng/mL and 0.350 ng/mL. Above this concentration a negative deviation from the
linearity was observed. Therefore for 4.2 mL collection volume (2 minutes
collection) dynamic range of the calibration graph is between 0.025 and 0.35
ng/mL which is slightly larger than one order of magnitude which is the generally
encountered range in HGAAS studies.
y = 1.271x + 0.018R2 = 0.992
y = 0.654x + 0.003R2 = 0.999
0.000.050.100.150.200.250.300.350.400.450.50
0 0.1 0.2 0.3 0.4
Cd concentration, ng/mL
Ana
lytic
al si
gnal
, A o
r A
.s
Peak Height Peak Area
Figure 3.32 The calibration plot of Cd for both peak height and peak area of the
analytical signal obtained by W-coil HGAAS. The collection volume was 4.2 mL
and aqueous standard solutions were employed; the flow rate was 2.1 mL/min for
both sample and reductant.

116
3.6.7 The Analytical Figures of Merit
The analytical figures of merit of the method for Cd are given in Table 3.4; peak
height was used in the calculations. The enhancement factor in limit of detection
(3σ) which was calculated by using 0.025 ng/mL was found to be 25 for 4.2 mL
collection volume when compared to conventional FI-HGAAS where the injection
volume was 0.100 mL and the concentration of Cd was 0.5 ng/mL. The
characteristic concentration for 4.2 mL sample volume was calculated as 0.003
ng/mL for peak height which was 31 times lower as compared to conventional FI-
HGAAS. When peak area was used the analytical figures was not better than those
with the peak height values due to very sharp transient nature of analytical signal.
The limit of detection of the developed method was compared with the literature
values in Table 3.5. As seen on the table, the concentration limit of detection value
was comparable with the others or better. Although absolute limit of detection of
MS system is very low, they are cost prohibitive and not available in most
laboratories. Furthermore, the concentration limit of detection was better in our
system. The main advantage of W-coil HGAAS is that it can be applied in all
laboratories having a simple AAS instrument. When the Cd concentration is in the
mid ng/L range, approximately 1-2 minutes are enough for both collection and the
measurement of analytical signal. If the concentration is in the low ng/L range, 3-4
minutes are enough for both collection and measurement of analytical signal. A
memory effect was observed but it was not cumulative. It was probably arising
from the Cd species condensed on the inner walls of GLS as well as the transfer
tubings. If blank was injected after a higher concentration of Cd, always a
significant signal appeared from blank. If the walls were dried, the memory effect
was more. However, the memory signal disappeared after consecutive injections of
blank solution. Drying between injections reduced the number of blank injection
required to eliminate memory effects.
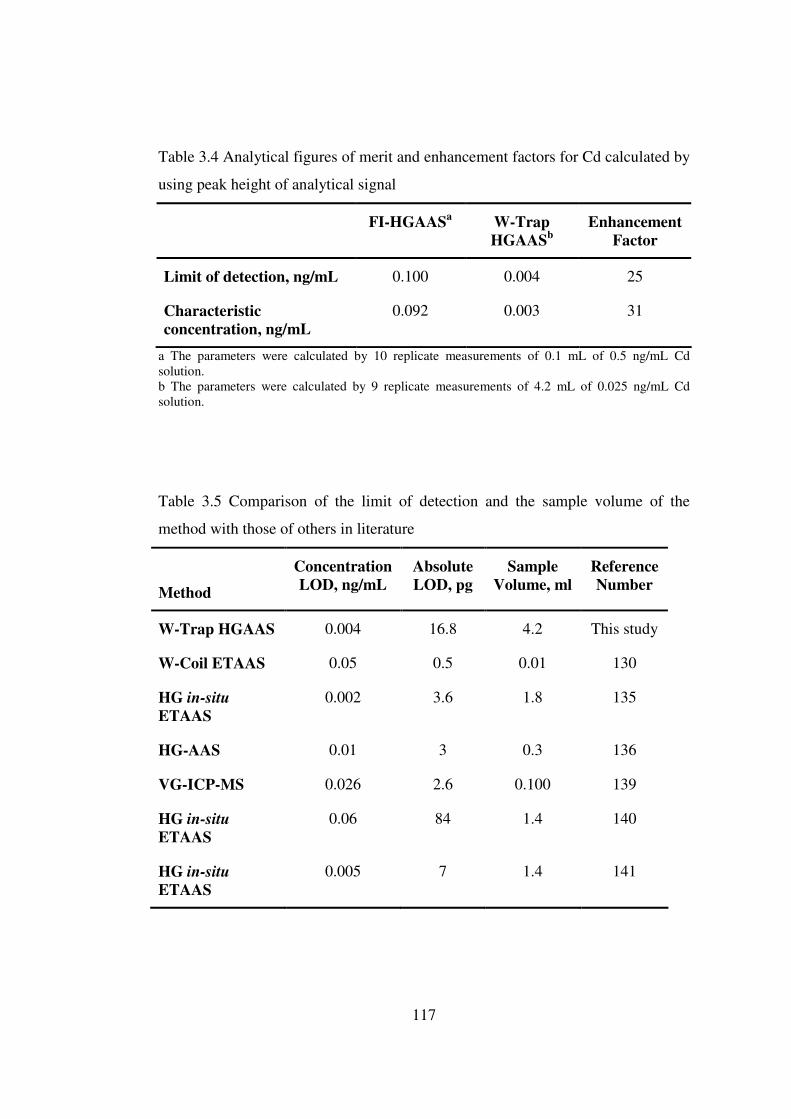
117
Table 3.4 Analytical figures of merit and enhancement factors for Cd calculated by
using peak height of analytical signal
FI-HGAASa W-Trap HGAASb
Enhancement Factor
Limit of detection, ng/mL 0.100 0.004 25
Characteristic concentration, ng/mL
0.092 0.003 31
a The parameters were calculated by 10 replicate measurements of 0.1 mL of 0.5 ng/mL Cd solution. b The parameters were calculated by 9 replicate measurements of 4.2 mL of 0.025 ng/mL Cd solution.
Table 3.5 Comparison of the limit of detection and the sample volume of the
method with those of others in literature
Method
Concentration LOD, ng/mL
Absolute LOD, pg
Sample Volume, ml
Reference Number
W-Trap HGAAS 0.004 16.8 4.2 This study
W-Coil ETAAS 0.05 0.5 0.01 130
HG in-situ ETAAS
0.002 3.6 1.8 135
HG-AAS 0.01 3 0.3 136
VG-ICP-MS 0.026 2.6 0.100 139
HG in-situ ETAAS
0.06 84 1.4 140
HG in-situ ETAAS
0.005 7 1.4 141

118
3.6.8 Accuracy of the Method
The accuracy of the method was tested using certified reference materials Oyster
Tissue, Tomato Leaves and Sea Water. The certified values and the found values
are given in Table 3.6. As indicated on the table, all three SRM results were found
to be in good agreement with the certified values. In the analysis of tomato leave
SRM, although the digested solutions were further diluted 100 times with 0.20
mol/L HCl, standard addition method was required due to significant matrix
interferences. In the determination of Sea Water SRM, the sample was acidified
with HCl and direct calibration method was employed. When analyzing Oyster
tissue, if the samples were diluted 25 times with 0.2 mol/L HCl, the matrix
interferences were significant and the use of direct calibration did not gave
satisfactory results. However, when digested solutions were further diluted 250
times, matrix interference was eliminated and the direct calibration gave
satisfactory results.
Table 3.6 Results of the analysis of standard reference materials and their certified
values (n=3 for each measurement)
SRM Found value Certified value
Oyster Tissuea, µg/g 2.34 ± 0.21 2.48 ± 0.08
Tomato Leavesb, µg/g 1.54 ± 0.09 1.52 ± 0.04
Sea Waterc, nmol/L 0.165 ± 0.007 0.175 ± 0.018
a 0.25 g sample was digested in microwave oven and diluted to 50 mL with deionized water. Then the solutions were further diluted 250 times with 0.2 mol/L HCl and direct calibration method was employed b 0.25 g sample was digested in microwave oven and diluted to 50 mL with deionized water. Then the solutions were further diluted 25 times with 0.2 mol/L HCl and standard addition method was employed c Analyzed directly after the solutions were made 0.2 mol/L in HCl. Direct calibration method was employed.

119
3.7 Lead
3.7.1 Optimization of Hydride Generation Parameters
For the generation of plumbane, the samples were prepared in HCl and reacted
with NaBH4. The flow rate of solutions was 6 mL/min. For phase separation a U-
type gas liquid separator was utilized. The length of reaction coil was not found to
be very critical and the signal remained nearly constant between 15 and 60 cm.
Thus a 30 cm PTFE tubing (0.8 mm i.d.) was used as reaction coil throughout the
experiments. No stripping coil was used. The carrier argon was introduced at the
entrance of GLS. No signal could be achieved when Pb solutions were prepared in
HCl without any oxidizing agent. In order to increase hydride generation
efficiency, potassium hexacyanoferrate(III) was used.
3.7.1.1 Concentrations of HCl and NaBH4
Optimum concentrations of HCl and NaBH4 were determined by conventional FI-
HGAAS (without W-coil trap) using U-type gas liquid separator. The effect of
concentration of HCl on the analytical signal was given in Figure 3.33. As it was
seen from the figure, HCl concentrations less than 0.03 mol/L and higher than 0.12
mol/L resulted in a decrease in the analytical signal. Between these values, the
signal remained nearly the same. Thus 0.06 mol/L was selected as the optimum
concentration of HCl in sample solution for hydride generation medium.

120
0.00
0.05
0.10
0.15
0.20
0.25
0 0.1 0.2 0.3 0.4 0.5 0.6 0.7
Concentration of HCl in sample solution, mol/L
Abs
orba
nce
Figure 3.33 Effect of sample acidity on Pb signal in conventional FI-HGAAS. The
signals were obtained using 0.500 mL of 10.0 ng/mL Pb in 0.5% (w/v) K3Fe(CN)6.
NaBH4 concentration was 1.0% (w/v).
Optimum NaBH4 concentration was also determined under the same conditions
and the optimization graph was given in Figure 3.34. The reductant solutions were
prepared daily in 0.1% (w/v) NaOH for the stabilization. A NaBH4 concentration
less than 0.5% (w/v) was not found to be adequate for efficient plumbane
generation. A slight increase in the analytical signal was observed when the
concentration of NaBH4 was increased further, but this increase was not found to
be significant and also increased reagent consumption. Therefore, a concentration
of 1.0 % (w/v) NaBH4 was found to be optimum for plumbane generation.

121
0.00
0.05
0.10
0.15
0.20
0.25
0 0.5 1 1.5 2 2.5 3 3.5Concentration of NaBH4, % (m/v)
Abs
orba
nce
Figure 3.34 Effect of NaBH4 concentration on Pb signal in conventional FI-
HGAAS. The signals were obtained using 0.500 mL of 10.0 ng/mL Pb in 0.06
mol/L HCl and 0.5% (w/v) K3Fe(CN)6.
3.7.1.2 Concentration of Oxidizing Reagent in the Reaction Medium
The hydride generation efficiency for Pb in acidified sample solution was very low
unless an oxidant was added; even no signal could be observed. For the effective
generation of volatile species of lead by NaBH4 reduction, it was necessary to use
oxidizing reagents such as potassium hexacyanoferrate (III), hydrogen peroxide
etc. reported in the literature that was summarized in the introduction. In this
study, no signal was achieved from sample solutions prepared in only HCl at
optimum concentrations. In order to increase the generation efficiency, some
oxidants used in the literature were tested. These were H2O2, nitroso-R salt (1-
nitroso-2-naphthol-3,6-disulphonic acid disodium salt) and potassium
hexacyanoferrate(III) (K3Fe(CN)6. Use of H2O2 did not improve the analytical
signal and almost no signal was obtained under the optimized HCl and NaBH4

122
concentrations. The highest analytical signal was obtained when K3Fe(CN)6 was
used as the hydride generation medium. Tyson et al. [159] also found superior
sensitivity with K3Fe(CN)6 among some other oxidizing reagents tested.
The increase in the efficiency of plumbane generation, although not proven, is
attributed to the oxidizing effect of the reagent since the common properties of
reagents that increased efficiency are their oxidizing properties. Such increase in
the generation efficiency was explained by the formation of Pb(IV) ions in the
solution [5]. However the oxidizing power of K3Fe(CN)6 is lower than that of
H2O2; the latter did not improve the analytical signal. In addition, an organic
compound, PAN-S, does not have any oxidizing character and its effect can not be
accounted for the formation of Pb(IV). However, it was used for the generation of
plumbane in the literature [155]. Therefore the increase in the efficiency was
possibly the result of chelated Pb(II) which is kinetically more easily reduced by
NaBH4 than free Pb(II) [155].
The dependence of analytical signal on K3Fe(CN)6 concentration is given in Figure
3.35. Addition of K3Fe(CN)6 into the solution of analyte significantly increased the
analytical signal up to a concentration of 0.5% (w/v). Although the increase was
continued up to 2%, 0.5% (w/v) was selected as the working concentration
because the solid K3Fe(CN)6 contained significant amount of Pb as a contaminant
which was found to be the limiting factor in the trap experiments. An attempt was
made to synthesize it in the laboratory starting from solid KCN and FeCl3. The
analysis of the reactants by ETAAS showed that they were also contaminated with
significant amounts of Pb, so the synthesis was not further pursued.

123
0.00
0.05
0.10
0.15
0.20
0.25
0 0.5 1 1.5 2 2.5
Concentration of K3Fe(CN)6, % (m/v)
Abs
orba
nce
Figure 3.35 Effect of concentration of K3Fe(CN)6 on analytical signal in
conventional FI-HGAAS. The signals were obtained using 0.500 mL of 10.0
ng/mL Pb in 0.06 mol/L HCl.
In addition to K3Fe(CN)6, nitroso-R salt was also found to increase hydride
generation efficiency but its effect was much less; the sensitivity was about 6 times
less. The change in the analytical signal as a function of nitroso-R salt
concentration was given in Figure 3.36. The analytical signal was increased
gradually and linearly up to a concentration of 1.5% (w/v). Above this
concentration, the linearity was lost and a plateau was reached. Although the
increase in the sensitivity was lower than that of K3Fe(CN)6, it was also considered
that if it has lower reagent blank values, then it could be used in trap studies
instead of K3Fe(CN)6. However, it was found that it also contained significant
amount of Pb as contaminant. Another problem with this reagent was that the
solubility in water was limited. The dissolution process was slow and even a 2%
(w/v) solution contained undissolved solid material.

124
0.000
0.005
0.010
0.015
0.020
0.025
0.030
0 0.5 1 1.5 2 2.5
Concentration of nitroso-R salt, % (m/v)
Abs
orba
nce
Figure 3.36 Effect of nitroso-R salt concentration on analytical signal in
conventional FI-HGAAS. The signals were obtained using 0.500 mL of 10.0
ng/mL Pb in 0.06 mol/L HCl.
3.7.2 Optimization of Trapping Conditions
3.7.2.1 Collection and Revolatilization Temperatures
Collection and release temperatures were optimized by considering the trap signal
at the end of collection. While one was being optimized, the other one was kept
constant at its optimum value. The optimization plot for trapping and releasing
temperatures are given in Figure 3.37. The optimum trapping temperature was
found to be 350 ˚C as measured at the center of coil; at higher temperatures the
collected species were lost and a decrease in the analytical signal was observed. A
temperature of 500-600 ˚C was enough for revolatilization of all of trapped Pb

125
species from the surface but the revolatilization was rather slow and the signals
were broad. The peak height of analytical signal increased linearly up to a release
temperature of 1200 ˚C and reached to a plateau. A temperature of 1300 ˚C was
necessary for rapid and reproducible volatilization of Pb species so that the use of
peak height in signals was justified. Above this temperature, no further
enhancement was observed in the peak height of analytical signal. Similar to Bi,
when higher temperatures were employed in the collection step, the surface of
quartz around the coil started to collect Pb species which are then observed as a
secondary peak next to the analytical peak at high release temperatures. At the
optimum trapping and release temperatures, there was only one analytical peak
observed and no signal was observed from quartz.
0.00
0.05
0.10
0.15
0.20
0.25
0.30
0.35
0 500 1000 1500 2000Temperature of W-coil, oC
Abs
orba
nce
Collection Release
Figure 3.37 The effect of collection and release temperatures on analytical signal
for 5.0 ng Pb. During the variations of collection and release temperatures, a
constant release temperature of 1300 ˚C and a constant collection temperature of
350 ˚C, respectively, were employed.

126
3.7.2.2 Carrier Gas Flow Rate
Since the trapping temperature of plumbane was slightly higher than that of Bi, a
higher hydrogen flow rate was required for the minimization of oxidation of W-
coil. The flow rate of H2 was kept constant at 100 mL/min; the lower H2 flow
rates caused the oxidation of W-coil and resulted in relatively higher background
absorption. The optimum collection and release Ar flow rates were investigated
independent from each other while keeping the H2 flow rate constant. The
optimization graphs for Ar flow rates during collection and revolatilization were
given in Figure 3.38 and 3.39, respectively. In contrast to Bi where collection
and release Ar flow rates were different from each other, the optimum collection
and release Ar flow rates were found to be almost the same for Pb. During
collection Ar flow rate was not very critical and the signal remained almost the
same between 100 and 400 mL/min, above which a decrease was observed in the
analytical signal. The effect of Ar flow rate during revolatilization was found to
be more important than that in collection step. Higher analytical signals were
obtained when the release Ar flow rate was kept at 210 mL/min. When it was
increased further the analytical signal decreased due to dilution of analyte by the
carrier gas. Therefore, the Ar flow rate for both collection and release steps was
found to be optimum at 210 mL/min; therefore it was not needed to vary the flow
rate between collection and release stages. The effect of H2 flow rate on the
collection and release was also investigated for Pb and no significant effect was
observed; a value of 100 mL/min has been applied for H2 flow rate in both
stages.
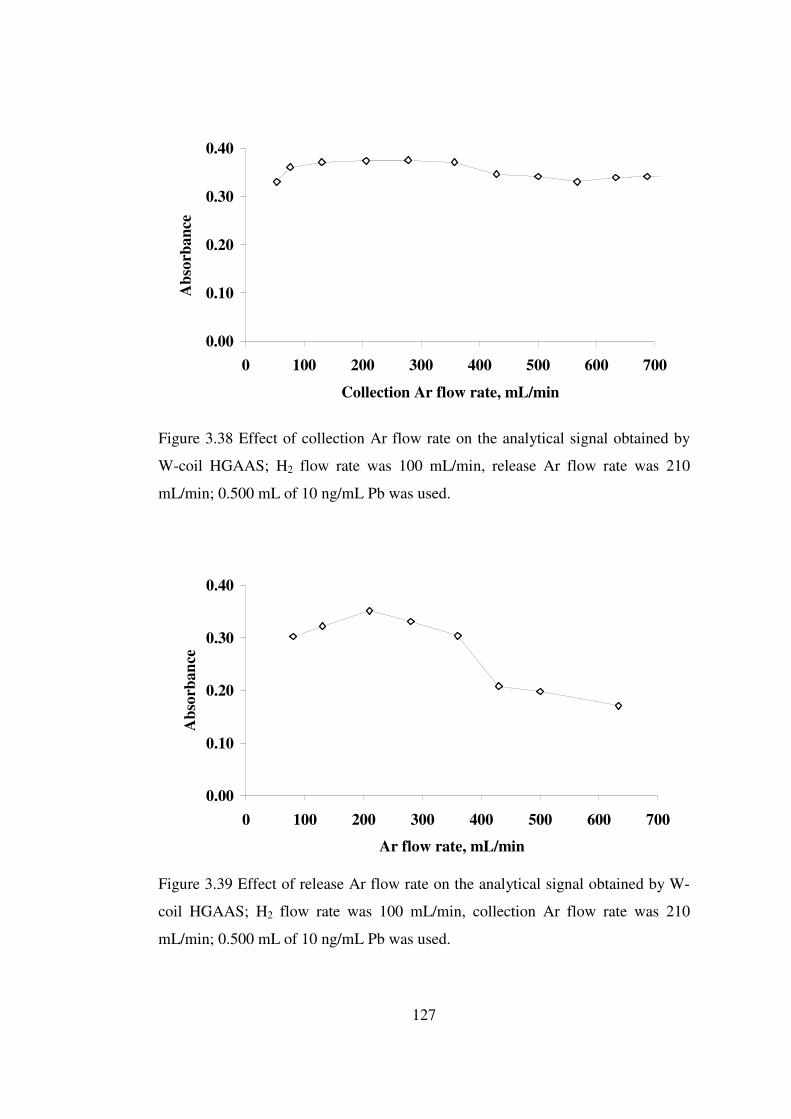
127
0.00
0.10
0.20
0.30
0.40
0 100 200 300 400 500 600 700
Collection Ar flow rate, mL/min
Abs
orba
nce
Figure 3.38 Effect of collection Ar flow rate on the analytical signal obtained by
W-coil HGAAS; H2 flow rate was 100 mL/min, release Ar flow rate was 210
mL/min; 0.500 mL of 10 ng/mL Pb was used.
0.00
0.10
0.20
0.30
0.40
0 100 200 300 400 500 600 700
Ar flow rate, mL/min
Abs
orba
nce
Figure 3.39 Effect of release Ar flow rate on the analytical signal obtained by W-
coil HGAAS; H2 flow rate was 100 mL/min, collection Ar flow rate was 210
mL/min; 0.500 mL of 10 ng/mL Pb was used.

128
3.7.2.3 Coating with Pd, Pt and Ir
In the collection stage there was significant breakthrough signal due to untrapped
plumbane. This was an indication of low trapping efficiency. In order to increase
the trapping efficiency, the surface of W-coil was coated with Ir, Pd and Pt which
were generally used for the stabilization of analyte species in ETAAS. These
elements have been widely used for in-situ trapping in graphite furnaces. It was
shown that, Pt was an efficient coating material for the in-situ preconcentration of
Se in W cuvette [82]. The coil was treated with 100 µg of each of these elements.
The coating was carried out by addition of 25 µl aliquots of 1000 mg/L stock
solution. The process was repeated 4 times by drying injected solution between
injections. At the end, the coil was heated to release temperature under H2
environment for the reduction of coated metal to its elemental form. In this study,
the coating materials were not investigated in detail and the amount of coating
material was not optimized.
Coating with Pd resulted in very irreproducible signals. It was observed that Pd
was not stable on the coil. The releasing required higher temperatures; as high as
1800 ˚C or more. The collection efficiency was not increased any more. Therefore
it did not provide any advantage.
When the coil was coated with Pt, a slight increase, approximately 20-40%, was
observed in the trapping efficiency. Furthermore, the range of optimum collection
temperature was improved. The temperature range of uncoated W-coil for efficient
collection was between 300 ˚C and 350 ˚C. By coating with Pt this range was
broadened and the W-coil was capable of trapping the volatile species of Pb in
between 200 ˚C and 500 ˚C. The analytical signals obtained from Pt coated W-coil
as a function of coil temperature is given in Figure 3.40.
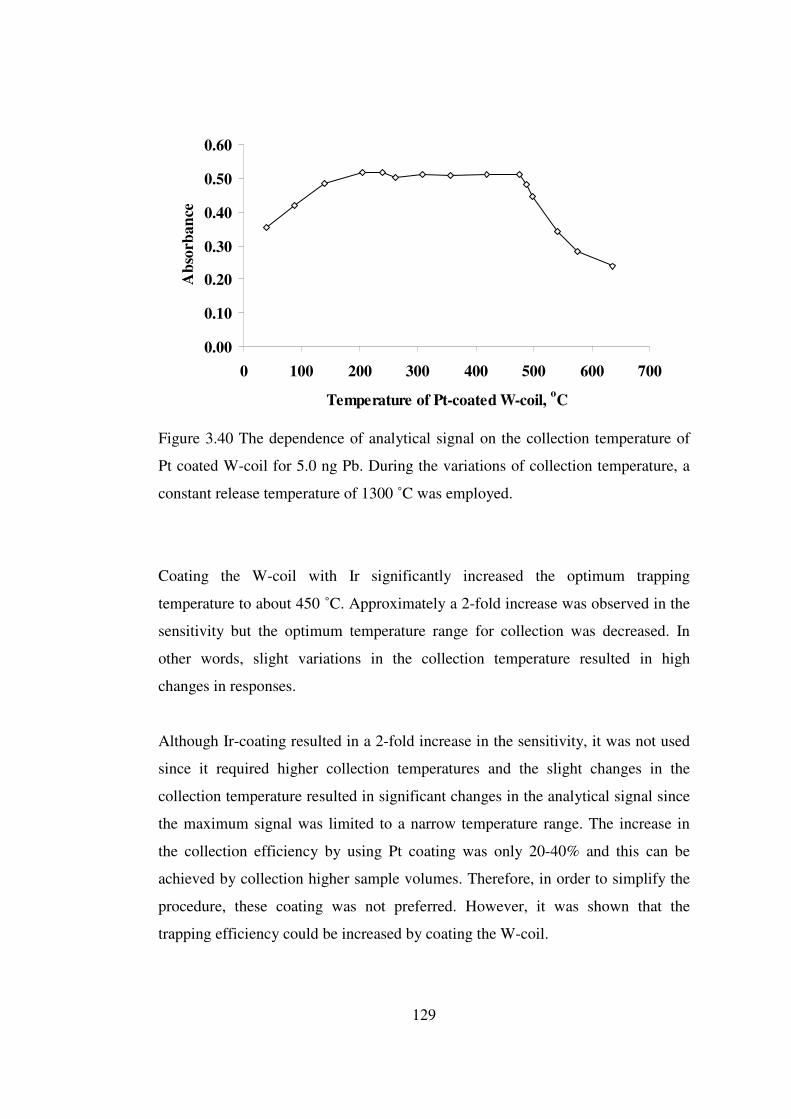
129
0.00
0.10
0.20
0.30
0.40
0.50
0.60
0 100 200 300 400 500 600 700
Temperature of Pt-coated W-coil, oC
Abs
orba
nce
Figure 3.40 The dependence of analytical signal on the collection temperature of
Pt coated W-coil for 5.0 ng Pb. During the variations of collection temperature, a
constant release temperature of 1300 ˚C was employed.
Coating the W-coil with Ir significantly increased the optimum trapping
temperature to about 450 ˚C. Approximately a 2-fold increase was observed in the
sensitivity but the optimum temperature range for collection was decreased. In
other words, slight variations in the collection temperature resulted in high
changes in responses.
Although Ir-coating resulted in a 2-fold increase in the sensitivity, it was not used
since it required higher collection temperatures and the slight changes in the
collection temperature resulted in significant changes in the analytical signal since
the maximum signal was limited to a narrow temperature range. The increase in
the collection efficiency by using Pt coating was only 20-40% and this can be
achieved by collection higher sample volumes. Therefore, in order to simplify the
procedure, these coating was not preferred. However, it was shown that the
trapping efficiency could be increased by coating the W-coil.

130
3.7.2.4 Distance between W-Trap and Atomizer
The length of transfer tubing between the trap and atomizer was varied between 10
cm and 45 cm and the analytical signal was observed. The change in the analytical
signal as a function of the distance was given in Figure 3.41. When the length of
tygon transport tubing used for the transportation of revolatilized species was
increased form 10 cm to 45 cm, the full width at half maximum of the analytical
signal was increased and peak height signal was decreased by 43%. If the peak
area was considered, the decrease in the analytical signal was not found to be
significant indicating significant peak broadening. The decrease in the peak height
of analytical signal was mostly due to dilution of volatile analyte species during
the transportation since the peak height was much more affected than peak area.
Since the volatilized species were transported to a distance of about half a meter,
they were probably molecular or converted to molecular species just after their
revolatilization. The fact that no signal could be obtained by the revolatilized
species when sent to unheated QTA supports this idea.
0.00
0.05
0.10
0.15
0.20
0.25
0.30
0.35
0.40
0 10 20 30 40 50
Distance between W-trap and atomizer, cm
Ana
lytic
al si
gnal
, A o
r A
.s
Peak Height Peak Area
Figure 3.41 The effect of distance between the trap and atomizer on both peak
height and peak area signals of Pb. 0.500 mL of 10 ng/mL Pb was used.

131
3.7.2.5 Tandem W-Trap Arrangement
During the trapping studies, it was observed that a significant amount of Pb
species were not trapped on the trap and there always appeared a breakthrough
signal when the concentration of Pb was appropriate for direct measurements. A
tandem W-trap arrangement was designed to collect these untrapped Pb species.
Two identical traps were consecutively coupled so that the species that were not
trapped on the first one would be trapped on the second one. In order to
accomplish these experiments, both trap temperatures were kept at collection
temperature. After the trapping was complete, the revolatilized species from the
first and the second traps were sent to the atomizer in separate experiments. It was
observed that the peak area of the analytical signal obtained from the first trap
(closer to GLS) was approximately 6 times higher than that was obtained from the
second one. If the untrapped species remained as hydride and reached to the
second trap, the analytical signal of second trap should be approximately 16% less
than that of the analytical signal from the first trap since the total efficiency of W-
trap was 14%. Therefore the untrapped Pb species were either decomposed and
turned into another form or lost before reaching to second trap.
3.7.3 Relation between Collection Volume and Analytical Signal
The relation between analytical signal and the collection volume was investigated
in CF mode. As already mentioned the blank reagents, mostly K3Fe(CN)6, were
contaminated by Pb. The blank reagent gave an analytical signal equal to that
would be obtained by using approximately 0.2 ng/mL Pb solution. The relation
between collection volume and peak height of analytical signal given in Figure
3.42 was obtained by using blank reagents. The solution of 0.5% (w/v) K3Fe(CN)6,
which was blank, was continuously pumped and the generated plumbane was
trapped on the coil. The analytical signal obtained by using blank was significant
even the collection volume was as low as 1.0 mL. As it is seen on the figure, the

132
analytical signal increases almost linearly up to at least 40 mL which corresponds
to 6.5 min collection time. If the collection volume is to be increased, the reagent
blanks must be decreased by applying appropriate purification methods so that the
collection volume can be increased up to 40 mL. The linear relation was an
indication of stability of Pb species on the coil (R2 = 0.978). No further
investigation was carried out on the stability of Pb species on the coil.
0.00
0.05
0.10
0.15
0.20
0.25
0.30
0.35
0 10 20 30 40 50Collection volume, mL
Abs
orba
nce
Figure 3.42 Analytical signal versus collection volume obtained by using reagent
blank solutions: 0.5% (w/v) K3Fe(CN)6 in 0.06 mol/L HCl and 1.0% NaBH4 (w/v)
(reagent blanks gave a signal equal to that obtained from 0.2 ng/mL Pb, and no Pb
was added); collection temperature, 350 ˚C; release temperature, 1300 ˚C.
3.7.4 Analytical Signal and Reproducibility
The analytical signal obtained from 0.5 mL of 10 ng/mL Pb (5.0 ng Pb) was shown
in Figure 3.43. The full with at half maximum of the analytical signal was
approximately 0.3 s. In addition, the peak was tailed. The signal shapes obtained

133
under different conditions of concentration or collection volume, were similar to
the one shown here. Less than 5% RSD (n=7) was obtained by replicate
measurements of reagent blanks (0.2 ng/mL) for a collection volume of 15 mL (2.5
min collection). As discussed for Bi and Cd, the reproducibility of the peak area
measurements was poorer than that of peak height values because of very sharp
signals which resulted numerically small peak area values. Moreover, since the
integration period was longer than the basewidth of the analytical signal, small
drifts in the baseline and also tailing of the analytical signal resulted in higher
%RSD values. Therefore, higher relative standard deviation was observed when
the peak area values were taken into account; typically 10-15% RSD values were
obtained.
Figure 3.43 The analytical signals for 2.0 mL of 5.0 ng/mL Pb; Collection at 350 ˚C
and releasing at 1300 ˚C.
3.7.5 Calibration Plot
The calibration plot drawn by using peak height and peak area for 2.0 mL of
aqueous standard solutions was given in Figure 3.44; no blank correction was

134
made. It was found that the plot was linear between the concentrations of 0 and 3.0
ng/mL for peak height for 2 mL collection volume (20 s collection). The peak area
was also found to be linearly correlated with the concentration, but the precision
was poor due to very sharp transient signals as discussed earlier. Since the reagent
blank values due to high Pb content of K3Fe(CN)6 was significant, the signal
obtained from only blank was significant even at a collection volume of 1.0 ml.
y = 0.036x + 0.0189R2 = 0.9989
0.00
0.02
0.04
0.06
0.08
0.10
0.12
0.14
0 0.5 1 1.5 2 2.5 3
Concentration of Pb, ng/mL
Abs
orba
nce
Figure 3.44 The calibration plot drawn by using peak height for 2.0 mL of aqueous
standard solutions of Pb in 0.5% (w/v) K3Fe(CN)6 under optimum conditions (No
blank correction was made).
3.7.6 The Analytical Figures of Merit
The total efficiency for trapping, releasing and transportation to the atomizer for
trapping was calculated by comparing the peak area values of the signals obtained
by conventional FI-HGAAS (no W-trap) and that obtained by W-trap HGAAS

135
under the same carrier gas flow rates. These experiments showed that the total
efficiency was 14% and the rest was either untrapped or lost between trap and
atomizer.
High reagent blank values were the limiting factor for the enhancement of figures
of merit for Pb. The blank solution already contained 0.2 ng/mL Pb. The same
problem was also observed elsewhere where the same reagent was used for
efficient hydride generation [155, 159]. Therefore the characteristic mass and the
limit of detection was calculated from the blank solution for both conventional FI
HGAAS and W-trap HGAAS. The analytical figures of merit of the method for Pb
were given in Table 3.7; peak height was used for the calculation of parameters.
The limit of detection values of both conventional FI-HGAAS and W-trap
HGAAS were calculated using 0.5% (w/v) K3Fe(CN)6. The enhancement factor in
the limit of detection (3σ) found to be 12 for 2.0 mL collection volume when
compared to conventional FI-HGAAS where the injection volume was 0.500 mL.
The characteristic concentration of W-trap HGAAS for 2.0 mL collection volume
was calculated as 0.011 ng/mL for peak height which was 20 times lower as
compared to conventional FI-HGAAS whose characteristic concentration was 0.18
ng/mL of Pb. The observed enhancement factor in the sensitivity could not be
reached in the limit of detection due to high blank values, since the solution used
for calculation of LOD contained significant amount of Pb.
When peak area was used the improvement in analytical figures was as much as
for peak height values due to sharp transient nature of analytical signal. The
enhancement factor in the limit of detection was only 3. The characteristic mass
for conventional FI HGAAS was 0.15 ng whereas that of W-trap HGAAS was 1.0
ng since the collection efficiency was only 14% and also the signal was very sharp.
Therefore use of peak area did not provide any advantage.

136
Table 3.7 Analytical figures of merit and enhancement factors for Pb calculated by
using peak height of analytical signal.
FI-HGAASa W-Trap HGAASb
Enhancement Factor
Limit of detection, ng/mL 0.180 0.015 12
Characteristic concentration, ng/mL
0.23 0.011 20
Characteristic massc, ng 0.15 1.0 -
a The parameters were calculated by 10 replicate measurements of 0.500 mL of blank solution containing 0.2 ng/mL Pb in FI mode. b The parameters were calculated by 10 replicate measurements of 2.0 mL of blank solution containing 0.2 ng/mL Pb in CF mode. c Characteristic mass values were calculated by using peak area values obtained at optimum working conditions for each method.
The limit of detection of the developed method was compared with the literature
values in Table 3.8. As seen on the table, the concentration limit of detection value
was comparable with other hydride generation systems or better. The LOD of ICP-
MS is lower than ours but as mentioned its cost is relatively higher than the simple
and low cost method presented here. If reagent blank values are reduced, the
analytical figures of merit can be improved further by using higher sample
volumes since the linearity between collection volume and analytical signal is
conserved up to 40 mL.
The effects of interfering elements were not studied. Copper have been assigned as
one of the most interfering transition metal. Brindle et al. studied the interferences
of transition metals and showed that Cu is the most interfering element; presence
of 1 µg/mL Cu decreased the analytical signal obtained from 20 ng/mL Pb by 48%
[158]. In the same study, it was reported that when the concentration of Fe(III) and
Mn(II) was 1 µg/mL, the decrease in the analytical signal was 8% by each metal.
Therefore at higher concentrations of these elements, interference should be

137
expected. Dilution of sample and collection of larger volumes may be required; the
reagent blanks must be reduced.
Table 3.8 Comparison of the limit of detection and the sample volume of the
method with those of others in literature
Method
Concentration LOD, ng/mL
Absolute LOD, pg
Sample Volume, ml
Reference Number
W-Trap HGAAS
0.015 30 2.0 This study
W-Coil ETAAS 0.63 6.3 0.010 129
HG in-situ ETAAS
0.500 250 0.5 157
ETAAS 0.93 9.3 0.010 147
DCP-AES 0.7 350 0.500 158
HG-ICP-MS 0.007 3.5 0.5 161
HG in-situ ETAAS
0.03 30 1.0 159
HG in-situ ETAAS
0.06 30 0.500 163
3.7.7 Accuracy of the Method
The accuracy of the method was tested using certified reference materials, Metals
on Soil/Sediment #4 (Ultra Scientific) and NIST SRM 278 Obsidian Rock. The
certified and found values are given in Table 3.9. The results of analysis of both
SRM were found to be in good agreement with the certified values. In the analysis
of soil/sediment, the digested solutions were further diluted 100 times with blank

138
solution. The digests of obsidian SRMs were further diluted 25 times with blank
solution and then injected. The determination of Pb in the SRM solutions was
performed in FI mode with a sample volume of 0.500 mL. Each injection took
approximately 20 seconds. Since reagent blank, 0.5% (w/v) K3Fe(CN)6, contained
significant Pb as contaminant, a solution containing only 0.06 mol/L HCl was used
as carrier solution in order to decrease the blank values. Significant signal was
obtained from 0.500 mL of reagent blank solution which was also injected together
with sample and standards. No matrix interference was encountered during the
analysis. Direct calibration method was applied since no matrix interference was
observed during the determination.
Table 3.9 Results of the analysis of standard reference materials and their certified
values (n=3 for each measurement)
SRM Found value Certified value
Soil/Sedimenta, µg/g 96.1 ± 5.0 95.3 ± 5.3
Obsidian Rockb, µg/g 16.0 ± 1.1 16.4 ± 0.2
a 0.100 g sample was digested in microwave oven and diluted to 100 mL with 0.06 mol/L HCl. The solutions were further diluted 100 times with 0.5% (w/v) K3Fe(CN)6 in 0.06 mol/L HCl just before the measurements. b 0.250 g sample was digested in microwave oven and diluted to 100 mL with 0.06 mol/L HCl. The solutions were further diluted 25 times with 0.5% (w/v) K3Fe(CN)6 in 0.06 mol/L HCl just before the measurements.

139
CHAPTER IV
CONCLUSIONS
Novel analytical techniques for the determination of Bi, Cd and Pb have been
developed by using on-line preconcentration on heated W-coil and revolatilization.
The methods provide relatively easy, low cost and fast on line preconcentration
and determination of Bi, Cd and Pb at ng/L range. Furthermore they can be applied
in laboratories having a simple AAS instrument and a hydride generation system
with a very low additional cost. The system can be easily manufactured in any
laboratory.
A regular W-coil atomizer was not used since its geometry is not ideal for
trapping. A W-coil extracted from a commercial halogen lamp was employed. The
inlet arm of the T-tube was chosen for the best trapping geometry; the trapping
efficiency depends on the alignment of W-coil in the inlet arm.
The analytical signals are very sharp due to fast heating rate of W coil which
allowed the use of peak height values; half widths are less than a second. The peak
area values are rather small which resulted in a decrease in the reproducibility and
enhancement factors. However if peak area values are to be used, the heating rate
and the carrier gas flow rate can be reduced in order to improve reproducibility.
The total efficiency of trapping and revolatilization for Bi was 23% and the
achieved limit of detection for Bi was 0.0027 ng/mL for 18 mL sample volume.

140
Revolatilized Bi species can be transported for at least 50 cm without any
significant decrease in the peak area; however peak heights were decreased due to
broadening. The enhancement factor in the sensitivity was 130 with 18 mL sample
volume.
The generation of atomic species of Cd by tetrahydroborate reduction is rather
problematic when compared to Bi and Pb due to the atomic nature of volatile
species. The decrease in the analytical signal of Cd in the presence of O2 in
conventional HG can also be attributed to atomic nature. However this must be
investigated further. A close control of experimental parameters is required for
efficient and reproducible vapor generation. The efficiency of generation of Cd
atoms is linearly correlated by the reaction coil temperature. A significant decrease
was observed in both peak height and peak area when the distance between trap
and atomizer was 25 cm. The decrease depends on the tubing material used for
transportation. The sensitivity was improved 31 times when compared to
conventional HG. The limit of detection achieved with 4.2 mL sample volume was
0.015 ng/mL.
Among the tested reagents used to increase plumbane generation efficiency,
K3Fe(CN)6 is the best but it has high blank values. High reagent blanks is the
major problem for the improvement in the LOD for Pb. Characteristic
concentration was improved 20 times for 2.0 mL collection volume when
compared to conventional HGAAS. The limit of detection was 0.015 ng/mL for
2.0 mL sample volume. The analytical figures of merit for Pb can be improved
further using sample volumes of up to 4 mL. However, reagent blanks must be
purified for the achievement of enhancement factors close to that was obtained for
Bi. The total trapping and revolatilization efficiency is 14%. Revolatilized Pb
species can be transported for at least 45 cm without any significant reduction in
the peak area however peak heights were decreased due to broadening.

141
The achieved concentration limits of detection are well comparable with that of in-
situ trapping in the literature. Although absolute limits of detection of ICP-MS
systems are much lower than presented here, the concentration limits are
comparable. However ICP-MS systems are cost prohibitive.
The revolatilized species of Bi and Pb are either molecular or short living atomic
in nature; since no signal was observed when quartz T-tube was not heated.
However Cd is revolatilized from the surface as its atomic species. Rather
convenient transport properties of revolatilized species suggest that they can be
transported to another detection system such as ICP or ICP-MS that will improve
the limit of detection.
In order to extend the applicability of this method for other analytes there are three
requirements: 1. The analyte must be volatilized; Hg and all the hydride forming
elements fulfill this requirement. 2. The analyte must be collected on a suitable
trap; including W-coil there may be several other metal traps that could be used for
this purpose. 3. Trapped analyte must be thermally revolatilized and then atomized
in an absorption cell. It seems that the method can be applied to some other
hydride forming elements using electrically heated metal wires.
The following article (Reference 104) was published from this work.
O. Cankur, N. Erta, O.Y. Ataman, Determination of bismuth after on-line
preconcentration by trapping on resistively heated W-coil and hydride generation
atomic absorption spectrometry, Journal of Analytical Atomic Spectrometry 2002,
Vol 17, 603-609.

142
REFERENCES
1. B. Welz, M. Sperling, Atomic Absorption Spectrometry, 3rd Edition, Wiley-VCH Verlag GmBH, Germany, 1999.
2. D.L. Tsalev, Vapor generation or electrothermal atomic absorption
spectrometry?-Both!, Spectrochimica Acta Part B 2000, Vol 55, 917-933. 3. A. Montaser, D. Golightly, Inductively Coupled Plasmas in Analytical
Atomic Spectrometry, 2nd Edition, VCH Publishers Inc., New York, 1992. 4. S.S. Kannamkumarath, K. Wrobel, K. Wrobel, C. B’Hymer, J.A. Caruso,
Capillary electrophoresis-inductively coupled plasma-mass spectrometry: an attractive complementary technique for elemental speciation analysis-Review, Journal of Chromatography A 2002, Vol 975, 245-266.
5. J. Ddina, D.L. Tsalev, Hydride Generation Atomic Absorption
Spectrometry, John Wiley and Sons Ltd., Chichester, 1995. 6. D.L. Tsalev, Hyphenated vapour generation atomic absorption spectrometric
techniques, Journal of Analytical Atomic Spectrometry 1999, Vol 14, 147-162.
7. A. Sanz-Medel, M.C. Valdés-Hevia y Temprano, N. Bordel García, M.R.
Fernández de la Campa, Generation of cadmium atoms at room temperature using vesicles and its application to cadmium determination by cold vapor atomic spectrometry, Analytical Chemistry 1995, Vol 67, 2216-2223.
8. R.K. Skogerboe, D.L Dick, D.S. Pavlica, F.E. Lichte, Injection of samples
into flames and plasmas by production of volatile chloride, Analytical Chemistry 1975, Vol 47, 568-570.
9. P.N. Vijan, Feasibility of determining ultratrace amounts of nickel by
carbonyl generation and atomic absorption spectrometry, Atomic Spectroscopy 1980, Vol 1, 143-144.

143
10. T.W. Brueggemeyer, J.A. Caruso, Determination of lead in aqueous samples as the tetramethyl derivative by atomic absorption spectrometry, Analytical Chemistry 1982, Vol 54, 872-875.
11. S. Rapsomanikis, O.F.X. Donard, J.H. Weber, Speciation of lead and
methyllead ions in water by chromatography/atomic absorption spectrometry after ethylation with sodium tetraethylborate, Analytical Chemistry 1986, Vol 58, 35-38.
12. R.E. Sturgeon; S.N. Willie, S.S. Berman, Atomic absorption determination
of lead at picogram per gram levels by ethylation with in situ concentration in a graphite furnace, Analytical Chemistry 1989, Vol 61, 1867-1869.
13. W. Holak, Gas-sampling technique for arsenic determination by atomic
absorption spectrophotometry, Analytical Chemistry 1969, Vol 41, 1712-1713.
14. R.C. Chu, G.P. Barron, P.A.W. Baumgarner, Arsenic determination at sub-
microgram levels by arsine evolution and flameless atomic absorption spectrophotometric technique, Analytical Chemistry 1972, Vol 44, 1476-1479.
15. H.C. Freeman, J.F. Uthe, An improved hydride generation apparatus for
determining arsenic and selenium by atomic absorption spectroscopy, Atomic Absorption Newsletter 1974, Vol 13, 75-76.
16. F.E. Lichte, R.K. Skogerboe, Emission spectrometric determination of
arsenic, Analytical Chemistry 1972, Vol 44, 1480-1482. 17. W.B. Robbins, J.A. Caruso, Development of hydride generation methods for
atomic spectroscopic analysis, Analytical Chemistry 1979, Vol 51, 889A-899A.
18. F.J. Fernandez, D.C. Manning, The determination of As at sub-microgram
levels by AA spectrophotometry, Atomic Absorption Newsletter 1971, Vol 10, 86-88.
19. J. Agterdenbos, D. Box, A study on the generation of hydrogen selenide and
decomposition of tetrahydroborate in hydride generation atomic absorption spectrometry, Analytica Chimica Acta 1986, Vol 188, 127-135.
20. R.S. Braman, L.L. Justen, C.C. Foreback, Direct volatilization-spectral
emission type detection system for nanogram amounts of arsenic and antimony, Analytical Chemistry 1972, Vol 44, 2195-2199.

144
21. A. D'Ulivo, V. Loreti, M. Onor, E. Pitzalis, R. Zamboni, Chemical vapor generation atomic spectrometry using amineboranes and cyanotrihydroborate(III) reagents, Analytical Chemistry 2003, Vol 75, 2591-2600.
22. X.-D. Tian, Z.-X. Zhuang, B. Chen, X.-R. Wang, Movable reduction bed
hydride generator coupled with inductively coupled plasma optical emission spectrometry for determination of hydride forming elements, Analyst 1998, Vol 123, 627-632.
23. N. Maleki, A. Safavi, Z. Ramezani, Determination of lead by hydride
generation atomic absorption spectrometry (HGAAS) using a solid medium for generating hydride, Journal of Analytical Atomic Spectrometry 1999, Vol 14, 1227-1230.
24. W.-W. Ding, R.E. Sturgeon, Evaluation of electrochemical hydride
generation for the determination of arsenic and selenium in sea water by graphite furnace atomic absorption with in situ concentration, Spectrochimica Acta Part B 1996, Vol 51, 1325-1334.
25. A. D’Ulivo, C. Baiocchi, E. Pitzalis, M. Onor, R. Zamboni, Chemical vapor
generation for atomic spectrometry. A contribution to the comprehension of reaction mechanisms in the generation of volatile hydrides using borane complexes, Spectrochimica Acta Part B 2004, Vol 59, 471-486.
26. F. Laborda, E. Bolea, M.T. Baranguan, J.R. Castillo, Hydride generation in
analytical chemistry and nascent hydrogen: when is it going to be over?, Spectrochimica Acta Part B 2002, Vol 57, 797-802.
27. J. Cacho, I. Beltrán, C. Nerin, Generation of volatile cadmium species in an
organic medium, Journal of Analytical Atomic Spectrometry 1989, Vol 4, 661-663.
28. X.-W. Guo, X.-M. Guo, Determination of cadmium at ultratrace levels by
cold vapor atomic absorption spectrometry, Journal of Analytical Atomic Spectrometry 1995, Vol 10, 987-991.
29. R.E. Sturgeon, J. Liu, V.J. Boyko, V.T. Luong, Determination of copper in
environmental matrices following vapor generation, Analytical Chemistry 1996, Vol 68, 1883-1887.
30. H. Sun, R. Suo, Y. Lu, Determination of zinc in food using atomic
fluorescence spectrometry by hydride generation from organized media, Analytica Chimica Acta 2002, Vol 457, 305-310.

145
31. X.-M. Guo, B. Huang, Z. Sun, R. Ke, Q. Wang, Z.-B Gong, Preliminary study on a vapor generation technique for nickel without using carbon monoxide by inductively coupled plasma atomic emission spectrometry, Spectrochimica Acta Part B 2000, Vol 55, 943-950.
32. P. Pohl, W. Zyrnicki, Study of chemical vapor generation of Au, Pd, and Pt
by inductively coupled plasma atomic emission spectrometry, Journal of Analytical Atomic Spectrometry 2001, Vol 16, 1442-1445.
33. A.S. Luna, R.E. Sturgeon, R.C. de Campos, Chemical vapor generation:
atomic absorption by Ag, Au, Cu and Zn following reduction of aquo ions with sodium terahydroborate(III), Analytical Chemistry 2000, Vol 72, 3523-3531.
34. Y.-L. Feng, J.W. Lam, R.E. Sturgeon, Expanding the scope of chemical
vapor generation for noble and transition metals, Analyst 2001, Vol 126, 1833-1837.
35. T. Matoušek, J. Ddina, M. Vobecký, Continuous flow chemical vapour
generation of silver for atomic absorption spectrometry using tetrahydroborate (III) reduction-system performance and assessment of the efficiency using instrumentlal neutron activation analysis, Journal of Analytical Atomic Spectrometry 2002, Vol 17, 52-56.
36. Y.-L. Feng, R.E. Sturgeon, J.W. Lam, Chemical vapor generation
characteristics of transition and noble metals reacting with tetrahydroborate(III), Journal of Analytical Atomic Spectrometry 2003, Vol 18, 1435-1442.
37. N. Panichev, R.E. Sturgeon, Atomic absorption by free atoms in solution
following chemical reduction from the ionic state, Analytical Chemistry 1998, Vol 70, 1670-1676.
38. R. Burtovyy, E. Utzig, M. Tkacz, Studies of the thermal decomposition of
copper hydride, Thermochimica Acta 2000, Vol 363, 157-163. 39. G.D. Barbaras, C. Dillard, A.E. Finholt, T. Wartik, K.E. Wilzbach, H.I.
Schlesinger, The preparation of the hydrides of zinc, cadmium, beryllium, magnesium and lithium by the use of lithium aluminum hydride, Journal of American Chemical Society 1951, Vol 73, 4585-4590.
40. K. Fujita, T. Takada, Effect of temperature on generation and decomposition
of the group Vb Element hydrides and estimation of the kinetic stability of gaseous bismuth hydride by atomic absorption spectrometry, Talanta 1986, Vol 33, 203-207.

146
41. F.J. Fernandez, Atomic absorption determination of gaseous hydrides utilizing sodium borohydride reduction, Atomic Absorption Newsletters 1973, Vol 12, 93-97.
42. J. Ddina, Quartz tube atomizers for hydride generation atomic absorption
spectrometry: mechanism of selenium atomization and fate of free atoms, Spectrochimica Acta Part B 1992, Vol 47, 689-700.
43. B. Welz, T. Guo, Formation and interpretation of double peaks in flow
injection hydride generation atomic absorption spectrometry, Spectrochimica Acta Part B 1992, Vol 47, 645-658.
44. B. Welz, M. Melcher, Investigations on atomisation mechanisms of volatile
hydride-forming elements in a heated quartz cell: Part 1. Gas-phase and surface effects; Decomposition and atomisation of arsine, Analyst 1983, Vol 108, 213-224.
45. M. Johansson, D.C. Baxter, K.E.A. Ohlsson, W. Frech, Mechanism of
formation and spatial distribution of lead atoms in quartz tube atomizers, Spectrochimica Acta Part B 1997, Vol 52, 643-656.
46. S. Tesfalidet, G. Wikander, K. Irgum, Determination of hydrogen radicals in
analytical flames using electron spin resonance spectroscopy applied to direct investigations of flame-based atomization units for hydride generation atomic absorption spectrometry, Analytical Chemistry 1999, Vol 71, 1225-1231.
47. K. Jin, M. Taga, Determination of lead by continuous-flow hydride
generation and atomic absorption spectrometry: comparison of malic acid-dichromate, nitric acid-hydrogen peroxide and nitric acid-peroxodisuphate reaction matrices in combination with sodium tetrahydroborate, Analytica Chimica Acta 1982, Vol 143, 229-236.
48. X.J. Feng, B. Fu, Determination of arsenic, antimony, selenium, tellurium
and bismuth in nickel metal by hydride generation atomic fluorescence spectrometry, Analytica Chimica Acta 1998, Vol 371, 109-113.
49. A. D’Ulivo, L. Gianfranceschi, L. Lampugnani, R. Zamboni, Masking agents
in the determination of selenium by hydride generation technique, Spectrochimica Acta Part B 2002, Vol 57, 2081-2094.
50. A.B. Volynsky, Mechanisms of action of platinum group modifiers in
electrothermal atomic absorption spectrometry, Spectrochimica Acta Part B 2000, Vol 55, 103-150.
147
51. X. Hou, B.T. Jones, Tungsten devices in analytical atomic spectrometry, Spectrochimica Acta Part B 2002, Vol 57, 659-688.
52. K.A. Wagner, K.E. Levine, B.T. Jones, A simple, low cost, multielement
atomic absorption spectrometer with a tungsten coil atomizer, Spectrochimica Acta Part B 1998, Vol 53, 1507-1516.
53. V. Krivan, P. Barth, C. Schnürer-Patschan, An electrothermal atomic
absorption spectrometer using semiconductor diode lasers and a tungsten coil atomizer: Design and first applications, Analytical Chemistry 1998, Vol 70, 3525-3532.
54. X. Hou, K.E. Levine, A. Salido, B.T. Jones, M. Ezer, S. Elwood, J.B.
Simeonsson, Tungsten coil devices in atomic spectrometry: Absorption, fluorescence, and emission, Analytical Sciences 2001, Vol 17, 175-180.
55. P. Barth, S. Hauptkorn, V. Krivan, Improved slurry sampling electrothermal
vaporization system using a tungsten coil for inductively coupled plasma atomic emission spectrometry, Journal of Analytical Atomic Spectrometry 1997, Vol 12, 1351-1358.
56. T. Maruta, T. Takeuchi, Determination of trace amounts of chromium by
atomic absorption spectrometry with a tantalum filament atomizer, Analytica Chimica Acta 1973, Vol 66, 5-11.
57. S. Ahsan, S. Kaneco, K. Ohta, T. Mizuno, Y. Taniguchi, Direct
determination of cadmium in calcium drug samples using electrothermal atomic absorption spectrometry with a metal tube atomizer and thiourea as a matrix modifier, Talanta 1999, Vol 48, 63-69.
58. K. Ohta, S.-I. Itoh, T. Mizuno, Electrothermal atomization atomic absorption
spectrometry of cadmium with a platinum tube atomizer, Talanta 1991, Vol 38, 871-874.
59. CRC Handbook of Chemistry and Physics, 52nd Edition, The Chemical
Rubber Co., USA, 1971-1972. 60. M.F. Giné, F.J. Krug, V.A. Sass, B.F. Reis, J.A. Nobrega, H. Berndt,
Determination of cadmium in biological materials by tungsten coil atomic absorption spectrometry, Journal of Analytical Atomic Spectrometry 1993, Vol 8, 243-245.
61. X. Hou, B.T. Jones, Field instrumentation in atomic spectroscopy,
Microchemical Journal 2000, Vol 66, 115-145.

148
62. A.S. Ribeiro, M.A.Z. Arruda, S. Cadore, Determination of bismuth in metallurgical materials using a quartz tube atomizer with tungsten coil and flow injection-hydride-generation atomic absorption spectrometry, Spectrochimica Acta Part B: Atomic Spectroscopy 2002, Vol 57, 2113-2120.
63. A.S. Ribeiro, M.A.Z. Arruda, S. Cadore, A quartz tube atomizer with
tungsten coil: a new system for vapor atomization in atomic absorption spectrometry, Journal of Analytical Atomic Spectrometry 2002, Vol 17, 1516 - 1522.
64. W. Lund, B.V. Larsen, The application of electrodeposition techniques to
flameless atomic absorption spectrometry Part I. Determination of cadmium with a tungsten Filament, Analytica Chimica Acta 1974, Vol 70, 299-310.
65. W. Lund, B.V. Larsen, The application of electrodeposition techniques to
flameless atomic absorption spectrometry Part II. Determination of cadmium in sea water, Analytica Chimica Acta 1974, Vol 72, 57-62.
66. W. Lund, B.V. Larsen, The application of electrodeposition techniques to
flameless atomic absorption spectrometry Part III. Determination of cadmium in urine, Analytica Chimica Acta 1976, Vol 81, 319-324.
67. E.J. Czobik, J.P. Matoušek, The application of electrodeposition on a
tungsten wire to furnace atomic absorption spectrometry, Spectrochimica Acta Part B 1980, Vol 35, 741-751.
68. E.W. Wolff, M.P. Landy, D.A. Peel, Preconcentration of cadmium, copper,
lead, and zinc in water at the 10-12 g/g level by adsorption onto tungsten wire followed by flameless atomic absorption spectrometry, Analytical Chemistry 1981, Vol 53, 1566-1570
69. Jr F. Barbosa, F.J. Krug, É.C. Lima, On-line coupling of electrothermal
preconcentration in tungsten coil electrothermal atomic absorption spectrometry for determination of lead in natural waters, Spectrochimica Acta Part B 1999, Vol 54, 1155-1166.
70. S.I. Itoh, S. Kaneco, K. Ohta, T. Mizuno, Determination of bismuth in
environmental samples with Mg-W cell-electrothermal atomic absorption spectrometry, Analytica Chimica Acta 1999, Vol 379, 169-173.
71. H. Matusiewicz, R.E. Sturgeon, Atomic spectrometric detection of hydride
forming elements following in situ trapping within a graphite furnace, Spectrochimica Acta Part B 1996, Vol 51, Iss 4, 377-397.

149
72. D.S. Lee, Determination of bismuth in environmental samples by flameless atomic absorption spectrometry with hydride generation, Analytical Chemistry 1982, Vol 54, 1682-1686.
73. R.E. Sturgeon, S.N. Willie, S.S. Berman, Hydride generation atomic-
absorption determination of antimony in seawater with in-situ concentration in a graphite furnace, Analytical Chemistry 1985, Vol 57, 2311-2314.
74. D.L. Tsalev, A. D’Ulivo, L. Lampugnani, M. Di Marco, R. Zamboni,
Thermally stabilized iridium on an integrated, carbide-coated platform as a permanent modifier for hydride-forming elements in electrothermal atomic absorption spectrometry Part 2. Hydride generation and collection, and behaviour of some organoelement species, Journal of Analytical Atomic Spectrometry 1996, Vol 11, 979-988.
75. R.E. Sturgeon, S.N. Willie, G.I. Sproule, P.T. Robinson, S.S. Berman,
Sequestration of volatile element hydrides by platinum group elements for graphite furnace atomic apsorption, Spectrochimica Acta Part B 1989, Vol 44, 667-682.
76. L. Zhang, Z.M. Ni, X.-Q. Shan, In situ concentration of metallic hydrides in
a graphite furnace coated with palladium, Spectrochimica Acta Part B 1989, Vol 44, 339-346.
77. L. Zhang, Z.M. Ni, X.-Q. Shan, In situ concentration of metallic hydrides in
a graphite furnace coated with palladium- Determination of Bismuth, Germanium and Tellurium, Spectrochimica Acta Part B 1989, Vol 44, 751-758.
78. Y.-P. Liao, H.O. Haug, Investigation of stable coatings for in situ trapping of
Se and Te in flow-injection hydride generation and graphite furnace atomic absorption spectrometry for automated determination, Microchemical Journal 1997, Vol 56, 247-258.
79. H.O. Haug, Y.-P. Liao, Investigation of the automated determination of As,
Sb and Bi by flow-injection hydride generation using in-situ trapping on stable coatings in graphite furnace atomic absorption spectrometry, Fresenius Journal of Analytical Chemistry 1996, Vol 356, 435-444.
80. S. Garbo, M. Wałcerz, E. Bulska, A. Hulanicki, Simultaneous determination
of Se and As by hydride generation atomic absorption spectrometry with analyte concentration in a graphite furnace coated with zirconium, Spectrochimica Acta Part B 1995, Vol 50, 1669-1677.

150
81. J. Murphy, P. Jones, G. Schlemmer, I.L. Shuttler, S.J. Hill, Investigations into the simultaneous determination of bismuth and selenium by 'in atomizer trapping' electrothermal atomic absorption spectrometry, Analytical Communications 1997, Vol 34, 359-362.
82. B. Doekal, P. Marek, Investigation of in situ trapping of selenium and
arsenic hydrides within tungsten tube atomizer, Journal of Analytical Atomic Spectrometry 2001, Vol 16, 831-837.
83. Jr F. Barbosa, S.S. de Souza, F.J. Krug, In situ trapping of selenium hydride
in rhodium-coated tungsten coil electrothermal atomic absorption spectrometry, Journal of Analytical Atomic Spectrometry 2002, Vol 17, 382-388.
84. V. Majidia, N. Xu, R.G. Smith, Electrothermal vaporization, part 1: Gas
phase chemistry- Review, Spectrochimica Acta Part B 2000, Vol 55, 3-35. 85. G. Erta, J.A. Holcombe, Determination of absolute transport efficiencies of
Be, Cd, In, Pb and Bi for electrothermal vaporization sample introduction into an inductively coupled plasma using an in-line electrostatic precipitator, Spectrochimica Acta Part B 2003, Vol 58, 1597-1612.
86. M.A. Belarra, M. Resano, F. Vanhaecke, L. Moens, Direct solid sampling
with electrothermal vaporization/atomization: what for and how?, Trends in Analytical Chemistry 2002, Vol 21, 828-839.
87. T. Kantor, Electrothermal vaporization and laser ablation sample
introduction for flame and plasma spectrometric analysis of solid and solution samples-Review, Spectrochimica Acta Part B 2001, Vol 56, 1523-1563.
88. D.C. Grégoire, R.E. Sturgeon, Analyte transport efficiency with
electrothermal vaporization inductively coupled plasma mass spectrometry, Spectrochimica Acta Part B 1999, Vol 54, 773-786.
89. U. Schäffer, V. Krivan, A graphite furnace electrothermal vaporization
system for inductively coupled plasma atomic emission spectrometry, Analytical Chemistry 1998, Vol 70, 482-490.
90. T. Kantor, Interpreting some analytical characteristics of thermal dispersion
methods used for sample introduction in atomic spectrometry, Spectrochimica Acta Part B 1988, Vol 43, 1299-1320.

151
91. J. Bernhardt, T. Buchkamp, G. Hermann, G. Lasnitschka, Transport efficiencies and analytical determinations with electrothermal vaporization employing electrostatic precipitation and electrothermal atomic spectroscopy, Spectrochimica Acta Part B 1999, Vol 54, 1821-1829.
92. H.T. Uggerud, W. Lund, Use of palladium and iridium as modifiers in the
determination of arsenic and antimony by electrothermal vaporization inductively coupled plasma mass spectrometry, following in situ trapping of the hydrides, Journal of Analytical Atomic Spectrometry 1997, Vol 12, 1169-1174.
93. H. Matusiewicz, M. Kopras, Simultaneous determination of hydride forming
elements (As, Bi, Ge, Sb, Se) and Hg in biological and environmental reference materials by electrothermal vaporization–microwave induced plasma-optical emission spectrometry with their in situ trapping in a graphite furnace, Journal of Analytical Atomic Spectrometry 2003, Vol 18, 1415-1425.
94. C.C. Chang, S.J. Jiang, Determination of Hg and Bi by electrothermal
vaporization inductively coupled plasma mass spectrometry using vapor generation with in situ preconcentration in a platinum-coated graphite furnace, Analytica Chimica Acta 1997, Vol 353, 173-180.
95. J.P. Matoušek, R. Iavetz, K.J. Powell, H. Louie, Mechanistic studies on the
trapping and desorption of volatile hydrides and mercury for their determination by electrothermal vaporization-inductively-coupled plasma mass spectrometry, Spectrochimica Acta Part B 2002, Vol 57, 147-155.
96. K. Dittrich, H. Berndt, J.A.C. Broekaert, G. Schaldach, G. Tölg,
Comparative study of injection into a pneumatic nebuliser and tungsten coil electrothermal vaporisation for the determination of rare earth elements by inductively coupled plasma optical emission spectrometry, Journal of Analytical Atomic Spectrometry 1988, Vol 3, 1105-1110.
97. K. Levine, K.A. Wagner, B.T. Jones, Low-cost, modular electrothermal
vaporization system for inductively coupled plasma atomic emission spectrometry, Applied Spectroscopy 1998, Vol 52, 1165-1171.
98. N. Shibata, N. Fudagawa, M. Kubota, Electrothermal vaporization using a
tungsten furnace for the determination of rare-earth elements by inductively coupled plasma mass spectrometry, Analytical Chemistry 1991, Vol 63, 636-640.

152
99. S. Hauptkorn, V. Krivan, B. Gercken, J. Pavel, Determination of trace impurities in high-purity quartz by electrothermal vaporization inductively coupled plasma mass spectrometry using the slurry sampling technique, Journal of Analytical Atomic Spectrometry 1997, Vol 12, 421-428.
100. Y. Okamoto, Direct determination of lead in biological samples by
electrothermal vaporization inductively coupled plasma mass spectrometry (ETV-ICP-MS) after furnace-fusion in the sample cuvette-tungsten boat furnace, Fresenius Journal of Analytical Chemistry 2000, Vol 367, 300-305.
101. Y. Okamoto, R. Kikkawa, Y. Kobayashi, T. Fujiwara, External furnace-
fusion digestion for the direct determination of lead in rock samples by inductively coupled plasma mass spectrometry (ICP-MS) using the tungsten boat furnace-sample cuvette technique, Journal of Analytical Atomic Spectrometry 2001, Vol 16, 96-98.
102. C. Bruhn, H. Berndt, M.L. Tristao, Low-temperature hydride furnace
modified for the atomic absorption spectrometric determination of metals with low appearance temperatures, Analytica Chimica Acta 1987, Vol 193, 361-365.
103. I. Osama, M.S. Thesis, Determination of Cadmium by Cold Vapour
Generation Atom Trapping Atomic Absorption Spectrometry, Middle East Technical University, Ankara, June 2000.
104. O. Cankur, N. Erta, O.Y. Ataman, Determination of bismuth after on-line
preconcentration by trapping on resistively heated W-coil and hydride generation atomic absorption spectrometry, Journal of Analytical Atomic Spectrometry 2002, Vol 17, 603-609.
105. B. Doekal, . Güçer, A. Selecká, Trapping of hydride forming elements
within miniature electrothermal devices: Part I. Investigation of collection of arsenic and selenium hydrides on a molybdenum foil strip, Spectrochimica Acta Part B 2004, Vol 59, 487-495.
106. X.-M. Guo, X.-W. Guo, Determination of ultra-trace amounts of selenium by
continuous flow hydride generation AFS and AAS with collection on gold wire, Journal of Analytical Atomic Spectrometry 2001, Vol 16, 1414-1418.
107. P.J. Sadler, H. Li, H. Sun, Coordination chemistry of metals in medicine:
target sites for bismuth, Coordination Chemistry Reviews 1999, Vol 185-186, 689-709.
153
108. J.L. Burguera, M. Burguera, C. Rivas, C. Rondon, P. Carrero, M. Gallignani, Determination of bismuth in biological samples using on-line flow-injection microwave-assisted mineralization and precipitation/dissolution for electrothermal atomic absorption spectrometry, Talanta 1999, Vol 48, 885-893.
109. D.M. Taylor, D.R. Williams, Trace element medicine and chelation therapy,
The Royal Society of Chemistry, Cambridge, 1995. 110. Bi Applications and Trends, http://www.bismuth.be/Appl.html and
http://www.bismuth.be/news.html. 111. S. Cadore, N. Baccan, Continuous hydride generation system for the
determination of trace amounts of bismuth in metallurgical materials by atomic absorption spectrometry using an on-line stripping-type generator/gas-liquid separator, Journal of Analytical Atomic Spectrometry 1997, Vol 12, 637-642.
112. S. Cadore, A.P. dos Anjos, N. Baccan, Determination of bismuth in urine and
prescription medicines using atomic absorption with an on-line hydride generation system, Analyst 1998, Vol 123, 1717-1719.
113. R. Pamphlett, M. Stoltenberg, J. Rungby, G. Danscher, Uptake of bismuth in
motor neurons of mice after single oral doses of bismuth compounds, Neurotoxicology and Teratology 2000, Vol 22, 559-563.
114. P. Schramel, I. Wendler, J. Angerer, The determination of metals (antimony,
bismuth, lead, cadmium, mercury, palladium, platinum, tellurium, thallium, tin and tungsten) in urine samples by inductively coupled plasma-mass spectrometry, Int Arch. Occup. Environmental Health 1997, Vol 69, 219-223.
115. H. Li, B.M. Keohane, H. Sun, P.J. Sadler, Determination of bismuth in serum
and urine by direct injection nebulization inductively coupled plasma mass spectrometry, Journal of Analytical Atomic Spectrometry 1997, Vol 12, 1111-1114.
116. S. Moyano, J.A. Gásquez, R. Olsina, E. Marchevsky, L.D. Martinez, Pre-
concentration system for bismuth determination in urine using FI-ICP- AES with ultrasonic nebulization, Journal of Analytical Atomic Spectrometry 1999, Vol 14, 259-262.
117. J.B.B. da Silva, M.B.O. Giacomelli, A.J. Curtius, Determination of bismuth
in aluminium and in steel by electrothermal atomic absorption spectrometry after on-line separation using a minicolumn of activated carbon, Analyst 1999, Vol 124, 1249-1253.

154
118. E.N. Pollock, S.J. West, The generation and determination of covalent hydrides by atomic absorption, Atomic Absorption Newsletters 1973, Vol 12, 6-8.
119. H.D. Fleming, R.G. Ide, Determination of volatile hydride-forming metals in
steel by atomic absorption spectrometry, Analytica Chimica Acta 1976, Vol 83, 67-82.
120. M. Bedard, J.D. Kerbyson, Determination of trace bismuth in copper by
hydride evolution atomic absorption spectrophotometry, Analytical Chemistry 1975, Vol 47, 1441-1444.
121. B. Vanloo, R. Dams, J. Hoste, Determination of bismuth and lead in steel
and cast iron by hydride generation and zeeman atomic absorption spectrometry, Analytica Chimica Acta 1983, Vol 151, 391-400.
122. O. Aöstrom, Flow injection analysis for the determination of bismuth by
atomic absorption spectrometry with hydride generation, Analytical Chemistry 1982, Vol 54, 190-193.
123. S. Moyano, R.G. Wuilloud, R.A. Olsina, J.A. Gásquez, L.D. Martinez, On-
line preconcentration system for bismuth determination in urine by flow injection hydride generation inductively coupled plasma atomic emission spectrometry, Talanta 2001, Vol 54, 211-219.
124. H. Matusiewicz, M. Kopras, A. Suszka, Hydride generation graphite furnace
atomic absorption determination of bismuth in clinical samples with in situ preconcentration, Microchemical Journal 1995, Vol 52, 282-289.
125. J. Murphy, G. Schlemmer, I.L. Shuttler, P. Jones, S.J. Hill SJ, Simultaneous
multi-multielement determination of hydride forming elements by “in-atomiser trapping” electrothermal atomic absorption spectrometry on an iridium-coated graphite tube, Journal of Analytical Atomic Spectrometry 1999, Vol 14, 1593-1600.
126. S.E. Manahan, Toxicological Chemistry and Biochemistry, 3rd Edition, CRC
Press LLC, USA, 2003. 127. M. Radojevic, V.N. Bashkin, Practical Environmental Analysis, The Royal
Society of Chemistry, Cambridge, 1999. 128. E. Lücker, Analysis of the distribution of lead, cadmium and mercury in the
avian kidney by means of direct solid sampling electrothermal atomic absorption spectrometry, Fresenius Journal of Analytical Chemistry 1997, Vol 358, 848-853.

155
129. C.G. Bruhn, N.A. San Francisco, J.Y. Neira, J.A. Nóbrega, Determination of cadmium and lead in mussels by tungsten coil electrothermal atomic absorption spectrometry, Talanta, 1999, Vol 50, 967-975.
130. C.G. Bruhn, J.Y. Neira, G.D. Valenzuela, J.A. Nobrega, Determination of
cadmium in hair and blood by tungsten coil electrothermal atomic absorption spectrometry with chemical modifiers, Talanta 1999, Vol 48, 537-549.
131. Y. Hirano, J. Nakajima, K. Oguma, Y. Terui, Determination of traces of
cadmium in natural water samples by flow injection on-line preconcentration-graphite furnace atomic absorption spectrometry, Analytical Sciences 2001, Vol 17, 1073-1077.
132. A. D'Ulivo, Y. Chen, Determination of cadmium in aqueous samples by
vapor generation with sodium tetraethylborate(III) reagent, Journal of Analytical Atomic Spectrometry 1989, Vol 4, 319-322.
133. M.C. Valdés-Hevia y Temprano, M.R. Fernández de la Campa, A. Sanz-
Medel, Generation of volatile cadmium species with sodium tetrahydroborate from organized media: application to cadmium determination by inductively coupled plasma atomic emission spectrometry, Journal of Analytical Atomic Spectrometry 1993, Vol 8, 847-852.
134. L. Ebdon, P. Goodall, S.J. Hill, P.B. Stockwell, K.C. Thompson, Ultra-trace
determination of cadmium by vapor generation atomic fluorescence spectrometry, Journal of Analytical Atomic Spectrometry 1993, Vol 8, 723-729.
135. L. Lampugnani, C. Salvetti, D.L Tsalev, Hydride generation atomic
absorption spectrometry with different flow systems and in-atomizer trapping for determination of cadmium in water and urine-overview of existing data on cadmium vapour generation and evaluation of critical parameters, Talanta 2003, Vol 61, 683-698.
136. C. Vargas-Razo, J.F. Tyson, Determination of cadmium by flow injection-
chemical vapor generation-atomic absorption spectrometry, Fresenius Journal of Analytical Chemistry 2000, Vol 366, 182-190.
137. Y.-L. Feng, R.E. Sturgeon, J.W. Lam, Generation of atomic and molecular
cadmium species from aqueous media, Analytical Chemistry 2003, Vol 75, 635-640.
138. X. Guo, X. Guo, Studies on the reaction between cadmium and potassium
tetrahydroborate in aqueous solution and its application in atomic fluorescence spectrometry, Analytica Chimica Acta 1995, Vol 310, 377-385.

156
139. T.-J. Hwang, S.-J. Jiang, Determination of cadmium by flow injection isotope dilution inductively coupled plasma mass spectrometry with vapour generation sample introduction, Journal of Analytical Atomic Spectrometry 1997, Vol 12, 579-584.
140. H.G. Infante, M.L.F. Sánchez, A. Sanz-Medel, Ultratrace determination of
cadmium by atomic absorption spectrometry using hydride generation with in-situ preconcentration in a palladium-coated graphite atomizer, Journal of Analytical Atomic Spectrometry 1996, Vol 11, 571-575.
141. H.G. Infante, M.L.F. Sanchez, A. Sanz Medel, Vesicular hydride generation
- In situ preconcentration - electrothermal atomic absorption spectrometry determination of sub-parts-per-billion levels of cadmium, Journal of Analytical Atomic Spectrometry 1997, Vol 12, 1333-1336.
142. P. Bermejo-Barrera, J. Moreda-Pinro, A. Moreda-Piniro, A. Bermejo-
Barrera, Use of flow injection cold vapour generation and preconcentration on coated graphite tubes for the determination of cadmium in sea-water by electrothermal atomic absorption spectrometry, Journal of Analytical Atomic Spectrometry 1996, Vol 11, 1081-1086.
143. M. Patriarca, A. Menditto, B. Rossi, T.D.B. Lyon, G.S. Fell, Environmental
exposure to metals of newborns, infants and young children, Microchemical Journal 2000, Vol 67, 351-361.
144. H.T. Odum, Heavy Metals in the Environment Using Wetlands for Their
Removal, CRC Press LLC, USA, 2000. 145. R.T. Daher, Trace metals (lead and cadmium exposure screening), Analytical
Chemistry 1995, Vol 67, 405R-409R. 146. Y. Zhou, R.A. Zanão, Jr F. Barbosa, P.J. Parsons, F.J. Krug, Investigations of
a W-Rh permanent modifier for the determination of Pb in blood by electrothermal atomic absorption spectrometry, Spectrochimica Acta Part B 2002, Vol 57, 1291-1300.
147. P.R.M. Correia, E. Oliveira, P.V. Oliveira, Simultaneous determination of Cd
and Pb in foodstufs by electrothermal atomic absorption spectrometry, Analytica Chimica Acta 2000, Vol 405, 205-211.
148. P.J. Parsons, H. Qiao, K.M. Aldous, E. Mills, W. Slavin, A low-cost tungsten
filament atomizer for measuring lead in blood by atomic absorption spectrometry, Spectrochimica Acta Part B 1995, Vol 50, 1475-1480.

157
149. Y. Zhou, P.J. Parsons, K.M. Aldous, P. Brockman, W. Slavin, Rhodium as permanent modifier for atomization of lead from biological fluids using tungsten flament electrothermal atomic absorption spectrometry, Spectrochimica Acta Part B 2002, Vol 57, 727-740.
150. K.C. Thompson, D.R. Thomerson, Atomic-absorption studies on
determination of antimony, arsenic, bismuth, germanium, lead, selenium, tellurium and tin by utilising the generation of covalent hydrides, Analyst 1974, Vol 99, 595-601.
151. P.N. Vijan, G.R. Wood, Semi-automated determination of lead by hydride
generation and atomic-absorption spectrophotometry, Analyst 1976, Vol 101, 966-973.
152. Y. Madrid, C. Camara, Lead hydride generation atomic absorption
spectrometry: an alternative to electrothermal atomic absorption spectrometry- A review, Analyst 1994, Vol 119, 1647-1658.
153. J. Li, Y. Liu, T. Lin, Determination of lead by hydride generation atomic
absorption spectrometry Part 1. A new medium for generating hydride, Analytica Chimica Acta 1990, Vol 231, 151-155.
154. S.-Z. Zhang, H.-B. Han, Z.-M. Ni, Determination of lead by hydride
generation atomic absorption spectrometry in the presence of nitroso-R salt, Analytica Chimica Acta 1989, Vol 221, 85-90.
155. H. Chen, F. Tang, C. Gu, I.D. Brindle, The influence of chelating reagents on
plumbane generation: determination of lead in the presence of PAN-S, Talanta 1993, Vol 40, 1147-1155.
156. G. Samanta, D. Chakraborti, Flow injection atomic absorption spectrometery
for the standardization of arsenic, lead and mercury in environmental and biological standard reference materials, Fresenius Journal of Analytical Chemistry 1997, Vol 357, 827-832.
157. H.O. Haug, Study on stable coatings for determination of lead by flow-
injection hydride generation and in situ concentration in graphite furnace atomic absorption spectrometry, Spectrochimica Acta Part B 1996, Vol 51, 1425-1433.
158. I.D. Brindle, R. McLaughlin, N. Tangtreamjitmun, Determination of lead in
calcium carbonate by flow-injection hydride generation with dc plasma atomic emission detection, Spectrochimica Acta Part B 1998, Vol 53, 1121-1129.

158
159. J.F. Tyson, R.I Ellis, G. Carnrick, F. Fernandez, Flow injection hydride generation electrothermal atomic absorption spectrometry with in-atomizer trapping for the determination of lead in calcium supplements, Talanta 2000, Vol 52, 403-410.
160. M. Ikeda, Nishibe, S. Hamada, R. Tujino, Determination of lead at the ng ml-1
level by reduction to plumbane and measurement by inductively-coupled plasma emission spectrometry, Analytica Chimica Acta 1981, Vol 125, 109-115.
161. J. Li, F. Lu, T. Umemura, K. Tsunoda, Determination of lead by hydride
generation inductively coupled plasma mass spectrometry, Analytica Chimica Acta 2000, Vol 419, 65-72.
162. S. Chen, Z. Zhang, H. Yu, W. Liu, M. Sun, Determination of trace lead by
hydride generation-inductively coupled plasma-mass spectrometry, Analytica Chimica Acta 2002, Vol 463, 177-188.
163. P. Bermejo-Barrera, J. Moreda-Piniro, A. Moreda-Piniro, A. Bermejo-
Barrera, Direct trace determination of lead in estuarine water using in situ preconcentration of lead hydride on Ir, Zr and W-coated graphite tubes, Analytica Chimica Acta 1998, Vol 368, 281-289.
164. D.K. Korkmaz, N. Erta, O.Y. Ataman, A novel silica trap for lead
determination by hydride generation atomic absorption spectrometry, Spectrochimica Acta Part B 2002, Vol 57, 571-580.
165. T. Matoušek, M. Johansson, J. Ddina, W. Frech, Spatially resolved
Absorption measurements of antimony atom formation and dissipation in quartz tube atomizers following hydride generation, Spectrochimica Acta Part B 1999, Vol 54, 631-643.
166. Z.F. Queiroz, P.V. Oliveira, J.A. Nobrega, C.S. Silva, I.A. Rufini, S.S. de
Sousa, F.J. Krug, Surface and gas phase temperatures of a tungsten coil atomizer, Spectrochimica Acta Part B 2002, Vol 57, 1789-1799.
167. D.T. Burns, N. Chimpalee, M. Harriott, Applications of a slotted tube atom
trap and flame atomic absorption spectrometry: determination of bismuth in copper-based alloys with and without hydride generation, Analytica Chimica Acta 1995, Vol 311, 93-97.
168. O. Cankur, O.Y. Ataman, Effect of exhaustion hood flow rate in flow
injection cold vapor and hydride generation atomic absorption spectrometry, Analytical Letters 2004, Vol 37, 1025-1034.

159
VITA
Oktay Cankur was born in Bandırma, Balıkasir on June 23, 1974. He was
graduated from Göl Öretmen Lisesi, Kastamonu in 1990. He received his B.S.
degree from the Chemistry Education Department of the Middle East Technical
University. He received his M.S. degree from Chemistry Department of the same
university in 1998. Then, he started his PhD studies in the same year. He worked
as teaching assistant in chemistry Department of Middle East Technical University
between 1995 and 2004.