Embed Size (px)
Citation preview

2008, Aptima, Inc. 1
www.aptima.com
Boston ▪ DC ▪ Dayton
© 2008, Aptima, Inc.
Improving the Display of River and Flash Flood Predictions
HIC Conference
Lawrence Wolpert, Jared Freeman, Yuri Levchuk, Tom Aten, Daniel SerfatyMary Mullusky, Pedro Restrepo, Donna Page
July 30, 2008
2008, Aptima, Inc. 2
Overview
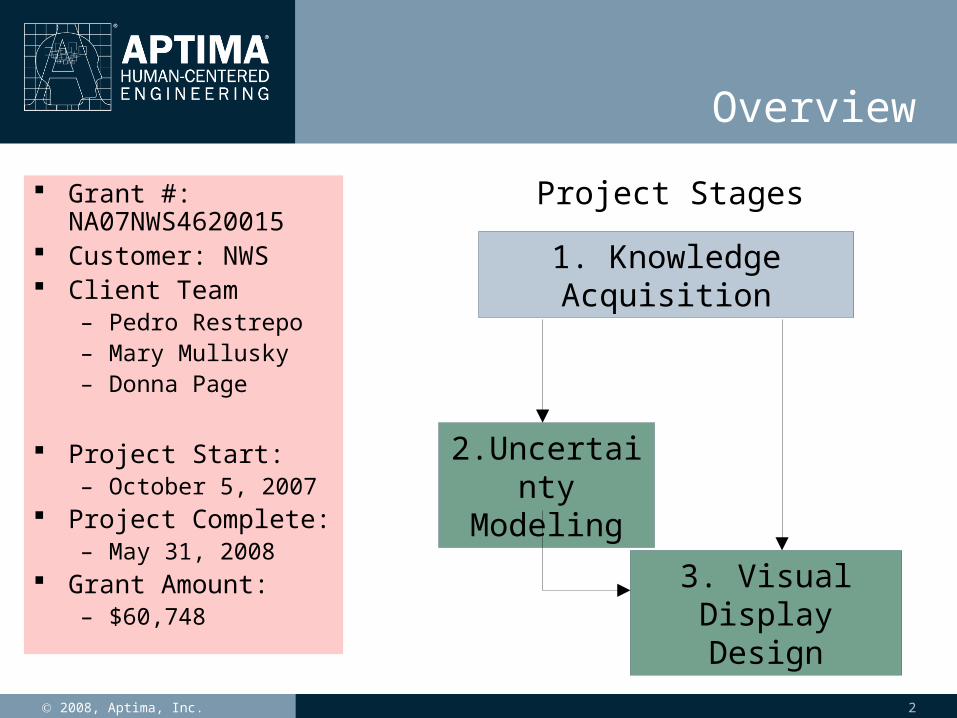
Grant #: NA07NWS4620015
Customer: NWS Client Team
– Pedro Restrepo– Mary Mullusky– Donna Page
Project Start:– October 5, 2007
Project Complete:– May 31, 2008
Grant Amount:– $60,748
Project Stages
1. Knowledge Acquisition
2.Uncertainty Modeling
3. Visual Display Design

2008, Aptima, Inc. 3
Task 1: Knowledge Acquisition through
Interviews and Group Discussions
Participants– 2 Hydrologists– 6 Emergency Managers– 2 Red Cross Disaster
Coordinators– Flood Evacuation Shelter
Operator– Dam Operator– 2 Fly Fishermen – 3 Kayakers – TV Weather Reporter– 6 NWS Employees
Interviews conducted either in person or by phone

2008, Aptima, Inc. 4
Deliverables from Task 1: Stakeholder Profiles
Job Role: Emergency Manager Key Tasks Goals/Objectives Events/Decisions/Actions Key Risks & Mitigation
Strategies Data Requirements Social Interactions Knowledge & Skills Beliefs & Values
Modeling Task:
Model uncertainty in
- environmental data
- NWS models
- Users
Visual display design task:Develop visualization techniques and displays to convey critical information

2008, Aptima, Inc. 5
Task 2:Uncertainty Model
Purpose– Identify the sources/types of uncertainty related to predicting,
communicating, and acting upon flood events.– Identify ways to factor uncertainty estimates into the decision-making
processes of each community of interest to improve overall quality and efficiency of outcomes.
– Determine what each community of interest needs to know about the uncertainty that exists to assess potential risks and choose a course of action.
Method– Analytical investigation and integration of uncertainty research from
multiple disciplines. Probability theory Categorization theory Perception theory
Deliverables– Description of the model of uncertainty and how it can be used to
enhance decision-making.

2008, Aptima, Inc. 6
Overview of Uncertainty Model

2008, Aptima, Inc. 7
Components of a Mental Model for EMs
Flood events Contingency events Scenarios Impact of flooding Courses of action (COA)

2008, Aptima, Inc. 8
High-value information itemsfor EMs, implied by our model
Flood precursor signatures– (time-stamped) patterns of events and conditions likely to cause the
flooding– causes; conditions thresholds
Worst case envelop– (sets of) adverse events with sufficiently high likelihood of
occurrence– effects; threats; triggers
Horizon of predictability and spread of envelop uncertainty– probabilistic uncertainty measures (e.g., predicted standard
deviation) for how far into the future the confidence of predictions extends and how many deviations of the flooding scenario are likely (and should be accounted for in emergency planning)

2008, Aptima, Inc. 9
Model-Based Quality of Service metrics
Value captured– value to EMs of all the information presented at the NWS website
Opportunity cost or loss– value of available (or easily extractable) information not presented
Navigation overhead– overhead of dealing with information that potentially obscures navigation to
more useful information
Salience of information– relevance of information at the NWS website to EM’s mission
Compactness of representation – conciseness of representation and associated cognitive load (for reviewing,
analyzing, and memorizing the information)
Clarity– ease of detecting and understanding the key triggers (e.g., events) and their
implications from the information presented

2008, Aptima, Inc. 10
Model-based Recommendations for Information Organization and
Depiction
Add symbolically annotated anticipated weather events– visualize prospective flood scenarios– automate search for similar flood scenarios from historical data archives– present probable dynamics of predicted flood conditions via time-spaced
geography-linked local weather event evolution maps
Depict likely scenarios – with resulting events– store local map images of past flood effects – time stamped –with overlaid
markers for adverse effects– use “nearest close neighborhood” metrics of scenario similarities to pull up
candidate scenarios from own histories and from those of other EMs
Combine horizon of predictability and spread of envelop uncertainty visualizations with icon representations of probable events and adverse weather conditions – Automate translating continuous uncertainty metrics (e.g., deviations,
ensemble averages, etc.) into specific representative and worst-case discrete event scenarios

2008, Aptima, Inc. 11 2008, Aptima, Inc. 11 2008, Aptima, Inc. 11
Task 3: Visual Display Design
Support EMs’ decision making regarding courses of action.
– Visualizations of river forecasts with uncertainty
– Visualizations of “impact” of various flooding scenarios
Visualization of uncertainty model inputs for clear understanding of “why” predictions are what they are.
Allow for local knowledge to be incorporated into predictions
Fusion / organization of information for clear understanding of relationship to one another and enhanced orientation.
2008, Aptima, Inc. 12 2008, Aptima, Inc. 12 2008, Aptima, Inc. 12
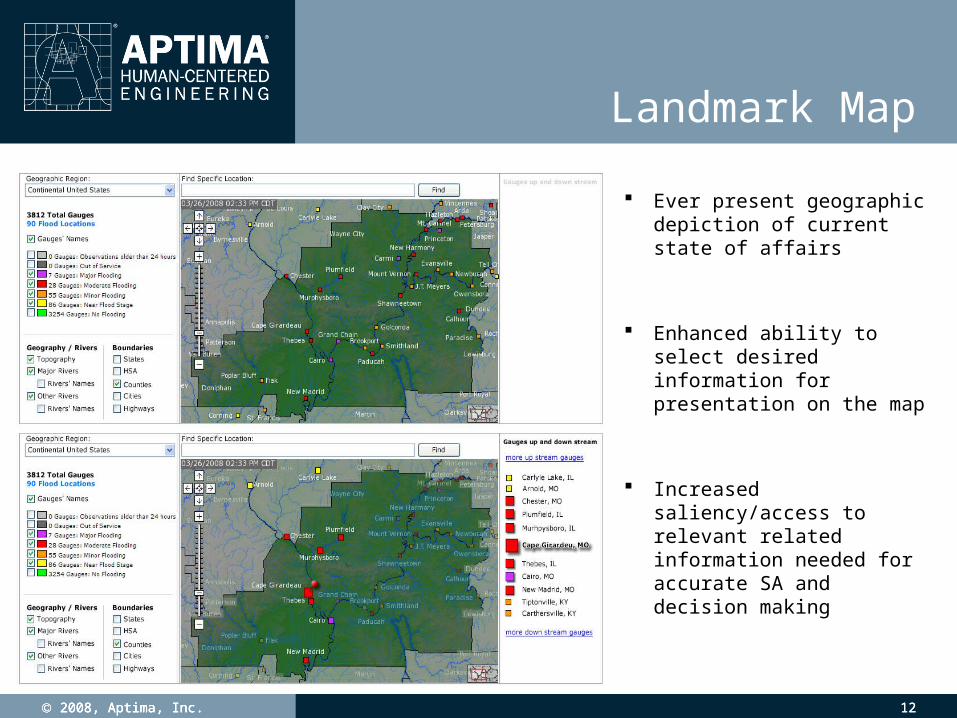
Landmark Map
Ever present geographic depiction of current state of affairs
Enhanced ability to select desired information for presentation on the map
Increased saliency/access to relevant related information needed for accurate SA and decision making

2008, Aptima, Inc. 13 2008, Aptima, Inc. 13 2008, Aptima, Inc. 13
River Height/Flow Prediction with Uncertainty
Visual depiction of “river forecast” in terms of height / flow
– Clear depiction of uncertainty with cone of uncertainty
Visualization of model parameters with ability of the EM to apply local knowledge.

2008, Aptima, Inc. 14 2008, Aptima, Inc. 14 2008, Aptima, Inc. 14
River Extent Prediction Visualizations
Visualization of river extent for given point selected in the river prediction of flow/height Stage, Likelihood and Confidence of a selected point Impact of given scenario shown (items affected)

2008, Aptima, Inc. 15 2008, Aptima, Inc. 15 2008, Aptima, Inc. 15
Interplay of Visualizations Enhanced Fusion / organization of
information for enhanced decision making– Clear understanding of relationship– Easy access to needed information for decision
making

2008, Aptima, Inc. 16 2008, Aptima, Inc. 16 2008, Aptima, Inc. 16
Further Detail Regarding Flood’s Impact
Provide further understanding of implications of flood at a:– Global level
– Individual variable level
Current and Future river impact predictions shown Additional understanding provided through references to similar previous
floods

National Weather Service
NWS Next StepsNWS Next Steps
Quantitatively assess Aptima’s User Interface Quantitatively assess Aptima’s User Interface with the upcoming customer satisfaction with the upcoming customer satisfaction surveysurvey
Present ideas to Ensemble Product Present ideas to Ensemble Product Generation group as possible forecaster Generation group as possible forecaster interface in CHPS/FEWS/XEFSinterface in CHPS/FEWS/XEFS
Move some elements forward on the AHPS Move some elements forward on the AHPS web pagesweb pages
1717