Embed Size (px)
Citation preview
NYSERDA TRANSPORTATION PROGRAM MARKET CHARACTERIZATION REPORT
Volume 3: Electric Vehicles Market Characterization and Baseline Assessment
Final
Prepared For:
New York State Energy Research and Development Authority (NYSERDA) Albany, NY
Jennifer Phelps, NYSERDA Project Manager
Prepared By:
Industrial Economics, Incorporated (IEc) Cambridge, Massachusetts
Cynthia Manson, Project Manager
NYSERDA Contract 32883 May 2017

Notice This report was prepared by Industrial Economics, Inc. in the course of performing work contracted for and sponsored by the New York State Energy Research and Development Authority (hereafter “NYSERDA”). The opinions expressed in this report do not necessarily reflect those of NYSERDA or the State of New York, and reference to any specific product, service, process, or method does not constitute an implied or expressed recommendation or endorsement of it. Further, NYSERDA, the State of New York, and the contractor make no warranties or representations, expressed or implied, as to the fitness for particular purpose or merchantability of any product, apparatus, or service, or the usefulness, completeness, or accuracy of any processes, methods, or other information contained, described, disclosed, or referred to in this report. NYSERDA, the State of New York, and the contractor make no representation that the use of any product, apparatus, process, method, or other information will not infringe privately owned rights and will assume no liability for any loss, injury, or damage resulting from, or occurring in connection with, the use of information contained, described, disclosed, or referred to in this report.
NYSERDA makes every effort to provide accurate information about copyright owners and related matters in the reports we publish. Contractors are responsible for determining and satisfying copyright or other use restrictions regarding the content of reports that they write, in compliance with NYSERDA’s policies and federal law. If you are the copyright owner and believe a NYSERDA report has not properly attributed your work to you or has used it without permission, please email [email protected].
i

Table of Contents Notice .......................................................................................................................................................... i
Table of Contents ........................................................................................................................................ ii
List of Tables and Figures .......................................................................................................................... ii
1. Introduction .................................................................................................................................... 1
2. Gaps and Barriers in Electric Vehicle Market ............................................................................ 4
2.1 Consumer Awareness ......................................................................................................... 4
2.2 Other Technical, Economic, and Policy Barriers ................................................................ 7
3. Key Market Actors ...................................................................................................................... 11
3.1 Participation in EV Awareness Programs ......................................................................... 11
3.2 Composition of Supply-Side Electric Vehicle Market ..................................................... 14
4. Baseline Indicator Values ............................................................................................................ 16
5. Conclusions ................................................................................................................................... 20
6. Methods ......................................................................................................................................... 23
7. References ..................................................................................................................................... 25
List of Tables and Figures Table 1-1. Summary of Evaluation Objectives and Methods ....................................................................... 2
Table 2-1. Summary of Edelman Intelligence Survey Results ..................................................................... 5
Table 4-1. Outputs, Outcomes, and Indicators ............................................................................................ 17
Figure 4-1. Charging Station Distribution across New York State ............................................................. 19
ii
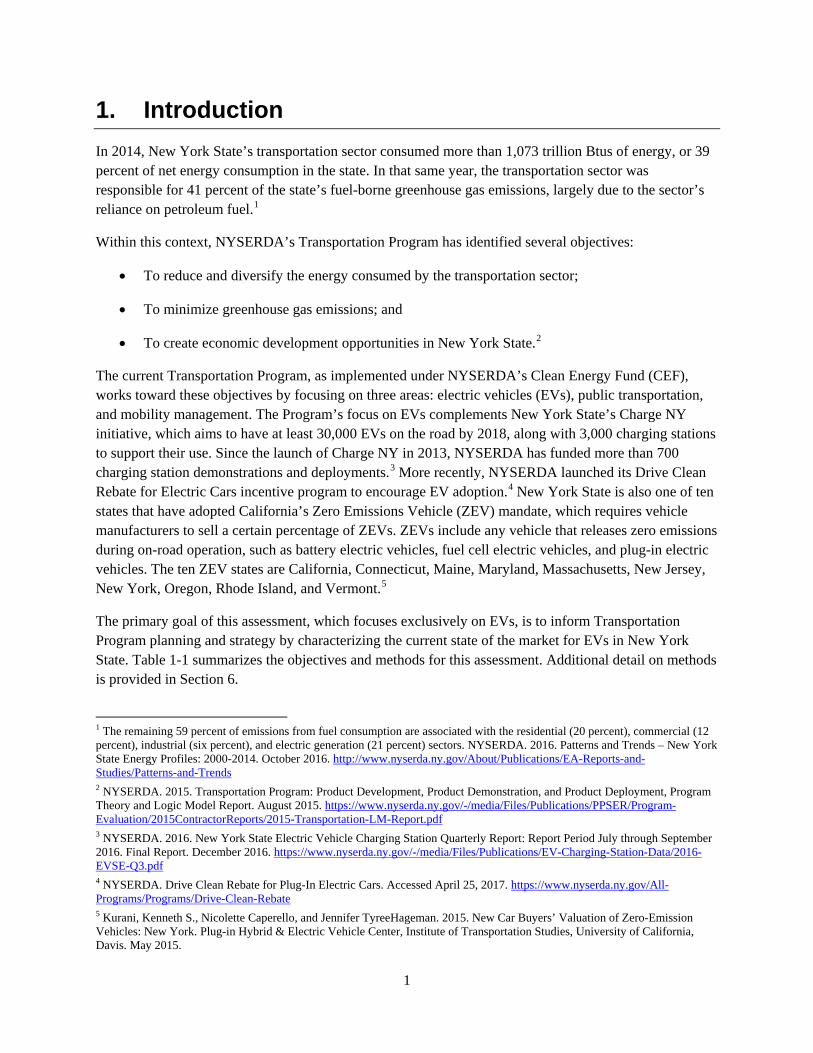
1. Introduction In 2014, New York State’s transportation sector consumed more than 1,073 trillion Btus of energy, or 39 percent of net energy consumption in the state. In that same year, the transportation sector was responsible for 41 percent of the state’s fuel-borne greenhouse gas emissions, largely due to the sector’s reliance on petroleum fuel.1
Within this context, NYSERDA’s Transportation Program has identified several objectives:
• To reduce and diversify the energy consumed by the transportation sector;
• To minimize greenhouse gas emissions; and
• To create economic development opportunities in New York State.2
The current Transportation Program, as implemented under NYSERDA’s Clean Energy Fund (CEF), works toward these objectives by focusing on three areas: electric vehicles (EVs), public transportation, and mobility management. The Program’s focus on EVs complements New York State’s Charge NY initiative, which aims to have at least 30,000 EVs on the road by 2018, along with 3,000 charging stations to support their use. Since the launch of Charge NY in 2013, NYSERDA has funded more than 700 charging station demonstrations and deployments.3 More recently, NYSERDA launched its Drive Clean Rebate for Electric Cars incentive program to encourage EV adoption.4 New York State is also one of ten states that have adopted California’s Zero Emissions Vehicle (ZEV) mandate, which requires vehicle manufacturers to sell a certain percentage of ZEVs. ZEVs include any vehicle that releases zero emissions during on-road operation, such as battery electric vehicles, fuel cell electric vehicles, and plug-in electric vehicles. The ten ZEV states are California, Connecticut, Maine, Maryland, Massachusetts, New Jersey, New York, Oregon, Rhode Island, and Vermont.5
The primary goal of this assessment, which focuses exclusively on EVs, is to inform Transportation Program planning and strategy by characterizing the current state of the market for EVs in New York State. Table 1-1 summarizes the objectives and methods for this assessment. Additional detail on methods is provided in Section 6.
1 The remaining 59 percent of emissions from fuel consumption are associated with the residential (20 percent), commercial (12 percent), industrial (six percent), and electric generation (21 percent) sectors. NYSERDA. 2016. Patterns and Trends – New York State Energy Profiles: 2000-2014. October 2016. http://www.nyserda.ny.gov/About/Publications/EA-Reports-and-Studies/Patterns-and-Trends 2 NYSERDA. 2015. Transportation Program: Product Development, Product Demonstration, and Product Deployment, Program Theory and Logic Model Report. August 2015. https://www.nyserda.ny.gov/-/media/Files/Publications/PPSER/Program-Evaluation/2015ContractorReports/2015-Transportation-LM-Report.pdf 3 NYSERDA. 2016. New York State Electric Vehicle Charging Station Quarterly Report: Report Period July through September 2016. Final Report. December 2016. https://www.nyserda.ny.gov/-/media/Files/Publications/EV-Charging-Station-Data/2016-EVSE-Q3.pdf 4 NYSERDA. Drive Clean Rebate for Plug-In Electric Cars. Accessed April 25, 2017. https://www.nyserda.ny.gov/All-Programs/Programs/Drive-Clean-Rebate 5 Kurani, Kenneth S., Nicolette Caperello, and Jennifer TyreeHageman. 2015. New Car Buyers’ Valuation of Zero-Emission Vehicles: New York. Plug-in Hybrid & Electric Vehicle Center, Institute of Transportation Studies, University of California, Davis. May 2015.
1
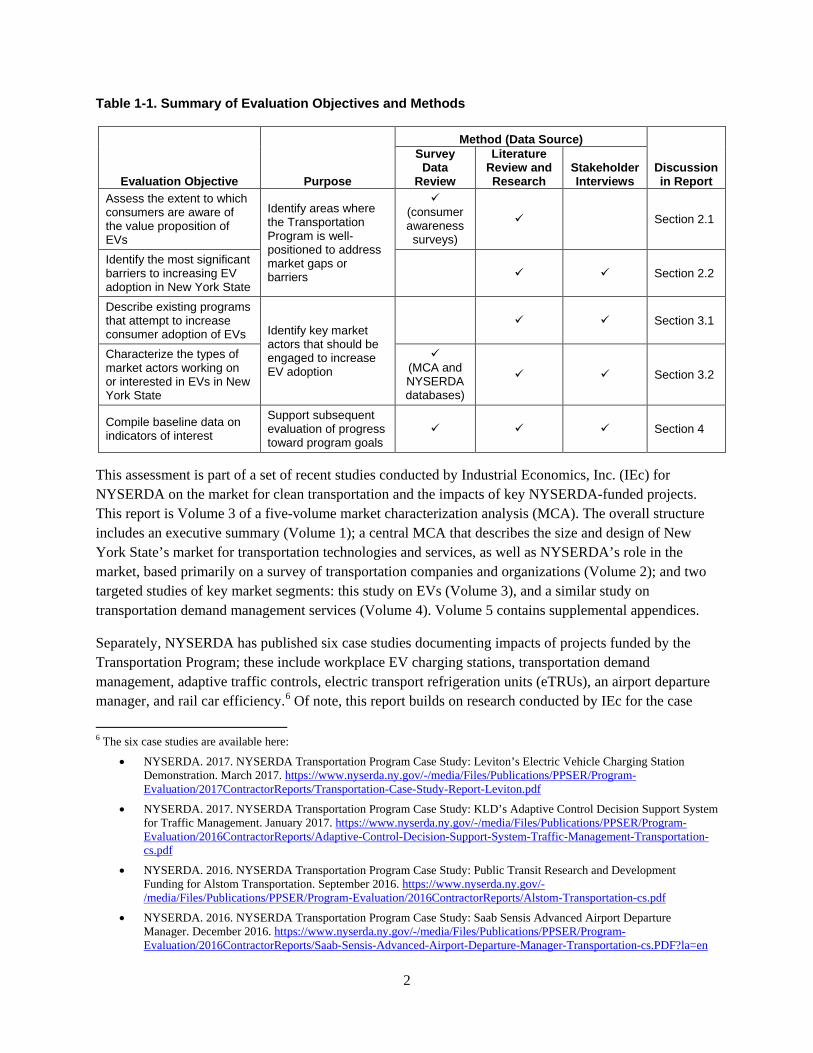
Table 1-1. Summary of Evaluation Objectives and Methods
Evaluation Objective Purpose
Method (Data Source)
Discussion in Report
Survey Data
Review
Literature Review and Research
Stakeholder Interviews
Assess the extent to which consumers are aware of the value proposition of EVs
Identify areas where the Transportation Program is well-positioned to address market gaps or barriers
(consumer awareness surveys)
Section 2.1
Identify the most significant barriers to increasing EV adoption in New York State
Section 2.2
Describe existing programs that attempt to increase consumer adoption of EVs Identify key market
actors that should be engaged to increase EV adoption
Section 3.1
Characterize the types of market actors working on or interested in EVs in New York State
(MCA and NYSERDA databases)
Section 3.2
Compile baseline data on indicators of interest
Support subsequent evaluation of progress toward program goals
Section 4
This assessment is part of a set of recent studies conducted by Industrial Economics, Inc. (IEc) for NYSERDA on the market for clean transportation and the impacts of key NYSERDA-funded projects. This report is Volume 3 of a five-volume market characterization analysis (MCA). The overall structure includes an executive summary (Volume 1); a central MCA that describes the size and design of New York State’s market for transportation technologies and services, as well as NYSERDA’s role in the market, based primarily on a survey of transportation companies and organizations (Volume 2); and two targeted studies of key market segments: this study on EVs (Volume 3), and a similar study on transportation demand management services (Volume 4). Volume 5 contains supplemental appendices.
Separately, NYSERDA has published six case studies documenting impacts of projects funded by the Transportation Program; these include workplace EV charging stations, transportation demand management, adaptive traffic controls, electric transport refrigeration units (eTRUs), an airport departure manager, and rail car efficiency.6 Of note, this report builds on research conducted by IEc for the case
6 The six case studies are available here:
• NYSERDA. 2017. NYSERDA Transportation Program Case Study: Leviton’s Electric Vehicle Charging Station Demonstration. March 2017. https://www.nyserda.ny.gov/-/media/Files/Publications/PPSER/Program-Evaluation/2017ContractorReports/Transportation-Case-Study-Report-Leviton.pdf
• NYSERDA. 2017. NYSERDA Transportation Program Case Study: KLD’s Adaptive Control Decision Support System for Traffic Management. January 2017. https://www.nyserda.ny.gov/-/media/Files/Publications/PPSER/Program-Evaluation/2016ContractorReports/Adaptive-Control-Decision-Support-System-Traffic-Management-Transportation-cs.pdf
• NYSERDA. 2016. NYSERDA Transportation Program Case Study: Public Transit Research and Development Funding for Alstom Transportation. September 2016. https://www.nyserda.ny.gov/-/media/Files/Publications/PPSER/Program-Evaluation/2016ContractorReports/Alstom-Transportation-cs.pdf
• NYSERDA. 2016. NYSERDA Transportation Program Case Study: Saab Sensis Advanced Airport Departure Manager. December 2016. https://www.nyserda.ny.gov/-/media/Files/Publications/PPSER/Program-Evaluation/2016ContractorReports/Saab-Sensis-Advanced-Airport-Departure-Manager-Transportation-cs.PDF?la=en
2
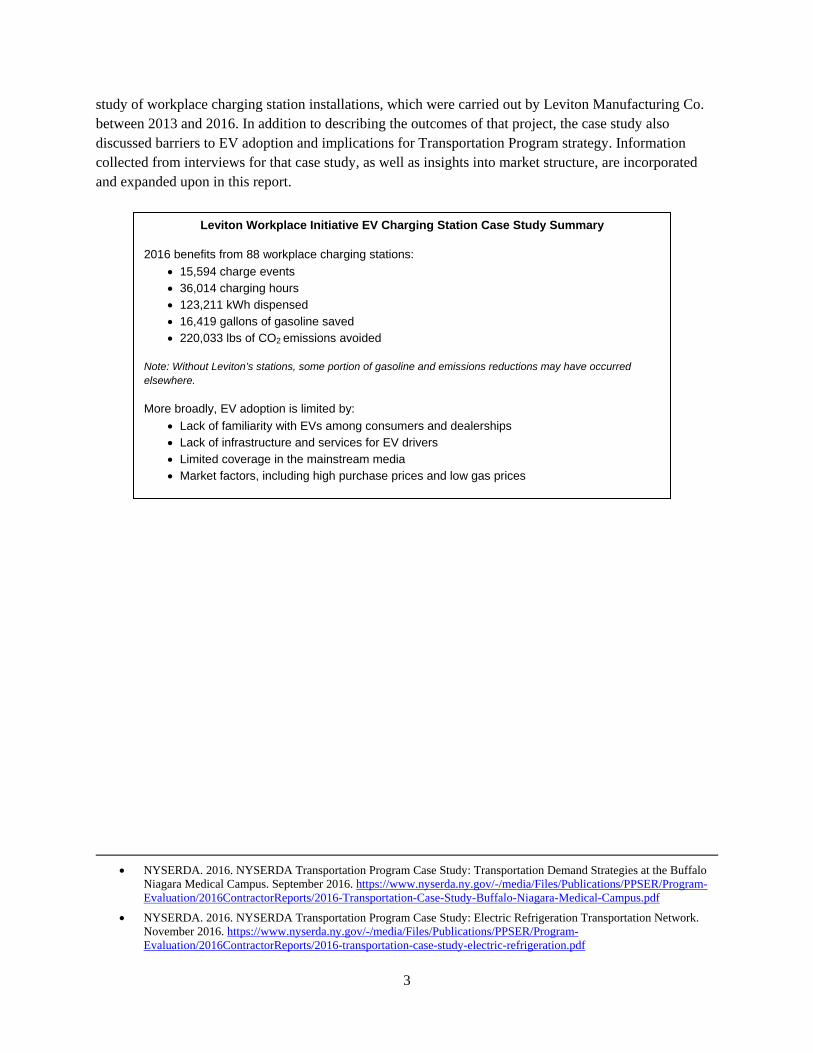
study of workplace charging station installations, which were carried out by Leviton Manufacturing Co. between 2013 and 2016. In addition to describing the outcomes of that project, the case study also discussed barriers to EV adoption and implications for Transportation Program strategy. Information collected from interviews for that case study, as well as insights into market structure, are incorporated and expanded upon in this report.
• NYSERDA. 2016. NYSERDA Transportation Program Case Study: Transportation Demand Strategies at the Buffalo Niagara Medical Campus. September 2016. https://www.nyserda.ny.gov/-/media/Files/Publications/PPSER/Program-Evaluation/2016ContractorReports/2016-Transportation-Case-Study-Buffalo-Niagara-Medical-Campus.pdf
• NYSERDA. 2016. NYSERDA Transportation Program Case Study: Electric Refrigeration Transportation Network. November 2016. https://www.nyserda.ny.gov/-/media/Files/Publications/PPSER/Program-Evaluation/2016ContractorReports/2016-transportation-case-study-electric-refrigeration.pdf
Leviton Workplace Initiative EV Charging Station Case Study Summary
2016 benefits from 88 workplace charging stations: • 15,594 charge events • 36,014 charging hours • 123,211 kWh dispensed • 16,419 gallons of gasoline saved • 220,033 lbs of CO2 emissions avoided
Note: Without Leviton’s stations, some portion of gasoline and emissions reductions may have occurred elsewhere.
More broadly, EV adoption is limited by: • Lack of familiarity with EVs among consumers and dealerships • Lack of infrastructure and services for EV drivers • Limited coverage in the mainstream media • Market factors, including high purchase prices and low gas prices
3
2. Gaps and Barriers in Electric Vehicle Market The following section discusses key gaps and barriers in the market for EVs in New York State. Section 2.1 details barriers specifically associated with consumer awareness and acceptance of EVs, which the Transportation Program has identified as a priority under the CEF, and Section 2.2 details other technical, economic, and policy barriers to EV adoption. The discussion highlights areas where NYSERDA is well-positioned to promote solutions to the barriers.
2.1 Consumer Awareness Consumer awareness remains a significant barrier to EV adoption nationally as well as in New York State. Literature review and interviews indicated that, across the country, consumers generally lack knowledge and confidence in EV technology. Specifically, consumers may not know how to find public charging stations or how much time is required for charging, and may have concerns about EV safety, maintenance, battery life and range. Consumers also generally lack knowledge of the benefits of EVs compared to conventional vehicles.7
To understand current gaps in consumer awareness in New York State, this assessment considered three recent surveys of likely car buyers that were developed in partnership with NYSERDA. These three surveys – conducted by Edelman Intelligence, the University of California (UC), Davis, and Essense – differed in content and sampling approach, but all focused on understanding consumer awareness and interest in EVs:
• The Edelman Intelligence survey, conducted in 2016, focused on exploring levels of awareness and current EV perceptions among different regions and demographics, to inform marketing campaigns. The survey was conducted in two stages, with approximately 1,000 respondents nationally in the first stage, plus oversamples in eight states (California, Connecticut, Maryland, Massachusetts, New York, Oregon, Rhode Island, and Vermont). Overall, the New York State sample includes 278 individuals. The survey was limited to likely car buyers, defined as individuals planning to buy or lease a new vehicle in the next 12 months.
• The UC Davis survey, conducted in 2015, focused on measuring new-car buyers’ awareness, knowledge, experience, and valuation of EVs using an online survey and vehicle design game. The survey focused on comparing results in California to other states, including those with ZEV sales requirements. The states included in the survey were: California, Connecticut, Delaware, Maine, Maryland, Massachusetts, New Hampshire, New Jersey, New York, Oregon, Rhode Island, Vermont, and Washington. The sample in New York State included 997 respondents.
• The Essense survey, conducted in 2016, focused on understanding current car ownership behaviors, preferences, and perceptions related to EVs among New York State residents who own at least one car. This survey was developed to inform NYSERDA’s EV marketing campaigns.
7 Interview with Neil Miller, Manager of Business Development at Leviton (formerly). Conducted September 8, 2016; Interview with Adam Ruder, Program Manager at NYSERDA. Conducted February 15, 2017; NYSERDA. 2016. Electric Vehicle Charging Station Implementation Plans for the Upstate New York I-90 Corridor. August 2016. https://www.nyserda.ny.gov/-/media/Files/Publications/Research/Transportation/16-28-ev-charging-station-implementation.pdf
4
Unlike the Edelman Intelligence and UC Davis surveys, this survey was open to all New York State residents with at least one car and did not attempt to ensure a representative sample along key demographics. Consequently, the results of this survey cannot be interpreted as reflecting the behaviors and opinions of New York State residents as a whole, but the survey provides interesting insights into reasons why consumers are not considering purchasing EVs.
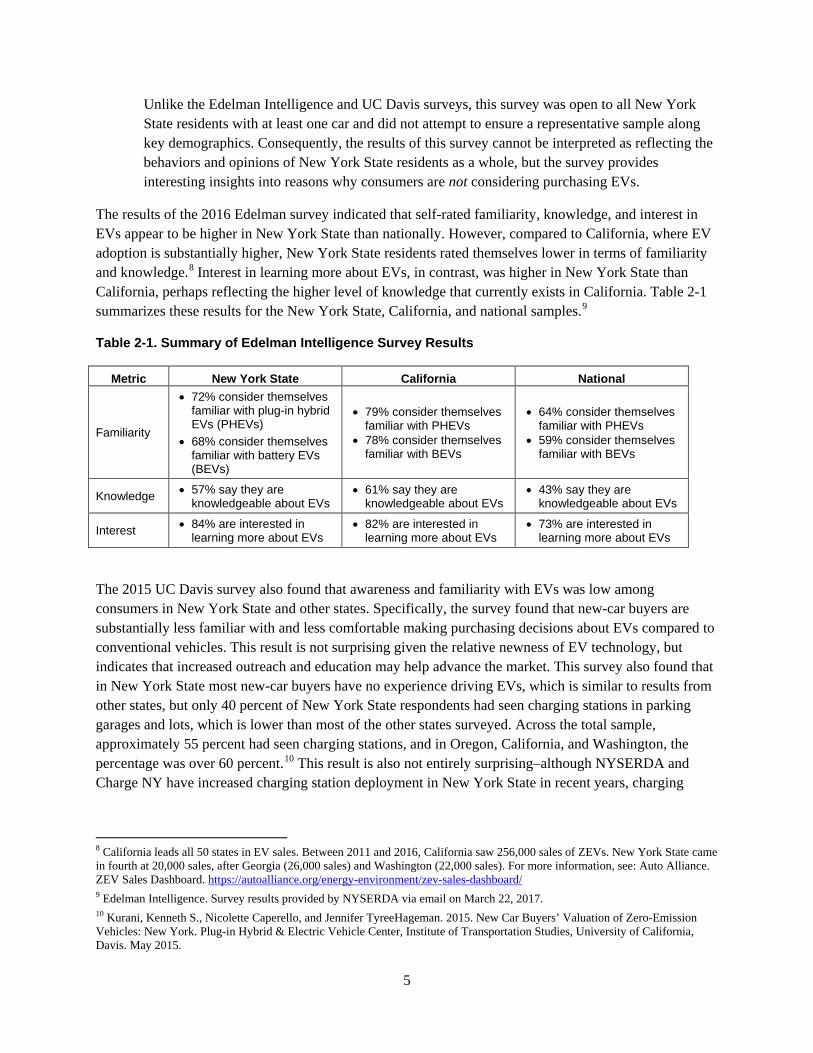
The results of the 2016 Edelman survey indicated that self-rated familiarity, knowledge, and interest in EVs appear to be higher in New York State than nationally. However, compared to California, where EV adoption is substantially higher, New York State residents rated themselves lower in terms of familiarity and knowledge.8 Interest in learning more about EVs, in contrast, was higher in New York State than California, perhaps reflecting the higher level of knowledge that currently exists in California. Table 2-1 summarizes these results for the New York State, California, and national samples.9
Table 2-1. Summary of Edelman Intelligence Survey Results
Metric New York State California National
Familiarity
• 72% consider themselves familiar with plug-in hybrid EVs (PHEVs)
• 68% consider themselves familiar with battery EVs (BEVs)
• 79% consider themselves familiar with PHEVs
• 78% consider themselves familiar with BEVs
• 64% consider themselves familiar with PHEVs
• 59% consider themselves familiar with BEVs
Knowledge • 57% say they are knowledgeable about EVs
• 61% say they are knowledgeable about EVs
• 43% say they are knowledgeable about EVs
Interest • 84% are interested in learning more about EVs
• 82% are interested in learning more about EVs
• 73% are interested in learning more about EVs
The 2015 UC Davis survey also found that awareness and familiarity with EVs was low among consumers in New York State and other states. Specifically, the survey found that new-car buyers are substantially less familiar with and less comfortable making purchasing decisions about EVs compared to conventional vehicles. This result is not surprising given the relative newness of EV technology, but indicates that increased outreach and education may help advance the market. This survey also found that in New York State most new-car buyers have no experience driving EVs, which is similar to results from other states, but only 40 percent of New York State respondents had seen charging stations in parking garages and lots, which is lower than most of the other states surveyed. Across the total sample, approximately 55 percent had seen charging stations, and in Oregon, California, and Washington, the percentage was over 60 percent.10 This result is also not entirely surprising–although NYSERDA and Charge NY have increased charging station deployment in New York State in recent years, charging
8 California leads all 50 states in EV sales. Between 2011 and 2016, California saw 256,000 sales of ZEVs. New York State came in fourth at 20,000 sales, after Georgia (26,000 sales) and Washington (22,000 sales). For more information, see: Auto Alliance. ZEV Sales Dashboard. https://autoalliance.org/energy-environment/zev-sales-dashboard/ 9 Edelman Intelligence. Survey results provided by NYSERDA via email on March 22, 2017. 10 Kurani, Kenneth S., Nicolette Caperello, and Jennifer TyreeHageman. 2015. New Car Buyers’ Valuation of Zero-Emission Vehicles: New York. Plug-in Hybrid & Electric Vehicle Center, Institute of Transportation Studies, University of California, Davis. May 2015.
5
stations are still located at only 832 sites statewide.11 Awareness and familiarity, as measured by both surveys, will likely benefit from NYSERDA’s recent EV efforts, including charging station deployments that have occurred since the 2015 UC Davis survey and the highly-publicized Drive Clean Rebate for Electric Cars.
Finally, the 2016 Essense survey also showed room for improvements in knowledge and perceptions of EVs. Although 63 percent of respondents surveyed were strongly or slightly considering an EV for their next car purchase, those who were not considering an EV cited as reasons a number of negative or uncertain perceptions, some of which reflect gaps in information that could potentially be addressed. These included: fear of the unknown (30 percent), technology isn’t ready (13 percent), charging problem (21 percent), don’t know enough (11 percent), and cost (8 percent).12 Although not necessarily representative of the statewide population, these findings suggest that consumers could benefit from additional information on the costs, benefits, and logistics of EV ownership.
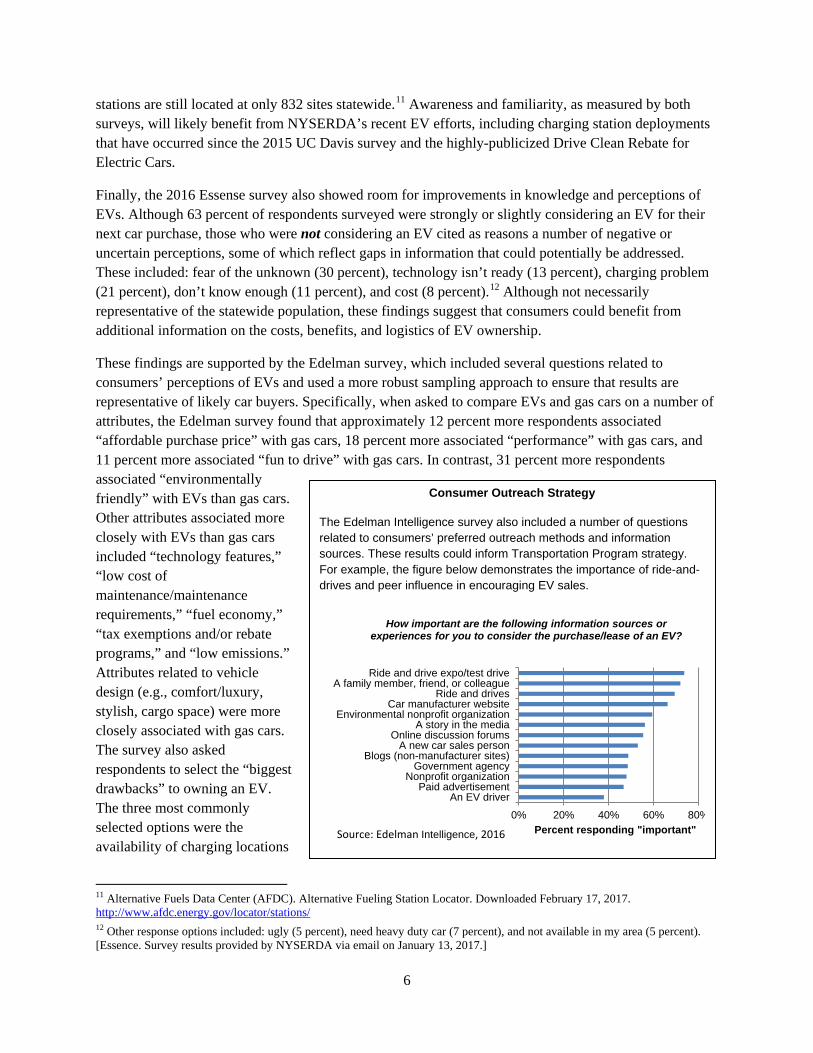
These findings are supported by the Edelman survey, which included several questions related to consumers’ perceptions of EVs and used a more robust sampling approach to ensure that results are representative of likely car buyers. Specifically, when asked to compare EVs and gas cars on a number of attributes, the Edelman survey found that approximately 12 percent more respondents associated “affordable purchase price” with gas cars, 18 percent more associated “performance” with gas cars, and 11 percent more associated “fun to drive” with gas cars. In contrast, 31 percent more respondents associated “environmentally friendly” with EVs than gas cars. Other attributes associated more closely with EVs than gas cars included “technology features,” “low cost of maintenance/maintenance requirements,” “fuel economy,” “tax exemptions and/or rebate programs,” and “low emissions.” Attributes related to vehicle design (e.g., comfort/luxury, stylish, cargo space) were more closely associated with gas cars. The survey also asked respondents to select the “biggest drawbacks” to owning an EV. The three most commonly selected options were the availability of charging locations
11 Alternative Fuels Data Center (AFDC). Alternative Fueling Station Locator. Downloaded February 17, 2017. http://www.afdc.energy.gov/locator/stations/ 12 Other response options included: ugly (5 percent), need heavy duty car (7 percent), and not available in my area (5 percent). [Essence. Survey results provided by NYSERDA via email on January 13, 2017.]
Consumer Outreach Strategy
The Edelman Intelligence survey also included a number of questions related to consumers’ preferred outreach methods and information sources. These results could inform Transportation Program strategy. For example, the figure below demonstrates the importance of ride-and-drives and peer influence in encouraging EV sales.
0% 20% 40% 60% 80%
An EV driverPaid advertisement
Nonprofit organizationGovernment agency
Blogs (non-manufacturer sites)A new car sales person
Online discussion forumsA story in the media
Environmental nonprofit organizationCar manufacturer website
Ride and drivesA family member, friend, or colleague
Ride and drive expo/test drive
Percent responding "important"
How important are the following information sources or experiences for you to consider the purchase/lease of an EV?
Source: Edelman Intelligence, 2016
6

(34 percent of respondents), time required to re-charge the vehicle (30 percent), and battery range (30 percent).13
Overall, these three surveys found that New York State consumers currently lack awareness and knowledge about EVs but want to learn more and are potentially interested in purchasing EVs. EV awareness and knowledge seem to be higher in New York State than nationally, although lower than in California, where EV adoption is substantially greater. Interest in learning more about EVs, however, seems to be slightly higher in New York State than in California, which suggests that NYSERDA may be able to improve EV adoption rates by focusing on information campaigns among interested consumers (see text box for survey results related to outreach strategy). The surveys also showed that a number of consumers hold negative perceptions of EVs (e.g., they do not perform well, are not fun to drive, are not stylish or luxurious) and are overall unfamiliar with and uncertain about the technology (e.g., charging logistics).
NYSERDA is well-positioned to address these barriers by working in collaboration with industry and consumer-focused organizations. For example:
• To increase consumer experience with EVs and improve knowledge and perceptions related to EV technology, vehicle performance, charging logistics, and maintenance, NYSERDA could encourage industry stakeholders (e.g., automobile manufacturers, dealerships) to host ride-and-drive events and conduct targeted marketing campaigns. NYSERDA could also partner with nonprofit organizations that have an EV-focus to directly engage consumers through outreach and education.
• To increase consumer exposure to charging stations, NYSERDA could continue to work with employers to install workplace charging stations.
• To improve overall knowledge and perceptions related to cost, NYSERDA could continue to advertise its Drive Clean Rebate for Electric Cars, which both decreases consumer cost and increases consumer exposure to EVs as a feasible vehicle option.
2.2 Other Technical, Economic, and Policy Barriers In addition to barriers associated with consumer awareness and familiarity, a number of other technical, economic, and policy barriers also impede EV adoption in New York State and nationally. According to interviews and a review of recent reports on EV adoption, the most significant of these barriers include:
Technical Barriers
• Vehicle choice: Most EVs currently on the market are small sedans and hatchbacks, which limits the near-term market potential for EVs. Electric sport utility vehicle (SUV) models are currently limited and expensive, but SUVs remain preferred by many drivers.14 In addition, used EVs remain limited in New York State because of the newness of the technology.
13 Edelman Intelligence. Survey results provided by NYSERDA via email on March 22, 2017. 14 Interview with Adam Ruder, Program Manager at NYSERDA. Conducted February 15, 2017.
7

• Vehicle range: National surveys detail that EVs need to be able to travel 300 miles per charge for many consumers to consider purchasing one.15 Most EV models do not yet have this range. Additionally, cold weather can cut EV range by approximately 30 percent, which may be particularly problematic in parts of New York State.16 Fast chargers can help alleviate range anxiety by ensuring that drivers can charge their vehicles more quickly during long-distance travel, but do not address concerns about daily travel.
• EV repair and maintenance: Due to the relative newness of EV technology, many mechanics are not yet trained in or have limited experience with servicing EVs.17
• Charging infrastructure access: Easy access to charging infrastructure is necessary for EV ownership. Individuals without access to off-street parking (typically those who live in densely populated urban areas) have few or no residential charging options and are therefore unlikely to purchase EVs.18
• Grid capacity: Transmission and distribution capacity to support charging during peak hours may be limited in some areas. While infrastructure can be upgraded to accommodate an increase in peak demand, such upgrades can be expensive.19 Importantly, capacity constraints are not widespread in New York State, but may apply locally in highly constrained areas, such as parts of New York City. To minimize capacity constraints without expensive infrastructure upgrades, companies designing and installing charging stations may need to explore energy storage and smart charging options for their products, particularly as energy-intensive fast chargers become more widespread.
Economic Barriers
• EV purchase price: While there are many rebates and tax incentives available for EVs, the EV purchase price can be $2,500 to $10,000 higher than that of a conventional vehicle, suggesting a payback period of more than five years without tax incentives.20, 21
• Charging station price: Charging stations involve capital investments. The average price per dual-port station, based on NYSERDA’s recent installations, is $17,500, or $8,774 per charging port. At this price, the payback period (income received from charging vehicles net of electricity
15 NREL. 2016. Consumer Views on Plug-in Electric Vehicles - National Benchmark Report (Second Edition). December 2016. 16 Interview with Jeremy Michalek, Professor of Mechanical Engineering and of Engineering and Public Policy at Carnegie Mellon University. Conducted September 15, 2016. 17 Interview with Neil Miller, Manager of Business Development at Leviton (formerly). Conducted September 8, 2016. 18 Carnegie Mellon. 2015. Electric Vehicle Adoption Potential in the United States. June 2015. http://www.cmu.edu/epp/policy-briefs/briefs/Electric-Vehicle-Adoption.pdf 19 Interview with Barry Carr, Syracuse Coordinator at Clean Cities Coalition. Conducted September 14, 2016. 20 Interview with Adam Ruder, Program Manager at NYSERDA. Conducted February 15, 2017. 21 Payback period calculations assume 18,300 miles driven per year (normal daily use: 60 miles per weekday, 5 days per week, 49 weeks per year, 45 percent highway driving; other trips: 3,600 miles per year, 80 percent highway driving), vehicle efficiencies corresponding to the 2017 Nissan Sentra and Nissan Leaf, a gasoline price of $2.37 per gallon, and New York State electricity rates. [Alternative Fuels Data Center (AFDC). Vehicle Cost Calculator. http://www.afdc.energy.gov/calc/]
8

and maintenance costs) can be more than 10 years, depending on station use and fees charged.22 This return does not consider the many benefits of charging stations, such as improved sustainability image, that are difficult to monetize, but many of those benefits do not accrue to the charging station operator. To offset the costs, charging stations can also directly generate revenue through advertisements or increased customer traffic (for example, if EV charging is marketed as a perk for retail customers).23
• Demand charges for charging stations: In addition to high initial costs, charging stations may incur high demand charges for electricity use during peak hours, especially as fast chargers become more widespread.24 Energy storage and smart charging technologies may be able to help minimize demand charges for charging station owners. EV-specific utility rates and time-of-use plans can also encourage off-peak charging and minimize demand charges.
Policy Barriers
• Zoning: Most communities do not specify permissible types of charging stations by zoning category, potentially presenting a barrier to installations. In the absence of clear zoning ordinances, charging stations could, in theory, be categorized similarly to gas stations and not allowed in some commercial areas. Best practices encourage communities to clarify what type of charging stations are allowed in each zoning category (e.g., explicitly classifying charging stations as “Auto Service Establishments,” which include facilities such as glass and mirror shops and are allowed in commercial areas), and to streamline local permitting requirements (e.g., designating residential charging station installations as “minor work” on the same scale as large appliances).25 It is worth noting that although zoning is frequently mentioned in best practice documents, NYSERDA and IEc identified no evidence of zoning issues hindering installations in New York State.26 NYSERDA has supported updates to local permitting and other ordinances in the past through its Cleaner, Greener Communities program and may continue to do so under the CEF as part of the Clean Energy Communities program.
• Building codes: Similarly, many communities do not have building and electrical codes that proactively encourage widespread EV infrastructure. One exception is New York City, which requires 20 percent of new parking lots and garages to be wired for EVs at the time of construction.27 Integrating electrical capacity for EV charging stations at the time of construction
22 Interview with Adam Ruder, Program Manager at NYSERDA. Conducted February 15, 2017. 23 Interview with Constantine Samaras, Assistant Professor at Carnegie Mellon University’s Department of Civil and Environmental Engineering. Conducted August 24, 2016. 24 Interview with Adam Ruder, Program Manager at NYSERDA. Conducted February 15, 2017. 25 NYSERDA. 2015. Cleaner, Greener Communities Program: Phase II Implementation Grants Program Opportunity Notice (PON) 2721, Category 1: Streamlined Permitting Fact Sheet. https://www.nyserda.ny.gov/-/media/Files/About/.../Category-1-Fact-Sheet.pdf; and Transportation & Climate Initiative of the Northeast and Mid-Atlantic States. 2012. Creating EV-Ready Towns and Cities: A Guide to Planning and Policy Tools. November 2012. http://www.transportationandclimate.org/creating-ev-ready-towns-and-cities-guide-planning-and-policy-tools 26 Interview with Adam Ruder, Program Manager at NYSERDA. Conducted February 15, 2017. 27 The New York City Council. 2013. Legislation Text: A local law to amend the administrative code of the City of New York and the New York City building code, in relation to electric vehicle charging stations in open parking lots and parking garages. http://legistar.council.nyc.gov/LegislationDetail.aspx?ID=1501659&GUID=65344E17-4C65-4751-81E7-7A0D4DD9F7CD&Options=ID%7cText%7c&Search
9

incurs minimal additional cost and helps avoid expensive retrofits later. It is also important to ensure that sufficient numbers of charging stations are installed to meet demand, and that charging stations are accessible to people with disabilities.28
Of these barriers, grid capacity and zoning appear not to be problematic in New York State currently. Several others either do not align closely with the Transportation Program’s focus on R&D (i.e., vehicle choice, repair and maintenance), or are best addressed by other programs (i.e., battery range, which is one focus of the NY-BEST Battery and Energy Storage Technology Consortium, and building codes, which are addressed by NYSERDA’s Building Energy Codes program). The remaining barriers are well-suited to Transportation Program involvement:
• First, NYSERDA could engage utilities in discussions and technology demonstrations to minimize peak demand impacts, or perceptions of such impacts, particularly in response to charging station owners’ concerns over demand charges. This could include investigating the potential for EV-specific meters and tariffs, time-of-use pricing, charging stations integrated with energy storage or renewable energy, or the use of EVs for demand response.
• Second, NYSERDA could continue its efforts to increase the availability of charging stations and reduce their installed cost. These efforts could include demonstrations of technology improvements, deployments to help achieve economies of scale, demonstrations focused on generating ancillary revenues from charging stations (e.g., advertisements, customer traffic), and research studies that quantify those benefits.
• Finally, NYSERDA could continue to offer its Drive Clean Rebate for Electric Cars to lower the vehicle purchase price for consumers and help achieve economies of scale to reduce the overall technology cost over time.
28 NYSERDA. 2016. Electric Vehicle Charging Station Implementation Plans for the Upstate New York I-90 Corridor. August 2016. https://www.nyserda.ny.gov/-/media/Files/Publications/Research/Transportation/16-28-ev-charging-station-implementation.pdf
10

3. Key Market Actors The following section discusses key actors in the market for EVs in New York State, including their involvement in existing EV awareness programs and the supply-side market. This section also highlights categories of market actors that could benefit from additional outreach and engagement efforts.
3.1 Participation in EV Awareness Programs As described in the previous section, consumers around the country remain unfamiliar with EVs. Efforts to increase EV adoption have emphasized the need to engage multiple types of market actors in programs that seek to increase adoption by improving awareness. Specifically, interviews and literature review conducted for this assessment emphasize the need to engage the following types of market actors:
• Actors focused on EV sales:
o Vehicle manufacturers to produce EVs with features that align with consumer demand.
o Dealerships to educate potential buyers on the benefits of EVs and to encourage EV sales.
o Consumers to ultimately purchase and drive EVs.
• Actors focused on EV charging station installations:
o Charging station owners and operators, including large employers and municipalities, to install the infrastructure necessary for widespread EV use.
o Utilities to facilitate grid integration of EV charging stations and incentivize off-peak charging through EV-specific rates and pricing structures.
• Actors providing policy support for EVs:
o Municipalities to encourage EV adoption through supportive zoning, permitting processes, and building codes.
o Environmental advocates and nonprofits to engage directly with consumers and other market actors.
One goal of the Transportation Program’s focus under the CEF is to increase consumer awareness and acceptance of EVs by working with industry partners to implement targeted awareness campaigns. Although NYSERDA’s efforts under the CEF are just beginning, several EV awareness programs already exist in New York State. These programs target different market actors (e.g., consumers, dealerships, charging station owners/operators), but all share a goal of increasing awareness and adoption of EVs—that is, they address the consumer demand side of the EV market. Examples of programs already operating in New York State include:
• Initiatives of the Electric Auto Association, which is a nationwide nonprofit organization of volunteers dedicated to educating the public about the progress and benefits of electric-drive
11

technology by organizing and participating in forums, meetings, and public events, such as EV car shows. 29 The Electric Auto Association has one chapter in New York State, which focuses its efforts in Long Island, New York City, and lower Westchester County.
• Sierra Club’s EV initiatives, including their Go Electric and Rev Up EVs campaigns. Through these initiatives, the Sierra Club seeks to educate potential EV buyers on the environmental and performance benefits of EVs and available consumer incentives, as well as encourage dealerships to promote EV sales. For consumers, the Sierra Club offers a comprehensive online guide that helps drivers identify suitable EV models based on personal driving habits and lifestyle needs.30 In addition, the Sierra Club launched its Rev Up EVs campaign in 2016 to encourage interested buyers to talk to dealers about purchasing EVs and report back on their experience.31 This information collection campaign was designed to improve Sierra Club’s EV advocacy efforts in the 10 ZEV mandate states, which include New York State. As part of the campaign, the Sierra Club created an online tool that directs interested consumers to local dealerships with EV models available for test drives or purchase. The Sierra Club also created a one-page fact sheet for dealers and consumers that explains the benefits of EVs and available state and federal incentives.
• National Drive Electric Week, which is organized by the Electric Auto Association, Sierra Club, and Plug-In America, a nonprofit advocacy group focused on educating consumers, policymakers, and automobile manufacturers on the benefits of EVs.32 National Drive Electric Week is a series of events across the country that promotes EVs to potential drivers. Events include EV ride-and-drives and information sessions with current EV owners. National Drive Electric Week first organized events in New York State in 2013, with events in five cities and 300 registered attendees. In 2016, the number of participating cities in New York State increased to 11, with nearly 700 registered attendees.
• Actions of the Clean Cities Coalition, a program of the U.S. Department of Energy that focuses on supporting local actions to cut petroleum use in transportation. 33 The program provides resources and information to a variety of stakeholders to advance alternative fuels and clean transportation projects, and includes six coalitions in New York State: Western New York (Buffalo), Central New York (Syracuse), Greater Long Island, Genesee Region (Rochester), Capital District (Albany), and Empire (New York City). These coalitions have organized a number of projects, including distributing information to institutions, municipalities, and workplaces on the benefits of installing EV charging stations, and guiding interested organizations through the installation process.
• EV drag races organized by the National Electric Drag Racing Association (NEDRA).34 NEDRA aims to increase public awareness of EV performance and encourage advances in EV
29 Electric Auto Association. Accessed April 25, 2017. http://www.electricauto.org 30 Sierra Club. Pick A Plug In. Accessed April 25, 2017. https://content.sierraclub.org/evguide/pick-a-plugin 31 Sierra Club. Join Us To Rev Up Electric Vehicles! Accessed April 25, 2017. https://content.sierraclub.org/evguide/rev-up-evs 32 National Drive Electric Week. Accessed April 25, 2017. https://driveelectricweek.org/index.php 33 U.S. Department of Energy. Clean Cities. Accessed April 25, 2017. https://cleancities.energy.gov/coalitions/ 34 National Drag Racing Association. Accessed April 25, 2017. http://www.nedra.com/
12
technology by organizing EV drag racing events across the U.S. and Canada.35 NEDRA members include drag racing fans, EV owners and drag racers, EV parts suppliers, and EV manufacturers. Although this organization is not specific to New York State and does not have a dedicated New York State chapter, it plays an important role in advancing EV awareness by targeting a different population (i.e., drag racers) compared to many other EV organizations, which tend to focus on technology- or environmentally-minded individuals.
Most of the programs listed above target consumers broadly, and most have a national focus. As such, there is room for NYSERDA to engage local companies and organizations to better tailor outreach and education to consumers in New York State. In particular, interviewees indicated that:
• New York State dealers need to be better educated on EV range, performance, electricity consumption, fuel costs, environmental benefits, and service needs. The Sierra Club’s Rev Up EVs initiative, and a recent NYSERDA project to educate dealers about EVs and create a dealer incentive for EV sales in Syracuse, both begin to address this barrier, but efforts should be expanded. In addition, NYSERDA’s Drive Clean Rebate for Electric Cars encourages dealerships to invest more time and effort in selling EVs, in addition to directly incentivizing consumer purchases.
• Potential EV charging station installers (site owners) often request additional information on siting EV charging stations and the costs and benefits of charging station operation. NYSERDA provides much of this information in best practice guides for charging station site owners, policymakers, and installers that are available on NYSERDA’s website. These guides summarize best practices and lessons related to site selection, construction and installation, ownership models, local permitting, zoning, signage, and building codes, based on NYSERDA’s experience deploying over 300 charging stations across the state.36 NYSERDA has also sponsored workshops for electrical installers and inspectors to learn more about the EV charging station installation process. These types of efforts should continue, and NYSERDA should work to ensure that installers are aware that the information is available. It may be helpful for NYSERDA to partner with environmental organizations to ensure that the information is widely disseminated.
• Utilities may need to see examples from other areas of rate structures, projects, and policies that successfully facilitated charging station installations before becoming more involved in the EV market. NYSERDA has funded a series of policy studies that investigated utility approaches to encouraging widespread EV use, and the New York State Public Service Commission (PSC) has encouraged utilities to incorporate EV planning into their implementation plans under the Reforming the Energy Vision (REV) proceeding.37 This type of engagement should be emphasized to ensure that utilities are actively engaged in EV planning, although
35 EV racing events appear to be gaining in popularity in general and within New York State. As one example, New York City will be hosting a Formula-E electric street race in July 2017. http://info.fiaformulae.com/new-york-city-eprix-en/ 36 NYSERDA. Best Practice Guides for Charging Stations. Accessed April 25, 2017. https://www.nyserda.ny.gov/Researchers-and-Policymakers/Electric-Vehicles/Resources/Best-Practice-Guides-for-Charging-Stations 37 NYSERDA. 2016. Clean Energy Fund Investment Plan: Clean Transportation Chapter. Portfolio: Innovation & Research. August 2016. https://www.nyserda.ny.gov/About/Clean-Energy-Fund
13

utilities may also benefit from direct technical assistance and planning support as they attempt to tailor general approaches to their specific rate structures and policies.
3.2 Composition of Supply-Side Electric Vehicle Market Although the Transportation Program is beginning to partner with companies and organizations to directly address the consumer demand side of the market, the Program’s primary focus to date has been on partnering with supply-side companies and organizations to advance R&D and deploy supporting infrastructure (i.e., EV charging stations). In general, the supply-side transportation market includes companies involved in product development (e.g., product design, R&D, analysis and testing), manufacture, and the provision of transportation services. Some companies and organizations, such as automobile manufacturers, are positioned such that they can affect both transportation supply and demand, as they both manufacture products and directly encourage consumer sales. Other actors, such as nonprofit organizations, can serve as a bridge between market actors through their outreach and advocacy efforts.
To understand the involvement of transportation companies and organizations in the supply-side market for EVs in New York State, this assessment relied on two data sets:
1) The market characterization survey conducted by IEc in 2016, as detailed in Volume 2 of this MCA, and
2) NYSERDA’s recently-completed inventory of clean energy companies in New York State.
IEc combined these data sets to characterize New York State’s supply-side transportation market, including information on companies’ current and anticipated technology focus, company type, and geographic location. The technology focus of companies could also be identified through NYSERDA’s research and development (R&D) Metrics Database, which includes information on the focus and outcomes of funded projects. However, the Metrics Database does not include information on other company characteristics, so it is used only as a supplemental resource to understand the approximate size of the market.
When combined, the survey and Inventory data show that some types of market actors appear to be well engaged, particularly those involved in product development (i.e., product designers/R&D firms, analysis and testing firms) which is not surprising given NYSERDA’s R&D focus, and nonprofit organizations, which may be valuable partners to NYSERDA because of their ability to engage other market actors and consumers. Of the 109 companies included in the market characterization survey, about one-third indicated that they are already participating in the EV market, and an additional 24 indicated that they might be interested in working on EVs in the future. The Inventory identified an additional 16 firms currently in the EV market that were not included in the survey; of these, four had previously worked with NYSERDA (i.e., they were listed in the Metrics Database). These companies are located in all regions of New York State, although they are concentrated in New York City and the Finger Lakes region. An additional 29 companies and organizations were also listed in the Metrics Database for EV-related projects, although further detail on their company type and location are not available.
The survey and Inventory data showed lower levels engagement from manufacturers, site and fleet owners, transportation service providers, and public sector organizations. The involvement of site owners,
14

fleet owners, and service providers suggests potential for future EV adoption as these companies can lead efforts to install EV charging stations and purchase EVs for their fleets. The involvement of public sector organizations (e.g., municipalities) is encouraging for promoting EV-friendly zoning and building codes.
Notably, the market characterization survey and Inventory did not reach two key segments of the EV market: automobile dealerships and utilities. Because these types of companies were not the target audience for the survey, this result does not necessarily indicate that they are not involved in the market for EVs in New York State. However, interviews suggest that low engagement from these groups may make it more challenging to address key barriers such as EV purchase price and demand charges for EV charging station owners. Vehicle manufacturers were also not well represented in the survey or Inventory because these companies tend to be located in other states and serve a large, national market.
Finally, this assessment considered whether the actors known to be participating in the market for EVs in New York State are involved in existing awareness programs. The companies listed in the survey, Inventory, and Metrics Database are generally not those organizing the awareness initiatives listed in Section 3.1, although some companies may participate in larger events such as National Drive Electric Week. The Clean Cities Coalitions are an exception – the six NYS-based Coalitions are long-time NYSERDA partners, and are also actively working on advancing EV awareness. Other NYSERDA partners may be as well, but information on their involvement is not readily available. Consistent with the Transportation Program’s stated goals under the CEF, NYSERDA could consider encouraging its partners to become involved in existing EV awareness programs like those listed in Section 3.1 or to start their own programs to better leverage their positions in the EV market.
15
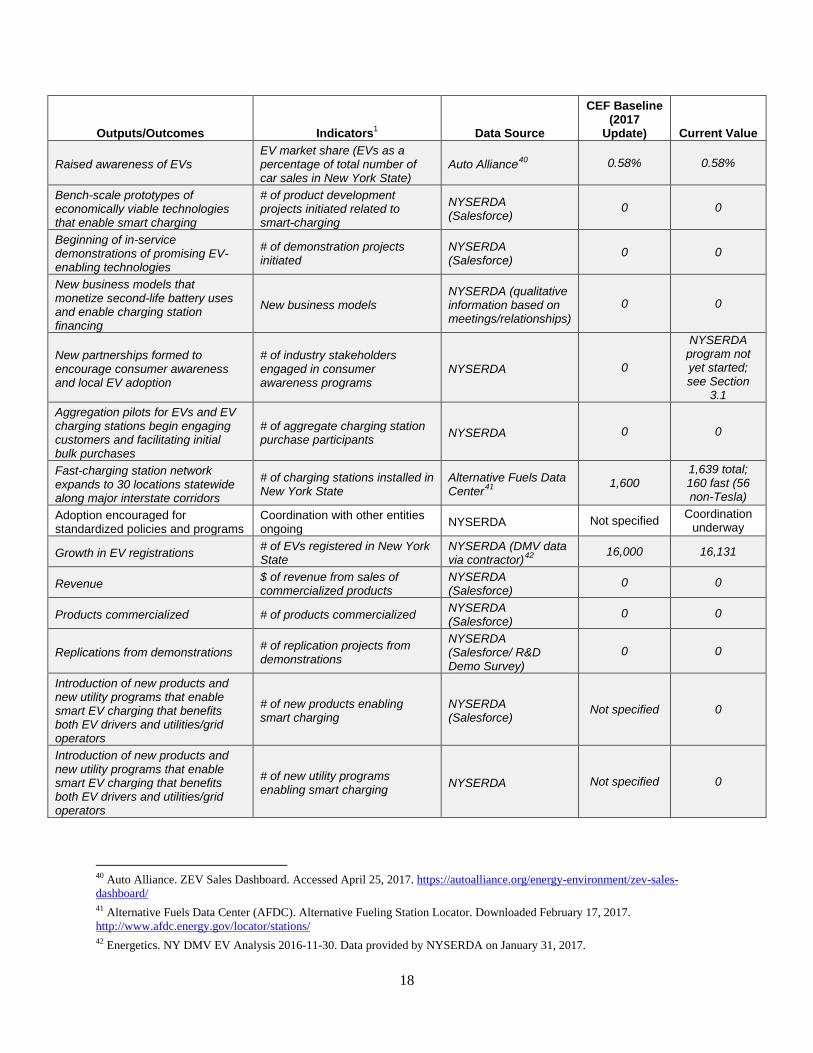
4. Baseline Indicator Values Table 4-1 presents the outputs, outcomes, and indicators that the Transportation Program is tracking for its EV program area. The table shows both the baseline values that will be reported in the forthcoming update to the Clean Transportation CEF Investment Plan and the current values assessed as part of this evaluation. Because the Transportation Program is just now beginning its CEF initiatives, the baseline values are the same as the current values.
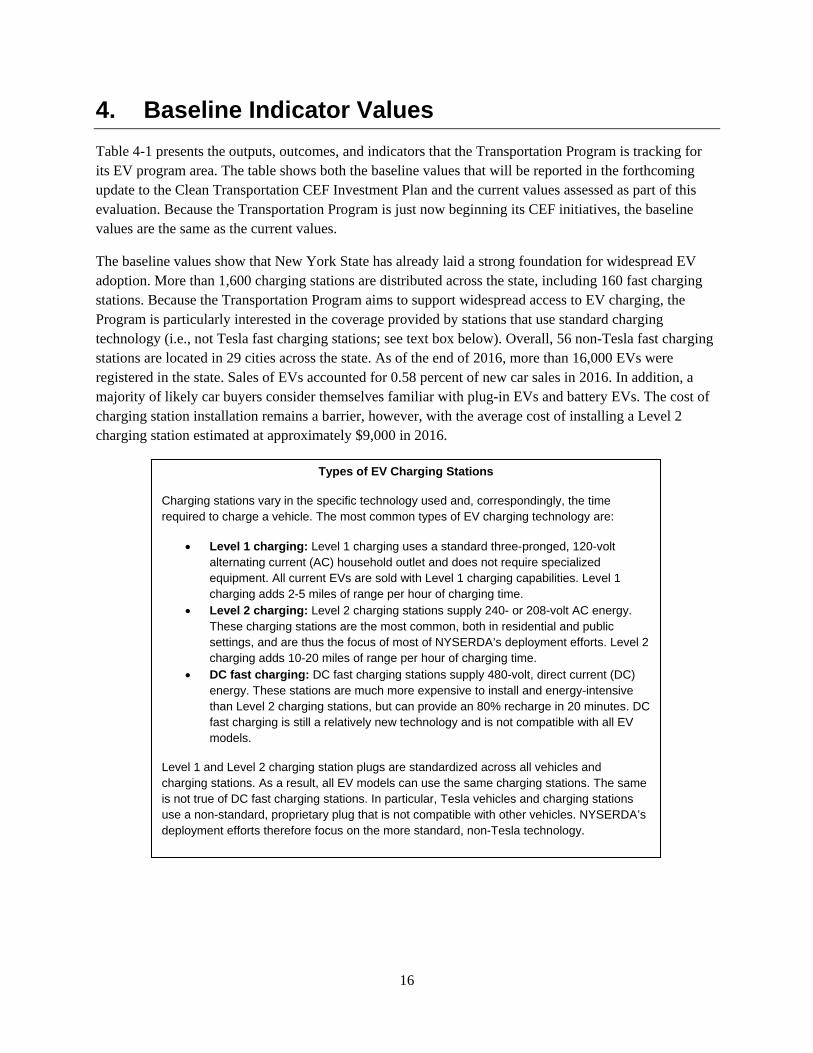
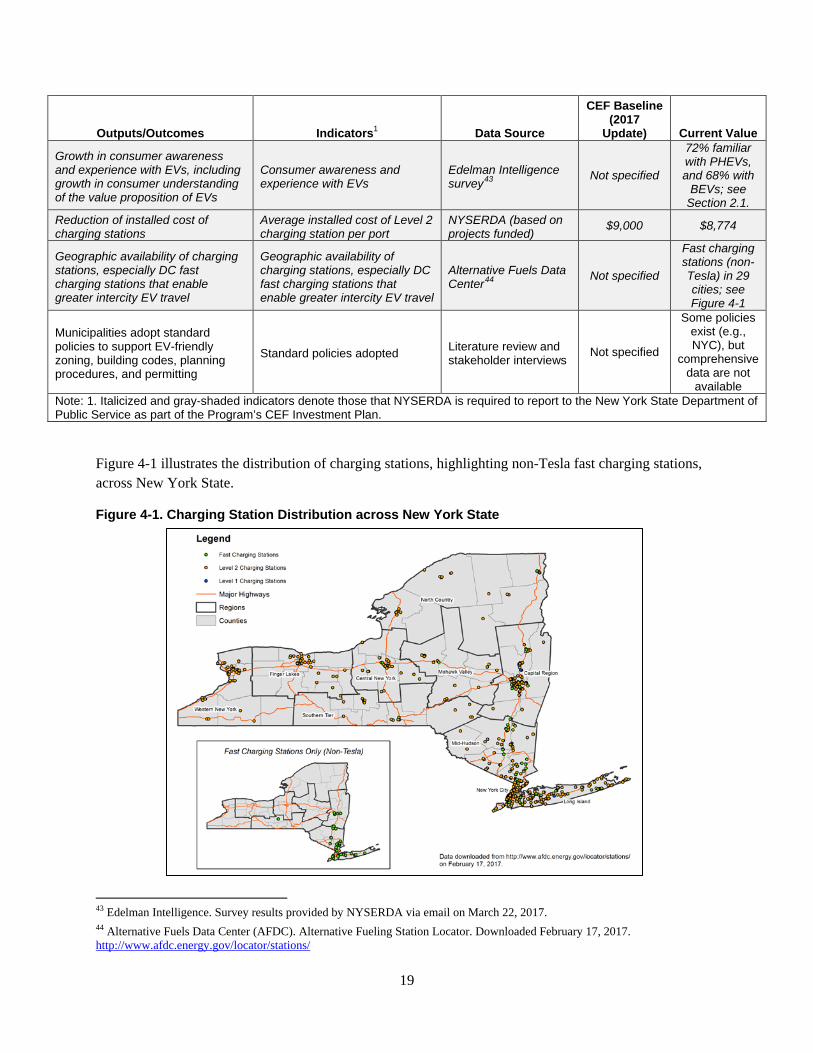
The baseline values show that New York State has already laid a strong foundation for widespread EV adoption. More than 1,600 charging stations are distributed across the state, including 160 fast charging stations. Because the Transportation Program aims to support widespread access to EV charging, the Program is particularly interested in the coverage provided by stations that use standard charging technology (i.e., not Tesla fast charging stations; see text box below). Overall, 56 non-Tesla fast charging stations are located in 29 cities across the state. As of the end of 2016, more than 16,000 EVs were registered in the state. Sales of EVs accounted for 0.58 percent of new car sales in 2016. In addition, a majority of likely car buyers consider themselves familiar with plug-in EVs and battery EVs. The cost of charging station installation remains a barrier, however, with the average cost of installing a Level 2 charging station estimated at approximately $9,000 in 2016.
Types of EV Charging Stations
Charging stations vary in the specific technology used and, correspondingly, the time required to charge a vehicle. The most common types of EV charging technology are:
• Level 1 charging: Level 1 charging uses a standard three-pronged, 120-volt alternating current (AC) household outlet and does not require specialized equipment. All current EVs are sold with Level 1 charging capabilities. Level 1 charging adds 2-5 miles of range per hour of charging time.
• Level 2 charging: Level 2 charging stations supply 240- or 208-volt AC energy. These charging stations are the most common, both in residential and public settings, and are thus the focus of most of NYSERDA’s deployment efforts. Level 2 charging adds 10-20 miles of range per hour of charging time.
• DC fast charging: DC fast charging stations supply 480-volt, direct current (DC) energy. These stations are much more expensive to install and energy-intensive than Level 2 charging stations, but can provide an 80% recharge in 20 minutes. DC fast charging is still a relatively new technology and is not compatible with all EV models.
Level 1 and Level 2 charging station plugs are standardized across all vehicles and charging stations. As a result, all EV models can use the same charging stations. The same is not true of DC fast charging stations. In particular, Tesla vehicles and charging stations use a non-standard, proprietary plug that is not compatible with other vehicles. NYSERDA’s deployment efforts therefore focus on the more standard, non-Tesla technology.
16
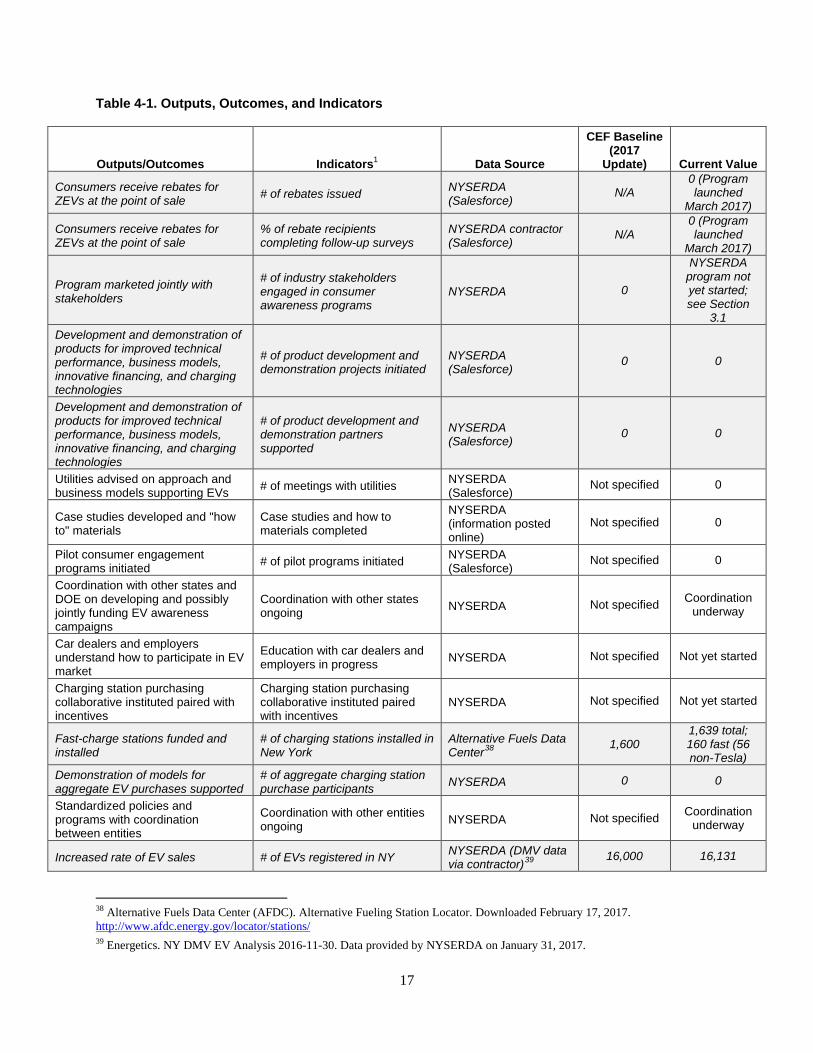
Table 4-1. Outputs, Outcomes, and Indicators
Outputs/Outcomes Indicators1 Data Source
CEF Baseline (2017
Update) Current Value
Consumers receive rebates for ZEVs at the point of sale # of rebates issued NYSERDA
(Salesforce) N/A
0 (Program launched
March 2017)
Consumers receive rebates for ZEVs at the point of sale
% of rebate recipients completing follow-up surveys
NYSERDA contractor (Salesforce)
N/A 0 (Program launched
March 2017)
Program marketed jointly with stakeholders
# of industry stakeholders engaged in consumer awareness programs
NYSERDA 0
NYSERDA program not yet started; see Section
3.1 Development and demonstration of products for improved technical performance, business models, innovative financing, and charging technologies
# of product development and demonstration projects initiated
NYSERDA (Salesforce)
0 0
Development and demonstration of products for improved technical performance, business models, innovative financing, and charging technologies
# of product development and demonstration partners supported
NYSERDA (Salesforce)
0 0
Utilities advised on approach and business models supporting EVs # of meetings with utilities NYSERDA
(Salesforce) Not specified 0
Case studies developed and "how to" materials
Case studies and how to materials completed
NYSERDA (information posted online)
Not specified 0
Pilot consumer engagement programs initiated # of pilot programs initiated NYSERDA
(Salesforce) Not specified 0
Coordination with other states and DOE on developing and possibly jointly funding EV awareness campaigns
Coordination with other states ongoing NYSERDA Not specified Coordination
underway
Car dealers and employers understand how to participate in EV market
Education with car dealers and employers in progress NYSERDA Not specified Not yet started
Charging station purchasing collaborative instituted paired with incentives
Charging station purchasing collaborative instituted paired with incentives
NYSERDA Not specified Not yet started
Fast-charge stations funded and installed
# of charging stations installed in New York
Alternative Fuels Data Center38
1,600 1,639 total; 160 fast (56 non-Tesla)
Demonstration of models for aggregate EV purchases supported
# of aggregate charging station purchase participants NYSERDA 0 0
Standardized policies and programs with coordination between entities
Coordination with other entities ongoing NYSERDA Not specified Coordination
underway
Increased rate of EV sales # of EVs registered in NY NYSERDA (DMV data via contractor)39
16,000 16,131
38 Alternative Fuels Data Center (AFDC). Alternative Fueling Station Locator. Downloaded February 17, 2017. http://www.afdc.energy.gov/locator/stations/ 39 Energetics. NY DMV EV Analysis 2016-11-30. Data provided by NYSERDA on January 31, 2017.
17
Outputs/Outcomes Indicators1 Data Source
CEF Baseline (2017
Update) Current Value
Raised awareness of EVs EV market share (EVs as a percentage of total number of car sales in New York State)
Auto Alliance40 0.58% 0.58%
Bench-scale prototypes of economically viable technologies that enable smart charging
# of product development projects initiated related to smart-charging
NYSERDA (Salesforce)
0 0
Beginning of in-service demonstrations of promising EV-enabling technologies
# of demonstration projects initiated
NYSERDA (Salesforce)
0 0
New business models that monetize second-life battery uses and enable charging station financing
New business models NYSERDA (qualitative information based on meetings/relationships)
0 0
New partnerships formed to encourage consumer awareness and local EV adoption
# of industry stakeholders engaged in consumer awareness programs
NYSERDA 0
NYSERDA program not yet started; see Section
3.1 Aggregation pilots for EVs and EV charging stations begin engaging customers and facilitating initial bulk purchases
# of aggregate charging station purchase participants NYSERDA 0 0
Fast-charging station network expands to 30 locations statewide along major interstate corridors
# of charging stations installed in New York State
Alternative Fuels Data Center41
1,600 1,639 total; 160 fast (56 non-Tesla)
Adoption encouraged for standardized policies and programs
Coordination with other entities ongoing NYSERDA Not specified Coordination
underway
Growth in EV registrations # of EVs registered in New York State
NYSERDA (DMV data via contractor)42
16,000 16,131
Revenue $ of revenue from sales of commercialized products
NYSERDA (Salesforce)
0 0
Products commercialized # of products commercialized NYSERDA (Salesforce)
0 0
Replications from demonstrations # of replication projects from demonstrations
NYSERDA (Salesforce/ R&D Demo Survey)
0 0
Introduction of new products and new utility programs that enable smart EV charging that benefits both EV drivers and utilities/grid operators
# of new products enabling smart charging
NYSERDA (Salesforce)
Not specified 0
Introduction of new products and new utility programs that enable smart EV charging that benefits both EV drivers and utilities/grid operators
# of new utility programs enabling smart charging NYSERDA Not specified 0
40 Auto Alliance. ZEV Sales Dashboard. Accessed April 25, 2017. https://autoalliance.org/energy-environment/zev-sales-dashboard/ 41 Alternative Fuels Data Center (AFDC). Alternative Fueling Station Locator. Downloaded February 17, 2017. http://www.afdc.energy.gov/locator/stations/ 42 Energetics. NY DMV EV Analysis 2016-11-30. Data provided by NYSERDA on January 31, 2017.
18
Outputs/Outcomes Indicators1 Data Source
CEF Baseline (2017
Update) Current Value
Growth in consumer awareness and experience with EVs, including growth in consumer understanding of the value proposition of EVs
Consumer awareness and experience with EVs
Edelman Intelligence survey43
Not specified
72% familiar with PHEVs, and 68% with
BEVs; see Section 2.1.
Reduction of installed cost of charging stations
Average installed cost of Level 2 charging station per port
NYSERDA (based on projects funded)
$9,000 $8,774
Geographic availability of charging stations, especially DC fast charging stations that enable greater intercity EV travel
Geographic availability of charging stations, especially DC fast charging stations that enable greater intercity EV travel
Alternative Fuels Data Center44
Not specified
Fast charging stations (non-Tesla) in 29 cities; see Figure 4-1
Municipalities adopt standard policies to support EV-friendly zoning, building codes, planning procedures, and permitting
Standard policies adopted Literature review and stakeholder interviews
Not specified
Some policies exist (e.g., NYC), but
comprehensive data are not
available Note: 1. Italicized and gray-shaded indicators denote those that NYSERDA is required to report to the New York State Department of Public Service as part of the Program’s CEF Investment Plan.
Figure 4-1 illustrates the distribution of charging stations, highlighting non-Tesla fast charging stations, across New York State.
Figure 4-1. Charging Station Distribution across New York State
43 Edelman Intelligence. Survey results provided by NYSERDA via email on March 22, 2017. 44 Alternative Fuels Data Center (AFDC). Alternative Fueling Station Locator. Downloaded February 17, 2017. http://www.afdc.energy.gov/locator/stations/
19

5. Conclusions The information collected as part of this assessment documents the opportunities represented by the Transportation Program’s focus on EVs and identifies several areas where NYSERDA is well-positioned to advance EV adoption by addressing key barriers.
First, this study confirms that substantial opportunity for growth in EV adoption remains. In particular, technology companies and service providers have demonstrated interest in working on EVs, and consumers have expressed interest in learning more about and potentially purchasing EVs. Notably, consumer awareness, knowledge, and interest appear to be higher in New York State than nationally but could be expanded considerably. This is consistent with New York State’s rank as fourth-highest in terms of EV adoption.45 Consumer awareness and interest follow a different pattern in California, the leading state for EV adoption. In California, consumers reported higher levels of knowledge and awareness than in New York State but lower interest in learning more, possibly as a result of their higher level of current knowledge. Taken together, these results suggest that NYSERDA could make further progress on EV adoption by targeting information and awareness campaigns to interested consumers. To maximize reach, the Transportation Program should partner with local industry stakeholders (e.g., dealerships) and nonprofit organizations to address specific gaps, such as increasing drivers’ experience with EVs and improving perceptions of EVs.
Specifically, to improve consumer awareness and knowledge of EVs, the Transportation Program could:
• Strengthen and expand existing partnerships with dealerships and outreach organizations to educate dealers and consumers on the benefits of EVs and address consumers’ anxieties. For reference, strategies that California has used to increase dealership engagement and EV sales include:46
o Establishing EV hotlines for dealership sales staff to call with questions,
o Encouraging dealerships to designate EV specialists on the showroom floor and online in customer service chatrooms to provide detailed information about EVs and answer customers’ questions,
o Co-locating complementary EV products (e.g., chargers, high-occupancy vehicle lane access decals) with EVs in showrooms to better demonstrate the value proposition of the “EV lifestyle” to potential buyers, and
45 Between 2011 and 2016, New York State had sales of 20,000 ZEVs. The three states with higher ZEV sales were California (256,000), Georgia (26,000) and Washington (22,000). [Auto Alliance. ZEV Sales Dashboard. Accessed April 25, 2017. https://autoalliance.org/energy-environment/zev-sales-dashboard/] Annual sales in California have increased continuously since 2011, while sales in Washington and New York State dropped slightly in 2015 but increased otherwise. In contrast, sales in Georgia increased substantially through 2014, before dropping dramatically in the two years since. This different pattern may be the result of Georgia’s decisions to eliminate EV tax incentives in 2015 and instead implement an alternative fuel vehicle “road user” fee in 2016. 46 Cahill, Eric, Jamie Davies-Shawhyde, and Thomas S. Turrentine. 2014. New Car Dealers and Retail Innovation in California’s Plug-In Electric Vehicle Market. University of California, Davis, Institute of Transportation Studies. Working Paper UCD-ITS-WP-14-04. October 2014. http://www.its.ucdavis.edu/research/publications/publication-detail/?pub_id=2353
20

o Encouraging dealerships to cooperate with local organizations that organize ride-and-drives and other consumer-oriented EV events.
• Support consumer awareness events that allow drivers to interact directly with EVs (e.g., ride-and-drive events), because of the significant weight consumers give these experiences in forming their preferences.
This assessment also showed that other technical, economic, and policy barriers dampen EV adoption. The most significant of these barriers are related to charging logistics (e.g., availability of charging stations, charging time, and battery range), EV purchase price, and costs associated with charging stations, including installed cost and demand charges. The Transportation Program is well-positioned to address several of the most significant barriers because of its previous work in this area and its connections to other NYSERDA programs. In the near term, the Transportation Program could:
• Continue to support charging station deployments, particularly at highly visible locations such as workplaces and public parking lots. In addition, ensure that fast chargers are available across the state to address range anxiety.
• Support projects focused on reducing the initial cost of charging stations and the costs associated with operations, including the minimization of demand charges for charging station owners and generation of ancillary revenues from advertisements or customer traffic.
• Work with utilities to explore solutions to peak demand impacts, whether those impacts are physical capacity constraints or charging station owners’ concerns over increasing demand charges. These efforts may benefit from collaboration with NYSERDA’s Smart Grid program. For reference, strategies used by other states to address utility-related barriers include:47
o Adopting time-of-use or special EV rates to mitigate the impact of demand charges,
o Allowing consumers the flexibility to choose between whole-house or EV-only meters to further mitigate the impact of demand charges,
o Encouraging the use of smart charging at residences and workplaces to shift charging to off-peak hours whenever possible, and
o Supporting innovative demonstrations of the grid benefits provided by EVs, such as using EVs as providers of demand response, using old EV batteries for grid storage, and integrating EV charging with energy storage and renewable energy.
Over the long term, the Transportation Program could:
• Collaborate with NY-BEST, academic institutions, and research organizations to advance EV battery and charging technologies to support longer vehicle range, faster charging times, and lower purchase prices.
47 Salisbury, Mike, and Will Toor. 2016. How Leading Utilities are Embracing Electric Vehicles. Southwest Energy Efficiency Project. February 2016. http://swenergy.org/data/sites/1/media/documents/publications/documents/How_Leading_Utilities_Are_Embracing_EVs_Feb-2016.pdf
21
• Work with policymakers and other NYSERDA programs to integrate EV considerations into building codes. Although building codes are not one of the most significant barriers to EV adoption, New York City has emerged as a leader in this area, and NYSERDA could leverage their experience to encourage other municipalities to follow suit. Other municipal policies, such as zoning and permitting requirements, could also be clarified in many areas, although these omissions appear not to be problematic in practice.
Despite these barriers, this assessment showed that New York State is making progress toward the EV goals outlined in the CEF and remains a leader in EV adoption. The use of EVs appears to be growing rapidly, based on growth in a few key metrics since publication of the Clean Transportation Investment Plan in August 2016. By targeting remaining gaps and barriers in the market and learning from strategies tried by other states, NYSERDA should be well-positioned to further increase EV adoption.
22
6. Methods This assessment relied on a variety of quantitative and qualitative methods to characterize the current state of the market for EVs in New York State. Primary research conducted for this evaluation included six in-depth interviews with NYSERDA, two academic researchers, the U.S. Department of Energy, the Clean Cities Coalition of Syracuse, and Leviton, an EV charging station manufacturer and the subject of a case study conducted by IEc for NYSERDA in 2016. Several of these interviews were conducted initially for the Leviton case study, but relevant information was incorporated into this report as well. In addition, this assessment relied on data from a market characterization survey conducted for this MCA in 2016, NYSERDA’s R&D Metrics Database, and NYSERDA’s recently-completed Clean Energy Inventory (see Volume 2 of this MCA for discussion of these three data sets).
This assessment also relied on review of three recent consumer awareness surveys conducted by NYSERDA and its partners in 2015 and 2016. These three surveys were initially conducted by Edelman Intelligence, researchers at the University of California, Davis, and Essense. The final results of all three surveys were provided to IEc by NYSERDA. IEc was not involved in survey administration or analysis.
Consumer Awareness Baseline Follow-Up
As part of this assessment, NYSERDA tasked IEc with identifying a replicable approach to track consumer awareness over time. Of the three consumer surveys reviewed for this report, IEc recommends replicating portions of the Edelman Intelligence survey. This survey was selected for three reasons:
1. The survey’s focus on likely car buyers (i.e., those considering a purchase in the next 12 months) is consistent with NYSERDA’s focus on EV adoption.
2. The survey questions cover consumer familiarity, knowledge, perceptions, and interest, and also provide insight into consumers’ preferred outreach strategies to guide program design.
3. The survey used a straightforward method of administration and had a reasonably representative sample. The primary gap in the baseline sample is a lack of respondents from upstate New York, but follow-up data can still be compared directly to the baseline results, provided that the follow-up survey asks respondents for their county of residence.
To update the baseline familiarity values in Table 4-1, NYSERDA should include the following question, with a 4-point response scale (very familiar, somewhat familiar, not too familiar, and never heard of it):
• How familiar are you with the following types of electric vehicles? (i.e., PHEV, BEV)
Other survey questions from the Edelman survey that may provide useful information include:
• How knowledgeable are you about electric vehicles? • How interested would you be in learning about electric vehicles? • How important are each of the following attributes to you? (e.g., safety rating, fuel economy, fun to
drive) • How closely do each of those attributes characterize electric vehicles? • What would be the biggest drawbacks to owning an electric vehicle? • Based on what you know now, how likely are you to consider purchasing/leasing an electric vehicle? • How important are the following information sources or experiences for you to consider the
purchase/lease of an electric vehicle? (e.g., family member, EV driver, sales person, paid advertisement, ride-and-drives)
• Which sources do you trust most to provide you with information? (e.g., national newspapers, social media, blogs, family, colleagues at work)
The following page provides more detail on survey administration.
23
Consumer Awareness Baseline Follow-Up (Continued)
To replicate the Edelman approach, the survey should be administered only to likely car buyers, identified using two screening questions:
• Which of the following vehicles are you likely to buy in the next 12 months? (boat, car/vehicle, truck, motorcycle; must select car/vehicle to continue)
• Which of the following have you done in order to buy or lease a vehicle? (e.g., researched new car models online, examined my finances to ensure I can afford a car; terminate if “none of the above”)
The Edelman survey population also excluded individuals who:
• Were younger than 18 • Had annual household income before taxes of less than $35,000 • Currently or previously worked for a car manufacturer or a new or used car dealership, a market/opinion
research company or department, or an advertising/public relations/marketing company or department, or have a family member who has worked for such a company or department
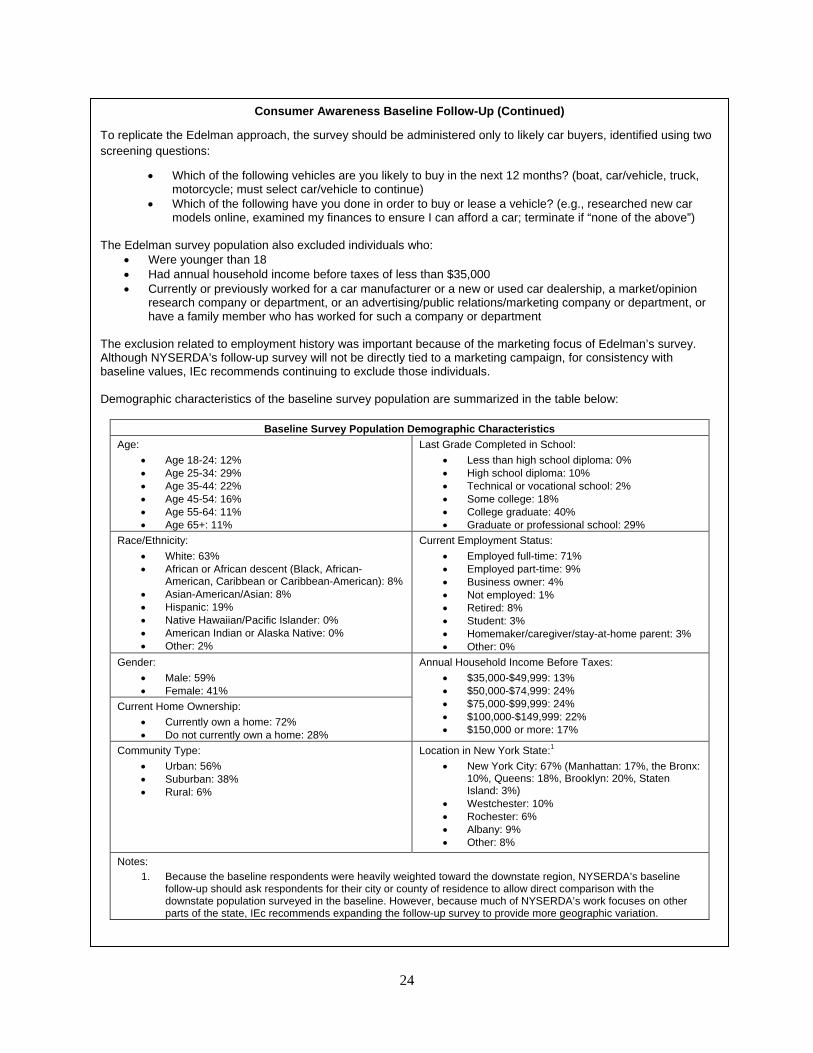
The exclusion related to employment history was important because of the marketing focus of Edelman’s survey. Although NYSERDA’s follow-up survey will not be directly tied to a marketing campaign, for consistency with baseline values, IEc recommends continuing to exclude those individuals. Demographic characteristics of the baseline survey population are summarized in the table below:
Baseline Survey Population Demographic Characteristics Age:
• Age 18-24: 12% • Age 25-34: 29% • Age 35-44: 22% • Age 45-54: 16% • Age 55-64: 11% • Age 65+: 11%
Last Grade Completed in School: • Less than high school diploma: 0% • High school diploma: 10% • Technical or vocational school: 2% • Some college: 18% • College graduate: 40% • Graduate or professional school: 29%
Race/Ethnicity: • White: 63% • African or African descent (Black, African-
American, Caribbean or Caribbean-American): 8% • Asian-American/Asian: 8% • Hispanic: 19% • Native Hawaiian/Pacific Islander: 0% • American Indian or Alaska Native: 0% • Other: 2%
Current Employment Status: • Employed full-time: 71% • Employed part-time: 9% • Business owner: 4% • Not employed: 1% • Retired: 8% • Student: 3% • Homemaker/caregiver/stay-at-home parent: 3% • Other: 0%
Gender: • Male: 59% • Female: 41%
Annual Household Income Before Taxes: • $35,000-$49,999: 13% • $50,000-$74,999: 24% • $75,000-$99,999: 24% • $100,000-$149,999: 22% • $150,000 or more: 17%
Current Home Ownership: • Currently own a home: 72% • Do not currently own a home: 28%
Community Type: • Urban: 56% • Suburban: 38% • Rural: 6%
Location in New York State:1 • New York City: 67% (Manhattan: 17%, the Bronx:
10%, Queens: 18%, Brooklyn: 20%, Staten Island: 3%)
• Westchester: 10% • Rochester: 6% • Albany: 9% • Other: 8%
Notes: 1. Because the baseline respondents were heavily weighted toward the downstate region, NYSERDA’s baseline
follow-up should ask respondents for their city or county of residence to allow direct comparison with the downstate population surveyed in the baseline. However, because much of NYSERDA’s work focuses on other parts of the state, IEc recommends expanding the follow-up survey to provide more geographic variation.
24
7. References
Alternative Fuels Data Center (AFDC). Alternative Fueling Station Locator. Downloaded February 17, 2017. http://www.afdc.energy.gov/locator/stations/
Alternative Fuels Data Center (AFDC). Vehicle Cost Calculator. http://www.afdc.energy.gov/calc/
Auto Alliance. ZEV Sales Dashboard. Accessed April 25, 2017. https://autoalliance.org/energy-environment/zev-sales-dashboard/
Cahill, Eric, Jamie Davies-Shawhyde, and Thomas S. Turrentine. 2014. New Car Dealers and Retail Innovation in California’s Plug-In Electric Vehicle Market. University of California, Davis, Institute of Transportation Studies. Working Paper UCD-ITS-WP-14-04. October 2014. http://www.its.ucdavis.edu/research/publications/publication-detail/?pub_id=2353
Carnegie Mellon. 2015. Electric Vehicle Adoption Potential in the United States. June 2015. http://www.cmu.edu/epp/policy-briefs/briefs/Electric-Vehicle-Adoption.pdf
Edelman Intelligence. Survey results provided by NYSERDA via email on March 22, 2017.
Electric Auto Association. Accessed April 25, 2017. http://www.electricauto.org
Energetics. NY DMV EV Analysis 2016-11-30. Data provided by NYSERDA on January 31, 2017.
Essence. Survey results provided by NYSERDA via email on January 13, 2017.
Interview with Adam Ruder, Program Manager at NYSERDA. Conducted February 15, 2017.
Interview with Barry Carr, Syracuse Coordinator at Clean Cities Coalition. Conducted September 14, 2016.
Interview with Constantine Samaras, Assistant Professor at Carnegie Mellon University’s Department of Civil and Environmental Engineering. Conducted August 24, 2016.
Interview with Jeremy Michalek, Professor of Mechanical Engineering and of Engineering and Public Policy at Carnegie Mellon University. Conducted September 15, 2016.
Interview with Neil Miller, Manager of Business Development at Leviton (formerly). Conducted September 8, 2016.
Kurani, Kenneth S., Nicolette Caperello, and Jennifer TyreeHageman. 2015. New Car Buyers’ Valuation of Zero-Emission Vehicles: New York. Plug-in Hybrid & Electric Vehicle Center, Institute of Transportation Studies, University of California, Davis. May 2015.
National Drag Racing Association. Accessed April 25, 2017. http://www.nedra.com/
National Drive Electric Week. Accessed April 25, 2017. https://driveelectricweek.org/index.php
25
NREL. 2016. Consumer Views on Plug-in Electric Vehicles - National Benchmark Report (Second Edition). December 2016.
NYSERDA. 2015. Cleaner, Greener Communities Program: Phase II Implementation Grants Program Opportunity Notice (PON) 2721, Category 1: Streamlined Permitting Fact Sheet. https://www.nyserda.ny.gov/-/media/Files/About/.../Category-1-Fact-Sheet.pdf
NYSERDA. 2015. Transportation Program: Product Development, Product Demonstration, and Product Deployment, Program Theory and Logic Model Report. August 2015. https://www.nyserda.ny.gov/-/media/Files/Publications/PPSER/Program-Evaluation/2015ContractorReports/2015-Transportation-LM-Report.pdf
NYSERDA. 2016. Clean Energy Fund Investment Plan: Clean Transportation Chapter. Portfolio: Innovation & Research. August 2016. https://www.nyserda.ny.gov/About/Clean-Energy-Fund
NYSERDA. 2016. Electric Vehicle Charging Station Implementation Plans for the Upstate New York I-90 Corridor. August 2016. https://www.nyserda.ny.gov/-/media/Files/Publications/Research/Transportation/16-28-ev-charging-station-implementation.pdf
NYSERDA. 2016. New York State Electric Vehicle Charging Station Quarterly Report: Report Period July through September 2016. Final Report. December 2016. https://www.nyserda.ny.gov/-/media/Files/Publications/EV-Charging-Station-Data/2016-EVSE-Q3.pdf
NYSERDA. 2016. Patterns and Trends – New York State Energy Profiles: 2000-2014. October 2016. http://www.nyserda.ny.gov/About/Publications/EA-Reports-and-Studies/Patterns-and-Trends
NYSERDA. 2017. NYSERDA Transportation Program Case Study: Leviton’s Electric Vehicle Charging Station Demonstration. March 2017. https://www.nyserda.ny.gov/-/media/Files/Publications/PPSER/Program-Evaluation/2017ContractorReports/Transportation-Case-Study-Report-Leviton.pdf
NYSERDA. Best Practice Guides for Charging Stations. Accessed April 25, 2017. https://www.nyserda.ny.gov/Researchers-and-Policymakers/Electric-Vehicles/Resources/Best-Practice-Guides-for-Charging-Stations
NYSERDA. Drive Clean Rebate for Plug-In Electric Cars. Accessed April 25, 2017. https://www.nyserda.ny.gov/All-Programs/Programs/Drive-Clean-Rebate
Salisbury, Mike, and Will Toor. 2016. How Leading Utilities are Embracing Electric Vehicles. Southwest Energy Efficiency Project. February 2016. http://swenergy.org/data/sites/1/media/documents/publications/documents/How_Leading_Utilities_Are_Embracing_EVs_Feb-2016.pdf
Sierra Club. Join Us To Rev Up Electric Vehicles! Accessed April 25, 2017. https://content.sierraclub.org/evguide/rev-up-evs
Sierra Club. Pick A Plug In. Accessed April 25, 2017. https://content.sierraclub.org/evguide/pick-a-plugin
26

The New York City Council. 2013. Legislation Text: A local law to amend the administrative code of the City of New York and the New York City building code, in relation to electric vehicle charging stations in open parking lots and parking garages. http://legistar.council.nyc.gov/LegislationDetail.aspx?ID=1501659&GUID=65344E17-4C65-4751-81E7-7A0D4DD9F7CD&Options=ID%7cText%7c&Search
Transportation & Climate Initiative of the Northeast and Mid-Atlantic States. 2012. Creating EV-Ready Towns and Cities: A Guide to Planning and Policy Tools. November 2012. http://www.transportationandclimate.org/creating-ev-ready-towns-and-cities-guide-planning-and-policy-tools
U.S. Department of Energy. Clean Cities. Accessed April 25, 2017. https://cleancities.energy.gov/coalitions/
27