Embed Size (px)
Citation preview

Appendix E
(to Initial Report on New York Power Grid Study)
Zero‐Emissions Electric Grid in New York by 2040 Study
App. E to Initial Report on Power Grid Study

Zero-Emissions Electric Grid in New York by 2040 Final Report
Prepared for: NYSERDA
New York State Energy Research and Development Authority
Albany, NY
New York State Department of Public Service
Albany, NY
Prepared by Siemens Power Technologies, Inc. (Siemens PTI)
Siemens Industry, Inc.
400 State St, Schenectady, NY 12305
Jay Boggs, Sr. Project Lead
Ben Stravinsky Project Manager
App. E to Initial Report on Power Grid Study

App. E to Initial Report on Power Grid Study

Notice This report was prepared by Siemens PTI, Inc. in the course of performing work contracted for and
sponsored by the New York State Energy Research and Development Authority (hereafter “NYSERDA”).
The opinions expressed in this report do not necessarily reflect those of NYSERDA, New York State
Department of Public Service (DPS) or the State of New York, and reference to any specific product,
service, process, or method does not constitute an implied or expressed recommendation or endorsement
of it. Further, NYSERDA, the DPS, the State of New York, and the contractor make no warranties or
representations, expressed or implied, as to the fitness for particular purpose or merchantability of any
product, apparatus, or service, or the usefulness, completeness, or accuracy of any processes, methods, or
other information contained, described, disclosed, or referred to in this report. NYSERDA, the DPS, the
State of New York, and the contractor make no representation that the use of any product, apparatus,
process, method, or other information will not infringe privately owned rights and will assume no liability
for any loss, injury, or damage resulting from, or occurring in connection with, the use of information
contained, described, disclosed, or referred to in this report.
NYSERDA makes every effort to provide accurate information about copyright owners and related matters
in the reports we publish. Contractors are responsible for determining and satisfying copyright or other use
restrictions regarding the content of reports that they write, in compliance with NYSERDA’s policies and
federal law. If you are the copyright owner and believe a NYSERDA report has not properly attributed your
work to you or has used it without permission, please email [email protected]. Information contained
in this document, such as web page addresses, are current at the time of publication.
App. E to Initial Report on Power Grid Study

E-ii
Table of Contents Notice ....................................................................................................................................... E-iList of Tables .......................................................................................................................... E-viList of Figures........................................................................................................................ E-viiAcronyms and Abbreviations ................................................................................................ E-viii
Executive Summary .......................................................................................................... E-11.1 Introduction ................................................................................................................................. E-1
1.2 Meeting New York State’s Goals .................................................................................................. E-2
Initial Scenario .................................................................................................................... E-3
1.3 High Demand Scenario ................................................................................................................ E-7
1.4 Overarching Observations of the Study .......................................................................................... E-9
Methodology ................................................................................................................... E-102.1 Study Plan Development ............................................................................................................ E-10
Step 1: Define Planning Objectives and Assumptions ........................................................... E-11
Step 2: Define Load and Distributed Energy Resources Forecasts .......................................... E-11
Step 3: Long-Term Capacity Expansion ............................................................................... E-12
Verifying Resource Adequacy ........................................................................................................ E-12
Ramping Adequacy and Flexibility Ramping Adequacy .................................................................... E-13
Step 4: Transmission Reliability Assessment ........................................................................ E-14
Step 5: Congestion Assessment ........................................................................................... E-15
Step 6: Define Transmission Solutions for Congestion .......................................................... E-15
Assumptions and Analytical Tools ................................................................................... E-163.1 Assumptions .............................................................................................................................. E-16
3.2 Tools Utilized ............................................................................................................................ E-20
AURORA by Energy Exemplar .......................................................................................... E-20
PowerGEM’s TARA .......................................................................................................... E-20
PROMOD IV and Database ................................................................................................ E-20
Power Analytics Software and Adjusted Production Costs Reporter ....................................... E-21
Long-Term Capacity Expansion—Initial Scenario ........................................................... E-224.1 Long-Term Capacity Expansion—Initial Scenario ........................................................................ E-22
Capacity Expansion—70% Renewable Generation by 2030................................................... E-22
Capacity Expansion—Zero Emissions by 2040..................................................................... E-23
Energy Storage .............................................................................................................................. E-24
App. E to Initial Report on Power Grid Study

E-iii
4.2 Energy Outlook—Initial Scenario ............................................................................................... E-25
Energy Outlook—70% Renewable Generation by 2030 ........................................................ E-25
Energy Outlook—Zero-Emission Generation by 2040 .......................................................... E-28
4.3 Energy Prices ............................................................................................................................ E-29
Energy Prices—70% Renewable Generation by 2030 ........................................................... E-29
Energy Prices—Zero-Emission Generation by 2040 ............................................................. E-30
4.4 Emissions .................................................................................................................................. E-31
4.5 System Reliability ...................................................................................................................... E-32
LOLE Analysis .................................................................................................................. E-32
Flexible Resource Adequacy ............................................................................................... E-34
Transmission Load-Flow Contingency Analysis— Initial Scenario .................................... E-36
5.1 Case Selection ........................................................................................................................... E-36
5.2 Case Development ..................................................................................................................... E-37
2040 Long-Term Capacity Expansion Model and Dispatches ................................................ E-37
Base Case Transmission Modeled ....................................................................................... E-38
Contingency and Monitoring Elements ................................................................................ E-38
5.3 Planning Criteria ........................................................................................................................ E-39
5.4 Initial Scenario Load-Flow Analysis Results ................................................................................ E-40
System Intact and Voltage Violations Observed ................................................................... E-40
Single-Contingency Analysis .............................................................................................. E-40
Multiple Contingency Analysis ........................................................................................... E-40
5.5 Load-Flow Analysis Findings ..................................................................................................... E-41
Congestion Analysis—Initial Scenario ............................................................................. E-42
6.1 Study Overview and Objectives .................................................................................................. E-42
6.2 Initial Scenario Case Development .............................................................................................. E-42
6.3 Initial Scenario Results Summary ................................................................................................ E-43
Model Overview and Forecast Overview 2030 and 2040 ....................................................... E-43
Demand Forecast, Fuel Forecast, and Emission Costs ....................................................................... E-44
Regional Interconnection Models .................................................................................................... E-44
Generation Modeling ..................................................................................................................... E-44
Transmission Nodal Modeling ........................................................................................................ E-45
Monitoring Elements, Interfaces, Flowgates ......................................................................... E-45
6.4 2030 Base Case Results—Initial Scenario .................................................................................... E-45
6.5 2040 Base Case Results—Initial Scenario .................................................................................... E-47
2040 Base Case Congestion and Curtailment ........................................................................ E-47
App. E to Initial Report on Power Grid Study

E-iv
6.6 2040 Upgrade Results—Initial Scenario ...................................................................................... E-49
2040 Upgrade Curtailment and Congestion .......................................................................... E-50
Transmission Upgrade Costs ............................................................................................... E-50
Adjusted Production Costs and Benefit to Cost Ratio ............................................................ E-51
6.7 Iteration Buildout Results—Initial Scenario ................................................................................. E-52
2040 Iteration Base Results ................................................................................................. E-52
2040 Iteration Upgrade Results ........................................................................................... E-53
Adjusted Production Costs and Benefit to Cost Ratio ............................................................ E-54
6.8 Summary of Comparisons of the Initial Scenario .......................................................................... E-54
High Demand Scenario ................................................................................................... E-56
7.1 Assumptions—High Demand Load Forecast ................................................................................ E-56
7.2 Long-Term Capacity Expansion—High Demand Scenario ............................................................ E-58
Long-Term Capacity Buildout ............................................................................................ E-58
Energy Outlook ................................................................................................................. E-59
Energy Prices .................................................................................................................... E-60
Emissions .......................................................................................................................... E-61
System Reliability .............................................................................................................. E-62
7.3 Transmission Reliability Analysis—High Demand Scenario.......................................................... E-63
Case Selection and Modeling .............................................................................................. E-63
Load-Flow Analysis Results ............................................................................................... E-64
System Intact and Voltage Violations Observed ............................................................................... E-64
Single and Multiple Contingency Analysis ....................................................................................... E-64
Load-Flow Analysis Findings ............................................................................................. E-65
7.4 Transmission Congestion Analysis—High Demand Scenario ........................................................ E-65
Study Overview and Objectives .......................................................................................... E-65
High Demand Scenario Development .................................................................................. E-65
High Demand Scenario Results Summary ............................................................................ E-66
7.5 2030 Base Results—High Demand Scenario ................................................................................ E-67
2030 Base Congestion and Curtailment ................................................................................ E-67
7.6 2040 Base Results—High Demand Scenario ................................................................................ E-68
2040 Base Congestion and Curtailment ................................................................................ E-68
7.7 2040 Upgrade Results—High Demand Scenario ........................................................................... E-71
2040 Upgrade Congestion and Curtailment .......................................................................... E-71
Adjusted Production Costs and Benefit to Cost Ratio ............................................................ E-72
7.8 2040 Iteration Buildout Results—High Demand Scenario ............................................................. E-73
App. E to Initial Report on Power Grid Study
E-v
2040 Iteration Base Results ................................................................................................. E-73
2040 Iteration Base Congestion and Curtailment .................................................................. E-73
7.9 2040 Iteration Upgrade Results—High Demand Scenario ............................................................. E-74
Adjusted Production Costs Savings and Benefit to Cost Ratio................................................ E-75
7.10 Findings and Observations—High Demand Scenario .................................................................... E-76
Electric Grid Analysis—Findings .................................................................................... E-77Annex A. Assumption Details ................................................................................................. E-78
App. E to Initial Report on Power Grid Study

E-vi
List of Tables Table 1-1. 2030 and 2040 Initial Scenario Installed Renewable Capacity in New York State .............. E-3Table 1-2. 2030 and 2040 Initial Scenario Renewable and Zero-Emission Generation in New York State
.................................................................................................................................... E-3Table 1-3. Initial Scenario Fast Ramping Capacity Needed to Provide 10-Minute Reserves ................ E-4Table 1-4. Initial Scenario Indicative Transmission Upgrades ......................................................... E-7Table 1-5. Initial Scenario and High Demand Scenario Demand ...................................................... E-7Table 1-6. Initial Scenario and High Demand Scenario 2040 Renewable Capacity Mix and Storage .... E-8Table 1-7. Initial Scenario and High Demand Scenario 2040 Indicative Transmission Upgrades ......... E-8Table 3-1. Key Assumptions in the Study ................................................................................... E-17Table 4-1. New York Annual Installed Capacity Supply Mix ........................................................ E-24Table 4-2. Actual 2019 New York ISO Generation by Technology and Energy Demand .................. E-26Table 4-3. 2025–2040 Annual Generation by Technology ............................................................ E-27Table 4-4. 2030 Renewable Generation Breakdown by Technology/Source .................................... E-28Table 4-5. 2040 Renewable Generable Generation Breakdown ..................................................... E-28Table 4-6. 2019 NYISO Around-the-Clock Day-Ahead Prices ..................................................... E-29Table 4-7. Equivalent Forced Outage Rate Demand (EFORD) and Mean Time to Repair (MTTR) .... E-33Table 4-8. Estimated Sub-hourly Flexible Reserves—Required versus Available ............................ E-35Table 5-1. 2040 Load for Two Dispatches Assessed for Initial Scenario ......................................... E-37Table 5-2. Load-Flow Assessment ............................................................................................. E-38Table 5-3. Voltage Limits Pre- and Post- Contingency ................................................................. E-39Table 6-1. Initial Scenario—Results Summary ............................................................................ E-43Table 6-2. Initial Scenario—2030 Base Constraints ..................................................................... E-46Table 6-3. Initial Scenario—2040 Base Constraints ..................................................................... E-48Table 6-4. Initial Scenario—2040 Base Indicative Transmission Upgrades ..................................... E-49Table 6-5. Initial Scenario—2040 Base, 2040 Upgrade and % Reduction ....................................... E-50Table 6-6. Indicative Upgrades and Costs ................................................................................... E-51Table 6-7. Initial Scenario—2040 Iteration Base Constraints ........................................................ E-53Table 6-8. Initial Scenario—2040 Iteration Constraints Base, Upgrade and % Reduction ................. E-53Table 7-1. Net Energy for Load—Initial Scenario and High Demand Scenario ................................ E-56Table 7-2. Summer and Winter Peak Load—Initial Scenario and High Demand Scenario................. E-56Table 7-3. 2020-2040 New York Installed Capacity Supply Mix—High Demand Scenario .............. E-59Table 7-4. 2025-2040 Annual Generation by Technology—High Demand Scenario ........................ E-60Table 7-5. 2030 and 2040 Renewable Generation Breakdown by Technology/Source ...................... E-60Table 7-6. Estimated Sub-Hourly Flexible Reserves—Required versus Available ........................... E-62Table 7-7. 2040 Load for Two Dispatches Assessed for High Demand Scenario ............................. E-64Table 7-8. High Demand Scenario—2040 Results Summary ......................................................... E-67Table 7-9. High Demand Scenario—2030 Base Constraints .......................................................... E-68Table 7-10. High Demand Scenario—2040 Base Constraints ........................................................ E-69Table 7-11. High Demand Scenario—2040 Base Indicative Transmission Upgrades ........................ E-70Table 7-12. High Demand Scenario—2040 Base, Upgrade Congestion, and % Reduction ................ E-71Table 7-13. High Demand Scenario—Indicative Upgrades by Zone with Costs ............................... E-72
App. E to Initial Report on Power Grid Study

E-vii
Table 7-14. High Demand Scenario—2040 Iteration Base Constraints and Costs ............................ E-74Table 7-15. High Demand Scenario—2040 Iteration Base, Upgrade, and % Reduction .................... E-75Annex
Table A- 1. NYISO Locational Capacity Requirement by Location ............................................... E-82Table A- 2. Energy Storage Overnight Capital Costs .................................................................... E-86Table A- 3. Original Long-Term Capacity Expansion Buildout—Initial Scenario ............................ E-88Table A- 4. Final Zonal Long-Term Capacity Expansion Buildout—Initial Scenario ....................... E-89Table A- 5. Original Long-Term Capacity Expansion Buildout—High Demand Scenario................. E-90Table A- 6. Final Zonal Long-Term Capacity Expansion Buildout—High Demand Scenario ............ E-91
List of Figures Figure 1-1. Major Congestion Areas Identified (2040) Initial and High Demand Scenario .................. E-6Figure 2-1. Integrated Generation and Transmission Planning Approach ........................................ E-10Figure 4-1. Zone A and Zone J Average Wholesale Energy Price Forecast ..................................... E-31Figure 4-2. Annual NYISO Carbon Emissions (Million Short Tons) Forecast ................................. E-32Figure 4-3. Five-Minute Solar Production and Flex Capacity Utilization ........................................ E-35Figure 6-1. Initial Scenario—2040 Base System Congestion ......................................................... E-49Figure 7-1. Monthly Peak Demand—Initial Scenario and High Demand Scenario ........................... E-57Figure 7-2. 2030 Hourly Peak Day Demand—Winter and Summer—High Demand Scenario ........... E-57Figure 7-3. 2040 Hourly Winter Peak Day Demand—High Demand Scenario ................................ E-58Figure 7-4. 2040 Hourly Summer Peak Day Demand—High Demand Scenario .............................. E-58Figure 7-5. Zone A and Zone J Average Wholesale Energy Price Forecast ($2018/MWH) ............... E-61Figure 7-6. Annual NYISO Carbon Emissions (Million Short Tons) Forecast ................................. E-62Figure 7-7. High Demand Scenario—2040 Base Congestion ......................................................... E-70Annex
Figure A- 1. 2030 Hourly Peak Day Demand—Winter and Summer—Initial Scenario ..................... E-78Figure A- 2. 2040 Hourly Winter Peak Day Demand—Initial Scenario .......................................... E-78Figure A- 3. 2040 Hourly Summer Peak Day Demand—Initial Scenario ........................................ E-79Figure A- 4. Natural Gas Price Forecast ..................................................................................... E-81Figure A- 5. RGGI CO2 Allowance Trajectory ........................................................................... E-82Figure A- 6. ICAP Supplier Payment Structure ........................................................................... E-84Figure A- 7. Topology for 2020 Reliability Needs Assessment: Study Years 2024 to 2030 ............... E-85
App. E to Initial Report on Power Grid Study

E-viii
Acronyms and Abbreviations
AC Alternating Current APC Adjusted Production Costs B/C Benefit to Cost Ratio BTM Behind The Meter CALISO California Independent System Operator CCGT Combined Cycle Gas Turbine (also CC) CLCPA Climate Leadership and Community Protection Act DC Direct Current DER Distributed Energy Resources EE Energy Efficiency EFORd Equivalent Forced Outage Rate on demand ELCC Effective Load Carrying Capability ft Feet HVDC High Voltage Direct Current IRM Installed Reserve Margin ISO-NE New England Independent System Operator kv Kilovolts kWh Kilowatt hours LBW Land Based Wind LOLE Loss of Load Expectation LTCE Long-Term Capacity Expansion m/s Meters Per Second MISO Midcontinent Independent System Operators MTTR Mean Time To Repair MW Megawatts NYC New York City NYC Tx New York City Transmission NYS New York State NYCA New York Control Area (same footprint as NYISO) NYISO New York Independent System Operator NYSERDA New York State Energy Research and Development Authority PV Photovoltaic BES Battery Energy Storage PJM An independent system operator, covers New Jersey, Pennsylvania, Maryland,
among other states pu Per Unit SCCT Simple Cycle Combustion Turbine SCED Security Constrained Economic Dispatch W Watts
App. E to Initial Report on Power Grid Study

E-1
Executive Summary 1.1 Introduction
In July 2019, Governor Cuomo signed the Climate Leadership and Community Protection Act (CLCPA),
which adopted the most ambitious and comprehensive climate and clean energy legislation in the United
States. The CLCPA requires New York State to achieve a zero-emission electricity system by 2040 and
reduce greenhouse gas emissions 85% below 1990 levels by 2050 (mid-century). The CLCPA sets a new
standard for states and the nation to expedite the transition to a clean energy economy. As part of this push
to decarbonize the grid, the legislation codifies Governor Cuomo's nation-leading sustainability goals
outlined in his Green New Deal, including a mandate for at least 70% of New York State's electricity to
come from renewable energy sources such as wind and solar by 2030.
This globally unprecedented ramp up of renewable energy would include at least the following:
• Quadrupling New York State's offshore wind target (OSW) to 9,000 megawatts by 2035, up from 2,400 megawatts by 2030
• Doubling distributed solar deployment to 6,000 megawatts by 2025, up from 3,000 megawatts by 2023
• Deploying 3,000 megawatts of energy storage by 2030, with an interim target of 1,500 megawatts by 2025
The achievement of these goals is likely to require investments in New York State’s electric transmission
system. The scope and nature of these investments are expected to vary depending upon the location, type
of energy storage, and zero-emission generation resources that are added to the system to meet the overall
goal. While New York does not have a vertically integrated electricity market or structure, conducting
transmission, generation, and energy storage resource planning would be useful in identifying potential
strategies and needs to support the fulfillment of the State’s clean energy goals.
In this context, NYSERDA and the Department of Public Service (DPS), collectively referred to as “the
State team,” developed a resource planning study to analyze a transmission, generation, and storage options
for meeting New York State’s goals of zero-emission electricity by 2040 and achieving interim targets of
70% renewable generation by 2030. The study seeks to identify reliable and cost-efficient system outcomes
based on the assumptions used for each scenario that was analyzed.
This report presents the results of the study and addresses the following research questions:
• What level of land-based, zero-emission resources can be added to the system without the need for bulk transmission upgrades?
• What levels of fast response resources are required as renewable generation levels rise?
App. E to Initial Report on Power Grid Study

E-2
• What bulk transmission (and/or energy storage) investments are needed to avoid having upstate zero-emission generation “bottled” by systemic congestion and unable to serve New York load?
The results illustrate two potential scenarios for how New York State can meet the CLCPA’s objectives
economically based on a set of given assumptions. The study is centered on assessing transmission impact
and needs at the Bulk Power System (BPS), 230 kV and above. Additional insights related local
transmission may be found in the NYISO Congestion Assessment and Resource Integration Study (CARIS)
and the Utility Transmission & Distribution Investment Working Group Report.
The study analyzed two scenarios: the Initial Scenario and the High Demand Scenario. The Initial Scenario
demand forecast reflects the assumptions used on the High Technology Availability Pathway section of the
Pathways to Deep Decarbonization in New York State1 study, while the high demand load forecast is based
on the Limited Non-Energy Pathway developed as part of the same study. The high demand load forecast
was refined to include 2030 statewide demand and peak levels that are comparable to those in the NYISO
CARIS 70 x 30 Base Load case while maintaining the 2040 outcomes of the pathways case.
Both scenarios result in resource portfolios that keep New York State on a trajectory to meet the interim
goal of 70% renewable energy by 2030 and zero-emission generation by 2040. The main difference between
the scenarios is that the High Demand Scenario electricity demand forecast has a greater growth trajectory
for net energy for load and peak load forecast. In addition, the High Demand Scenario shows that the State
could become a winter peaking system by 2040.
1.2 Meeting New York State’s Goals
To achieve New York State’s interim goal of 70% renewable generation by 2030 and a zero-emission
electricity system by 2040, a substantial amount of renewable capacity will need to be developed across the
State. Based on the study’s assumptions, New York State can economically achieve its goals by adding a
diversified combination of renewable capacity to the power generation supply mix, substantially increasing
the deployment of energy storage, and making investments in bulk power system transmission (230 kV and
above) over the 2030 to 2040 period. In the short term, local transmission investments to support
interconnection of renewable generation are expected to be added to the system.
1 Visit https://climate.ny.gov/Climate-Resources for The study Pathways to Deep Decarbonization in New York State.
App. E to Initial Report on Power Grid Study

E-3
Initial Scenario
Table 1-1 shows the diversified installed capacity mix resulting from the assumptions on the Initial
Scenario. Table 1-2 summarizes the renewable generation produced to meet electricity demand in 2030 and
2040. This supply mix provides sufficient power generation to meet future electricity demand while
maintaining system reliability based on current market structures and reliability requirements. The supply
mix reflects a substantial increase in the amount of energy storage, which will support the integration of
zero-emission resources while providing reserves.
Table 1-1. 2030 and 2040 Initial Scenario Installed Renewable Capacity in New York State
In megawatts.
2030 2040
DG Solar (AC) 2 5,323 6,443
Grid Solar 3,808 16,759
Land-based Wind 6,230 12,804
Offshore Wind 6,000 9,837
NYC Tx 1,250 1,250
Energy Storage 3,000 15,515
Table 1-2. 2030 and 2040 Initial Scenario Renewable and Zero-Emission Generation in New York State
In gigawatt hours.
2030 2040
Energy Demand 151,605 207,477
Total RE Generation 106,124 180,584
RE Gen % of Demand 70.0% 87.0%
NYC Tx 9,930 9,340
Legacy Can. Hydro 10,009 10,069
DG Solar 7,994 9,697
Grid Solar 5,571 31,902
Land-based Wind 18,888 43,950
Offshore Wind 24,062 45,478
NY Hydro 28,039 28,684
Other Renewables* 1,640 1,532
* “Other Renewables” Generation Discounted 40%
2 New York State features 6,000 MW (DC) of distributed solar in 2025 and 6,601 MW (DC) in 2030 and therefore exceeds the State goal of having 6,000 MW (DC) in 2025.
App. E to Initial Report on Power Grid Study

E-4
The Other Renewables row in the table above includes generation using biomass and landfill gas. Due to
uncertainty in eligibility for certain resources, the contribution of Other Renewables was discounted by
40%. The NYC Tx (New York City Transmission) row refers to a new 1,250 MW HVDC transmission
line capable of delivering 10,000 gigawatt hours (GWh) of dispatchable renewable energy directly into
New York City. This is a proxy project under the recently approved Tier 4 Clean Energy Standard (CES)
that seeks to increase renewable energy into New York City (NYISO Zone J).
This supply mix was found to have adequate levels of flexible operating capacity to ensure system
reliability under the Initial Scenario. Table 1-3 provides an estimate of the capacity required to achieve
this objective.
Table 1-3. Initial Scenario Fast Ramping Capacity Needed to Provide 10-Minute Reserves
In megawatts.
NYCA (Zone A-K)
East (Zone F-K)
SENY (Zone G-K)
NYC (Zone J)
Long Island
(Zone K)
2030 2,981 1,947 1,647 901 557
2040 5,877 3,557 2,596 1,268 964
With the Initial Scenario capacity buildout through 2030, New York State achieves the CLCPA’s renewable
generation and emission targets without transmission upgrades at the bulk power system (BPS), beyond
those already committed by public policy and expected under Tier 4. Upgrades include the Western NY
Empire State line 345 kilovolt (kV) project in Zone A, AC Transmission Segment A & Segment B 345 kV
projects in Zone E and F as well as the Northern New York 345 kV projects in Zone D and E that were
expanded to include the expected upgrades reinforcing the connection between Porter to Edic substations
at 345 kV. Additionally, there is a new 1,250 MW HVDC transmission asset delivering dispatchable
renewable energy into New York City (the NYC Tx project). This finding assumes that any upgrades
necessary at the local transmission and sub-transmission levels for the interconnection of renewable
generation as well as delivery to the local loads are in place.
The CLCPA’s zero-emission targets are met by 2040 without the need for major upgrades to the BPS
transmission. The low levels of renewable generation curtailment observed did not hamper achievement of
the CLCPA’s goals. Again, this finding assumes that any necessary local transmission and sub-transmission
level investments are in place.
App. E to Initial Report on Power Grid Study

E-5
However, even though zero-emissions targets are met, without any additional BPS transmission upgrades
by 2040, system congestion and, to a lesser extent, curtailment (1.5% statewide) will occur during high
levels of renewable energy production. By 2040 without BPS transmission upgrades, system congestion
and curtailment result in higher production costs. This finding is more pronounced under the High Demand
Scenario since the higher demand fosters much higher levels of congestion, as presented later in this
summary. The study identified indicative bulk system upgrades that may be able to economically alleviate
substantial levels of congestion. Additional information can be found in sections 6 and 7.
Figure 1-1 shows a general overview of the location of the major constraints by 2040 when the New York
State power supply will achieve the zero-emissions goal. As can be observed in the figure, these
transmission constraints are largely concentrated in the system connecting renewable resources in Upstate
New York with New York City and Long Island. The locations of these constraints are the same under both
the Initial and the High Demand scenarios, differing only on the level of congestion and dimension of the
upgrades necessary to address the issue.
App. E to Initial Report on Power Grid Study

E-6
Figure 1-1. Major Congestion Areas Identified (2040) Initial and High Demand Scenario
* Highlighted area on the map indicate major constraints.
The indicative upgrade projects identified are summarized in Table 1-4. These projects were found to
relieve both congestion and curtailment, and the economic benefits of these projects exceed their costs.
However, further research is needed given the dependence of this outcome on uncertainties on the
renewable buildout, load growth, the actual cost of the projects and their constructability, which may result
in material modifications. As no action is immediately needed, there is time to conduct this research. The
transmission upgrades were not identified to be needed until after 2030, and further research should solidify
uncertainty factors, identify the best alternatives to be built, and address the expected congestion.
App. E to Initial Report on Power Grid Study

E-7
Table 1-4. Initial Scenario Indicative Transmission Upgrades
Zone Indicative Transmission Upgrade
H/I/J Increase Millwood South Interface transfer capability to 13000 MVA, and increase Dunwoodie South Interface transfer capability to 6000 MVA
I/K Increase Dunwoodie—Shore Rd cables LTE rating to ~3000 MVA. (likely require two new 345 kV cables in parallel and two new 345/138kV transformers at Shore Rd)
E/G Increase Coopers Corner—Middletown—Rock Tavern—Dolson Ave 345 kV line sections LTE rating to ~3000 MVA
G Increase Ladentown—Ramapo 345 kV line LTE rating to ~2500 MVA
High Demand Scenario
The High Demand Scenario identified an economic supply mix to meet the interim goal of 70% renewable
energy by 2030 and zero-emission generation by 2040. The High Demand Scenario assumes net energy
load increases on average 2.0%/yr. from 2020 to 2040 and peak load increases on average 1.5%/year from
2020 to 2040 and New York transitions to a winter peak. By 2040, net energy load is 12.5% greater and
peak load is 10.2% greater than the Initial Scenario as shown in Table 1-5.
Table 1-5. Initial Scenario and High Demand Scenario Demand
INITIAL SCENARIO HIGH DEMAND Change (%)
ELECTRICTY DEMAND 2030 2040 2030 2040 2030 2040
Net Energy for Load (GWh) 151,678 207,506 162,188 233,481 6.9% 12.5%
Peak Load (MW) 30.3 38.1 34.4 42.0 13.5% 10.2%
Table 1-6 shows the economic mix to realize the zero-emission goal by 2040 for the Initial Scenario and
for the High Demand Scenario. Under the High Demand Scenario, the New York State electricity system
would require substantially more renewable capacity. The increase is concentrated in grid solar generation
(35% more) and offshore wind generation (38% more). Storage and onshore wind reduced slightly.
App. E to Initial Report on Power Grid Study

E-8
Table 1-6. Initial Scenario and High Demand Scenario 2040 Renewable Capacity Mix and Storage
RENEWABLE CAPACITY (MW)
INITIAL SCENARIO
HIGH DEMAND
Change (MW)
DG Solar (MW-AC) by 2040 6,443 6,443 0
Grid Solar by 2040 16,759 22,577 5,818
Onshore Wind by 2040 12,804 12,690 (114)
Offshore Wind by 2040 9,837 13,597 3,760
Energy Storage by 2040 15,515 14,891 (624)
NY Tx by 2040 1,250 1,250 0
The construction of the New York Public Policy transmission projects described in the Initial Scenario text
support the achievement of the 70% renewable goal by 2030 with low levels of renewable curtailment and
bulk system congestion. As such, no additional bulk transmission projects (230 kV and above) were
identified by 2030 under the High Demand Scenario. However, transmission upgrades are likely necessary
at the local transmission level.
By 2040, high levels of uneconomic congestion and some curtailment are expected with the generation
additions identified to achieve the goal of a zero-emission electric system. Overall, the congestion and
curtailment considerations are similar under the Initial and High Demand Scenarios, but they are more
pronounced in the High Demand Scenario. Indicative bulk transmission upgrades, shown in Table 1-7 were
found to relieve both congestion and curtailment with the economic benefits of these upgrades exceed their
costs. However, further research is needed to assess the various forms of uncertainty including: the
generation buildout and its location, the level of load growth, and the best potential designs and costs for
these potential projects. As the transmission upgrades were not needed until after 2030, there is ample time
to conduct this further research.
Table 1-7. Initial Scenario and High Demand Scenario 2040 Indicative Transmission Upgrades
In mega volt amperes (MVA).
Zone UPGRADE
INITIAL SCENARIO
HIGH DEMAND
Change
H/I/J Millwood South Interface 13,000 17,000 4,000
Dunwoodie South Interface 6,000 6,000 0
I/K Dunwoodie—Shore Rd. LTE Rating 3,000 4,000 1,000
E/G Coopers Corner—Middleton—Rock Tavern—Dolson Ave 345 kV LTE
3,000 3,000 0
G Ladentown—Ramapo 345kV LTE 2,500 2,500 0
App. E to Initial Report on Power Grid Study

E-9
1.3 Overarching Observations of the Study
The analysis carried out in the study indicates that New York State can achieve its 70 x 30 and zero-emission
generation by 2040 goals with a mix of distributed energy, energy efficiency measures, energy storage,
planned transmission projects, utility-scale renewables, and zero-emission resources.
Energy storage would be used to store excess solar and wind energy so that this energy may be utilized
during peak hours. This additional storage will contribute to the maintenance of locational planning reserve
margins.
The construction of the New York Public Policy transmission projects described previously supports the
achievement of the 70% renewable goal by 2030 with low levels of bulk system curtailment and congestion.
As such, no additional bulk transmission projects (230 kV and above) were identified by 2030 under either
the Initial Scenario or the High Demand Scenario. However, transmission upgrades may be necessary at
the local transmission level and additional needs may be found based on a more detailed analysis of New
York’s offshore wind goal.
By 2040, high levels of uneconomic congestion and some curtailment are expected with the generation
additions identified to achieve the goal of a zero-emission electric system. Overall, the congestion and
curtailment considerations are similar under both scenarios, but they are more pronounced in the High
Demand Scenario. Indicative bulk transmission upgrades, described in more detail in sections 6 and 7, were
found to relieve both congestion and curtailment with the economic benefits of these upgrades exceeding
their costs. However, further research is needed to assess the various forms of uncertainty, including the
generation buildout and its location, the level of load growth, and the best potential designs and costs for
these potential projects. As the transmission upgrades were not needed until after 2030, there is ample time
to conduct further research.
App. E to Initial Report on Power Grid Study

E-10
Methodology 2.1 Study Plan Development
The electric power industry is undergoing a paradigm shift characterized by a changing supply matrix with
a shift towards renewable generation and storage, developments in both local and utility scale, and large
retirements of the existing conventional thermal generation. These developments have demanded, more
than ever, a planning process that more fully integrates generation resources with transmission capabilities.
Improved integration is achieved in this analytical process via the creation of an iteration case that is
triggered if the Long-Term Capacity Expansion plan or LTCE (step 3) results in significant congestion
and/or renewable curtailment (steps 4 and 5), thus prompting transmission investments (step 6). This
iteration allows for the revision of the LTCE to account for both the added cost of transmission for the
renewable asset and the increase in transmission limits. This results in a capacity expansion plan that is
more closely coordinated with the changes in transmission. The planning approach used in the study is
depicted in the figure below.
Figure 2-1. Integrated Generation and Transmission Planning Approach
* The figure highlights the tools and approach for this project.
App. E to Initial Report on Power Grid Study

E-11
Step 1: Define Planning Objectives and Assumptions
The primary objective considered in the study is the achievement of zero-emission supply by 2040 with an
intermediate goal in 2030 of 70% of the energy supply coming from renewable resources. In interpreting
the State goal of a zero-emission electricity grid by 2040, the study solves for a system in which all supply
resources located in the State are zero-emission resources by 2040. For the purposes of the study, “zero-
emission resources” constitute resources that are zero emission via their fundamental generation technology
(e.g., wind and solar) or that use fuels deemed to be zero emissions (e.g., renewable natural gas [RNG]).
Consistent with the definition of renewable energy systems in the CLCPA, hydro imports contributed to
the achievement of the renewable energy goals excluding these renewable imports, New York State was
found to have zero net imports in 2040. A comprehensive list of the assumptions used in the study is
provided in section 3.
Step 2: Define Load and Distributed Energy Resources Forecasts
Distributed Energy Resources (DER) and loads are modeled in an aggregated fashion.
Analyzing the growth of various behind-the-meter resources was beyond the scope of this project, such as
demand response (flex load), commercial battery energy storage, and other behind-the-meter generation
resources. The only DER technology analyzed was behind-the-meter (BTM) PV. The study assumes timely
achievement of 6 GW BTM solar target by 2025, and then applies an average annual growth rate of 1.9%
for the years 2026–2040. The average annual rate is calculated as the average of year-on-year growth rate
for years 2026–2040 from 2020 NYISO Goldbook.
Regarding battery energy storage, the study analyzed the economic development of utility-scale energy
storage using wholesale energy revenues and ICAP payments as criteria.
Two scenarios were formulated with respect of the load forecast. The Initial Scenario’s load forecast reflects
the assumptions used on the High Technology Availability Pathway section of the Pathways to Deep
Decarbonization in New York State3 study, while the high demand load forecast is based on the Limited
Non-Energy Pathway developed as part of the same study. The high demand load forecast was refined to
include 2030 statewide demand and peak levels that are comparable to those in the NYISO CARIS 70 x 30
3 Visit https://climate.ny.gov/Climate-Resources for The study Pathways to Deep Decarbonization in New York State.
App. E to Initial Report on Power Grid Study

E-12
Base Load case while maintaining the 2040 outcomes of the pathways case. Electric vehicle and electric
heating penetration are included in these pathways forecasts.
Step 3: Long-Term Capacity Expansion
Once the planning objectives were defined, the project team developed assumptions common to the Initial
Scenario and the High Demand Scenario. The study also incorporated forecasts for a variety of inputs
including fuel prices, emission prices, technology (particularly renewable generation and storage) costs,
and performance.
Both scenarios reflect all operating and other requirements, such as reserve margins, interim renewable
targets, and transmission constraints. When running multiple models for generation and transmission
planning, this methodology ensures that the forecasts are consistently applied across models.
The AURORA long-term capacity expansion (LTCE) model was used for both scenarios.
The AURORA model determines the most economic mix of generation and energy storage resources that
achieve the State renewable requirements for each scenario as well as maintain all operational reliability
requirements. The objective function seeks to maximize the value of generation and energy storage,
considering revenues and costs in an efficient market.
The AURORA model was run in zonal mode with each NYISO zone represented by its portfolio of supply
and load as well as transfer limits to adjacent zones.
Verifying Resource Adequacy
As part of the LTCE analysis, New York State’s 2020 Installed Reserve Margin (IRM) and locational
capacity requirements were met annually. In addition, the State’s Installed Capacity Market (ICAP) was
simulated by adopting the 2020 ICAP demand curves along with ICAP/UCAP (Unforced Capacity Market)
translation factors. By adhering to the IRM, locational capacity requirements, and the ICAP market, the
capacity expansion plan is able to meet the 1-in-10 LOLE criteria. This method is dependent on estimating
and assigning to renewable resources and storage devices a proper Effective Load Carrying Capability
(ELCC) used to contribute to the IRM and locational capacity requirements. Thus, as presented later in this
report, the ELCC of solar, onshore wind, and offshore wind generation was determined dynamically to
account for increased penetration. Additionally, the storage contribution was made a function of the energy
content (two, four, or six hours).
The modeling methodology incorporated several verification steps that guarantee that the 1-in-10 LOLE
criteria was met. In addition to the IRM, AURORA’s internal LTCE optimization ascribes a high cost and,
hence, low value to a proxy energy source to capture the cost of energy not served (ENS) and avoids proxy
App. E to Initial Report on Power Grid Study

E-13
energy sources in meeting the load. As such, the model’s cost minimization logic results in new peaking or
storage resources added to the system for reserves and avoidance of ENS.
To determine if a select portfolio will meet the 1-in-10 LOLE standard, Siemens PTI employed AURORA’s
risk outage functionality and demand uncertainty features. The process also incorporates load uncertainty.
A simulation was run incorporating both load and outage uncertainty in AURORA up to 1,000 times over
select years with each iteration producing a different internally generated net (demand minus supply) outage
pattern for resources.
The study also benchmarked the results of AURORA LOLE analysis against a comparable analysis using
the GE MARS analysis tool for the Initial Scenario. It was determined prior to obtaining the benchmark
results that if the modeling results were similar, no further changes would be made. GE MARS produced
results that were substantially the same as AURORA LOLE for the Initial Scenario. (see section 4.5.1), thus
the High Demand Scenario was only assessed with AURORA.
Ramping Adequacy and Flexibility Ramping Adequacy
Ramping reserves are used in each of the ISO markets to address the actual variability of load including
deviations of resource scheduling and dispatch instructions, import schedules, and any other non-
contingency variable factors. Ramping reserves address inter-scheduling period deviations required to
follow load and compensate for scheduling uncertainties. The study estimated the ramping reserve
requirements in supply portfolios based on the estimated variation in day-ahead market load projections
versus actual load (load to serve minus non-dispatchable generation).
Flexibility reserve (Flex) is a relatively new type of ancillary service product that has been implemented in
CAISO (California) and MISO energy markets to address the increasing need for resources that can rapidly
ramp up or down to respond to the changes in the intra-hour production of renewable resources. The study
estimated the Flex adequacy requirements in supply portfolios based on the estimated sub-hourly variation
in renewable energy production and load.
The study used a program developed by Siemens PTI in Python scripting language for assessing the
adequacy of Flex serving resources in the portfolio. The program uses the industry-standard Monte Carlo
approach of simulating multiple state-space possibilities of sub-hourly system performance. The Monte
Carlo approach generated sub-hourly forecast data in a probabilistic manner, allowing the capture of any
extreme weather conditions, customer load behaviors, and renewable generation variability. A normal
distribution was used to generate the probabilistic distribution of sub-hourly generation and load forecasts.
For Flex adequacy calculations, the program generated randomly selected values for sub-hourly site level
renewable energy production and load data. The program generated sub-hourly net load (load to serve
App. E to Initial Report on Power Grid Study

E-14
minus non-dispatchable generation) and compared the hourly average levels against the sub-hourly actual
net load to arrive at the maximum possible deviation of sub-hourly load settlements against the hourly
averages. These sub-hourly deviations were then compared to available resources with appropriate ramping
capabilities to assess if the portfolio was short Flex serving assets or not. This process was repeated 1,000
times to capture extreme behavior. Once the amount of ramping and Flex resources were defined, they were
then added as AURORA constraints for AURORA to select the least cost resources to meet the ramping
and Flex adequacy requirements.
Step 4: Transmission Reliability Assessment
The LTCE identified in the AURORA analysis from step 3 was an input to the steady-state assessments for
each scenario. However, the assessment does not include a network bus allocation for the generation
resources added as it is based on zonal information. To address this, interconnection points were determined
first for those AURORA-selected projects that could be aligned with the NYS queue. For resources for
which there was no queue, the new generation on the capacity expansion was mapped to substations
as follows:
• Land based wind (LBW) and solar photovoltaic (PV) projects were assigned to substations near the identified latitude and longitudinal locations of the renewable generation.
• Battery Energy Storage (BES) was modeled at substations that contain similarly sized PV/LBW resources. Storage is dispatched by the optimization process (AURORA and PROMOD) based off the net load curve (i.e. gross energy demand minus renewable generation), resulting in energy storage charging when net load is the lowest (when renewable generation is high) and discharges when net load is high (when renewable generation is low). The net load curve also provides a good representation for when energy prices are at a daily high for storage discharge and for when energy prices are daily low for charging.
• Additional Thermal Generation was modeled as a potential repowering at sites of retired conventional units. For example, Brownfield sites are likely to have the pipelines already in place and could be good sites for the renewable natural gas (RNG) resources.
• Behind the meter rooftop solar (DG Solar) was placed at load buses of similar size.
The focus of the analysis was on the bulk transmission system 230 kV and above, although lower voltages
were also monitored. The analysis was carried out for 2030 and 2040 to identify potentially needed
expansions. The analysis was performed only for certain snapshots that resulted in heavy utilization of the
transmission system based on the dispatch of the zonal runs (summer peak high solar and high wind, low
load). In determining any needed expansions, reassignment of resources between the substations and
additional energy storage were considered as alternatives to traditional transmission reinforcements. This
portion of the study identified transmission upgrades required, for example, to deliver renewable generation
App. E to Initial Report on Power Grid Study

E-15
to NYC (Zone I) and Long Island (Zone K) and that were later confirmed under Step 5: Congestion
Assessment.
Step 5: Congestion Assessment
In the next step, a nodal analysis was performed using the PROMOD analysis tool to identify congestion
and/or curtailment issues not determined in the above power flow analysis with a view across the 8,760
hours of the year. PROMOD uses a security-constrained nodal analysis in a power flow model and considers
all variable costs of the generators to dispatch generation economically while preventing security violations.
The nodal analysis identified the need for potential additional transmission enhancements to mitigate
congestion and/or curtailment and allow for the lowest operational cost of the system.
Step 6: Define Transmission Solutions for Congestion
It was expected that the analysis in steps 5 and 6 would result in notable levels of congestion and possibly
renewable curtailment. As such, in step 6 indicative transmission expansions to address these issues were
identified and effectiveness assessed in terms of benefit to cost (B/C) ratios. These ratios measure the
reduction in operating costs in terms of the Adjusted Production Costs (APC). APC accounts for energy
sales and purchases with neighbors made possible by the indicative transmission projects and then divides
sales and purchases by carrying costs to evaluate return on capital, amortization, and O&M. The increase
in transmission limits (along with associated costs) is allocated back to the generation that would benefit
from the transmission upgrades. The cost associated with the upgrades is identified through shift factors or
the percentage of their flow over the reinforced facility. The findings were then passed back to the
AURORA LTCE assessment (step 3) to potentially create a revised generation and storage resource mix.
App. E to Initial Report on Power Grid Study

E-16
Assumptions and Analytical Tools 3.1 Assumptions
The study utilizes a broad set of power market assumptions across a 20-year period (2020 to 2040). Inputs
to the modeling process such as load forecasts, fuel and technology price curves, and other factors are
derived from multiple sources including third-party providers such as: S&P Global Platts and IHS and other
independent sources such as the Energy Information Administration (EIA); American Wind Energy
Association (AWEA); National Renewable Energy Laboratory (NREL); and the Environmental Protection
Agency (EPA). These inputs reflect only one view of the data and modeling results evolve as technology
costs and load forecasts change.
Implementing current and widely accepted market input data is the initial step of the study’s development
process. Data inputs such as load forecast, energy efficiency and demand side management projections,
fuel prices, projected CO2 prices, individual plant operating and cost information, and future resource
information were updated with the most current data as of December 2019.
A detailed discussion of each of these data elements has been presented throughout this document. Data
points are examined in more detail in the annexes.
• Load forecast for customer demand, inclusive of energy efficiency (EE), and demand response.
• Environmental legislation and regulations.
• Renewable resources and cost projections.
• Fuel costs forecasts.
• Technology costs and operating characteristics.
Table 3-1 provides a high-level summary of key assumptions applied to the study. A more detailed review
of each of the major assumptions and their sources can be found in the annexes.
App. E to Initial Report on Power Grid Study

E-17
Table 3-1. Key Assumptions in the Study
INPUT INITIAL SCENARIO HIGH DEMAND SCENARIO
Load Forecast4 2020-30’ Energy: -0.43%/yr.
2030 Energy: 152 TWh 2030 Winter Peak: 23 GW
2030 Summer Peak: 30 GW
2030-40’ Energy: 3.2%/yr. 2040 Energy: 208 TWh
2040 Winter Peak: 34 GW 2040 Summer Peak: 38 GW
2020-30’ Energy: 0.33%/yr. 2030 Energy: 162 TWh 2030 Winter Peak: 27 GW 2030 Summer Peak: 34 GW
2030-40’ Energy Rate: 1.8%/yr. 2040 Energy: 234 TWh 2040 Winter Peak: 42 GW 2040 Summer Peak: 42 GW
CLCPA Targets 70% Renewable Generation by 2030 Zero-emission Generation by 2040
Installed Reserve Margin
& Locational Capacity
Requirements
NYCA: 118.9%
Zone J: 88.6% Zone K: 103.4%
Zone G-J: 90%
Installed Capacity Market
ICAP Summer 2020 Demand Curves; 2020/2021 ICAP/UCAP Translation Factors5
DG Solar 6,601 MW-DC (5,323 MW-AC) by 2030 7,989 MW-DC (6,443 MW-AC) by 2040
NYC HVDC DC transmission line delivering 10,000 GWh of dispatchable renewable energy into NYC (1,250 MW)
Offshore Wind 9,000 MW by 2035 (6,000 MW allocated to Zone J and 3,000 to Zone K)
Battery Energy Storage
3,000 MW by 2030 distributed in a manner consistent with the New York State Energy Storage Roadmap6; allowed model to economically build BES based on duration (2-hr, 4-hr, 6-hr)
Natural Gas Prices
Henry Hub reaches $4/mmBtu by 2039; RNG in 2040 $23/mmBtu and limited to 32 Tbtu/yr
Emission Prices RGGI: NYISO CARIS prices through 2028; Increases 7%/yr thereafter reaching $22/CO2-ton by 2040
Nuclear 80-yr useful life (EPA v6 Base Case Documentation) Except for announced retirements
Zonal Transfer Limits 2020 NYISO Reliability Needs Assessment (RNA) topology study years 2024–2030
Load Forecast: The Initial Scenario load forecast is from the High Technology Availability Pathway
section of the Pathways to Deep Decarbonization in New York State7 study while the High Demand
4 Load forecast does not net out behind-the-meter solar 5 Visit https://www.nyiso.com/documents/20142/11477343/ICAP-Translation-of-Demand-Curve-Summer-2020-
FINAL.pdf/63166d63-50c4-e2fb-cfcc-38a17274997b for ICAP/UCAP Translation of Demand Curve 2020. 6 Energy storage price curves are from NY’s Energy Storage Roadmap are included in the Annex. 7 Visit https://climate.ny.gov/-/media/CLCPA/Files/2020-06-24-NYS-Decarbonization-Pathways-Report.pdf for the
Decarbonization Pathways Report.
App. E to Initial Report on Power Grid Study

E-18
Scenario load forecast is based on the Limited Non-Energy Pathway of the same study. The high demand
load forecast was refined to include 2030 statewide demand and peak levels that are comparable to those in
the NYISO CARIS 70 x 30 Base Load case while maintaining the 2040 outcomes of the pathways case.
70% Renewable Generation by 2030: For the 2030 interim target, renewable generation from the
following sources are applicable: distributed solar, grid solar, onshore wind, offshore wind,
hydroelectricity, Legacy Canadian hydro imports, the proxy Tier 4 NYC Tx, and 40% of landfill gas and
biomass generation. (Note: Due to uncertainty in eligibility for certain resources, the contribution of
bioenergy resources was discounted by 40%).
Zero-emission Generation by 2040: For the 2040 zero-emission generation target, generation from the
following sources can contribute: distributed solar, grid solar, onshore wind, offshore wind,
hydroelectricity, Legacy Canadian hydro imports, the proxy Tier 4 NYC Tx project, nuclear, and thermal
generators consuming biomass, landfill gas, or renewable natural gas.
Starting in 2040, New York cannot be an aggregate net importer from these adjacent power markets (PJM,
ISO-NE and Ontario).
Capacity Market: Capacity market prices were determined using a proprietary excel model that estimates
prices based on Summer 2020 ICAP demand curves and ICAP/UCAP translation factors. The 2020 demand
curves and translation factors were used throughout the study. Essentially, the UCAP requirements as a
percentage of peak are maintained throughout the study. Also, contribution to the peak for different resource
types was determined by a dynamic effective load carrying capacity (ELCC) calculation within the capacity
expansion model.
Distributed Solar Forecast: The distributed solar forecast meets the New York State goal of having 6,000
MW DC in 2025 and then increases 1.9% per year through 2040. The proportion of distributed solar in each
zone is based on the proportions of distributed solar in each zone from the 2019 Goldbook.8
New York Offshore Wind: The CLCPA’s goal is to achieve 9,000 MW of offshore wind by 2035. As a
proxy, it was assumed that 6,000 MW would be interconnected to Zone J and 3,000 MW interconnected to
Zone K.
8 NYSERDA Gold Book 2019 can be found at https://www.nyiso.com/documents/20142/2226333/2019-Gold-Book-Final-Public.pdf/ online.
App. E to Initial Report on Power Grid Study

E-19
Battery Energy Storage: Battery Storage followed the trends as published in the New York State Energy
Storage Roadmap9 and allowed dispatch model to economically build battery energy storage using three
duration options (two, four, and six hours). The overnight capital cost forecasts for each energy storage
duration type are summarized in the annexes.
PJM and ISO-NE Renewable Energy Targets: For neighboring regions (PJM and ISO-NE), the
renewable energy standards (RES) applied to the analysis were based on the announced initiatives as of
November 2019. The specific offshore wind targets and RES applied can be found in the annexes.
Firm Builds and Retirements: Short-term firm builds and retirements are sourced from EIA-860, 2019
NYISO Goldbook and S&P Global Market Intelligence. In addition, a list of recently procured renewables
were included in the analysis based on a NYSERDA program that secures Tier 1 renewable energy credits
(RECs).
NOx Peaker Rule: The study adopted the compliance plan for each gas turbine affected by New York
State’s NOx Peak rule, which requires all applicable simple cycle combustion turbines (SCCTs) to emit
less than 15% oxygen on a parts per million dry volume basis (ppmvd) by May 1, 2023. The limit is 25
ppmvd for gaseous fuels and 42 ppmvd for distillate oil or other liquid fuel by May 1, 2025.10 To avoid
generation deficiencies noted in the NYISO 2019 Comprehensive Reliability Plan (CRP) study, base
models for all three study years included a 420 MW non-renewable compensatory unit at Greenwood 138
KV substation. The unit was considered available for dispatch in its entire range in all analyses.
Nuclear: Nuclear generators have an 80-year lifespan except for Indian Point. It was announced that Indian
Point 2 would retire in April 2020 and Indian Point 3 would in April 2021. This assumption was adopted
from EPA’s Power Sector Modeling Platform v6.11
9Visit https://www.nyserda.ny.gov/All-Programs/Programs/Energy-Storage for NYSERDA Energy Storage Programs. 10 Adopted Subpart 227-3, Ozone Season Oxides of Nitrogen (NOx) Emission Limits for Simple Cycle and Regenerative
Combustion Turbines can be found at https://www.dec.ny.gov/regulations/116131.html online. 11 Documentation of EPA’s Power Sector Modeling Platform v6 Using the Integrated Planning Model can be found online
at https://www.epa.gov/sites/production/files/2019-03/documents/epa_platform_v6_november_2018_reference_case.pdf
App. E to Initial Report on Power Grid Study

E-20
3.2 Tools Utilized
AURORA by Energy Exemplar
AURORA is a mixed integer, chronological dispatch model of the electric sector, developed by Energy
Exemplar. It is used to simulate the hourly operations of U.S. electric power markets.
AURORA’s functionality includes Long-Term Capacity Expansion (LTCE) logic, which allows AURORA
to estimate the magnitude and timing of capacity resources needed to meet operational, reliability, and
regulatory retirements economically. The LTCE logic also analyzes the economic retirements of existing
capacity resources.
For the study, the project team utilized AURORA’s “Max Value” option which analyzes new build and
retirement decisions based on unit profitability. For example, for economically viable new capacity entry,
a developer would expect to recover all cost, including build costs and a normal rate of return. Aurora uses
net present value (NPV) related metrics to evaluate resources in a LTCE study. The NPV will be derived
from annual resource net revenue, or reported Value ($000):
Annual Value = Energy Revenue +Capacity Revenue – (Fixed Cost + VOM + Fuel Cost + Emission
Cost +Startup Cost)
Where, Capacity Revenue = Capacity Price x Capacity x Peak Credit (ELCC)
PowerGEM’s TARA
Siemens PTI used PowerGEM’s TARA version 1902_2 to conduct the thermal and voltage analysis for
pre-contingency, local, and design criteria contingency conditions, focusing on the impact in the study area.
TARA performs a single contingency (N-1) and multiple contingency (N-1-1) reliability analysis and
determines the limiting transmission elements considering preventive and corrective action dispatch. This
procedure results in the identification of critical facilities and provides an initial view on curtailment.
PROMOD IV and Database
Siemens PTI used Hitachi ABB PROMOD®IV version 11.2 to conduct the nodal production cost analysis
focusing on congestion and curtailment. The production cost model started with the Hitachi ABB
PROMOD®IV Nodal 2021 F19 Eastern Interconnection Powerbase model (Release Fall 2019) which
provides updates to the Simulation Ready Data NERC database release through March 2020.
PROMOD®IV (or “PROMOD” in this document) is an Hourly Monte Carlo tool that performs a security
constrained unit commitment and a security constrained economic dispatch (SCED) in a way that closely
aligns with how power systems are operated. It contains a detailed model of the network and produces a
App. E to Initial Report on Power Grid Study

E-21
secure dispatch considering all the monitored constraints (monitored elements/contingencies) provided for
the analysis. In the study, PROMOD monitored all elements 230 kV and above in New York Control Area
(NYCA), interfaces to neighboring systems, and transformation to lower voltages.
Power Analytics Software and Adjusted Production Costs Reporter
Siemens PTI used the Power Analytics Software (PAS) APC Reporter Tool Version 1.15.3.0 to report some
of the results from the nodal production cost analysis as well as calculate the Adjusted Production Costs
(APC).
App. E to Initial Report on Power Grid Study

E-22
Long-Term Capacity Expansion—Initial Scenario The objective of the long-term capacity expansion (LTCE) analysis is to determine the magnitude and
timing of needed resources and the type of resources that should be added to meet operational, reliability
and regulatory requirements economically. The LTCE also analyzes which power generators should be
economically retired based on market dynamics. This section summarizes the results of the LTCE analysis
and discusses the reasoning behind the zonal capacity buildout. The results described in this section are
results of the final LTCE, after considering the transmission upgrades and costs from section 6 of this report.
The Original LTCE that was used to determine the transmission upgrades is included in Annex A.
4.1 Long-Term Capacity Expansion—Initial Scenario
Capacity Expansion—70% Renewable Generation by 2030
At the beginning of the study in 2020, New York State features roughly 10.3 GW of steam units, 11.9 GW
of gas combined cycles, 6.1 GW of gas turbines, 5 GW of nuclear, 4.6 GW of in-state hydro, 1.4 GW of
pumped storage, 2.4 GW of wind, 500 MW of utility-scale solar, 40 MW of energy storage, and 2.2 GW
(2.8 GW DC) of behind-the-meter solar.
Through 2025, several notable events occur that change the capacity resource mix of the State:
• The Department of Environmental Conservation’s NOx Peaker Rule, Subpart 227-3, becomes enforced, which establishes more stringent thresholds for emissions of nitrogen oxides (NOx) for power plants. 1 GW of oil and gas fired turbines retire in accordance with their NOx compliance plan filing by 2025.
• Indian Point 2 and Indian Point 3 both retire, removing 2 GW of nuclear capacity from the market.
• New York State reaches its mandate of deploying 1,500 MW total energy storage in the system by 2025.
• A Tier 4 renewable transmission project that provides 1,250 MW of firm capacity and offers up to 10,000 GWh of dispatchable zero-emission energy directly into New York City (NYC Tx).
• New York State installs renewable capacity based from pre-2020 Clean Energy Standard procurements.
• New York State adds 1.8 GW of offshore wind capacity, including 130 MW from South Fork LIPA Contract, and 1,696 MW from Sunrise and Empire Wind NYSERDA contracts.
• New York State achieves its 6 GW (DC) goal of behind-the-meter solar installed.
By 2030, New York achieves its interim target of 70% renewable generation (70 x 30). New York State
achieves 70 x 30 with a total capacity supply of 6.2 GW of land-based wind, 6 GW of offshore wind, 3.8
GW of utility-scale solar, 4.7 GW of in-state hydro, 1.25 GW of Tier 4 NYC Tx, and 6.6 GW (DC) of
App. E to Initial Report on Power Grid Study

E-23
behind-the-meter solar. Additionally, the State meets its 2030 mandated 3 GW of energy storage in the
system.
With the addition of 14,000 MW of renewable capacity to New York State’s capacity supply from 2020
through 2030, renewable generation displaces marginal gas-fired generation and capacity prices decline
with the net increase in unforced capacity. The combination of these two factors results in the economic
retirement of gas-fired capacity. From 2020 to 2030, 5,200 MW of thermal capacity retires.
Capacity Expansion—Zero Emissions by 2040
As energy demand escalates at an average rate of 3.2% per year from 2030 to 2040, New York State needs
to continue to add renewable capacity to its supply mix to maintain its 70% renewable energy mandate.
From 2030 to 2035, roughly 6,700 MW of additional renewable capacity is added to the system (500 MW
of onshore wind, 3,000 MW of offshore wind, 2,600 solar, 533 MW of DG solar).
In addition to building renewable capacity to meet the State’s 70% annual renewable generation mandate,
starting in 2036, additional renewable capacity needs to be added to the market in the transition to 100%
zero-emission generation by 2040 (100 x 40). To simulate real-world development limitations and
construction timelines, the following annual renewable build limits were assumed in the LTCE modeling:
2,000 MW/yr onshore wind, 3,000 MW offshore wind, 2,500 MW grid solar (increasing incrementally to
3,000 MW in 2040), and 2,500 MW/yr energy storage.
To achieve a zero-emission power sector by 2040, a diverse mix of renewable capacity is added to the
power grid. From 2036 to 2040, 17,800 MW of renewable capacity is added: 6,000 MW of onshore wind,
800 MW of offshore wind, 10,300 MW of utility solar, and 580 MW (AC) of DG solar. To simulate real-
world development limitations and construction timelines, annual build limits for renewable technologies
were assumed in the LTCE modeling, which are summarized in the annexes. The resulting capacity supply
mix of the Initial Scenario is presented in Table 4-1.
App. E to Initial Report on Power Grid Study
E-24
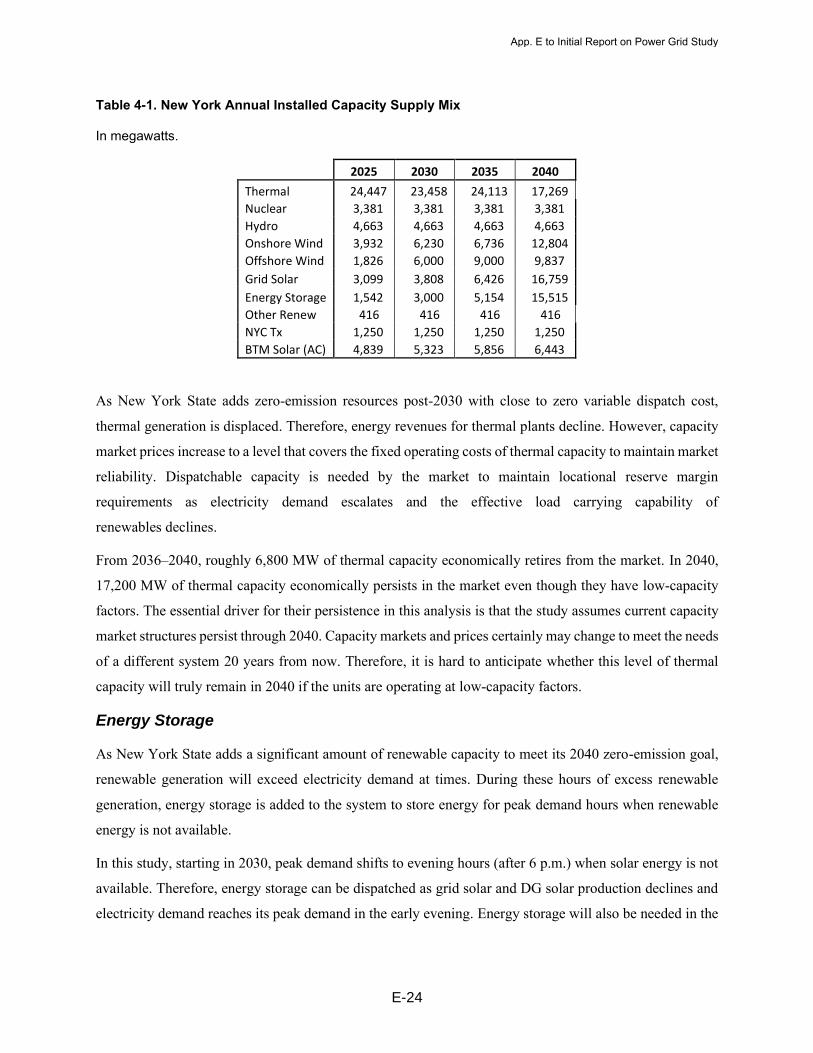
Table 4-1. New York Annual Installed Capacity Supply Mix
In megawatts.
2025 2030 2035 2040
Thermal 24,447 23,458 24,113 17,269
Nuclear 3,381 3,381 3,381 3,381
Hydro 4,663 4,663 4,663 4,663
Onshore Wind 3,932 6,230 6,736 12,804
Offshore Wind 1,826 6,000 9,000 9,837
Grid Solar 3,099 3,808 6,426 16,759
Energy Storage 1,542 3,000 5,154 15,515
Other Renew 416 416 416 416
NYC Tx 1,250 1,250 1,250 1,250
BTM Solar (AC) 4,839 5,323 5,856 6,443
As New York State adds zero-emission resources post-2030 with close to zero variable dispatch cost,
thermal generation is displaced. Therefore, energy revenues for thermal plants decline. However, capacity
market prices increase to a level that covers the fixed operating costs of thermal capacity to maintain market
reliability. Dispatchable capacity is needed by the market to maintain locational reserve margin
requirements as electricity demand escalates and the effective load carrying capability of
renewables declines.
From 2036–2040, roughly 6,800 MW of thermal capacity economically retires from the market. In 2040,
17,200 MW of thermal capacity economically persists in the market even though they have low-capacity
factors. The essential driver for their persistence in this analysis is that the study assumes current capacity
market structures persist through 2040. Capacity markets and prices certainly may change to meet the needs
of a different system 20 years from now. Therefore, it is hard to anticipate whether this level of thermal
capacity will truly remain in 2040 if the units are operating at low-capacity factors.
Energy Storage
As New York State adds a significant amount of renewable capacity to meet its 2040 zero-emission goal,
renewable generation will exceed electricity demand at times. During these hours of excess renewable
generation, energy storage is added to the system to store energy for peak demand hours when renewable
energy is not available.
In this study, starting in 2030, peak demand shifts to evening hours (after 6 p.m.) when solar energy is not
available. Therefore, energy storage can be dispatched as grid solar and DG solar production declines and
electricity demand reaches its peak demand in the early evening. Energy storage will also be needed in the
App. E to Initial Report on Power Grid Study
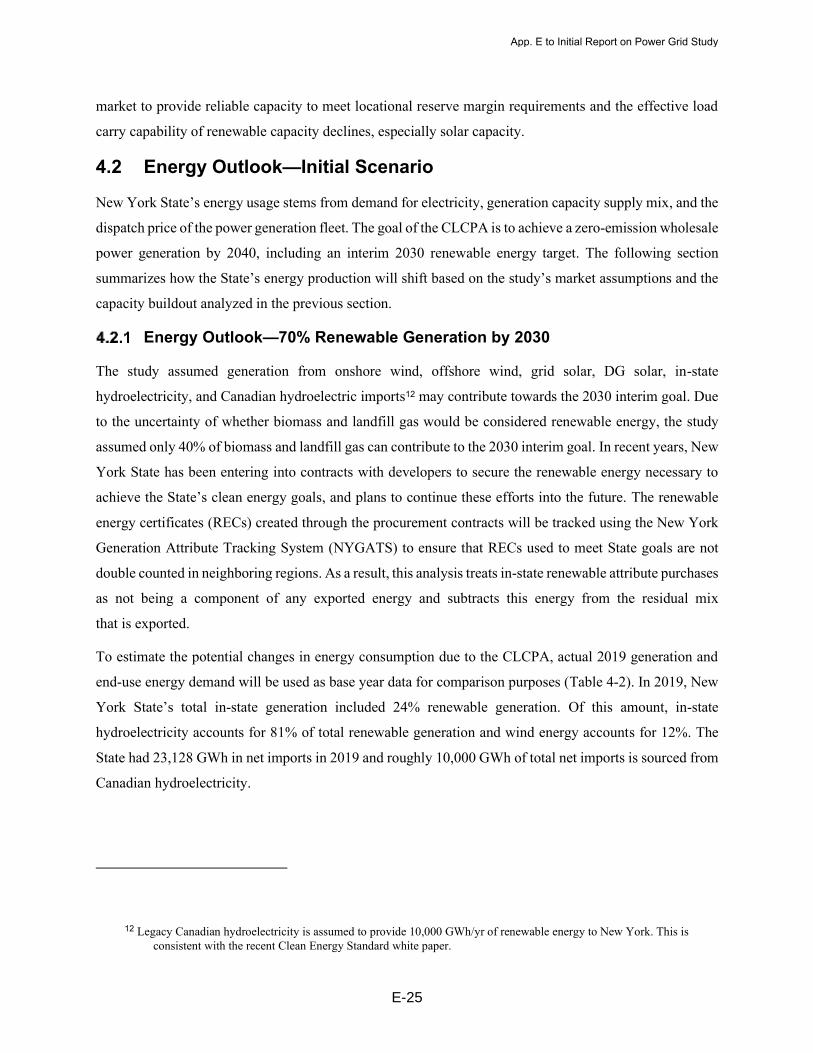
E-25
market to provide reliable capacity to meet locational reserve margin requirements and the effective load
carry capability of renewable capacity declines, especially solar capacity.
4.2 Energy Outlook—Initial Scenario
New York State’s energy usage stems from demand for electricity, generation capacity supply mix, and the
dispatch price of the power generation fleet. The goal of the CLCPA is to achieve a zero-emission wholesale
power generation by 2040, including an interim 2030 renewable energy target. The following section
summarizes how the State’s energy production will shift based on the study’s market assumptions and the
capacity buildout analyzed in the previous section.
Energy Outlook—70% Renewable Generation by 2030
The study assumed generation from onshore wind, offshore wind, grid solar, DG solar, in-state
hydroelectricity, and Canadian hydroelectric imports12 may contribute towards the 2030 interim goal. Due
to the uncertainty of whether biomass and landfill gas would be considered renewable energy, the study
assumed only 40% of biomass and landfill gas can contribute to the 2030 interim goal. In recent years, New
York State has been entering into contracts with developers to secure the renewable energy necessary to
achieve the State’s clean energy goals, and plans to continue these efforts into the future. The renewable
energy certificates (RECs) created through the procurement contracts will be tracked using the New York
Generation Attribute Tracking System (NYGATS) to ensure that RECs used to meet State goals are not
double counted in neighboring regions. As a result, this analysis treats in-state renewable attribute purchases
as not being a component of any exported energy and subtracts this energy from the residual mix
that is exported.
To estimate the potential changes in energy consumption due to the CLCPA, actual 2019 generation and
end-use energy demand will be used as base year data for comparison purposes (Table 4-2). In 2019, New
York State’s total in-state generation included 24% renewable generation. Of this amount, in-state
hydroelectricity accounts for 81% of total renewable generation and wind energy accounts for 12%. The
State had 23,128 GWh in net imports in 2019 and roughly 10,000 GWh of total net imports is sourced from
Canadian hydroelectricity.
12 Legacy Canadian hydroelectricity is assumed to provide 10,000 GWh/yr of renewable energy to New York. This is consistent with the recent Clean Energy Standard white paper.
App. E to Initial Report on Power Grid Study

E-26
Using CLCPA’s guidelines, in 2019 roughly 30% of end-use energy demand was supplied from renewable
resources, while thermal generation accounted for 33% of total net energy load.
Table 4-2. Actual 2019 New York ISO Generation by Technology and Energy Demand
% of End-Use Demand Technology Type
Generation (GWh)
End-Use Energy Demand13 157,664 EE Savings & BTM Gen14 (1,832) Baseline Energy Demand15 155,832 Thermal 51,871 32.9%
Grid Solar 52 0.0%
Onshore Wind 4,454 2.8%
Nuclear 44,788 28.4%
Hydro 30,141 19.1%
Pumped Storage 583 0.4%
Other Renewable 2,648 1.7%
Total NYCA Generation16 134,536 85.3%
Net Imports17 23,128 14.7%
Through 2030, several key factors are associated with New York State achieving 70%
renewable generation:
• Energy demand decreases on average 0.33% from 156.8 TWh to 151.7 TWh.
• Indian Point 2 and 3 nuclear generators retire in 2020 and 2021, respectively, reducing nuclear generation by about 9 TWh/yr.
• A Tier 4 proxy renewable transmission project (NYC Tx) provides 1,250 MW of firm capacity and offers up to 10,000 GWh/yr of dispatchable zero-emission energy directly into New York City. 100% of this energy is renewable and helps NY achieve its 2030 interim goal.
• New York installs renewable capacity from pre-2020 Clean Energy Standard procurements.
13 Estimated by summing NYCA net generation and net imports. 14 Estimated by subtracting End-Use Demand and Baseline Energy Demand. 15 2020 NYISO Goldbook Table I-1a. 16 2020 NYISO Goldbook Table III-3c. 17 2020 NYISO Goldbook Table III-3d.
App. E to Initial Report on Power Grid Study

E-27
• 1.8 GW of offshore wind goes online in 2025 and by 2030 NY achieves 6 GW of offshore wind capacity by 2030 on the way to achieving its 9 GW 2035 OSW mandate.
• New York State achieves its 6 GW (DC) mandate of behind-the-meter solar in 2025 and adds another 0.6 GW through 2030.
• New York State complies with its NOx Peaker Rule, which reduces thermal generation from units that have high NOX emission rates.
Based on 2030 net energy load assumptions, roughly 106 TWh of renewable generation is needed in 2030
to achieve the State’s interim target of 70% renewable generation. Based on the key market changes
described above and the additional renewable capacity added to the market as described in section 4, New
York achieves the 70% renewable generation goal. Table 4-3 summarizes annual generation from 2025 to
2040 in five-year increments, while Table 4-4 summarizes the breakdown of renewable generation
resources that make up the 2030 interim goal.
Table 4-3. 2025–2040 Annual Generation by Technology
In gigawatt hours.
2025 2030 2035 2040
Thermal 40,093 18,063 14,300 1,146
Nuclear 28,875 27,042 28,875 27,127
Hydro 28,570 28,039 28,621 28,684
Onshore Wind 10,462 18,888 20,918 43,950
Offshore Wind 5,863 24,062 38,794 45,478
Solar 4,098 5,571 11,051 31,902
Other Renew 2,744 2,716 2,632 2,538
NYC TX 10,000 9,930 9,853 9,340
Legacy Hydro Imports 10,008 10,009 10,012 10,069
DG Solar (AC) 7,266 7,994 8,795 9,697
Non-Hydro Net Imports (166) (280) 3,082 (359)
App. E to Initial Report on Power Grid Study

E-28
Table 4-4. 2030 Renewable Generation Breakdown by Technology/Source
In gigawatt hours.
Energy Demand 151,605 % of Net Energy
for Load
Total RE Generation 106,133
RE Gen % of Demand 70%
NYC Tx 9,930 7%
Legacy Can. Hydro 10,009 7%
DG Solar 7,994 5%
Grid Solar 5,571 4%
Onshore Wind 18,888 12%
Offshore Wind 24,062 16%
NY Hydro 28,039 18%
Other Renew18 1,640 1%
Energy Outlook—Zero-Emission Generation by 2040
From 2030 to 2040, net energy load increases on average 3.2% per year. To maintain the 70% renewable
generation mandate, renewable energy available to the market must grow at the same rate of total demand.
By 2040, the minimum amount of renewable energy needed in the market must be at least 145 TWh.
However, to achieve zero-emission generation by 2040, it is estimated that under this scenario renewable
generation will account for 87% of total energy demand. Table 4-5 summarizes the breakdown of renewable
generation estimated to meet 2040 demand.
Table 4-5. 2040 Renewable Generable Generation Breakdown
Energy Demand 207,477 % of Net Energy
for Load
Total RE Generation 180,653 RE Gen % of Demand 87.1%
NY Tx 9,340 5%
Legacy Can. Hydro 10,069 5%
DG Solar 9,697 5%
Grid Solar 31,902 15%
Onshore Wind 43,950 21%
Offshore Wind 45,478 22%
NY Hydro 28,684 14%
Other Renew 1,532 1%
18 Due to uncertainty in eligibility for certain resources, the contribution of ‘Other Renewables’ was discounted by 40%
App. E to Initial Report on Power Grid Study

E-29
4.3 Energy Prices
Average wholesale power prices in the study are determined on a zonal basis by calculating the dispatch
cost of the marginal generation resource used to serve electricity demand at any given hour. As such,
electricity demand and the factors that affect dispatch costs (e.g., fuel prices, emission prices, and variable
costs) will impact power prices over time.
Historically, New York State’s wholesale power prices settle at different levels in each zone. To illustrate
power price dynamics in the State, Table 4-6 summarizes actual 2019 day-ahead wholesale power prices
by zone.
Table 4-6. 2019 NYISO Around-the-Clock Day-Ahead Prices 19
Zone $/MWh
West–A 25.34
Genesee–B 20.57
Central–C 21.80
North–D 18.03
Mohawk Valley–E 21.82
Capital–F 27.95
Hudson Valley–G 26.87
Millwood–H 27.31
Dunwoodie–I 27.45
N.Y.C.–J 28.94
Long Island–K 32.89
Energy Prices—70% Renewable Generation by 2030
As New York State’s capacity supply mix transitions to meet the 70% renewable energy interim target by
2030, there are several market dynamics that apply upward and downward pressure on wholesale
energy prices.
Upward power price pressure is found in the following factors from 2020–2030:
• Henry Hub natural gas prices escalate from $2.32/MMBTU in 2020 to $3.15/MMBTU in 2030 (all values in $2018).
19 Source, Energy Market and Operational Data. Visit https://www.nyiso.com/energy-market-operational-data to access the data.
App. E to Initial Report on Power Grid Study

E-30
• Regional Greenhouse Gas Initiative (RGGI) Carbon Dioxide prices increase from $4.90/short ton in 2020 to $11.59/short ton in 2030. (All values in 2018 dollars.)
Downward power price pressure is found in the following factors from 2020–2030:
• Electricity demand declines at an average rate of 0.33%/yr. from 2020 to 2030.
• New York State builds utility-scale solar, land-based wind, offshore wind, and the NYC Tx project, all have a near zero dispatch cost.
On average, 2030 power prices remain flat compared to actual 2019 day-ahead power prices based on the
upward and downward power price factors. The increased fuel and emission prices of marginal gas-fired
energy is offset by the reduction in demand and addition of zero-dispatch-cost renewable resources. Figure
4-1 summarizes the average day-ahead energy prices for Zone A and Zone J from 2025 to 2040.
Energy Prices—Zero-Emission Generation by 2040
As the State transitions to zero-emission generation from 2030 to 2040, the study’s market dynamics shift
through 2040 resulting in an increase in power prices. The upward and downward power price factors are
as follows:
Upward power price pressure is found in the following factors from 2020–2040:
• Electricity demand increases at an average rate of 3.2%/yr from 2030 to 2040 and peak demand increases on average 2.1%/yr from 2030 to 2040.
• Henry Hub natural gas prices increase to $4/MMBtu in 2039 (all values in $2018).
• RGGI carbon prices reach $21.50/CO2 ton (all values in $2018).
• In 2040, all gas generators can only consume renewable natural gas that was modeled with a fuel price of $23/MMBtu; the dispatch cost of a gas turbine is estimated to be $220/MWh in 2040 (assuming 9,000 btu/kWh heat rate). (All values in 2018 dollars.)
Downward power price pressure is found in the following factors from 2020–2040:
• New York State supply mix is heavily weighted with renewable capacity and by 2040 renewable generation accounts for at least 80% of total net energy load.
Even though more than 80% of the State’s net energy to meet demand is sourced from zero dispatch cost
renewable resources in 2040, on average power prices increase roughly $15/MWh from 2030. This increase
in power prices occurs because the cost of thermal generation using renewable natural gas (RNG) was
modeled to be roughly $220/MWh and thermal generation is setting power prices during peak demand
hours, when there are reductions in renewable energy availability. However, it is important to note that
there are significant uncertainties on what the price of renewable natural gas will be in the long term (2040)
and the cost of other competing technologies to provide dispatchable generation with zero emissions.
App. E to Initial Report on Power Grid Study

E-31
On a monthly basis, prices are relatively low in the winter and shoulder months when energy demand is
relatively low and wind generation is relatively high, but the use of expensive fuel in the summer months
to help meet peak summer demand lifts prices. Figure 4-1 summarizes the average day-ahead energy prices
for Zone A and Zone J from 2025 to 2040.
Figure 4-1. Zone A and Zone J Average Wholesale Energy Price Forecast
$2018/MWh
4.4 Emissions
The CLCPA’s overall goal is to achieve a zero-emissions electric sector by 2040. Roughly a third of New
York State’s current generation mix is sourced from gas-fired resources and New York emitted 24.9 million
tons of CO220 in 2019 from the power sector. To achieve this goal, the State will need to incrementally
reduce its emissions over the next 20 years.
By 2030, when New York State meets its 70% renewable energy goal, the state has enough renewable
resources (solar, wind, offshore wind, NYC Transmission), that carbon emissions fall 70% compared to
actual 2019 levels. By 2030, the State still relies on gas-fired generation to help meet peak demand, but the
20 Visit https://ampd.epa.gov/ampd/ for EPA Continuous Emission Monitoring Systems.
$23$25
$27
$40
$25
$29 $29
$46
$0
$5
$10
$15
$20
$25
$30
$35
$40
$45
$50
2025 2030 2035 2040
Zone A Zone J$/MWh
App. E to Initial Report on Power Grid Study

E-32
significantly reduced gas-fired generation levels lead to lower emission levels. Additionally, by 2030 some
of the less-efficient thermal generators have exited the market.
By 2040, the State achieves a net zero electricity system with zero internal carbon emissions. New York
still operates thermal capacity to meet electricity demand, but it is using renewable natural gas. The State
imports power from its neighbors to help meet peak demand in the summer. Although power is imported
during certain hours, net-imports excluding Canadian hydro resources in 2040 are effectively zero. Figure
7-1 displays annual New York State emissions in short tons from 2025 to 2040
Figure 4-2. Annual NYISO Carbon Emissions (Million Short Tons) Forecast
4.5 System Reliability
The study included two separate analyses to ensure the resulting capacity expansion plan through 2040 was
operationally reliable enough to meet demand in case of sudden losses of renewable production, sudden
increases in demand, or major unplanned power generator outages. The two reliability analyses
performed were the following:
• Loss of Load Expectation (LOLE), which measures the security of capacity supply. The study applied New York State’s requirement of having no more than 1-day of loss of load events in a 10-year period.
• Flexible Resource Adequacy, which estimates the amount of fast ramping capacity needed by the market to cover variability in load and renewable generation in the 1 to 10-minute horizon.
LOLE Analysis
A resource adequacy analysis using AURORA evaluated if there was sufficient capacity in the PowerGEM
State’s wholesale power market to meet electricity demand in the event of numerous, unforced generator
outages and unexpected increases to the base energy demand forecast.
19.8
7.4
5.6
0
5
10
15
20
25
2025 2030 2035 2040
MTons
App. E to Initial Report on Power Grid Study

E-33
The goal of the resource adequacy plan is to ensure that Loss of Load Expectations (LOLE) occur less often
than 0.1 days/year.
To perform the analysis, the Equivalent Forced Outage Rate demand (EFORd) and Mean Time to Repair
(MTTR) was estimated for each generating technology. EFORd is the probability a power unit will not be
available due to an unforced outage when there is a demand for the unit to generate. MTTR is the average
amount of time a generator will not be available during a forced outage event. Additionally, unexpected
variations in energy demand were simulated by applying zonal monthly standard deviations and monthly
correlations to the demand forecast based off 8-years of New York State historical data. Table 4-7
summarizes the EFORd and MTTR assumptions used for the resource adequacy analysis.
Table 4-7. Equivalent Forced Outage Rate Demand (EFORD) and Mean Time to Repair (MTTR)
Technology EFORd (%) MTTR (hrs.)
Internal Combustion 21% 227
Steam-Oil 10% 534
Steam-Gas 9% 505
Gas Turbine 9% 92
Gas CC 4% 60
Nuclear 3% 149
Hydro 9% 48
Pump Storage 3% 29
Wind 10% 96
Offshore Wind 3% 499
Solar 1% 1560
Energy Storage 3% 15
One hundred randomized modeling iterations were performed to simulate hourly market operations in 2035
and 2040. Each iteration applies random forced outage events and durations to generators based on their
EFORd and MTTR, as well as unexpected changes to energy demand based off the probabilities of zonal
demand standard deviations. A LOLE event is identified when there is a one-hour period where there is no
available capacity to meet electricity demand.
The analysis did not observe any loss of load events in the iterations examined. Therefore, it was determined
that New York State met the 0.1 days/year LOLE requirement.
To benchmark the results in AURORA, GE MARS was also used to perform a resource adequacy analysis.
The resource adequacy (RA) analysis methodology between AURORA and GE MARS is comparable. Both
models sensitize fluctuations in electricity demand and the unforced outages of generation resources.
However, the energy demand and resource outages in surrounding regions (PJM, ISONE, Canada) were
App. E to Initial Report on Power Grid Study

E-34
not sensitized in the AURORA analysis but were varied in the GE MARS analysis. The GE MARS model
resulted in a similar result as AURORA, reflecting that the 1-in-10 LOLE requirement was met.
Flexible Resource Adequacy
The study forecasted the Long-Term Capacity Expansion by simulating power market operations on an
hourly basis. However, with a high-renewable capacity supply, there should be sufficient fast ramping
capacity to cycle up/down within the 1- to 10-minute horizon to offset sudden losses or production of
renewable generation.
The flexible resource adequacy analysis estimates how much capacity is needed to offset any sudden
increases/decreases in renewable availability and electricity demand. This flexible service can be provided
by energy storage or controllable generation such as gas turbines, which could participate in the fast (10
minute) non-spin and spin reserve market.
The flex capacity analysis includes the following steps:
• Analyze historical sub-hourly land-based-wind generation, offshore wind generation, solar generation, and electricity demand to estimate historical capacity factor volatility.
• Estimate with 99% confidence, what the historical 10-minute capacity factor volatility is of each variable generation resource and electricity demand.
• Using the hourly average renewable generation and load forecast and the volatility with 99% confidence, find the amount of flexible capacity required in each year and zone to maintain dispatch reliability.
The Figure 4-3 illustrates a potential solar production scenario with flex capacity utilization. In the graph,
the red represents sub-hourly intervals when a typical solar generator may not produce as much as expected
on average at an hourly basis. When those events occurred, fast ramping resources were needed to meet
energy demand.
App. E to Initial Report on Power Grid Study

E-35
Figure 4-3. Five-Minute Solar Production and Flex Capacity Utilization
As New York State relies more on intermittent capacity toward 2040, more reliable capacity is required to
support quick shifts in solar and wind availability.
Applying the zonal groups that the State uses for operating reserve requirements, New York has sufficient
flexible capacity to offset sudden changes in renewable generation and electricity demand based on a 99.9%
confidence interval.
Table 4-8. Estimated Sub-hourly Flexible Reserves—Required versus Available
In megawatts.
NYCA (Zone A-K)
East (Zone F-K)
SENY (Zone G-K)
NYC (Zone J)
Long Island
(Zone K)
2030 Flex Cap. Required 2,981 1,947 1,647 901 557
Flex Cap. Available 7,372 6,486 6,342 2,775 3,122
2040 Flex Cap. Required 5,877 3,557 2,596 1,268 964
Flex Cap. Available 19,595 16,038 13,394 6,063 4,461
In 2040, 17.2 GW of thermal capacity economically persists in the market even though thermal generators
have low-capacity factors. The essential driver for their persistence is that the study assumes current
capacity market structures remain in place through 2040. Capacity market guidelines and rules may change
to meet the needs of a different system 20 years from now, so it is hard to anticipate whether this level of
thermal capacity will remain to meet resource management targets in 2040.
0
200
400
600
800
1,000
1,200
1,400
1,600
1,800
8:00
8:15
8:30
8:45
9:00
9:15
9:30
9:55
10:1
0
10:2
5
10:4
0
10:5
5
11:1
0
11:2
5
11:4
0
11:5
5
12:1
0
12:2
5
12:4
0
12:5
5
13:1
0
13:2
5
13:4
0
13:5
5
14:1
0
14:2
5
14:4
0
14:5
5
15:1
0
15:2
5
15:4
0
15:5
5
Flex Capacity Dispatch Solar Generation(MW)
(Hour of Day)
App. E to Initial Report on Power Grid Study

E-36
Transmission Load-Flow Contingency Analysis— Initial Scenario The transmission load-flow analysis aims to evaluate potential transmission needs for meeting New York
State’s zero-emission goal by 2040. Contingency steady-state analyses (single and multiple) were
completed with the overarching objectives to (a) identify possible transmission system upgrades needed to
support the load growth and the renewable generation additions and (b) identify critical contingencies to
confirm their inclusion in congestion analysis. The latter piece of information provides PROMOD (the
congestion analysis tool) with the constraints (contingencies and monitored elements) to use during the
formulation of the security-constrained economic dispatch.
5.1 Case Selection
The study assessed load and generation conditions that exert the most stress on the entire State
bulk transmission system. The 2040 year was selected for study as it is expected to represent the most
stressful condition on the Bulk Power System (BPS) transmission.
The modeled generation was dispatched to represent points of high stress to the transmission system. Each
dispatch scenario contains high transfers across the BPS with high-renewable dispatches of either solar or
wind. These dispatches should reflect the needs of the system appropriately.
The selected dispatches consist of a summer peak case and a low-load case. The summer peak case
represents high usage of solar photovoltaic (PV) generation as this generation type is dispatched at high
levels during summer conditions. The low-load case represents high usage of wind generation when this
generation type is dispatched at higher levels during times when the sun sets earlier, and load is lower. The
actual date and hour load conditions to be modeled were selected considering the hourly transfers between
NYISO zones from the AURORA zonal LTCE results. The Table 5-1 provides the date, hour, and load
conditions for both dispatches. The summer peak condition represents 93% of the actual 2040 system peak
and the low-load dispatch is 57% of the peak.
App. E to Initial Report on Power Grid Study

E-37
Table 5-1. 2040 Load for Two Dispatches Assessed for Initial Scenario
Zone
Dispatch High Wind Low Load
Dispatch High Solar Summer Peak
(April 20 hour 15) (July 16 hour 19)
A 2,352 3,535
B 1,583 2,378
C 2,476 3,720
D 740 1,112
E 1,205 1,811
F 1,955 2,938
G 1,266 2,436
H 367 706
I 714 1,374
J 6,549 12,607
K 2,866 5,516
NYISO load 22,073 38,133
5.2 Case Development
2040 Long-Term Capacity Expansion Model and Dispatches
The transmission load-flow cases were developed starting from the NYISO FERC 715 2018 Series
ERAG/MMWG package as provided by New York State. This case was modified to reflect the 2040
AURORA Long-Term Capacity Expansion (LTCE) plan. This plan is based on zonal information and it
does not include a network bus allocation for the generation resources added. To address this,
interconnection points were derived, considering the project information in the NYISO queue first. For
those resources with no queue, the new generation on the LTCE was mapped to substations as follows:
• Land-based wind (LBW) and PV. These were assigned to substations near the identified latitude and longitudinal locations of the renewable generation.
• Battery Energy Storage (BES) was modeled at substations that contain similarly sized PV/LBW resources. Battery Energy Storage (BES) was modeled at substations that contain similarly sized PV/LBW resources. Storage is dispatched by the optimization process (AURORA and PROMOD) based off the net load curve (i.e. gross energy demand minus renewable generation), resulting in energy storage charging when net load is the lowest (when renewable generation is high) and discharges when net load is high (when renewable generation is low). The net load curve also provides a good representation for when energy prices are at a daily high for storage discharge and for when energy
App. E to Initial Report on Power Grid Study

E-38
prices are daily low for charging. This dispatch strategy was taken into consideration in the creation of the snapshots for load flow assessment.
• Additional thermal generation was modeled as a potential repowering at sites of retired conventional units. For example, Brownfield sites are likely to have the pipelines, etc. already in place and could be good sites for the RNG resources.
• Behind the meter rooftop solar (DG Solar) was placed at load buses of similar size.
To stress the transmission network, the generation was dispatched as shown in the table below, instead of
using the reduced dispatch from the AURORA simulations. The generator models for the resources were
assumed to have a 0.95 power factor and a scheduled voltage of 1.03 at major buses.
Table 5-2. Load-Flow Assessment
Summer Peak Light Load Fuel Type Under Study Dispatched as % of Dispatched as % of
Hydro 100% 100% Nuclear 100% 100% Waste Heat 100% 100% Wind 15.6% 85% Offshore Wind 15.6% 90% Solar 90% 10% Battery 0% 0%
Base Case Transmission Modeled
The base cases were modeled with all New York Public Policy transmission projects in place. This includes
the Western NY Empire State line 345 kV project in Zone A, AC Transmission Segment A & Segment B
345 kV projects in Zone E and F as well as the Northern New York 345 kV projects in Zone D and E that
were expanded to include the expected upgrades reinforcing the connection between Porter to Edic
substations at 345 kV. Additionally, as a Tier 4 proxy project, a new 1,250 MW HVDC transmission line
into New York City was modeled (the NYC Tx Project). This line allows for the delivery of dispatchable
renewable generation directly into NYC.
Contingency and Monitoring Elements
In assessing the impact of the LTCE within the study area under normal N-0, N-1, and N-1-1 contingency
conditions, the study monitored for possible thermal (branch overloads) or voltage violations on the bulk
power system, as well as the local 115 kV networks. The tested contingencies included outages of single
lines and transformers, generator outages, tower contingencies and stuck breaker contingencies from the
New York State study cases and modified as necessary to reflect the generation added to the system.
App. E to Initial Report on Power Grid Study

E-39
Transmission Security Auxiliary files associated with the NYISO FERC 715 2018 Series ERAG/MMWG
package were used throughout the load-flow analysis. This includes the Monitored Element file (TS2019-
Monitored_Elements_Yr2029_v1), the subsystem file (TS2019-SCD-2029_v1), the Exclude file (TS2019-
Exclude-Sum_rev1, TS2019-Exclude-Win_rev1 and the Contingency package (TS2019_Yr_2029S) that
includes the singles and multiples as studied by New York State. The input files were updated to include
100 kV and above branches as needed.
5.3 Planning Criteria
Thermal limits were assessed using normal ratings for pre-contingency conditions and Long-Term
Emergency (LTE) ratings for post-contingency conditions except for some 138kV lines in Zones J and K
which were compared on their Short-Term Emergency (STE) ratings. A thermal impact was considered
potentially significant if the pre-contingency or post-contingency loading of a branch increased by more
than 1% of the facility’s Normal or LTE rating, respectively.
Voltage limits were assessed, pre- and post-contingency, per the criteria reflected in the Table 5-3. Voltage
impact was considered potentially significant if the pre-contingency or post-contingency voltage changes
by more than 0.5% of the nominal voltage.
Table 5-3. Voltage Limits Pre- and Post- Contingency
TO Pre-Contingency (N-0) Post-Contingency (N-1) & Extreme
Low High Low High
CH 0.95 1.05 0.9 1.05
Con Edison 0.95 1.05 0.95 1.05
LIPA 0.95 1.05 0.901/0.952 1.052/1.11
NG 0.953/0.984 1.05 0.903/0.954 1.05
NYSEG/RG&E 0.905/0.956 1.05 0.905/0.956 1.05
O&R 0.95 1.05 1.05
NYPA * * * *
* according to OP1 limit 1–applicable below 69 kV 2–applicable to 69 kV and above 3–applicable to 115 kV and below 4–applicable to 230 kV and above 5–applicable to regulated (TO control) buses 6–applicable to non-regulated buses (distribution)
App. E to Initial Report on Power Grid Study

E-40
5.4 Initial Scenario Load-Flow Analysis Results
System Intact and Voltage Violations Observed
Base case reinforcements (upgrades) were required throughout New York State’s bulk power system to
address reliability violations with the Initial Scenario 2040 capacity expansion plan, before any
contingency. The upgrades created a secure case by addressing overloads resulting from the significant
change made from the original base case and prepare it for the Single and Multiple contingency analysis.
Most of the violations identified were located at the 115 kV and 138 kV transmission network. There were
no voltage violations on the system. After the cases were secured, the steady-state analysis was run to
determine if there were any N-0, N-1, and N-1-1 violations.
Single-Contingency Analysis
The single-contingency analysis found criteria violations on the BPS and 115 kV and 138 kV network, with
most of the violations on the local 115 kV and 138 kV network. As the congestion analysis is focused on
the BPS (230 kV and above), local violations, while noted, did not result in any contingencies to be
considered in the PROMOD analysis as events files
The overloads identified on the BPS were in the NYSEG Area 3, NG Area 4 and 5, NYC Area 10. The BPS
overloads in Western New York were along the Clay 345 kV and the Meyer 230 kV paths that allow power
to flow from West to East within the State. The constraints near the center of the State resulted from high
power flows North to South. The constraints noted in the NYC area are due to the large amount of flow
coming into the City from the balance of state (BOS) to feed the load.
As before, most of the violations identified by the study were located on the 115kv and 138kV network.
The overloads were largely in NYSEG Area 1 and Area 3, NG Area 4, NYC Area 10, and Long Island Area
11. The annexes provide a complete list of results.
Multiple Contingency Analysis
Similar to the single (N-1) contingency analysis, the multiple contingency analysis (N-1-1) identified
overload on both the existing New York BPS and local 115 and 138 kV system.
Like the N-1 analysis, the overloads identified on the BPS were located in the NYSEG Area 3, NG Area 4
and 5, NYC Area 10. The BPS overloads in Western New York were along the Clay 345kV and the Meyer
230 kV paths that allow power to flow from west to east within the State. The constraints near the center of
the State resulted from high-power flows north to south. The constraints noted in the NYC area are due to
the large amount of flow coming into the city from the balance of state (BOS) to feed the load. Again, most
App. E to Initial Report on Power Grid Study

E-41
of the violations identified by the study were located on the 115 kV and 138 kV network and the overloads
were largely located in NYSEG Area 1 and Area 3, NG Area 4, NYC Area 10, and Long Island Area 11.
5.5 Load-Flow Analysis Findings
The transmission analysis identified that most of the reliability violations are located at the local 115 kV
and 138 kV networks, confirming the important beneficial impact of the New York Public Policy
transmission projects listed above for the bulk system.
Additional important contingency overloads were identified in the following areas:
• Downstream of Coopers Corner into Zone GHI
• Dunwoodie-Shore Rd cable
• NYC and West Long Island area
Also, the analysis identified overloads in the system connecting Edic to Porter, but these are expected to be
addressed under the North New York project.
Information on the identified constraints including the contingencies/monitored elements and candidate
reinforcements were provided to and considered in the production costing (PROMOD) analysis. The
annexes contain the list of contingencies and monitored elements provided to PROMOD for congestion
analysis as well as the information on facilities to be reinforced. PROMOD analysis confirmed that these
contingent elements did appear as binding constraints driving congestion and renewable curtailment,
particularly in 2040, as presented in the next section.
App. E to Initial Report on Power Grid Study

E-42
Congestion Analysis—Initial Scenario 6.1 Study Overview and Objectives
The objective of the Transmission Congestion and Curtailment Analysis is to assess the performance of the
generation mix selected by the AURORA’s LTCE process to achieve New York State’s zero-emission goal
by 2040 as well as the interim 70% renewable generation goal by 2030, under security-constrained unit
commitment and economic dispatch (SCUC/SCED).
This analysis was carried out with PROMOD®IV on nodal SCUD/SCED mode which reflects transmission
congestion issues, renewable generation curtailment, system production cost, and identifies indicative
transmission reinforcement to support the achievement of the 100 x 40 goal in a least costly manner.
AURORA’s LTCE analysis (generation retirements and additions of both thermal and renewable resources
along with energy storage) was carried out on a zonal basis; thus, it has a limited view on transmission
impacts. The analysis presented in this section complements the LTCE analysis by examining two critical
years: 2030 with the 70% renewable goal and 2040 with the zero-emission goal.
The transmission congestion and curtailment analysis uses the results of the load-flow analysis presented
in section 5 that provided an initial view on the transmission issues and the critical constraints
(contingencies/monitored elements) to be included in this part of the study.
6.2 Initial Scenario Case Development
The Initial Scenario analysis was carried out by developing and evaluating the cases below for 2030
and 2040:
• Initial buildout with no transmission upgrades (base case), this is the initial AURORA LTCE result without any new transmission in the system, beyond that in the NY Transmission Public Policy
• Initial buildout with transmission upgrades, (upgrade case), same case as above but now with indicative new transmission projects in place.
• Iteration buildout with no transmission upgrades (iteration base case), this is the LTCE resulting from the iteration LCTE run where AURORA considered the estimated cost of transmission upgrades and the increased transfer limits, but without the new indicative transmission in place.
• Iteration buildout with transmission upgrades, (iteration upgrade case), same case as above but with the new transmission upgrades in place.
App. E to Initial Report on Power Grid Study

E-43
6.3 Initial Scenario Results Summary
To facilitate the review of the congestion analysis results, key findings of the Initial Scenario for all cases analyzed are summarized below. The comparison focuses on year 2040 because there was low congestion and curtailment in 2030.
The table shows for each case whether it used the Original LTCE or the Iteration LTCE (produced after transmission cost and increased transfer limits were factored in) and whether transmission upgrades were considered or not.
Based on the results found:
• Congestion and curtailment are both reduced from the Original to the Iteration LTCE and include the effects of new transmission (upgrade), indicating the effectiveness of the study process.
• The New York State system is found to be an exporter in all cases but the amount of energy exported reduces as the LTCE improves and new transmission is added (upgrade).
• RNG consumption also reduces as less congestion exists in the system.
• The overall Adjusted Production Costs (APC) is trending down with sizable APC savings between the Transmission Original and upgrade cases, showing the impact of transmission in addressing congestion.
Table 6-1. Initial Scenario—Results Summary
2040 PROMOD
Case Generation
Buildout Transmission
Buildout
Zonal Congestion
Cost $B
Statewide RE Curtail
%
RNG Generation
(GWh) APC ($M)
Base Case Original
LTCE Original 4.3 1.5 4,617 1,507
Upgrade Case
Original LTCE
Upgrade 2.4 0.1 2,668 878
Iteration Base Case
Iteration LTCE
Original 2.9 1.3 4,242 1,156
Iteration Upgrade
Case
Iteration LTCE
Upgrade 1.9 0.4 2,977 862
More detailed results will be discussed in the following sections for each of the individual cases analyzed.
Model Overview and Forecast Overview 2030 and 2040
The production cost model started with the Hitachi ABB PROMOD®IV Nodal 2021 Eastern
Interconnection F19 Powerbase model (Release Fall 2019) which provides updates to the Simulation Ready
Data NERC database release through March 2020. The database was updated according to the assumptions
App. E to Initial Report on Power Grid Study

E-44
and results from the LTCE for 2030 and 2040. This includes various updates of the demand forecast, fuel
forecasts, applicable cost of carbon, transmission topology, generation retirements, and new generation.
Demand Forecast, Fuel Forecast, and Emission Costs
The PROMOD demand forecast was modeled using the forecast from the AURORA LTCE model,
reflecting the same 8,760-hour hourly demand profile for 2030 or 2040.
The fuel forecast was also updated to reflect the same forecast from the LTCE model for natural gas in the
region. Coal prices and oil prices were not modified since there is no coal generation in New York State
and oil is not used for any significant levels of generation in the State, so it was left as in the original
database. Nuclear fuel prices were also maintained as in the base database. A new natural gas fuel ID was
created to represent RNG that will be burned at thermal generation (non-nuclear) in 2040 as part of the goal
of zero-emission production.
The costs for carbon allowances/emissions were set according to NYISO CARIS pricing and matching the
pricing modeled in the LTCE. The cost of other emissions was left as in the base database.
Regional Interconnection Models
The interconnections from New York State to other regions were modeled accounting for a “hurdle rate”
or transmission tariffs as specified by the PROMOD model and adjusted as necessary to match those in the
LTCE model. In general, these tariffs reflect the cost of transmission delivery services and do not add any
additional hurdle to the interchanges.
Generation Modeling
The detailed resource retirements and additions as provided by the AURORA LTCE runs were incorporated
into the PROMOD model. The resources remain unchanged within the simulation yea (i.e., all additions
are modeled as available by January 1 of the year). Renewable resources were all modeled with nominal
curtailment bid pricing ($ 0.1/MWh), so that all the units are bidding into the market model on the same
conditions. The only exception is the NYC Tx project that is considered dispatchable and bids at a slightly
higher price than $0.1/MWh.
Hydroelectric resources were modeled in PROMOD®IV to match the AURORA model as closely as
possible. Standard hydro modeling in PROMOD®IV does not allow the ability to represent curtailment on
those units. Thus, key hydro facilities were modeled as transactions to allow for the reporting of potential
curtailment. The hydro facilities at Niagara and St. Lawrence along with the Legacy HQ hydroelectric
generation were modeled as transactions. In addition, the new generation to be delivered by the NYC Tx
project was modeled as a transaction to reflect the dispatchability of this last resource.
App. E to Initial Report on Power Grid Study

E-45
Battery storage is modeled in PROMOD®IV with charging and discharging to minimize the potential
curtailment of renewable facilities. As such, the program logic matches the charging/discharging to the net
load, which is the difference between the actual load and renewable resources. Battery storage was modeled
with 87% efficiency in 2-hour, 4-hour, and 6-hour capacity as provided in the LTCE.
Solar behind-the-meter demand generation (BTM DG) was modeled explicitly as a resource as opposed to
modeling the DG with the demand.
Transmission Nodal Modeling
The AURORA LTCE plan is zonal and does not have a network bus allocation. The nodal transmission
model in the production cost model was updated considering the resource bus allocation on the load-flow
model (see section 5.2.1). The load-flow model also provides identified candidate upgrades.
The transmission model also included New York Public Policy projects including the Western NY Empire
State 345 kV project in Zone A; AC Transmission Segment A & Segment B 345 kV projects in Zone E and
F; as well as the Northern New York 345 kV projects in Zone D and E (including upgrades on Porter to
Edic). Additionally, the new 1,250 MW HVDC Tier 4 proxy transmission line to New York City was
modeled. All the analyses include critical contingencies determined by the transmission power flow
analysis and contingencies from the NYISO Summer 2019 Operating Study, which are in the form of event
files used by PROMOD®IV.
Monitoring Elements, Interfaces, Flowgates
This analysis mainly focuses on the BPS interzonal interfaces/flowgates and the BPS transmission (230 kV
and above). Facilities rated 138 kV and below were not monitored as it is assumed that any 138 kV and
lower voltage facility violations resulting from the addition of new resources would be addressed by the
local transmission owners, New York State planning process, and the generation interconnection processes.
6.4 2030 Base Case Results—Initial Scenario
The Initial Scenario—2030 Base Case results show some congestion, albeit low compared to the 2040
cases. The binding constraints in the analysis have a corresponding congestion cost (shadow price21 times
flow) that indicates the severity of the constraint. The existence of congestion costs increases energy costs
21 A shadow price is equal to the value the optimization objective would change by relieving the constraint by one unit. In our case it is the change in production cost resulting from the increase of the capacity of the limiting constraint (transmission facility) by one unit. As this results in a reduction of the operating cost the shadow prices and the associated congestion cost are negative and the more negative the greater the impact.
App. E to Initial Report on Power Grid Study

E-46
and the resulting overall system production cost. The presence of congestion signals the opportunity to
relieve transmission bottlenecks to move power from zones with cheaper energy to zones with higher prices.
New York State is found to be a net exporter of energy for the 2030 Base. The purchases/sales are driven
by the economics of the production cost model where the State’s system is allowed to purchase from or sell
energy to neighboring systems based on economics.
The curtailment observed was low at 0.1%. Land-based wind experienced the most curtailment at 0.3%
among all curtailable resources. Whenever “curtailment” is referred to in this analysis, it reflects the results
of the planning model used (PROMOD). Actual curtailment in day-ahead and real-time operations can
fluctuate higher due to factors such as maintenance activities or forced outages, which are not captured in
the long-term planning production cost models.
One key focus in the production cost analysis is the binding constraints congestion in the production costs
analysis because it impacts overall system costs. For the 2030 Base, the following top congested elements
were observed.
Table 6-2. Initial Scenario—2030 Base Constraints
Constraints Congestion Cost (k$)
Congested Hours
DUNWOODIE to SHORE RD FLO BASE CASE (22,491) 1,889
I:NY_NYC-LI FLO BASE CASE (17,951) 904
FRASR345 to FRASR115 FLO BASE CASE (16,561) 1,273
I:NY INTERFACE NY-ON FLO BASE CASE (8,578) 1,581
I:NERC7002 WEST CENTR FLO BASE CASE (8,388) 385
NORTH WAV115 to EAST SAYRE FLO BASE CASE (7,564) 1,881
LADENTOWN to RAMAPO FLO BASE CASE (7,339) 133
I:NERC7005 TOTAL EAST FLO BASE CASE (6,883) 140
RAMAPO to HOPATCONG FLO BASE CASE (6,332) 3,162
E13ST to FARRAGUT WES FLO BASE CASE (5,028) 712
COOPERS CORNERS to MDTN TAP FLO ROCK TAV to DOLSON AVE (3,947) 213
The total observed zonal congestion costs for New York State were $159 million in 2030. The level of
congestion does not warrant upgrades in light of the cost of those upgrades.
By 2030, there are New York Public Policy transmission upgrades that support the 70% renewable goal
with low levels of renewable curtailment (0.1%) and congestion.
Local transmission upgrades (138 kV and below) will likely be associated with the addition of new
resources and the need to move energy from those resources to the rest of the grid. The addition of 6 GW
App. E to Initial Report on Power Grid Study

E-47
of offshore wind in downstate New York is being analyzed on a separate study to make sure those facilities
do not adversely impact the lower voltage grid and are able to utilize the higher voltage effectively.
The integration of storage is becoming more important to reduce the amount of curtailment associated with
renewable resources. Storage may also become important in working toward the zero-emission goal to not
only enable lower curtailment levels but also to provide energy during peaks normally supplied by
conventional thermal units, especially peaking units.
6.5 2040 Base Case Results—Initial Scenario
The 2040 Base Case was evaluated to test the results from the LTCE with and without additional
transmission. The PROMOD models consider inputs from transmission power flow analysis as well as the
model parameters and buildout from the LTCE.
New York is found to be a net exporter of energy in the 2040 Base Case. The annual gross net external sale
is 6.8 TWh, which is driven by economics of the production cost simulation.
2040 Base Case Congestion and Curtailment
The total curtailment was about 1.5% in 2040, slightly higher than 2030. The most curtailed resource was
land-based wind at about 4.5%, particularly in Central New York (about 8.7%).
The 2040 Base Case does show significant congestion. The greatest impact on congestion is noted on the
Millwood South interface and the Dunwoodie-Shore Road cable, which accounts for a large portion of the
congestion identified.
App. E to Initial Report on Power Grid Study

E-48
Table 6-3. Initial Scenario—2040 Base Constraints
Constraints Congestion Cost (k$)
Congested Hours
I:NY_MILLWOOD-SOUTH FLO BASE CASE (724,064) 582 DUNWOODIE to SHORE RD FLO SPRAINBROOK CABLE (410,287) 2,798 RAINEY8W to VERNON-W FLO BASE CASE (352,335) 4,960 N.SCOT99 to N.SCOT1 1 FLO BASE CASE (219,921) 760 E13ST to FARRAGUT WES FLO BASE CASE (127,426) 1,990 COOPERS CORNERS to MDTN TAP FLO ROCK TAV to DOLSON AVE (90,282) 1,145 VERNON-E to GRENWOOD S FLO BASE CASE (89,869) 823 ANNTRHIGH to ASTOR FLO BASE CASE (86,480) 5,436 FRASR345 to FRASR115 FLO BASE CASE (83,428) 4,063 I:NY INTERFACE NY-ON FLO BASE CASE (78,621) 2,935 ASTE-ERG to HELLGATE FLO BASE CASE (74,231) 750 DUNWOODIE to SHORE RD FLO BASE CASE (70,419) 2,150 HUDAVE E to JAMAICA FLO BASE CASE (69,301) 650 COOPC345 to COOPC115 FLO BASE CASE (63,429) 2,332 NORTH WAV115 to EAST SAYRE FLO BASE CASE (41,679) 1,484 I:NY_PJM EAST-NY G FLO BASE CASE (34,656) 1,780 LADENTWN to RAMAPO FLO BASE CASE (10,354) 85
The Millwood South Interface recorded $724 million and the Dunwoodie cable (combined) recorded
$480 million in congestion costs. As a whole, New York State experienced zonal congestion costs of
about $4.3 billion in the 2040 Base Case.
Figure 6-1 shows the general location of the congested areas.
App. E to Initial Report on Power Grid Study

E-49
Figure 6-1. Initial Scenario—2040 Base System Congestion
The congestion costs signal the opportunity for system upgrades to relieve the transmission bottlenecks and
move power to the large load pockets (especially downstate). It should be noted that any constraint
resolutions are, at this time, indicative and further analysis is needed to fully vet any of these potential
transmission improvements.
A preliminary list of the upgrades to address the identified binding constraints is provided in the table
below. Note that not all identified constraints were proposed to be upgraded as the study only focuses on
interzonal interfaces and BPS elements within NYCA. The benefits, costs, and economics of these upgrades
are addressed in subsequent sections.
Table 6-4. Initial Scenario—2040 Base Indicative Transmission Upgrades
Zone Indicative Transmission Upgrades in 2040 Upgrade Case
H/I/J Increase Millwood South Interface transfer capability to 13000 MVA, and increase Dunwoodie South Interface transfer capability to 6000 MVA
I/K Increase Dunwoodie - Shore Rd cable LTE rating to ~3000 MVA. (likely require two new 345 kV cables in parallel and two new 345/138kV transformers at Shore Rd)
E/G Increase Coopers Corner - Middletown - Rock Tavern - Dolson Ave 345 kV line sections LTE rating to ~3000 MVA
G Increase Ladentown - Ramapo 345 kV line LTE rating to ~2500 MVA
6.6 2040 Upgrade Results—Initial Scenario
The 2040 Upgrade Case evaluates the impact in the PROMOD model with the upgrades indicated for the
2040 Base Case (Table 6-4). As previously stated, the 2030 Base Case did not require transmission
App. E to Initial Report on Power Grid Study

E-50
upgrades. However, some of the same congestion (at a much-reduced level) exists in the 2030 Base Case
and was also observed in the 2040 Base Case.
Net exports were found to be effectively zero with a small level of net energy exports (as in the 2040 Base).
2040 Upgrade Curtailment and Congestion
Curtailment in the 2040 Upgrade Case was reduced because of the transmission upgrades implemented in
the model. The total system curtailment was reduced to 0.1% (down from the 2040 Base at 1.5%). LBW is
curtailment is reduced to 0.2%. Following the reduction in curtailment, a reduction in congestion can also
be noted. Focusing on the elements that were upgraded, it is possible to compare the congestion costs before
and after upgrades. Table 6-5 shows the impact of these projects in relieving congestion. The top congested
interface, Millwood-South, is reduced 97% with the preliminary upgrades, while the Dunwoodie to Shore
Rd interface also showed significant congestion reduction.
Table 6-5. Initial Scenario—2040 Base, 2040 Upgrade and % Reduction
Constraints Base
Congestion Cost (k$)
Upgrade Congestion
Cost (k$)
Congested
Hours %
Reduction I:NY_MILLWOOD-SOUTH FLO BASE CASE* (724,064) (19,305) 28 97% DUNWOODIE to SHORE RD FLO SPRAINBROOK CABLE* (410,287) (158,144) 3,568 61%
COOPERS CORNERS to MDTN TAP FLO ROCK TAV to DOLSON AVE* (90,282) - - 100%
DUNWOODIE to SHORE RD FLO BASE CASE* (70,419) - - 100% COOPC345 to COOPC115 FLO BASE CASE* (63,429) - - 100%
LADENTWN to RAMAPO FLO BASE CASE* (10,354) - - 100% *These constraints are associated with the transmission upgrades applied.
The overall zonal congestion costs for New York State were $2.4 billion, reduced from $4.3 billion in the
2040 Base Case.
Transmission Upgrade Costs
The total estimated capital cost of the indicative upgrades ranges is about $2.6 billion (2040) as detailed in
Table 6-6. This estimate corresponds to the value calculated using planning level unit costs plus a 50%
contingency considering the uncertainty surrounding future development of the projects.
The total estimated operations and maintenance (O&M) cost of the upgrades, assuming 2.5% of the capital
cost, is $64 million. In light of these indicative transmission upgrades, it is important to note the following:
• The transmission upgrades and cost estimates are indicative of the need to move energy across the congested interfaces and BPS transmission facilities in the State. The evaluation of the upgrades needs
App. E to Initial Report on Power Grid Study

E-51
to be further researched to verify need and define the most effective way to achieve the transmission capacity increase and costs.
• Additional factors such as right-of-way, real estate costs, environmental permitting, and constructability are not a part of this assessment and could affect the feasibility and cost estimates of these indicative upgrades. Additional research is needed for the range of uncertainties.
• Alternative designs to the indicative upgrades (e.g., HVDC) should be pursued to address the transmission limitations not factored at this stage.
Table 6-6. Indicative Upgrades and Costs
Zone Indicative Transmission Upgrades in 2040 Upgrade Case $M
H/I/J Increase Millwood South Interface transfer capability to 13000 MVA, and increase Dunwoodie South Interface transfer capability to 6000 MVA 1,350
I/K Increase Dunwoodie—Shore Rd cable LTE rating to ~3000 MVA. (likely require two new 345 kV cables in parallel and two new 345/138kV transformers at Shore Rd)
750
E/G Increase Coopers Corner—Middletown—Rock Tavern—Dolson Ave 345 kV line sections LTE rating to ~3000 MVA 400
G Increase Ladentown—Ramapo 345 kV line LTE rating to ~2500 MVA 55
Estimated Total Base Costs with Contingency 2,555
The transmission upgrades in Table 6-6 do not include any potentially necessary local transmission
investments, as the screening levels performed in the PROMOD analysis focused on congestion in the bulk
transmission system (230 kV and above) and interzonal interfaces.
Adjusted Production Costs and Benefit to Cost Ratio
An indicative factor in assessing whether a transmission improvement is economically justifiable is to look
at the Adjusted Production Costs (APC) savings and the Benefit to Cost ratio (B/C). The equation below
shows APC savings between the base and upgrade cases in 2040.
The APC is the Total Production Cost plus the Cost of External Purchases less the Revenues from External
Sales. With the upgrades, the APC decreases from $1,507 million to $878 million, resulting in a savings of
$629 million. Assuming a Cost Recovery Factor of 8%, and a 2.5% O&M cost adder to annualize the total
transmission costs, the indicative B/C Ratio is about 3.0.
App. E to Initial Report on Power Grid Study

E-52
Equation 1. Adjusted Production Costs Benefit to Cost Ratio
𝐵𝑒𝑛𝑒𝑓𝑖𝑡(𝑂𝑛𝑒 − 𝑌𝑒𝑎𝑟 𝐴𝑃𝐶 𝑆𝑎𝑣𝑖𝑛𝑔)
𝐶𝑜𝑠𝑡 (𝐴𝑛𝑛𝑢𝑎𝑙𝑖𝑧𝑒𝑑 𝐶𝑜𝑠𝑡)=
$629
$2,555 × 8% × 102.5%= 3.0
It should be noted that the one-year APC and B/C analysis is intended for screening purposes and indicates
that the preliminary upgrades are cost effective. A more detailed 10-year net present value analysis would
require at least three future year PROMOD runs (e.g., 2035, 2040 and 2045) to estimate the full APC
savings. This additional analysis was not in scope for this study.
6.7 Iteration Buildout Results—Initial Scenario
As part of the overall analysis, the LTCE was reassessed with AURORA to determine the changes that the
new transmission transfer capability and cost would introduce in the generation buildout.
The resultant iteration buildout had a slight reduction of the total renewable capacity by 2040 (2.8%),
mainly in solar (865 MW or 4.9%) and offshore wind (469 MW or 4.6%). There was a small increase in
land-based wind generation (184 MW or 1.5%). The energy storage increased by 2,538 MW (or 12.8%)
and helps reduce curtailment, allows better use of the renewable to supply load at times of reduced
renewable energy output, and, in general, provides for better management of congestion.
2040 Iteration Base Results
The 2040 LTCE iteration buildout was added to the PROMOD program without new transmission creating
the 2040 Iteration Base Case. Similar as the original LTCE, energy exports are found to be essentially net
neutral with a very small level of net energy exports. as driven by the economics of the model. The
curtailment in the case was observed at 1.3%. As in the 2040 Base Case, the most curtailment is related to
LBW at 3.4%.
Regarding constraints and congestion, based on a review of both the 2040 Initial and the 2040 Iteration
buildouts, there is a reduction in congestion (see Table 6-7 versus Table 6-3) but not enough to eliminate
the need for all of the identified reinforcements. They are still necessary, and the buildout changes did not
alter or avoid any indicative upgrades. No new reinforcements are found to be required. The constraints in
the Table 6-7 focus on those elements that are upgraded in the 2040 Initial Buildout Upgrade Case.
App. E to Initial Report on Power Grid Study

E-53
Table 6-7. Initial Scenario—2040 Iteration Base Constraints
Constraints Congestion
Cost (k$)
Congestion Hours
I:NY_MILLWOOD-SOUTH FLO BASE CASE* (447,392) 439 DUNWOODIE to SHORE RD FLO SPRAINBROOK CABLE* (185,102) 2733 COOPERS CORNERS to MDTN TAP FLO ROCK TAV to DOLSON AVE* (89,241) 845
DUNWOODIE to SHORE RD FLO BASE CASE* (35,388) 2280 COOPC345 to COOPC115 FLO BASE CASE* (28,816) 1215 LADENTWN to RAMAPO FLO BASE CASE* (13,833) 70
* Indicates constraints are associated with the reinforcements in the system.
The total zonal congestion costs are at $2.9 billion in the iteration base case.
2040 Iteration Upgrade Results
The 2040 Iteration Upgrade Case results follow with the addition of the transmission upgrades to the model.
Energy exchanges with neighboring systems indicate that State is essentially net neutral, which is in line
with the 2040 Upgrade result.
Curtailment is reduced from 1.3% to 0.4%, as compared to the iteration base case. As with the 2040 Upgrade
Case, the curtailment shifted away from LBW being the leading contributor of curtailment.
The table shows the impact of the transmission upgrades in the congestion on this iteration upgrade case.
Congestion reductions were observed from the constraints in the iteration upgrade case and iteration base
case. Overall congestion is significantly reduced, and the preliminary transmission upgrades effectively
address the targeted, congested elements.
Table 6-8. Initial Scenario—2040 Iteration Constraints Base, Upgrade and % Reduction
Constraints
Base Congestion
Cost (k$)
Upgrade Congestion
Cost (k$) Congestion
Hours %
Reduction I:NY_MILLWOOD-SOUTH FLO BASE CASE* (447,392) (1,437) 139 100% DUNWOODIE to SHORE RD FLO SPRAINBROOK CABLE* (185,102) (105,531) 3,248 43%
COOPC345 to COOPC115 FLO BASE CASE* (28,816) - - 100% COOPERS CORNERS to MDTN TAP FLO ROCK TAV to DOLSON AVE* (89,241) - - 100%
DUNWOODIE to SHORE RD FLO BASE CASE* (35,388) - - 100% LADENTWN to RAMAPO FLO BASE CASE* (13,833) - - 100%
* Indicates constraints are associated with the reinforcements in the system.
The total zonal congestion costs, as compared to the iteration base case, are also reduced from $2.9 billion
to $1.9 billion, and lower than the $2.4 billion in 2040 Initial Buildout Base Case. It was also observed that
App. E to Initial Report on Power Grid Study

E-54
the total RNG consumption reduced from 4,617 GWh in the 2040 Base Case to 2,978 GWh in the 2040
Iteration Upgrade Case.
Adjusted Production Costs and Benefit to Cost Ratio
A comparison of the APC for the iteration base cases shows there is a savings from the iteration
upgrade cases.
With the upgrades in place, the APC decreases from $1,156 million to $862 million in 2040, resulting in a
savings of $294 million. Assuming a Cost Recovery Factor of 8%, and a 2.5% O&M cost adder to annualize
the total transmission costs, the indicative B/C Ratio is about 1.4.
Equation 2. Iteration Case Adjusted Production Costs Benefit to Cost Ratio
𝐵𝑒𝑛𝑒𝑓𝑖𝑡(𝑂𝑛𝑒 − 𝑌𝑒𝑎𝑟 𝐴𝑃𝐶 𝑆𝑎𝑣𝑖𝑛𝑔)
𝐶𝑜𝑠𝑡 (𝐴𝑛𝑛𝑢𝑎𝑙𝑖𝑧𝑒𝑑 𝐶𝑜𝑠𝑡)=
$294
$2,555 × 8% × 102.5%= 1.4
In this case, as the Iteration Buildout partially addressed the congestion with a better selection and location
of the resources, transmission somewhat reduced impact resulting in smaller APC reduction and lower B/C
ratios (1.4 vs. 3.0). Further, as will be shown in the High Demand Scenario, increases in load significantly
affect the APC savings and the B/C ratios are much higher in that Scenario.
6.8 Summary of Comparisons of the Initial Scenario
Based on the extent of changes in the buildout and the increases in battery storage along with the overall
congestion and curtailment reductions, the Iteration case buildout provides a better option for the Initial
Scenario, hence it is considered the final LTCE.
As the power grid adds a significant amount of renewable capacity to the market post 2035, the identified
transmission reinforcements offer a potential opportunity to relieve congestion in an economic fashion,
while supporting the achievement CLCPA’s zero-emission generation goal by 2040.
Indicative transmission reinforcements were identified and were found to be effective in addressing
congestion and curtailment. The economic benefits of these upgrades appear to exceed their costs. However,
further research is needed to address the uncertainties on the generation buildout and its location, load
growth uncertainty, and optimize the design and cost of these projects. This research can be completed at a
later date as no action is immediately indicated. The research should be targeted to reduce uncertainty and
identify the best projects to address the expected congestion.
App. E to Initial Report on Power Grid Study

E-55
Transmission reinforcement investments should be evaluated in context of the 2040 Iteration Base Case,
which shows significant transmission constraints, similar to those in the 2040 Base Case.
The analysis showed that in the short term, by 2030, the addition of the Western New York (Empire State
line), AC Transmission PPTN, Northern NY project, and NYC Tx projects supports achievement of the
70% renewable goal with low levels of bulk system curtailment (0.1%) and congestion. No additional BPS
(230 kV and above) investments appear to be necessary.
App. E to Initial Report on Power Grid Study

E-56
High Demand Scenario 7.1 Assumptions—High Demand Load Forecast
The High Demand Scenario incorporates the same assumptions as the Initial Scenario but increases the
projection of net energy load and peak load. The energy demand forecast for the High Demand Scenario
was based on the Limited Non-Energy Pathway of the Pathways to Deep Decarbonization in New York
State22 study. The forecast was refined to include 2030 statewide demand and peak levels that are
comparable to those in the NYISO CARIS 70 x 30 Base Load case while maintaining the 2040 outcomes
of the pathways case. Table 7-1 and Table 7-2 summarize the High Demand Scenario and Initial Scenario
net energy for load and peak demand forecast.
Table 7-1. Net Energy for Load—Initial Scenario and High Demand Scenario
Energy (GWh)
Initial Scenario
High Demand Scenario
2020 156,799 156,959
2025 147,602 150,855
2030 151,678 162,188
2035 176,171 195,874
2040 207,506 233,481
Table 7-2. Summer and Winter Peak Load—Initial Scenario and High Demand Scenario
Winter Peak (GW) Summer Peak (GW)
Initial Scenario
High Demand Scenario
Initial Scenario
High Demand Scenario
2020 22 23 32 31
2025 22 23 30 30
2030 23 27 30 34
2035 28 35 34 38
2040 34 42 38 42
22 Visit https://climate.ny.gov/Climate-Resources for the study Pathways to Deep Decarbonization in New York State.
App. E to Initial Report on Power Grid Study

E-57
Additionally, the High Demand Scenario’s hourly demand shaping was modified in 5-year increments,
which transitions New York State to a winter peaking system. By 2040, the State will become winter
peaking. Figure 7-1 summarizes the monthly peak demand for the High Demand Scenario and the Initial
Scenario. The hourly demand shapes are such that peak demand occurs in the early evening (6 p.m.), which
reduces the amount of reliable peak capacity solar can provide to the market. The hourly demand shape for
2030 and 2040 peak days are illustrated in Figures 7-2, 7-3, and 7-4.
Figure 7-1. Monthly Peak Demand—Initial Scenario and High Demand Scenario
Figure 7-2. 2030 Hourly Peak Day Demand—Winter and Summer—High Demand Scenario
15
20
25
30
35
40
45
Jan Feb Mar Apr May Jun Jul Aug Sep Oct Nov Dec
(GW)
2030 High Demand
2030 Initial Scenario
2040 Initital Scenario
2040 High Demand
10
15
20
25
30
35
40
45
12
:00
AM
1:0
0 A
M
2:0
0 A
M
3:0
0 A
M
4:0
0 A
M
5:0
0 A
M
6:0
0 A
M
7:0
0 A
M
8:0
0 A
M
9:0
0 A
M
10
:00
AM
11
:00
AM
12
:00
PM
1:0
0 P
M
2:0
0 P
M
3:0
0 P
M
4:0
0 P
M
5:0
0 P
M
6:0
0 P
M
7:0
0 P
M
8:0
0 P
M
9:0
0 P
M
10
:00
PM
11
:00
PM
2030 Summer Peak Day 2030 Winter Peak Day
2030 DG Solar Adj Summer Peak Day 2030 DG Solar Adj Winter Peak Day(GW)
App. E to Initial Report on Power Grid Study
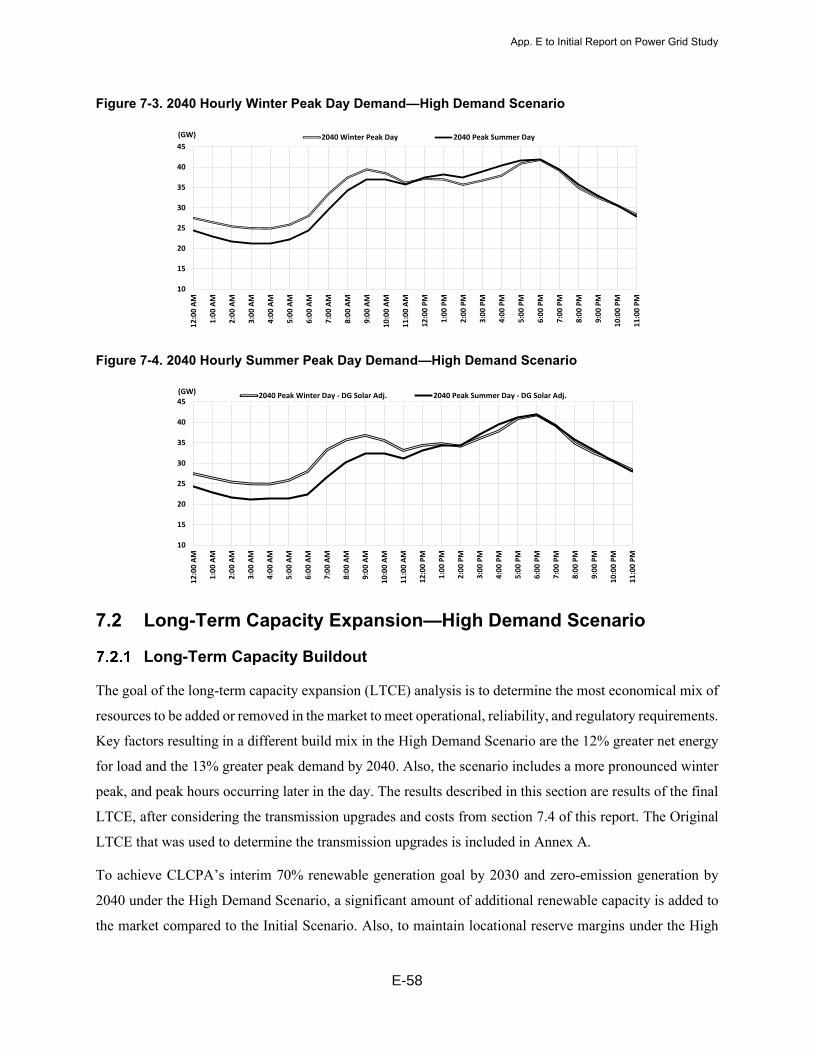
E-58
Figure 7-3. 2040 Hourly Winter Peak Day Demand—High Demand Scenario
Figure 7-4. 2040 Hourly Summer Peak Day Demand—High Demand Scenario
7.2 Long-Term Capacity Expansion—High Demand Scenario
Long-Term Capacity Buildout
The goal of the long-term capacity expansion (LTCE) analysis is to determine the most economical mix of
resources to be added or removed in the market to meet operational, reliability, and regulatory requirements.
Key factors resulting in a different build mix in the High Demand Scenario are the 12% greater net energy
for load and the 13% greater peak demand by 2040. Also, the scenario includes a more pronounced winter
peak, and peak hours occurring later in the day. The results described in this section are results of the final
LTCE, after considering the transmission upgrades and costs from section 7.4 of this report. The Original
LTCE that was used to determine the transmission upgrades is included in Annex A.
To achieve CLCPA’s interim 70% renewable generation goal by 2030 and zero-emission generation by
2040 under the High Demand Scenario, a significant amount of additional renewable capacity is added to
the market compared to the Initial Scenario. Also, to maintain locational reserve margins under the High
10
15
20
25
30
35
40
45
12
:00
AM
1:0
0 A
M
2:0
0 A
M
3:0
0 A
M
4:0
0 A
M
5:0
0 A
M
6:0
0 A
M
7:0
0 A
M
8:0
0 A
M
9:0
0 A
M
10
:00
AM
11
:00
AM
12
:00
PM
1:0
0 P
M
2:0
0 P
M
3:0
0 P
M
4:0
0 P
M
5:0
0 P
M
6:0
0 P
M
7:0
0 P
M
8:0
0 P
M
9:0
0 P
M
10
:00
PM
11
:00
PM
2040 Winter Peak Day 2040 Peak Summer Day(GW)
10
15
20
25
30
35
40
45
12
:00
AM
1:0
0 A
M
2:0
0 A
M
3:0
0 A
M
4:0
0 A
M
5:0
0 A
M
6:0
0 A
M
7:0
0 A
M
8:0
0 A
M
9:0
0 A
M
10
:00
AM
11
:00
AM
12
:00
PM
1:0
0 P
M
2:0
0 P
M
3:0
0 P
M
4:0
0 P
M
5:0
0 P
M
6:0
0 P
M
7:0
0 P
M
8:0
0 P
M
9:0
0 P
M
10
:00
PM
11
:00
PM
2040 Peak Winter Day - DG Solar Adj. 2040 Peak Summer Day - DG Solar Adj.(GW)
App. E to Initial Report on Power Grid Study

E-59
Demand Scenario, the market will require additional reliable capacity. Because the effective load carrying
capability of renewables declines throughout the study with higher penetration (especially solar), New York
State’s supply mix will include more gas-fired capacity compared to the Initial Scenario. This is because
thermal capacity’s peak, effective load, carrying capability is close to 100%. A summary of the State’s
capacity supply mix from the High Demand Scenario is summarized in Table 7-3.
Table 7-3. 2020-2040 New York Installed Capacity Supply Mix—High Demand Scenario
In megawatts.
2025 2030 2035 2040
Thermal 25,730 28,231 28,758 22,954
Nuclear 3,381 3,381 3,381 3,381
Hydro 4,663 4,663 4,663 4,663
Wind 4,027 7,357 9,194 12,690
Offshore Wind 1,826 6,000 9,000 13,597
Solar 3,099 5,707 11,577 22,577
Energy Storage 1,542 3,000 4,213 14,891
Other Renew 450 472 472 472
NY Tx 1,250 1,250 1,250 1,250
BTM Solar (MW-AC) 4,839 5,323 5,856 6,443
Energy Outlook
Under the High Demand Scenario, roughly 113 TWh of renewable generation is required in 2030 to achieve
New York State’s interim target of 70% renewable generation. By 2040, the State needs 233 TWh of zero-
emission generation to meet CLCPA’s overall target. The modeling results include 88% of renewable
generation in achieving the overall 2040 outcome. A summary of the generation outlook based on the
capacity expansion for the High Demand Scenario is provided in Tables 7-4 and 7-5.
App. E to Initial Report on Power Grid Study

E-60
Table 7-4. 2025-2040 Annual Generation by Technology—High Demand Scenario
In gigawatt hours.
2025 2030 2035 2040
Thermal 41,342 22,906 19,232 2,150
Nuclear 28,875 27,042 28,875 27,127
Hydro 28,643 28,547 28,622 28,390
Onshore Wind 10,780 22,770 29,231 42,118
Offshore Wind 5,863 24,078 38,308 64,467
Solar 4,094 9,547 21,658 40,758
Other Renew 2,761 2,739 2,630 2,239
NYC Tx 10,000 9,973 9,383 8,479
Legacy Hydro Imports 10,008 10,010 10,010 10,066
DG Solar (AC) 7,266 7,994 8,795 9,697
Non-Hydro Net Imports 1,421 (2,877) (24) 592
Table 7-5. 2030 and 2040 Renewable Generation Breakdown by Technology/Source
In gigawatt hours.
2030 2040
Energy Demand 162,116 233,475
Total RE Generation 114,563 205,318
RE Gen % of Demand 71% 88%
NYC Tx 9,973 8,479
Legacy Can. Hydro 10,010 10,066
DG Solar 7,994 9,697
Grid Solar 9,547 40,758
Land-based Wind 22,770 42,118
Offshore Wind 24,078 64,467
NY Hydro 28,547 28,390
Other Renewables23 1,643 1,343
Energy Prices
Power prices in the High Demand Scenario remain relatively flat over time as zero variable cost renewable
energy is added to New York State’s capacity supply, which offsets the high-electricity demand growth.
23 Due to uncertainty in eligibility for certain resources, the contribution of “Other Renewables” was discounted by 40%.
App. E to Initial Report on Power Grid Study

E-61
Electricity demand escalates throughout the forecast, but the amount of renewable energy needs to go up in
a proportionate manner to ensure that the 70% renewables requirement is achieved in 2030.
The slight increase in power prices that occurs prior to 2040 is the result of increased natural gas prices and
RGGI carbon prices. In 2040, the New York State still needs fast ramping thermal generation to provide
energy during peak demand hours. Additionally, the State’s thermal generation fleet was modeled with only
the option to consume renewable natural gas (RNG) starting in 2040, which was assumed to cost
$23/MMBtu. The dispatch cost for a gas turbine with a 9,000 btu/kwh heat rate that consumes RNG would
be $220/MWh in 2040. However, it is important to note that there are significant uncertainties on what the
price of renewable natural gas will be in the long term (2040) and the cost of other competing technologies
to provide dispatchable generation with zero emissions
A representation of upstate and downstate power prices in the State is summarized in Table 7-6.
Figure 7-5. Zone A and Zone J Average Wholesale Energy Price Forecast ($2018/MWH)
Emissions
Similar to the Initial Scenario, as New York State strives to meet its 70% renewable energy goal by 2030
and to realize a zero-emission power system by 2040, the system will reduce its emissions over time. In the
High Demand Scenario, high energy demand leads to more gas-fired generation over the study’s time
horizon. More generation from thermal units leads to a slight increase in emissions throughout the forecast
compared to the Initial Scenario, except for 2040, when carbon emissions drop to zero.
$24$25
$28
$41
$26$28
$31
$51
$10
$15
$20
$25
$30
$35
$40
$45
$50
$55
2025 2030 2035 2040
Zone A Zone J$/MWh
App. E to Initial Report on Power Grid Study

E-62
Figure 7-6. Annual NYISO Carbon Emissions (Million Short Tons) Forecast
System Reliability
For the High Demand Scenario, the study conducted a loss of load expectation (LOLE) analysis within
AURORA and a flexible capacity analysis using the same methodologies as the Initial Scenario
reliability analyses.
Unlike the Initial Scenario, the LOLE analysis in the High Demand Scenario did uncover instances of loss
of load. After simulating 100 iterations in 2040, there were 193 hours with unserved load, resulting in an
LOLE of 0.8 days/10 years. However, the system’s reliability metrics met the current NYISO criteria of 1
day/10 years (1-in-10) without adding any additional capacity.
The flexible capacity analysis in the High Demand Scenario was similar to the Initial Scenario, but higher
demand and more intermittent resources required a higher amount of fast ramping capacity (energy storage
or gas turbines). However, similar to the Initial Scenario, the capacity buildout for the High Demand
Scenario met flexible capacity requirements without adding additional capacity.
Table 7-6. Estimated Sub-Hourly Flexible Reserves—Required versus Available
In megawatts.
NYCA (Zone A-K)
East (Zone F-K)
SENY (Zone G-K)
NYC (Zone J)
Long Island (Zone K)
2030 Flex Cap. Required 3,356 2,316 1,824 939 584
Flex Cap. Available 9,182 8,604 8,543 3,690 3,809
2040 Flex Cap. Required 6,779 4,227 3,311 1,658 1,270
Flex Cap. Available 24,468 18,242 17,681 8,809 5,452
20.2
9.2
7.6
-0
5
10
15
20
25
2025 2030 2035 2040
MTons
App. E to Initial Report on Power Grid Study

E-63
In 2040, 23 GW of thermal capacity economically persists in the market even though thermal generators
have low-capacity factors. The essential driver for their persistence is that the study assumes current
capacity market structures remain in place through 2040. Capacity market guidelines and rules may change
to meet the needs of a different system 20 years from now, so it is hard to anticipate whether this level of
thermal capacity will remain in 2040.
7.3 Transmission Reliability Analysis—High Demand Scenario
As in the case of the Initial Scenario, the transmission load-flow analysis aims to evaluate transmission
needs for New York State’s zero-emission by 2040 goal. The analysis has the overarching objectives to (a)
identify possible transmission system upgrades needed to support the load growth and the renewable
generation additions and (b) identify critical contingencies to confirm their inclusion in congestion analysis.
In general, this analysis identified similar constraints as in the Initial Scenario but with deeper levels
of overloads.
Case Selection and Modeling
As in the Initial Scenario analysis, Siemens selected dispatches to represent points of high stress to the
transmission system including a 2040 summer peak case with high levels of solar photovoltaic generation
and a 2040 low-load, high-wind generation dispatch. The table below shows the loads at the times selected
for both dispatches. The summer peak condition represents 96% of the actual 2040 system peak and the
low-load dispatch is 64% of the peak.
App. E to Initial Report on Power Grid Study
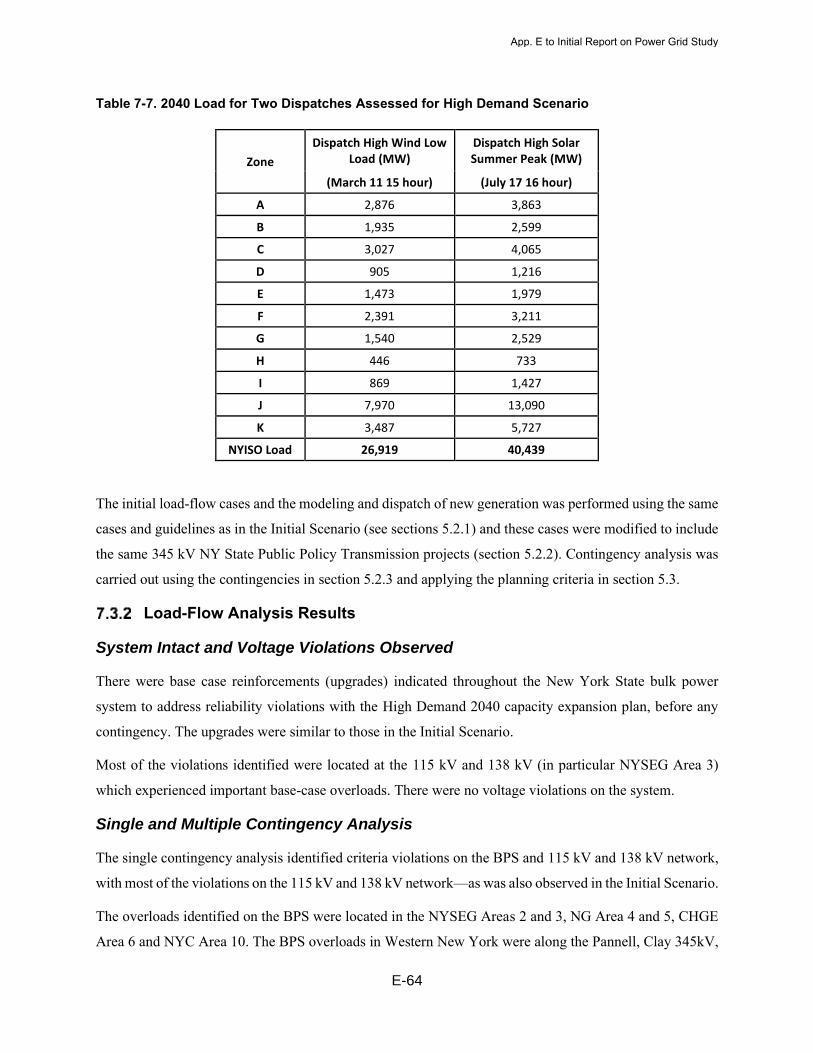
E-64
Table 7-7. 2040 Load for Two Dispatches Assessed for High Demand Scenario
Zone
Dispatch High Wind Low Load (MW)
Dispatch High Solar Summer Peak (MW)
(March 11 15 hour) (July 17 16 hour)
A 2,876 3,863
B 1,935 2,599
C 3,027 4,065
D 905 1,216
E 1,473 1,979
F 2,391 3,211
G 1,540 2,529
H 446 733
I 869 1,427
J 7,970 13,090
K 3,487 5,727
NYISO Load 26,919 40,439
The initial load-flow cases and the modeling and dispatch of new generation was performed using the same
cases and guidelines as in the Initial Scenario (see sections 5.2.1) and these cases were modified to include
the same 345 kV NY State Public Policy Transmission projects (section 5.2.2). Contingency analysis was
carried out using the contingencies in section 5.2.3 and applying the planning criteria in section 5.3.
Load-Flow Analysis Results
System Intact and Voltage Violations Observed
There were base case reinforcements (upgrades) indicated throughout the New York State bulk power
system to address reliability violations with the High Demand 2040 capacity expansion plan, before any
contingency. The upgrades were similar to those in the Initial Scenario.
Most of the violations identified were located at the 115 kV and 138 kV (in particular NYSEG Area 3)
which experienced important base-case overloads. There were no voltage violations on the system.
Single and Multiple Contingency Analysis
The single contingency analysis identified criteria violations on the BPS and 115 kV and 138 kV network,
with most of the violations on the 115 kV and 138 kV network—as was also observed in the Initial Scenario.
The overloads identified on the BPS were located in the NYSEG Areas 2 and 3, NG Area 4 and 5, CHGE
Area 6 and NYC Area 10. The BPS overloads in Western New York were along the Pannell, Clay 345kV,
App. E to Initial Report on Power Grid Study

E-65
and the Meyer 230 kV paths that allow power to flow from west to east within the State. The constraints
near the center of the State were, as before, the consequence of higher power flows from north to south.
These were along the Porter, Valley, and the Leeds, New Scotland’s areas. The constraints noted in the
NYC/Long Island area are due to the large amount of flow coming into the City from the balance of State
(BOS) to feed the load.
Load-Flow Analysis Findings
The High Demand results largely parallel those of the Initial Scenario, although the level of overloads
observed were higher. The heaviest impacts were found at the local 115 kV and 138 kV system but, as
before, BPS impacts by 2040 were located in the following areas:
• Downstream of Coopers Corner into Zone GHI
• Dunwoodie-Shore Rd cable
• NYC and West Long Island area
Information on the identified constraints including the contingencies/monitored elements and candidate
reinforcements were provided to and considered in the production costing (PROMOD) analysis.
7.4 Transmission Congestion Analysis—High Demand Scenario
Study Overview and Objectives
As in the Initial Scenario, the High Demand Scenario’s LTCE performance was assessed under
security-constrained unit commitment and economic dispatch (SCUC/SCED) using PROMOD®IV.
The results of the High Demand Scenario are similar to those in the Initial Scenario, but with much higher
levels of congestion and resulting in the need for larger scope upgrades.
As before, the analysis presented in this section complements the LTCE analysis by examining two critical
years: 2030 with the 70% renewable goal and 2040 with the zero-emission goal.
High Demand Scenario Development
The High Demand Scenario was carried out by developing and evaluating the same cases as in the Initial
Scenario for 2030 and 2040:
• Initial buildout with no new transmission (base case)
• Initial buildout with new transmission (upgrade case)
• Iteration buildout with no new transmission (iteration base case)
App. E to Initial Report on Power Grid Study

E-66
• Iteration buildout with new transmission (iteration upgrade case)
The High Demand PROMOD model used the same assumptions and procedures as in the Initial Scenario
(see sections 6.3.1 and 6.3.2), with the exception of the higher demand forecast and the
corresponding LTCE.
High Demand Scenario Results Summary
As in the Initial Scenario, the study compares key metric results on a system-wide basis from the production
cost analysis on the High Demand Scenario. The comparison focuses on year 2040 as there was low
congestion and curtailment observed from the 2030 analysis.
As can be seen in the Table 7-8, starting from the original LTCE buildout to the Iteration LTCE buildout,
as well as from the cases without transmission upgrade, cases compared to the cases with transmission
upgrade cases, note the following:
• Congestion and curtailment are both reduced from the Original to the Iteration LTCE and include the effects of new transmission (upgrade). The congestion and the benefits of transmission are much larger than in the Initial Scenario (refer to Table 6-1).
• The NYCA system energy exchange is found to be almost net neutral in all cases with very small of energy being exported except for the iteration upgrade case where the system is almost in equilibrium. Note that the amount of energy being exported reduces for each subsequent case and finally reaches near equilibrium on the last case.
• The RNG consumptions are found to be generally higher than the Initial Scenario cases. However, with most of the congestion resolved, RNG is also reduced to below 3,000 GWh level.
• The overall APC trends down as transmission is added and/or the iteration LTCE is considered, similar to the Initial Scenario, and there is more APC savings potential in the High Demand Scenario than the Initial Scenario. This is due to higher levels of congestion addressed by new transmission in the upgrade cases.
App. E to Initial Report on Power Grid Study

E-67
Table 7-8. High Demand Scenario—2040 Results Summary
2040 PROMOD
Case Generation
Buildout Transmission
Buildout
Zonal Congestion
Cost ($B)
Statewide RE Curtail
(%)
RNG Generation
(GWh) APC ($M)
Base Case
Original LTCE Original 23.0 3.4 13,943 5,343
Upgrade Case
Original LTCE Upgrade 1.1 0.6 4,960 1,477
Iteration Base Case
Iteration LTCE Original 13.8 2.5 8,788 3,495
Iteration Upgrade
Case Iteration
LTCE Upgrade 1.5 0.8 2,645 967
More detailed results will be discussed in the sections below for each of the individual cases analyzed.
7.5 2030 Base Results—High Demand Scenario
The 2030 Base Case for the High Demand Scenario mirrored the results observed for the Initial Scenario.
The 2030 High Demand Base Case showed low congestion and, as before, the congestion in 2030 is not
enough to warrant upgrades beyond those already established in New York Public Policy.
2030 Base Congestion and Curtailment
Curtailment on renewable resources is low (0.1%) and the maximum values were observed for land-based
wind (LBW) at 0.1%. It should be emphasized that this low curtailment assumes that the public policy
transmission projects and any necessary local transmission upgrades are in place. Further, curtailment in
day-ahead and real-time operations is likely to be higher due to aspects not captured by the model, such as
operations with facilities out of service due to maintenance or forced outages.
The table below shows the 2030 Base Case congestion where the top congested element is an interface with
New England.
App. E to Initial Report on Power Grid Study

E-68
Table 7-9. High Demand Scenario—2030 Base Constraints
Constraints Congestion Cost
(k$) Congested
Hours I:NY_NYC-LI FLO BASE CASE (35,806) 2119 EAST GARDEN CITY to PAR FLO BASE CASE (35,104) 2093 DUNWOODIE to SHORE RD FLO BASE CASE (22,023) 1522 I:NY INTERFACE NY-ON FLO BASE CASE (15,140) 1926 LADENTOWN to RAMAPO FLO BASE CASE (13,475) 330 NORTH WAV115 to EAST SAYRE FLO BASE CASE (12,233) 2229 DUNWOODIE to SHORE RD Dunwoodie-Shore Road 2 (11,682) 1377 COOPERS CORNERS to MDTN TAP FLO ROCK TAV to DOLSON AVE (10,202) 540
I:NERC7005 TOTAL EAST FLO BASE CASE (6,275) 115 RAMAPO to HOPATCONG FLO BASE CASE (4,812) 2893
I:NY_PJM EAST-NY G FLO BASE CASE (4,249) 472
Total zonal congestion costs for New York State were relatively low at $142 million.
7.6 2040 Base Results—High Demand Scenario
The 2040 Base Case was evaluated to test the results from the LTCE with and without additional
transmission upgrades. The PROMOD models consider inputs from transmission power flow analysis as
well as the model parameters and buildout from the LTCE.
Energy prices for New York State show an increase in prices from the 2030 run. This change indicates
significant congestion as a result of the increase in load and renewable resources.
2040 Base Congestion and Curtailment
Curtailment of renewable resources in the 2040 Base Case is higher than observed in the 2030 Base Case.
The system curtailment was 3.4% of all renewable energy. The most significant curtailment statewide is
observed for LBW at 8.7% and particularly in Central New York (20.9%).
The 2040 Base Case shows significant congestion. The greatest impact on congestion is noted for the
Dunwoodie-Shore Road interface and the Millwood South interface. This was also observed in the Initial
Scenario but at much higher levels (see Table 7-10 versus Table 6-3).
App. E to Initial Report on Power Grid Study

E-69
Table 7-10. High Demand Scenario—2040 Base Constraints
Constraints
Congestion Cost (K$)
Congestion Hours
DUNWOODIE to SHORE RD FLO SPRIANBROOK CABLE* (13,595,595) 3354 DUNWOODIE to SHORE RD FLO BASE CASE* (4,760,818) 3404 I:NY_MILLWOOD-SOUTH FLO BASE CASE* (3,867,551) 2162 EAST GARDEN CITY to PAR FLO BASE CASE (1,583,484) 3688 FRASER 345/138KV TRANSFORMER FLO BASE CASE* (1,457,019) 2243 I:NY_NYC-LI FLO BASE CASE (370,796) 4122 I:NERC7002 WEST CENTR FLO BASE CASE (244,271) 1839 I:NY INTERFACE NY-ON FLO BASE CASE (206,338) 4207 COOPER CORNER to MIDDLETOWN TAP 345KV FLO Coopers Corners-Middleton TAP (CCRT34) 345KV* (204,350) 1308
N.WAV115 to E.SAYRE 1 FLO BASE CASE (150,275) 3233 New Scotland 345/115 kV Transformer FLO BASE CASE (149,921) 259 E13ST 46 to FARRAGUT WES1 FLO BASE CASE (129,098) 2571 I:NY_PJM EAST-NY G FLO BASE CASE (113,957) 2706 SPRAINBROOK to ACADEMY 1 FLO BASE CASE (113,868) 2664 ESTSTO to 5MILE 345kV 1 FLO BASE CASE (102,044) 2703 SPRAINBROOK to DUN NO S6 6 FLO BASE CASE (83,566) 3571 Cooper Corner 345/115 kV Transformer FLO BASE CASE* (65,836) 2057 LOVETT345 ST to E13ST 46 1 FLO BASE CASE (60,180) 159
B: SPRAINBROOK to TREMONT 1 FLO BASE CASE (45,811) 3094
I:NERC7005 TOTAL EAST FLO BASE CASE (40,489) 150 RAMAPO 5 to HOPATCONG 1 FLO BASE CASE (38,187) 2544 LADENTWN to RAMAPO 1 FLO BASE CASE* (34,648) 258
*These binding constraints are directly related to the proposed transmission reinforcements.
The top three constraints are responsible for more than $22 billion in congestion costs. The total zonal
congestion costs for New York State are at $23 billion, much higher than in the Initial Scenario
($4.3 billion).
The Figure 7-7 shows the general locations of the congestion noted in Table 7-10.
App. E to Initial Report on Power Grid Study

E-70
Figure 7-7. High Demand Scenario—2040 Base Congestion
As with the Initial Scenario, evaluation of the constraints has generated a list of indicative transmission
upgrades to address the congestion issues noted in the 2040 Base Case. The list is very similar to the
transmission upgrades from the Initial Scenario except that the illustrative upgrades require much higher
transmission capacities. Note that, as in the Initial Scenario, not all identified constraints were proposed to
be upgraded as the study only focuses on interzonal interfaces and BPS elements within NYCA. The
benefits, costs, and economics of these illustrative upgrades are addressed in the sections below.
Table 7-11. High Demand Scenario—2040 Base Indicative Transmission Upgrades
Zone Indicative Transmission Upgrades
H/I/J Increase Millwood South Interface transfer capability to 17000 MVA, and increase Dunwoodie South Interface transfer capability to 6000 MVA
I/K Increase Dunwoodie—Shore Rd path LTE rating to ~4000 MVA. (assumed three new 345 kV cables in parallel and three new 345/138kV transformers at Shore Rd)
E/G Increase Coopers Corner—Middletown—Rock Tavern—Dolson Ave 345 kV sections path LTE rating to ~3000 MVA and fix Coopers Corner 345/115 kV transformer thermal overload
G Increase Ladentown—Ramapo 345 kV path LTE rating to ~2500 MVA
App. E to Initial Report on Power Grid Study
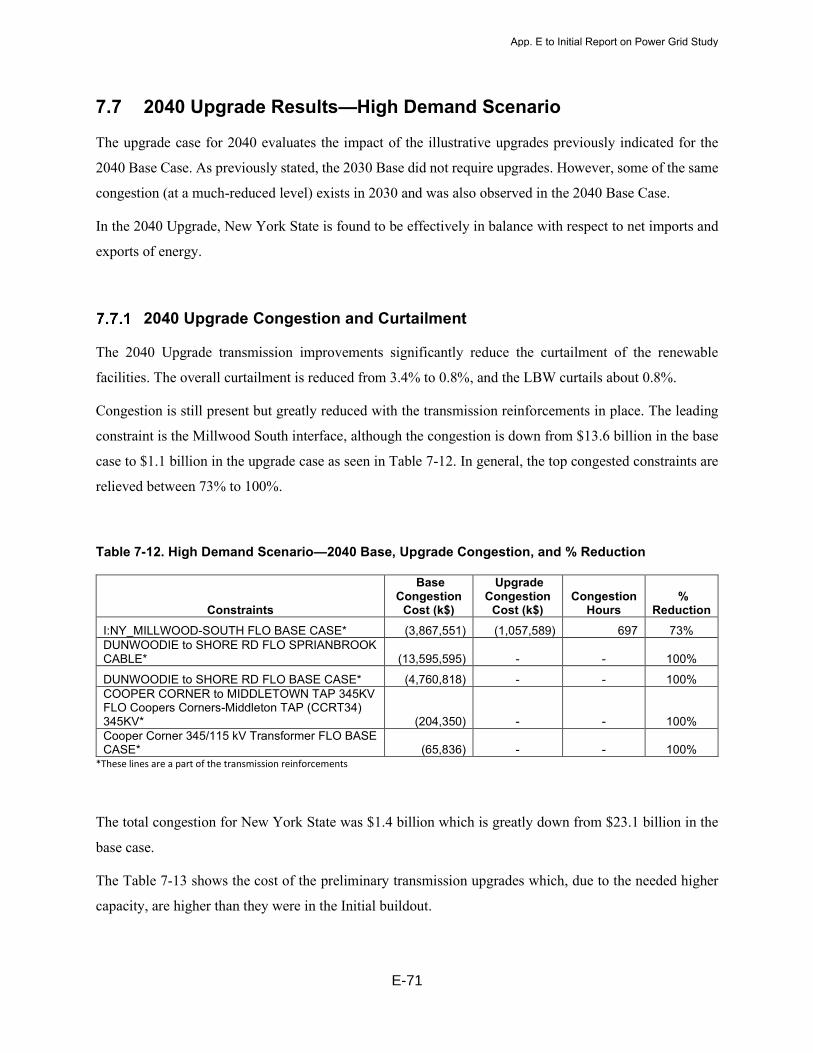
E-71
7.7 2040 Upgrade Results—High Demand Scenario
The upgrade case for 2040 evaluates the impact of the illustrative upgrades previously indicated for the
2040 Base Case. As previously stated, the 2030 Base did not require upgrades. However, some of the same
congestion (at a much-reduced level) exists in 2030 and was also observed in the 2040 Base Case.
In the 2040 Upgrade, New York State is found to be effectively in balance with respect to net imports and
exports of energy.
2040 Upgrade Congestion and Curtailment
The 2040 Upgrade transmission improvements significantly reduce the curtailment of the renewable
facilities. The overall curtailment is reduced from 3.4% to 0.8%, and the LBW curtails about 0.8%.
Congestion is still present but greatly reduced with the transmission reinforcements in place. The leading
constraint is the Millwood South interface, although the congestion is down from $13.6 billion in the base
case to $1.1 billion in the upgrade case as seen in Table 7-12. In general, the top congested constraints are
relieved between 73% to 100%.
Table 7-12. High Demand Scenario—2040 Base, Upgrade Congestion, and % Reduction
Constraints
Base Congestion
Cost (k$)
Upgrade Congestion
Cost (k$)
Congestion
Hours %
Reduction I:NY_MILLWOOD-SOUTH FLO BASE CASE* (3,867,551) (1,057,589) 697 73% DUNWOODIE to SHORE RD FLO SPRIANBROOK CABLE* (13,595,595) - - 100%
DUNWOODIE to SHORE RD FLO BASE CASE* (4,760,818) - - 100% COOPER CORNER to MIDDLETOWN TAP 345KV FLO Coopers Corners-Middleton TAP (CCRT34) 345KV* (204,350) - - 100% Cooper Corner 345/115 kV Transformer FLO BASE CASE* (65,836) - - 100%
*These lines are a part of the transmission reinforcements
The total congestion for New York State was $1.4 billion which is greatly down from $23.1 billion in the
base case.
The Table 7-13 shows the cost of the preliminary transmission upgrades which, due to the needed higher
capacity, are higher than they were in the Initial buildout.
App. E to Initial Report on Power Grid Study

E-72
Table 7-13. High Demand Scenario—Indicative Upgrades by Zone with Costs
Zone Indicative Transmission Upgrades in 2040 Upgrade Case $M
H/I/J Increase Millwood South Interface transfer capability to 17000 MVA, and increase Dunwoodie South Interface transfer capability to 6000 MVA 2,737.5
I/K Increase Dunwoodie—Shore Rd path LTE rating to ~4000 MVA.
(assumed three new 345 kV cables in parallel and three new 345/138kV transformers at Shore Rd)
1,125
E/G Increase Coopers Corner—Middletown—Rock Tavern—Dolson Ave 345 kV sections
path LTE rating to ~3000 MVA and fix Coopers Corner 345/115 kV transformer thermal overload
475
G Increase Ladentown—Ramapo 345 kV path LTE rating to ~2500 MVA 62.5
Estimated Total Base Costs with Contingency 4,400
The upgrades do not include the potential need for local transmission investments.
The total estimated capital cost of the indicative upgrades is $4.4 billion (in 2040 dollars). As before, this
cost estimate includes 50% contingency to account for the high uncertainty on future development of the
projects. The total estimated operations and maintenance (O&M) cost of the upgrades, assuming 2.5% of
the capital cost, is $110 million.
These indicative upgrades are subject to the same caveats indicated in section 6.6.2 and the summary is
as follows:
• The transmission upgrades and cost estimates are indicative of the need to move energy across the congested interfaces and BPS transmission facilities in the State and need to further researched to verify need and define the most effective way to achieve the transmission capacity increase and costs.
• Additional factors such as right-of-way, real estate costs, environmental permitting, and constructability are not a part of this assessment and could affect the feasibility and cost estimates. Additional research is needed.
• Alternative designs to the indicative upgrades should be pursued to address the transmission limitations not factored at this stage.
Adjusted Production Costs and Benefit to Cost Ratio
As for the Initial Scenario, benefit to cost (B/C) shows the economic viability of the indicative upgrade
projects. With the upgrades, APC decreases from $5,343 million to $1,477 million in 2040, resulting in a
App. E to Initial Report on Power Grid Study

E-73
savings of $3,866 million. Assuming a Cost Recovery Factor of 8%, and a 2.5% O&M cost adder to
annualize the total transmission costs, the indicative B/C Ratio is 10.7, much higher than the corresponding
values of 3.0 in the Initial Scenario Base Case.
Equation 3. High Demand Scenario Adjusted Production Costs Benefit Cost Ratio
𝐵𝑒𝑛𝑒𝑓𝑖𝑡(𝑂𝑛𝑒 − 𝑌𝑒𝑎𝑟 𝐴𝑃𝐶 𝑆𝑎𝑣𝑖𝑛𝑔)
𝐶𝑜𝑠𝑡 (𝐴𝑛𝑛𝑢𝑎𝑙𝑖𝑧𝑒𝑑 𝐶𝑜𝑠𝑡)=
$3,866
$4,400 × 8% × 102.5%= 10.7
As with the Initial Scenario, the one-year APC and B/C analysis is intended for screening purposes and
indicates that the upgrades are economically justifiable.
7.8 2040 Iteration Buildout Results—High Demand Scenario
The LTCE was updated with new transfer capability and transmission cost information to determine if the
LTCE program would significantly change the buildout because of the transmission updates based on the
Initial Buildout (the Iteration LTCE). The analysis results are provided to confirm that all the transmission
upgrades recommended and modeled are still applicable.
The resulting iteration buildout had a slight reduction of the total renewable capacity by 2040 (2.7%),
mainly in solar (1,886 MW or 7.7%). There was an increase in land-based wind generation by 591 MW
(4.9%), while offshore wind remained largely unchanged (51 MW or 0.4%). Energy storage decreased for
1,721 MW (10.4%). The overall total curtailment went down by about 1% as a result of the
capacity changes.
2040 Iteration Base Results
As with the Initial Scenario, the 2040 LTCE Iteration Buildout was modeled in the PROMOD program
without new transmission creating the iteration base case.
For the 2040 Iteration Base, the State is found to be effectively in balance with respect of imports / exports
of energy.
2040 Iteration Base Congestion and Curtailment
Curtailment compared to the 2040 Iteration Base shows a drop from 3.4% to 2.5%. Similar to the initial
buildout analyses, land-based wind leads curtailment at 5%.
The major congested elements are provided in the Table 7-14. It should be noted that the congested elements
are the same as in the 2040 Base Case, albeit with lower congestion costs (see Table 7-10).
App. E to Initial Report on Power Grid Study

E-74
Table 7-14. High Demand Scenario—2040 Iteration Base Constraints and Costs
Constraints Congestion
Cost (k$)
Congested Hours
DUNWOODIE to SHORE RD FLO SPRIANBROOK CABLE* (7,662,762) 3189 I:NY_MILLWOOD-SOUTH FLO BASE CASE* (3,528,996) 1920 DUNWOODIE to SHORE RD FLO BASE CASE* (3,070,917) 2558 Fraser 345/115 kV Transformer FLO BASE CASE (347,542) 1711 I:NY_NYC-LI FLO BASE CASE (293,172) 4155 Cooper Corner to Middletown Tap 345 kV FLO Rock Tavern to Dolson Ave 345KV* (275,761) 1580
New Scotland 345/115 kV Transformer FLO BASE CASE (196,983) 533 E13ST 46 to FARRAGUT WES1 FLO BASE CASE (187,579) 2905 I:NY INTERFACE NY-ON FLO BASE CASE (183,151) 4332 GOTHLS to GOTHLS R 1 FLO BASE CASE (113,146) 4059 LOVETT345 ST to E13ST 46 1 FLO BASE CASE (98,132) 197 N.WAV115 to E.SAYRE 1 FLO BASE CASE (97,362) 2795 LADENTWN to RAMAPO 1 FLO BASE CASE* (92,067) 421 I:NY_PJM EAST-NY G FLO BASE CASE (83,482) 2685 SPRAINBROOK to DUN NO S6 6 FLO BASE CASE (77,086) 3697 I:NERC7002 WEST CENTR FLO BASE CASE (76,183) 1291 SPRAINBROOK to ACADEMY 1 FLO BASE CASE (72,369) 2447 ESTSTO to 5MILE 345kV 1 FLO BASE CASE (61,176) 2652 RAMAPO 5 to HOPATCONG 1 FLO BASE CASE (44,563) 2584 SPRAINBROOK to TREMONT 1 FLO BASE CASE (43,356) 3234 PACKARD2 to NIAGAR2W 2 FLO NIAGARA PA (39,006) 432 I:NERC7005 TOTAL EAST FLO BASE CASE (26,218) 101 Cooper Corner 345/115 kV Transformer FLO BASE CASE* (24,132) 1079
*Transmission Reinforcements connection
The total zonal congestion costs for New York State are $13.8 billion, which is a reduction from the total
congestion costs in the 2040 Initial Buildout Base Case ($23.1 billion).
7.9 2040 Iteration Upgrade Results—High Demand Scenario
The implementation of the upgrades resulted in lower curtailment (2.5% in the base case versus 0.8% in
the upgrade case). LBW is curtailed about 0.9%. The largest beneficial impact of the transmission
reinforcements can be appreciated in the congestion levels. The Table 7-15 shows the most congested
interfaces experience a large reduction.
App. E to Initial Report on Power Grid Study

E-75
Table 7-15. High Demand Scenario—2040 Iteration Base, Upgrade, and % Reduction
Constraints Base
Congestion Cost (k$)
Upgrade Congestion
Cost (k$) Congested
Hours %
Reduction
I:NY_MILLWOOD-SOUTH FLO BASE CASE* (3,528,996) (721,195) 401 80%
ESTSTO to 5MILE 345kV 1 FLO BASE CASE (61,176) (30,949) 1,838 49%
I:NY_NYC-LI FLO BASE CASE (293,172) (4,110) 3,269 99%
SPRAINBROOK to DUN NO S6 6 FLO BASE CASE (77,086) (2,519) 1,417 97%
SPRAINBROOK to ACADEMY 1 FLO BASE CASE (72,369) (1,443) 1,415 98%
SPRAINBROOK to TREMONT 1 FLO BASE CASE (43,356) (1,414) 1,432 97%
PACKARD2 to NIAGAR2W 2 FLO NIAGARA PA (39,006) (1,012) 40 97% DUNWOODIE to SHORE RD FLO SPRIANBROOK CABLE* (7,662,762) - - 100%
DUNWOODIE to SHORE RD FLO BASE CASE* (3,070,917) - - 100% Cooper Corner to Middletown Tap 345 kV FLO Rock Tavern to Dolson Ave 345KV* (275,761) - - 100%
LADENTWN to RAMAPO 1 FLO BASE CASE* (92,067) - - 100% Cooper Corner 345/115 kV Transformer FLO BASE CASE* (24,132) - - 100%
*These transmission elements are associated with transmission reinforcements
The total zonal congestion costs for New York State were $1.48 billion, which is a significant reduction
from the iteration base ($13.8 billion).
Adjusted Production Costs Savings and Benefit to Cost Ratio
With the upgrades, the APC decreases from $3,495 million to $967 million in 2040, resulting in a savings of
$2,528 million. Assuming a Cost Recovery Factor of 8%, and a 2.5% O&M cost adder to annualize the
total transmission costs, the indicative B/C Ratio is 7.0, which confirms that the indicative upgrades are
cost-effective.
Equation 4. Adjusted Production Costs Benefit to Cost Ratio
𝐵𝑒𝑛𝑒𝑓𝑖𝑡(𝑂𝑛𝑒 − 𝑌𝑒𝑎𝑟 𝐴𝑃𝐶 𝑆𝑎𝑣𝑖𝑛𝑔)
𝐶𝑜𝑠𝑡 (𝐴𝑛𝑛𝑢𝑎𝑙𝑖𝑧𝑒𝑑 𝐶𝑜𝑠𝑡)=
$2,528
$4,400 × 8% × 102.5%= 7.0
As was noted with the Initial Scenario, the iteration buildout partially addresses congestion by the selection
and location of the new resources and relies less on transmission. This results in a lower B/C ratio than in
the initial buildout case; however, the indicative B/C ratios are well over one pointing to the economic
desirability of the indicative projects.
App. E to Initial Report on Power Grid Study

E-76
7.10 Findings and Observations—High Demand Scenario
Based on the analysis performed in the initial and iteration cases for the High Demand Scenario, the
indicative transmission upgrades make a substantial contribution to the economics of the system. In general,
the iteration buildout shows better results and is thus considered the final LTCE.
As in the Initial Scenario, the identified transmission reinforcements yield benefits after 2030 and are
included in the 2040 results as they were observed to be effective in addressing congestion and curtailment.
The economic benefits of these upgrades appear to exceed their costs under all conditions assessed.
Additional research should address uncertainties on the generation buildout and its location, load growth
uncertainty, and optimization of the design and cost of these projects. There is time to conduct this research
as no action is immediately necessary.
In the iterative modeling process, the transmission reinforcements identified potentiated improvement in
congestion and curtailment. All identified reinforcements were preserved in the course of the iterative
modeling process for this reason.
In the short term, by 2030, the addition of the Western NY (Empire State line), AC Transmission PPTN,
Northern NY project and NYC Tx projects support achievement of the 70% renewable goal with low levels
of bulk system curtailment (0.01%) and congestion. No additional BPS (230 kV and above) investments
appear to be necessary.
Significant additional upgrades are likely necessary at the local 115 kV and 138 kV levels both by 2030
and 2040. The interconnection of offshore wind development must be assessed, which would be carried out
on a parallel project.
The total RNG consumption reduced from 13,943 GWh in the 2040 Base Case to 4,961 GWh in the 2040
iteration upgrade case of the High Demand Scenario.
App. E to Initial Report on Power Grid Study

E-77
Electric Grid Analysis—Findings Based on the analysis carried out in the study, New York State should be able to achieve its 70 x 30 and
zero-emission generation by 2040 goals under both the Initial Scenario and the High Demand Scenario
using a mix of distributed energy, energy efficiency measures, energy storage, planned transmission
projects, utility-scale renewables, and zero-emission resources. The most significant difference in these
scenarios was the amount of renewable generation added and the scope (transmission capacity increases)
of the transmission projects required to manage congestion and reduce costs.
Additional energy storage would store excess solar and wind energy so that this energy may be utilized
during peak hours. Additional energy storage will contribute to the maintenance of locational planning
reserve margins.
The construction of the New York Public Policy transmission projects supports achievement of the 70%
renewable goal by 2030 with low levels of bulk system curtailment and congestion. Thus, no additional
bulk transmission projects (230 kV and above) were identified by 2030 under either of the scenarios
considered. However, more detailed analysis of offshore wind integration into the downstate grid is
required, and significant transmission upgrades are expected at the local transmission and sub-transmission
level.
By 2040, high levels of uneconomic congestion and some curtailment are expected with generation
additions supporting the goal of zero emissions. For the Initial Scenario, the models forecasted that there
should be a modest level of statewide curtailment (1.5%) with land-based wind experiencing the highest
levels of curtailment (4.5%), particularly in Central New York (8.7%). The High Demand Scenario had
more than double the curtailment (3.4%) with land-based wind experiencing almost double (8.7%) and,
again, in particular in Central New York (20.9%).
The uneconomic congestion and curtailment can be addressed by indicative BPS projects located
downstream of Coopers Corner into Zone GHI, at the Millwood South Interface, at the Dunwoodie to Shore
Rd cables, and in NYC and the West Long Island area. These indicative projects were found to be effective
in relieving curtailment and their economic benefits appear to exceed their costs. However, further research
is needed to assess the various forms of uncertainty including the generation buildout and its location, the
level of load growth, and the best potential designs and costs for these potential projects. There is time,
however, to conduct this research as no action is immediately necessary; the transmission upgrades were
not identified to be needed until after 2030.
App. E to Initial Report on Power Grid Study

E-78
Annex A. Assumption Details Load Forecast
The Initial Scenario load forecast was based on High Technology Availability Pathway taken from the
report Pathways to Deep Decarbonization in New York State published by Energy + Environmental
Economics (E3) Consulting. This forecast was also used for the Clean Energy Standard Cost Study. The
High Demand Scenario load forecast was based on the forecast from the Limited Non-Energy Scenario
from the report Pathways to Deep Decarbonization in New York State.
Figure A- 1. 2030 Hourly Peak Day Demand—Winter and Summer—Initial Scenario
Figure A- 2. 2040 Hourly Winter Peak Day Demand—Initial Scenario
10
15
20
25
30
35
40
45
12
:00
AM
1:0
0 A
M
2:0
0 A
M
3:0
0 A
M
4:0
0 A
M
5:0
0 A
M
6:0
0 A
M
7:0
0 A
M
8:0
0 A
M
9:0
0 A
M
10
:00
AM
11
:00
AM
12
:00
PM
1:0
0 P
M
2:0
0 P
M
3:0
0 P
M
4:0
0 P
M
5:0
0 P
M
6:0
0 P
M
7:0
0 P
M
8:0
0 P
M
9:0
0 P
M
10
:00
PM
11
:00
PM
2030 Summer Peak Day 2030 Winter Peak Day
2030 DG Solar Adj Summer Peak Day 2030 DG Solar Adj Winter Peak Day(GW)
10
15
20
25
30
35
40
45
12
:00
AM
1:0
0 A
M
2:0
0 A
M
3:0
0 A
M
4:0
0 A
M
5:0
0 A
M
6:0
0 A
M
7:0
0 A
M
8:0
0 A
M
9:0
0 A
M
10
:00
AM
11
:00
AM
12
:00
PM
1:0
0 P
M
2:0
0 P
M
3:0
0 P
M
4:0
0 P
M
5:0
0 P
M
6:0
0 P
M
7:0
0 P
M
8:0
0 P
M
9:0
0 P
M
10
:00
PM
11
:00
PM
2040 Winter Peak Day 2040 Peak Summer Day(GW)
App. E to Initial Report on Power Grid Study

E-79
Figure A- 3. 2040 Hourly Summer Peak Day Demand—Initial Scenario
CLCPA Milestone Targets
Seventy Percent Renewable Generation by 2030
To achieve 70% renewable generation by 2030, it was assumed that a diverse set of renewable energy could
meet the interim target. The resources that could contribute to the interim target were distributed solar, grid
solar, land-based wind, offshore wind, and hydroelectricity (Canadian and New York). This study also
assumed 40% of landfill gas and biomass generation could help achieve the 70% renewable generation
target, and zero-emission generation by 2040.
To achieve zero-emission generation by 2040, it was assumed that a diverse set of zero-emission
technologies could meet the 2040 target. The power generation technologies that were considered zero-
emission were distributed solar, grid solar, on shore wind, offshore wind, and hydroelectricity (Canadian
and New York), nuclear, thermal generators consuming biomass, landfill gas, and renewable natural gas.
2020-2023 Supply Mix and Announced Builds and Retirements
The existing capacity mix and near-term build and retirement assumptions were sourced from several public
resources that included NYISO Goldbook, NYISO Interconnection Queue, NYSERDA Clean Energy
Standard Tier 1 Procurement Program, EIA-860 data, market announcements. It was assumed that these
resources provided reliable new build and retirement information through 2023, after which, the study relied
on using the Long-Term Capacity Expansion logic contained in the power dispatch model.
10
15
20
25
30
35
40
45
12
:00
AM
1:0
0 A
M
2:0
0 A
M
3:0
0 A
M
4:0
0 A
M
5:0
0 A
M
6:0
0 A
M
7:0
0 A
M
8:0
0 A
M
9:0
0 A
M
10
:00
AM
11
:00
AM
12
:00
PM
1:0
0 P
M
2:0
0 P
M
3:0
0 P
M
4:0
0 P
M
5:0
0 P
M
6:0
0 P
M
7:0
0 P
M
8:0
0 P
M
9:0
0 P
M
10
:00
PM
11
:00
PM
2040 Peak Winter Day - DG Solar Adj. 2040 Peak Summer Day - DG Solar Adj.(GW)
App. E to Initial Report on Power Grid Study

E-80
Distributed Generation Solar
The distributed generation solar forecast was derived from the 2019 Goldbook estimate of DG solar by NY
Zone. First, total 2019 DG solar for NY was escalated to 6,000 MW (DC) in 2025 and then increased 1.9%
per year through 2040. Each year’s zonal DG solar estimates were based on the 2019 weights of the total
DG solar estimate. The forecast was derived in DC megawatts and then estimated in AC megawatts for
modeling purposes.
The hourly dispatch of DG Solar is based on 2017 production curves adopted from NYSERDA’s
Distributed Energy Resources Performance Data.24
Legacy Hydro Generation
Legacy Canadian hydroelectricity is dispatched using monthly production shapes that are based on the
average 2017–2019 historical electricity export sales data from Quebec and Ontario to New York State.
Source is the export sales data from Canada’s Energy Regulator.25
NYC Tx
NYC Tx is a 1,250 MW one-way line that connects Quebec to NYC and it is assumed to transfer 10,000
GWh per year, which equates to 91.3% capacity factor. NYC Tx is dispatched at a constant capacity factor
of 91.3% throughout the study.
When there is excess energy generated from NYC Tx and offshore wind that can be used to meet energy
demand, NYC Tx will back down before offshore wind.
Natural Gas, Renewable Natural Gas, and Carbon Sequestration
Internal forecast of delivered natural gas prices uses ICE Futures for Henry Hub and gas basis through 2024
and then blends AEO High Gas Resource Case with monthly ICE futures applied 2030 and beyond. This
approach creates more monthly variation to delivered prices.
In 2040, the only gas available to gas-fired resources is renewable natural gas (RNG), which is limited to
32TBtu and costs $23/MMBTU (in 2018 dollars).
24 Visit https://der.nyserda.ny.gov/ for NYSERDA Distributed Energy Resources guide. 25 Canada Energy Regulator Commodity Statistics tool can be accessed at https://apps.cer-
rec.gc.ca/CommodityStatistics/Statistics.aspx?language=english on their site.
App. E to Initial Report on Power Grid Study

E-81
Figure A- 4. Natural Gas Price Forecast
In metric million British thermal units and 2018 dollars.
For carbon capture and sequestration, it has not been determined under the CLCPA if it will be considered
a zero-emission option, so to be conservative, this analysis did not include that technology option.
Emission Prices—RGGI
RGGI CO2 price outlook increases gradually reaching $10/ton CO2 by 2028 and increasing 7% annually
thereafter. 2040 RGGI prices are projected at ~$22/CO2-ton ($2018).
Siemens uses NYISO CARIS through 2028, and then increases by 7% annually thereafter reflecting the
growth rate in the CARIS forecast. An emissions cap was not modeled.
$1
$2
$3
$4
$5
2018
2019
2020
2021
2022
2023
2024
2025
2026
2027
2028
2029
2030
2031
2032
2033
2034
2035
2036
2037
2038
2039
2040
Henry Hub NY City Gate West NY2018 $/MMBtu
App. E to Initial Report on Power Grid Study

E-82
Figure A- 5. RGGI CO2 Allowance Trajectory
In 2018 dollars per short ton.
Locational Planning Reserve Margins
The installed reserve margin assumptions are sourced from NYISO’s Locational Minimum Installed
Capacity Requirement Study for the 2020–2021 Capability Year.26
Reserve margins and locational capacity requirements were assumed constant throughout the
study period.
Based on the NYSRC IRM base case for the 2020–2021 capability year and the changes identified above,
the NYISO’s calculations result in a New York City LCR of 86.6%, a Long Island LCR of 103.4%, and a
G-J Locality LCR of 90.0%.
Table A- 1. NYISO Locational Capacity Requirement by Location
The following table shows the breakdown of capacity requirements by location.
IRM J LCR K LCR G-J LCR 18.9% 86.6% 103.4% 90.0%
26 Locational Minimum Installed Capaciyt Requirements Study NYISO can be found at https://www.nyiso.com/documents/20142/8583126/LCR2020-Report.pdf/4c9309b2-b13e-9b99-606a-7af426d93a47 online.
$6.64$7.43
$8.69
$9.73$10.88
$0
$5
$10
$15
$20
$25
2019 2020 2021 2022 2023 2024 2025 2026 2027 2028 2029 2030 2031 2032 2033 2034 2035 2036 2037 2038 2039 2040
Siemens RGGI Price Outlook
NYSERDA Program Review RGGI CO2 Price
(2018$/Short Ton)
App. E to Initial Report on Power Grid Study

E-83
These assumptions were used throughout the study since future installed reserve margin (IRM) and installed
capacity (ICAP) and unforced capacity (UCAP) conversion ratings are challenging to predict for the future.
In addition, the summer 2020 ICAP/UCAP translation factors were adopted throughout the study.
Effective Load Carrying Capability (ELCC)
The Effective Load Carrying Capability (ELCC) for utility solar, land-based wind, and offshore wind are
calculated using AURORA’s Dynamic Peak Credit feature. AURORA calculates the average contribution
of a resource to the net peak load. Net peak load is defined as when the energy demand is highest after
netting out generation from distributed solar, solar, wind, and offshore wind.
Net load = Baseline Demand – DG solar – Solar – Wind
For this study, AURORA used the 50 highest net peak load hours per year to analyze average contributions
to peak demand. Net peak load will shift as New York State adds more renewables. Therefore, the ELCC
of renewable capacity changes over time. Solar’s ELCC decreases rapidly as the net peak shifts to the
evening when solar production is low.
Net peak load will shift as the State adds more renewables. Therefore, the ELCC of renewable capacity
changes over time. Solar’s ELCC decreases rapidly as the net peak shifts to the evening when solar
production is low. To reduce volatility in energy storage ELCC over study horizon, the study applied
NYISO’s current peak capacity credit factors through 2040 (2-hr 37.5%; 4-hr 75%; 6-hr 90%)
App. E to Initial Report on Power Grid Study

E-84
Figure A- 6. ICAP Supplier Payment Structure
This graphic shows the NYISO proposed capacity values.27
27 Visit https://www.nyiso.com/documents/20142/5375692/Expanding%20Capacity%20Eligibility%20030719.pdf/19c4ea0d-4827-2e7e-3c32-cf7e36e6e34a to access NYISO Expanding Capacity Eligibility.
App. E to Initial Report on Power Grid Study

E-85
Energy Transfer Limits
Figure A- 7. Topology for 2020 Reliability Needs Assessment: Study Years 2024 to 2030
Our assumptions focused on 230 kV and above kV levels. These levels are complemented with limited 115
kV lines that perform a similar long-distance transmission function in the study. Load-flow analysis and
PROMOD congestion studies were centered on the identification of constraints affecting the evacuation of
power from production areas and delivery to load centers (hence, the facilities considered and voltage
levels). Local constraints associated with the interconnection of the generations were not addressed as this
is heavily dependent on the actual location of the resources and their timing. This would be addressed by
the local planning process.
Renewable Build Costs and Production Profiles
Renewable generation build costs were sourced from the Clean Energy Standard cost study. There are
annual statewide limits on the amount of clean energy that can be built by technology. The limitations are
as follows:
App. E to Initial Report on Power Grid Study

E-86
• Grid solar: 2,000 MW through 2030 and increases 100 MW annually, reaching a max limit of 3,000 MW in 2040.
• Land-based wind: 2,000 MW per year. • Energy storage: 2,500 MW per year.
The goal of the modeling exercise is to achieve 100% zero-emission generation by 2040. Technically, it is
possible for the model to build/retire all the necessary capacity in 2039 to meet the 100 x 40 target. To
achieve a realistic buildout and retirement plan, annual build limitations were adopted to mimic real-world
construction capabilities.
Location specific land-based wind, offshore wind, and solar resource data were developed from the NREL
Wind Toolkit and National Solar Radiance database for a 2009 meteorological year and adjusted for a mean
capacity factor (found from analyzing 2007–2013 data). The State team deemed 2009 as a representative
year. NYISO also selected to use 2009 profiles from NREL for its 70 x 30 CARIS analysis.
For storage, two-hour, four-hour and six-hour battery storage capacities were considered with the costs
indicated in the table below.
Table A- 2. Energy Storage Overnight Capital Costs
Shown in kilowatts and 2018 dollars.
Year 2 Hr. 4 Hr. 6 Hr.
2020 972 1,426 2,020
2021 875 1,269 1,798
2022 795 1,144 1,620
2023 729 1,042 1,477
2024 676 960 1,360
2025 632 894 1,266
2026 596 841 1,191
2027 568 799 1,132
2028 546 767 1,087
2029 529 744 1,054
2030 514 722 1,022
2031 503 707 1,002
2032 493 693 982
2033 483 679 962
2034 474 666 943
2035 464 652 924
2036 455 639 906
2037 446 627 888
2038 437 614 870
App. E to Initial Report on Power Grid Study

E-87
Year 2 Hr. 4 Hr. 6 Hr.
2039 428 602 852
2040 424 596 844
A 1.25x cost multiplier was applied to new energy storage resources in NYC Zone J and a 1.10 X cost
multiplier was applied to new energy storage resources in Long Island Zone K. The storage overnight
capital costs were based on the costs used for the New York State Storage Roadmap.28
Neighboring Renewable Energy Standards and Offshore Wind Targets
The RES and offshore wind targets for neighboring regions are based off initiations as of November 2019.
The RES targets for surrounding areas are as follows:
Vermont: 75% by 2032 New Hampshire: 24.8% by 2025 Maine: 100% by 2050 Massachusetts: 35% by 2030 Rhode Island: 38.5% 2035 Connecticut: 48% 2030 New Jersey: 50% by 2030 Pennsylvania: 18% 2021
Delaware: 25% 2026 Maryland: 50% by 2030 District of Colombia: 100% 2032 Virginia:15% 2025 West Virginia: 25% 2025 North Carolina: 12.5% 2021 Ohio: 12.5% 2026
Offshore wind capacity development initiatives for surrounding regions:
Connecticut: 2,000 MW by 2030 Maryland: 1,200 MW by 2030 Massachusetts: 1,600 MW by 2027 and 3,200 by 2035 New Jersey: 3,500 MW by 2030 and 7,500 MW by 2035 Virginia: 2,500 MW by 2026 and 5,200 MW by 2034
28 Visit https://www.nyserda.ny.gov/All-Programs/Programs/Energy-Storage to learn more about NYSERDA Energy Storage Programs.
App. E to Initial Report on Power Grid Study

E-88
Initial Scenario Supplementary Tables
The table below shows the Initial Scenario Original LTCE, that was provided to PROMOD for the
assessment of transmission needs. That is the buildout before transmission costs and increased transmission
capacity were taken into consideration.
Table A- 3. Original Long-Term Capacity Expansion Buildout—Initial Scenario
Shown in megawatts.
2025 2030 2035 2040
Thermal 25,030 24,690 24,877 19,777
Nuclear 3,381 3,381 3,381 3,381
Hydro 4,663 4,663 4,663 4,663
Onshore Wind 3,932 6,437 7,101 12,620
Offshore Wind 1,826 6,000 9,000 10,307
Solar 3,099 4,133 6,753 17,624
Energy Storage 1,542 3,000 3,263 13,479
Biomass 80 80 80 24
Other Renew 392 392 392 392
NYC Tx 1,250 1,250 1,250 1,250
DG Solar (AC) 4,839 5,323 5,856 6,443
Table 4-1 provided the Initial Scenario Final LTCE at the state level, to complement this information the
table below provides this information by NYISO Zone.
App. E to Initial Report on Power Grid Study

E-89
Table A- 4. Final Zonal Long-Term Capacity Expansion Buildout—Initial Scenario
2025 2030 2035 2040
Solar 3,099 3,808 6,426 16,759
Wind 3,932 6,230 6,736 12,804
Offshore Wind 1,826 6,000 9,000 9,837
Energy Storage 1,542 3,000 5,154 15,515
Thermal 24,447 23,458 24,113 17,269
Solar 649 649 649 796
Wind 1,094 1,094 1,094 2,690
Offshore Wind - - - -
Energy Storage 31 331 331 331
Solar 41 41 41 202
Wind 21 121 121 226
Offshore Wind - - - -
Energy Storage 31 31 31 31
Solar 831 909 1,082 2,341
Wind 1,278 1,384 1,384 1,521
Offshore Wind - - - -
Energy Storage 41 41 41 41
Solar 26 26 246 675
Wind 678 678 678 810
Offshore Wind - - - -
Energy Storage 31 79 79 79
Solar 618 1,104 2,191 5,640
Wind 757 1,765 2,271 3,321
Offshore Wind - - - -
Energy Storage 41 341 341 2,326
Solar 540 685 1,429 5,135
Wind 96 1,178 1,178 2,188
Offshore Wind - - - -
Energy Storage 61 144 1,644 2,644
Solar 257 257 652 1,355
Wind 10 10 10 2,048
Offshore Wind - - - -
Energy Storage 257 344 344 2,769
Solar 25 25 25 32
Wind - - - -
Offshore Wind 978 3,952 6,000 6,000
Energy Storage 879 879 1,183 4,167
Solar 112 112 112 582
Wind - - - -
Offshore Wind 848 2,048 3,000 3,837
Energy Storage 170 810 1,160 3,127
2040 Non
Thermal
Sub-Total
Zone A 3,817
Zone B 460
Zone K 7,546
54,915
Zone F 9,967
Zone GHI 6,173
Zone J 10,198
Zone C 3,903
Zone D 1,564
Zone E 11,288
NYISO
App. E to Initial Report on Power Grid Study

E-90
High Demand Scenario Supplementary Tables
The table below shows the High Demand Scenario Original LTCE that was provided to PROMOD for the
assessment of transmission needs. As before, this is the buildout before transmission costs and increased
transmission capacity were taken into consideration.
Table A- 5. Original Long-Term Capacity Expansion Buildout—High Demand Scenario
Shown in megawatts.
2025 2030 2035 2040
Thermal 25,641 27,576 29,047 23,052
Nuclear 3,381 3,381 3,381 3,381
Hydro 4,663 4,663 4,663 4,663
Onshore Wind 3,932 6,437 7,101 12,620
Offshore Wind 1,826 6,000 9,000 10,307
Solar 3,099 4,133 6,753 17,624
Energy Storage 1,542 3,000 3,263 13,479
Biomass 80 80 80 24
Other Renew 392 392 392 392
NYC Tx 1,250 1,250 1,250 1,250
DG Solar (AC) 4,839 5,323 5,856 6,443
Table 7-3 provided the High Demand Scenario Final LTCE at the State level. To complement this
information, the table below provides this information by NYISO Zone.
App. E to Initial Report on Power Grid Study

E-91
Table A- 6. Final Zonal Long-Term Capacity Expansion Buildout—High Demand Scenario
E. (end of appendix)
2025 2030 2035 2040
Solar 3,099 5,707 11,577 22,577
Wind 4,027 7,357 9,194 12,690
Offshore Wind 1,826 6,000 9,000 13,597
Energy Storage 1,542 3,000 4,213 14,891
Thermal 25,730 28,231 28,758 22,954
Solar 649 649 649 1,546
Wind 1,188 1,188 1,243 2,925
Offshore Wind - - - -
Energy Storage 31 31 36 825
Solar 41 41 50 748
Wind 21 21 21 21
Offshore Wind - - - -
Energy Storage 31 31 31 31
Solar 831 1,004 2,370 4,432
Wind 1,278 1,278 1,278 1,278
Offshore Wind - - - -
Energy Storage 41 81 606 606
Solar 26 26 26 1,219
Wind 678 678 678 1,020
Offshore Wind - - - -
Energy Storage 31 31 31 480
Solar 618 1,884 4,855 7,060
Wind 757 1,495 2,043 2,594
Offshore Wind - - - -
Energy Storage 41 341 341 341
Solar 540 1,185 2,435 5,603
Wind 96 2,118 2,687 2,804
Offshore Wind - - - -
Energy Storage 61 61 104 104
Solar 257 781 1,056 1,355
Wind 10 579 1,245 2,048
Offshore Wind - - - -
Energy Storage 257 257 257 2,633
Solar 25 25 25 32
Wind - - - -
Offshore Wind 978 3,952 6,000 8,120
Energy Storage 879 879 1,269 6,059
Solar 112 112 112 582
Wind - - - -
Offshore Wind 848 2,048 3,000 5,478
Energy Storage 170 1,288 1,538 3,812
Zone GHI 6,036
Zone J 14,210
Zone K 9,871
6,316
Zone D 2,719
Zone E 9,995
Zone F 8,512
2040 Non
Thermal
Sub-Total
NYISO 63,755
Zone A 5,297
Zone B 799
Zone C
App. E to Initial Report on Power Grid Study

E-92
App. E to Initial Report on Power Grid Study